Abstract
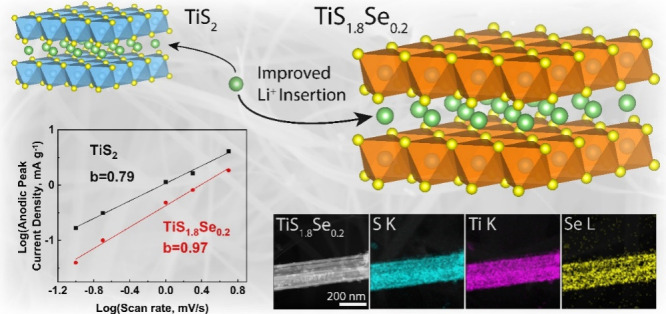
Improving charge insertion into intercalation hosts is essential for crucial energy and memory technologies. The layered material TiS2 provides a promising template for study, but further development of this compound demands improvement to its ion kinetics. Here, we report the incorporation of Se atoms into TiS2 nanobelts to address barriers related to sluggish ion motion in the material. TiS1.8Se0.2 nanobelts are synthesized through a solid-state method, and structural and electrochemical characterizations reveal that solid solutions based on TiS1.8Se0.2 nanobelts display increased interlayer spacing and electrical conductivity compared to pure TiS2 nanobelts. Cyclic voltammetry and electrochemical impedance spectroscopy indicate that the capacitive behavior of the TiS2 electrode is improved upon Se incorporation, particularly at low depths of discharge in the materials. The presence of Se in the structure can be directly related to an increased pseudocapacitive contribution to electrode behavior at a low Li+ content in the material and thus to improved ion kinetics in the TiS1.8Se0.2 nanobelts.
Keywords: Li+ intercalation, transition metal chalcogenide, titanium sulfide, ion kinetics, pseudocapacitance, charge transport
Introduction
Intercalation chemistry involving ion insertion into a host lattice has been a key developer of essential as well as emerging technologies such as energy storage,1 neuromorphic computing,2 water desalination,3 and selective ion extraction.4 Development in these areas hinges on one fundamental challenge: facilitating ion transport through a host material. Electrochemical ion intercalation into a solid-state material involves several distinct kinetic steps, including ion motion through an electrolyte, ion transfer across a solid-electrolyte interphase (SEI), and ion diffusion through the solid host material itself. In some cases (e.g., MoS2,2 LiCoO25), structural and morphological phase transformation of the solid-state host upon ion intercalation presents another kinetic limitation. Though ion transport has also been studied in tunnel structures (NASICON-type)6 and polymer chains (poly(ethylene oxide) LiAsF6),7 layered van der Waals (vdW) metal chalcogenides stand out as a promising class of materials for reversible ion insertion. One of the chief advantages of vdW solids is that the interlayer distance can easily be altered upon ion intercalation/deintercalation; since vdW layers are not covalently bound, such materials tend to be well suited for ion kinetic studies.
Titanium disulfide (TiS2) is an attractive candidate for the further development of layered vdW transition metal chalcogenides. TiS2 crystallizes in a CdI2-type hexagonal lattice; this structure is typified by individual TiS2 octahedra propagating in an infinite 2D plane, while successive planes are held together purely by vdW forces. Such a layered structure allows TiS2 to be readily exfoliated and makes it a robust intercalation compound. Given the nature of TiS2 as an archetypal vdW solid, it became a pioneering material in the development of now-ubiquitous Li+-intercalation-based rechargeable batteries.1 While past interest in TiS2 has certainly been framed in the realm of energy storage, other applications for this material exist. Reports indicate the study of TiS2 as an active component in such diverse realms as thermoelectrics,8−10 hydrogen storage,11,12 optical limiting,13 and photoacoustic imaging devices.14
Insertion kinetics of TiS2 are most conveniently studied with Li+ intercalation. The Li+ ion’s small size (76 pm)15 lends itself well to the study of ion kinetics, as it minimizes structural perturbations that come with the insertion of larger or multivalent ions.16,17 Indeed, Li+ intercalation remains at the forefront of development in intercalation chemistry, demonstrated by recent efforts to determine Li+ ordering upon high degrees of lithiation.18−20 Li+ intercalation into TiS2 follows a continuous solid-solution path with no phase transformations evident with increasing Li+ content as per the following equation:
| 1 |
TiS2 exhibits a constant voltage drop associated with the lattice occupancy of Li+ (x) in LixTiS2, providing a suitable measure of Li+ content in the structure.21 The facile intercalation of Li+ into TiS2 makes it a promising template material for advancing fast ion kinetics within vdW structures.
Researchers have been refining existing synthesis techniques and developing new methods to fabricate 2D layered vdW materials that were once considered thermodynamically unstable.22−24 These advancements include better control over growth conditions, manipulation of precursor materials, and addition of extrinsic atoms/molecules to facilitate the formation of unique 2D structures with tunable optoelectronic and electrochemical properties. These synthetic developments have laid the groundwork for modifying ion kinetics in a given material by highlighting the tunable nature of material conductivity and dimensionality in vdW compounds. Electrical properties of TiS2 have been tailored with S vacancies25 as well as intrinsic (Ti)24,26 and extrinsic (Se)8 atom incorporation. Further tuning of the electrical conductivity of TiS2 arises from the intercalation of cations such as Li+,27 Cu+,28 and Ag+.29 While the tendency of TiS2 toward nonstoichiometry has complicated past analyses of its electrical properties, the current understanding of the relationship between composition and band structure allows this versatile transition metal dichalcogenide to predictably display a variety of electronic properties.
Furthermore, reducing a material’s dimensionality leads to shorter bulk diffusion lengths and has been a principal consideration of past research into ion kinetics. Methods of reducing the morphological dimensionality of TiS2 from 3D bulk to 2D/1D structures have been developed to help minimize diffusion lengths across particles and introduce other novel characteristics and functionalities. These methods include ball milling,30 exfoliation in a solvent (benzyl alcohol),31 intercalation of large molecules,32 sulfurization of TiO2 nanotubes,33 and direct synthesis from solid-state precursors to produce nanobelts.25 This prior research contends that reducing the length of the primary ion diffusion pathways in TiS2 nanobelts allows the material to display faster ion kinetics.34 A broader trend recognizing the importance of nanostructuring for improved ion kinetics is evidenced by materials such as V2O5,18,35 TiO2,36 and LiCoO2,37 which all exhibit superior performance of nanostructured electrodes with respect to the bulk counterpart.
While TiS2 is an acceptable template for fast ion kinetics, it is held back by its relatively low electrical conductivity, which can lead to a sluggish kinetic response of intercalated ions. Additionally, while its interlamellar spacing is large enough to reversibly host ions (5.69 Å), TiS2 exhibits an interlayer expansion of 9% when fully lithiated.38,39 Given that the analogous TiSe2 intercalate exhibits less than 8% expansion,39 increasing TiS2 interlayer spacing through extrinsic atom incorporation would reduce its volume expansion upon lithiation and thus mitigate a kinetic barrier to ion motion in the material.
With regard to improving the electronic and intercalation properties of TiS2, Se incorporation is a suitable option. TiSe2 displays over an order of magnitude higher electrical conductivity (6.5 × 10⁴ S m–1)40 than TiS2 (5 × 10³ S m–1),41 as well as a larger interlayer spacing (5.99 Å for TiSe2, 5.69 Å for TiS2), suggesting that Se incorporation into a TiS2 structure would impart increased lattice spacing and electrical conductivity on the TiS2–xSex solid solution. TiS2 and TiSe2 share the same crystallographic structure (hexagonal) and space group (P3̅m1), which facilitates substitution of Se atoms into the S sites in TiS2 without lattice destabilization.
Here, we report the incorporation of extrinsic atoms into 2D layered titanium sulfide nanobelts. Based on stoichiometry, titanium sulfides can crystallize as TiS3 or TiS2 structures. TiS3 crystallizes as a monoclinic structure that is composed of 1D chains of trigonal prismatic TiS6 units that are held by S–S vdW forces within the gaps. Similarly, TiS2 crystallizes as a hexagonal structure where 2D slabs of edge-shared TiS6 octahedra come together to form infinite layers perpendicular to the c-axis. Within the layers, strong covalently held TiS6 octahedra are stacked on top of each other and separated by a vdW gap.
Both TiS3 and TiS2 possess a cleavage plane parallel to the crystallographic ab plane, constraining particle growth in the c direction. However, only TiS3 possesses an additional cleavage plane parallel to the bc plane, which promotes the formation of 1D nanobelt structures in TiS3, compared to the 2D hexagonal platelets which dominate the morphology of direct TiS2 syntheses.42 While the lamellar structure of both TiS3 and TiS2 makes them ideal candidates for investigating intercalation processes where ion species can be inserted between the layers without disrupting the overall crystal structure, a platelet morphology is less suitable for fast ion intercalation.34 For this reason, we developed a method by which we fabricated TiS3 nanobelts. We then used these TiS3 nanobelts as sacrificial scaffolds that are pyrolyzed to yield TiS2 with a 1D morphology. To investigate the ion insertion properties of TiS2, Se is incorporated into the S sites, which gives us control over the electronic properties as well as the vdW gap upon the formation of the TiS1.8Se0.2 nanobelts.
Here, a solid-state synthesis of nanostructured TiS1.8Se0.2 is developed. For electrochemical and structural comparison, TiS2 nanobelts are also synthesized following a previously reported method by our group that utilizes a two-step synthesis with a TiS3 intermediate.25,43 TiS1.8Se0.2 nanobelts are formed through an analogous two-step synthesis that also leverages the monoclinic crystal structure of a TiS3–xSex intermediate. This two-step method is visualized in Figure 1. In step 1, the synthesis of TiS3–xSex (TiS3) is performed by heating elemental Ti with excess SeS2 (S) powder. Crucially, the nanobelt morphology of these intermediates is preserved during the pyrolysis step of the TiS3–xSex (TiS3) intermediate. S from the S22– dianion is driven out of the nanobelts at a high temperature, leading to the formation of TiS1.8Se0.2 (TiS2). To prevent this S from reabsorbing into the nanobelts, Ti powder is added to the ampule, separated from the nanobelt material by a glass wool plug (step 2). The synthesized TiS1.8Se0.2 nanobelts exhibit high phase purity and homogeneous Se concentration throughout the nanobelt structure.
Figure 1.
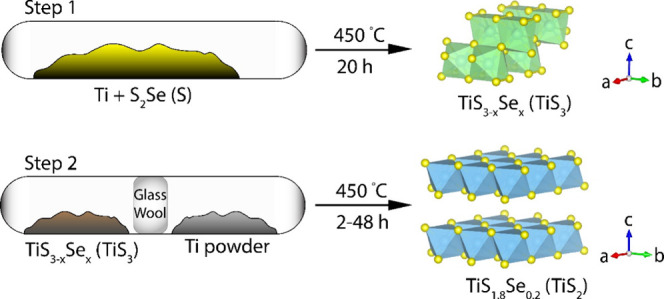
Two-step synthesis of TiS1.8Se0.2 and TiS2 nanobelts. The layered structures of the intermediate TiS3–xSex (TiS3) and TiS1.8Se0.2 (TiS2) products are depicted for clarity.
TiS2 displays an increase in the interlayer spacing and electrical conductivity upon Se incorporation. The kinetics of Li+ ion insertion are probed in TiS2 and TiS1.8Se0.2 nanobelts using rate-dependent cyclic voltammetry (CV), electrochemical impedance spectroscopy (EIS), and galvanostatic intermittent titration technique (GITT) analysis. It is found that increases in the lattice spacing and electrical conductivity imparted by the structural substitution of S by Se atoms contribute to altered ion kinetics in TiS2. Li+ ion kinetics are particularly improved at low Li+ concentrations in the material, near the open-circuit discharge voltage. Widening of the interlayer spacing of TiS2 upon Li+ insertion leads to comparable ion kinetics in both TiS2 and TiS1.8Se0.2 as Li+ occupation approaches 1 per stoichiometric host unit. This work presents a thorough investigation of the limiting factors affecting ion kinetics in an archetypal vdW solid and lays the groundwork for further implementation of TiS2 into applications such as neuromorphic computing, where ion transport plays a pivotal role.
Results and Discussion
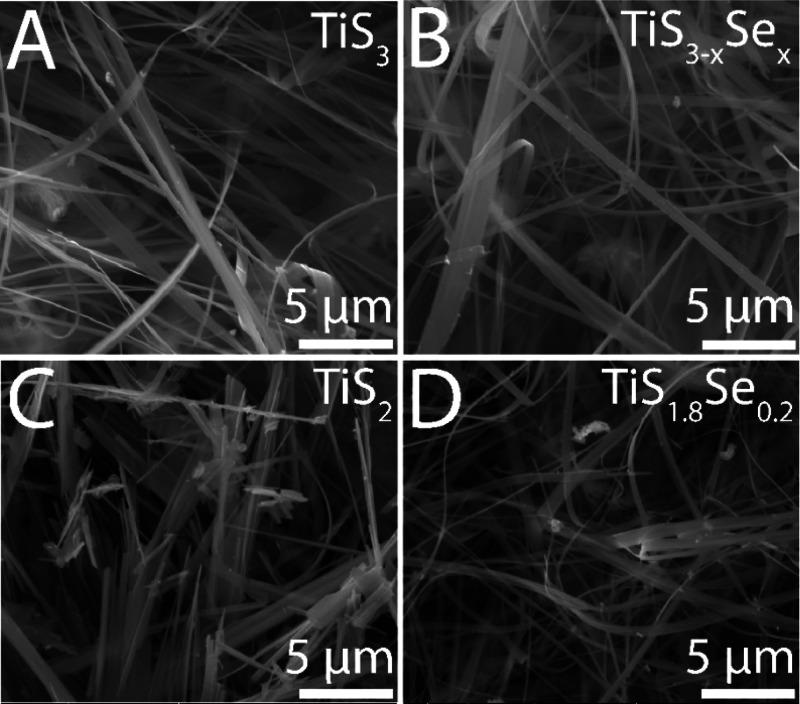
As shown in Figure 1, the fabrication of TiS2 and TiS1.8Se0.2 nanobelts involves two successive reaction steps: the formation of TiS3–xSex (TiS3) nanobelts, followed by the pyrolysis of the S22– dianion to S2–, for the formation of TiS1.8Se0.2 (TiS2). Figure 2A shows an SEM image for as-synthesized TiS3 sacrificial nanobelts. These TiS3 nanobelts have an average width of 332 ± 31 nm, while the TiS3–xSex nanobelts seen in Figure 2B have an average width of 367 ± 30 nm. Figure 2C,D depicts the SEM images of the products obtained upon the desulfurization of TiS3–xSex (TiS3) and pyrolysis into TiS1.8Se0.2 (TiS2). Upon completion of the reaction, the nanobelts continue to dominate the morphology of both products. From statistical distributions, TiS2 nanobelts have an average width of 371 ± 37 nm, while TiS1.8Se0.2 nanobelts have an average width of 357 ± 31 nm. No statistical difference in nanobelt width is observed upon desulfurization and Se incorporation. All structures demonstrate clear anisotropy, as nanobelt lengths greatly exceed the measured widths.
Figure 2.
SEM images for (A) TiS3, (B) TiS3–xSex, (C) TiS2, and (D) TiS1.8Se0.2 nanobelts.
Preserving the nanobelt morphology and dimensions following desulfurization and Se incorporation allowed us to independently investigate extrinsic atom effects on the ion insertion properties of TiS1.8Se0.2 without finite size contributions (vide infra). To confirm the uniform incorporation of Se into the TiS2 lattice, high-resolution energy dispersive X-ray spectroscopy (EDS) was performed on a single nanobelt of TiS1.8Se0.2 (Figure 3). EDS analysis indicates a homogeneous composition of Ti, S, and Se in the TiS1.8Se0.2 nanobelts. Compositional estimates from EDS provide evidence of a stoichiometry of TiS1.8Se0.2.
Figure 3.
EDS elemental distribution maps of S, Ti, and Se along the length of a TiS1.8Se0.2 nanobelt.
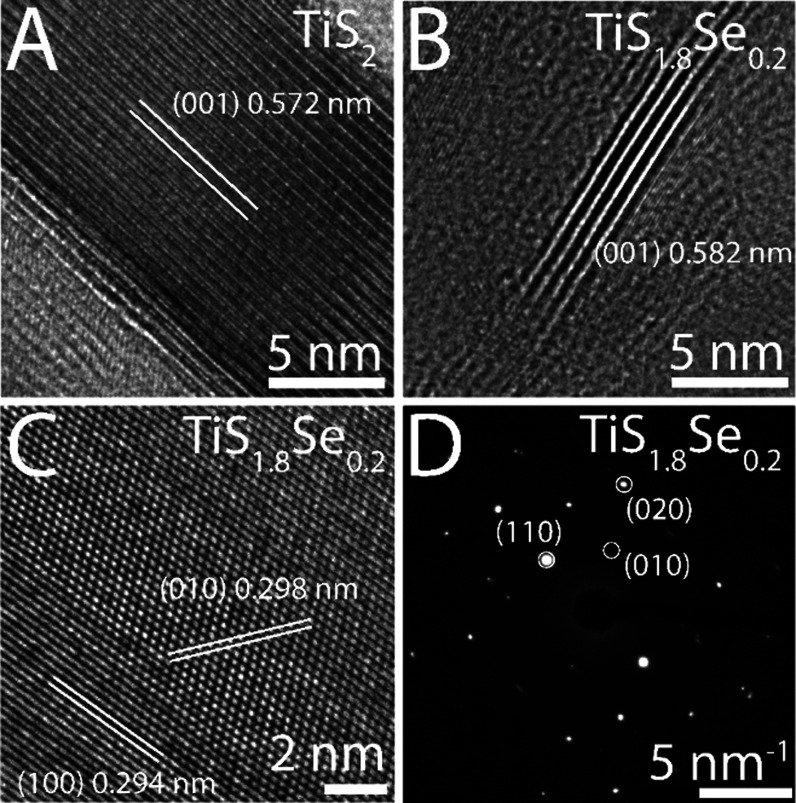
Further structural and morphological studies of individual TiS2 and TiS1.8Se0.2 nanobelts were undertaken using lattice-resolved high-resolution transmission electron microscopy (HRTEM) and selected area electron diffraction (SAED). The HRTEM images acquired along the c-axis of the TiS2 and TiS1.8Se0.2 nanobelts are depicted in Figure 4A,B, respectively. Imaging of the vdW gap for TiS2 and TiS1.8Se0.2 indicates an increase of the (001) interlayer distance from 0.572 nm (TiS2) to 0.582 nm (TiS1.8Se0.2). The observed interlayer distance expansion upon Se incorporation corresponds to an ≈1.7% increase in the c-axis of TiS2. Additionally, Figure 4C shows lattice fringes obtained from HRTEM, where the hexagonal structure of the ab crystallographic plane of TiS1.8Se0.2 is evident. Lattice fringes spaced at 0.294 and 0.298 nm agree well with the spacing of the (100) and (010) planes of a hexagonal TiS1.8Se0.2 nanobelt. The SAED pattern presented in Figure 4D corroborates the crystalline nature of the TiS1.8Se0.2 nanobelt. The diffraction spots observed in the SAED pattern are associated with a nanobelt in the ab plane, and crystallographic reflections of the (110), (010), and (020) planes in the hexagonal lattice pattern of TiS1.8Se0.2 are indexed. The evidence of twinning of some diffraction spots is indicative of small crystallite sizes in the diffraction area. Dark field transmission electron microscopy (TEM) imaging highlights small crystallite grain sizes in the TiS1.8Se0.2 nanobelts, which leads to many regions of contrast across the length of the nanobelt (Figure S1). These overlapping crystallites likely give rise to SAED pattern twinning in the TiS1.8Se0.2 nanobelts (Figure 4D). Conversely, large grain sizes in TiS2 nanobelts are observed, as little image contrast exists across the nanobelt length (Figure S1).
Figure 4.
HRTEM lattice fringes indicate an increase in the (001) interlayer distance from (A) TiS2 to (B) TiS1.8Se0.2. (C) TiS1.8Se0.2 is further identified through the lattice fringes of the ab plane. (D) SAED identifies the crystalline nature of a TiS1.8Se0.2 nanobelt.
Structural modification upon Se incorporation was determined by using X-ray diffraction (XRD) studies. Figure 5 displays diffraction peaks of TiS2 and TiS1.8Se0.2 which are indexed to lattice planes of the CdI2-type crystal structure of TiS2, (Joint Committee of Powder Diffraction Standards (JCPDS) 74-1141), in the P3̅m1 space group (164). As shown in the XRD pattern presented in Figure 5, an increase in interlayer spacing with Se incorporation is observed with a blue shift in the (001) diffraction peak from 15.56° 2θ (TiS2) to 15.26° 2θ (TiS1.8Se0.2). This indicates an increase of the d-spacing from 0.569 nm in TiS2 to 0.580 nm in TiS1.8Se0.2 and corresponds to an ≈1.9% expansion of the lithium-hosting van der Waals interlayer. The increase in lattice spacing along this axis is expected with the introduction of the larger Se2– anion (0.191 nm) vs the S2– anion (0.184 nm) into the CdI2-type lattice. This finding is in good agreement with our HRTEM/SAED studies, providing further evidence for the substitutional incorporation of Se into the TiS2 crystal structure. Additionally, the broadening of the (011) and (012) diffraction peaks of the TiS1.8Se0.2 sample suggests a decreased crystallite size imparted upon the substitution of S for Se. However, given the lack of broadening in the (001) diffraction peak, these smaller grain sizes in TiS1.8Se0.2 are seen to manifest only in the ab plane and do not affect the spacing of the vdW layer. We also note a minor oxidation peak at 2θ = 27.9°, which can be attributed to TiO2 in the rutile (JCPDS 88-1175) phase and results from air exposure during acquisition of the XRD spectra.
Figure 5.
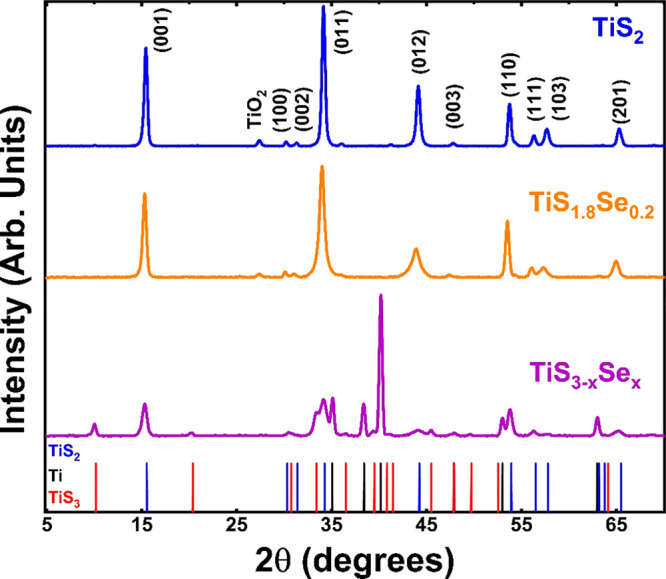
XRD patterns of TiS2, TiS1.8Se0.2, and TiS3–xSex nanobelts. To facilitate phase identification, standard patterns of TiS2 (JCPDS 74-1141), Ti (JCPDS 44-1294), and TiS3 (JCPDS 15-0783) are presented as solid vertical lines at the bottom of the graph.
The XRD pattern for the TiS3–xSex sacrificial precursor (prior to desulfurization) is also presented and is in good agreement with JCPDS No. 15-0783 (TiS3). However, as this intermediate is unstable, XRD analysis of TiS3–xSex displays peaks corresponding to multiple phases. Ti precursor, TiS1.8Se0.2 product, and TiS3–xSex intermediate can all be identified in the XRD pattern of TiS3–xSex. Reference lines to the accepted JCPDS peaks for each species are presented as solid vertical lines at the bottom of Figure 5, while these peaks are modeled via the predicted diffraction intensity in Figure S2. Peaks that can be unambiguously assigned to each of these phases are at 40.17° 2θ (Ti), 15.26° 2θ (TiS1.8Se0.2), and 10.14° 2θ (TiS3–xSex). This intermediate phase is likely unstable because, while TiS3 is easily synthesized, TiSe3 remains unrealized in bulk syntheses. Though pure TiS3–xSex is not isolated, its monoclinic structure plays an important role in the formation of TiS1.8Se0.2 nanobelts.
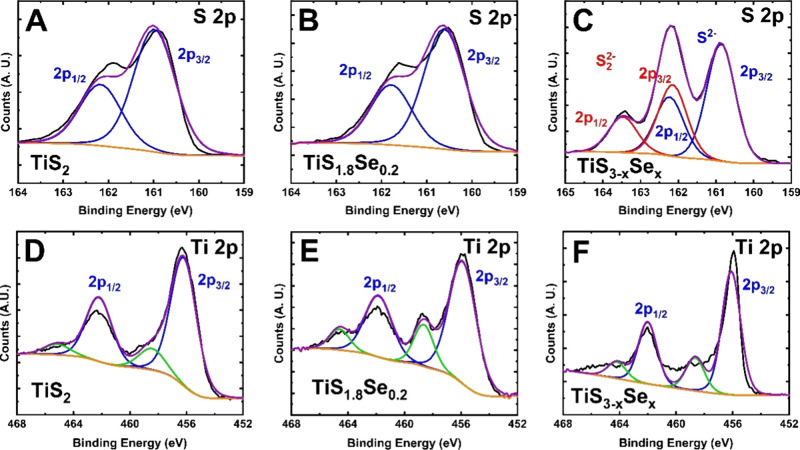
To confirm the purity and coordination environment of our samples, X-ray photoelectron spectroscopy (XPS) spectra were collected for the TiS2, TiS1.8Se0.2, and TiS3–xSex species in the S 2p and Ti 2p binding energy regions (Figure 6). XPS spectra are also collected in the Se 3d binding energy region, which overlaps with the Ti 3s photoelectron peak; these spectra are presented in Figure S3. The S 2p region for TiS2 contains two peaks for the spin–orbit splitting of 2p3/2 and 2p1/2. The S 2p3/2 and 2p1/2 peaks of TiS2 have binding energies of ≈160.9 and 161.9 eV, respectively, with a spin–orbit doublet splitting of 1.0 eV (Figure 6A). A similar spin–orbit doublet splitting of 1.1 eV is determined for TiS1.8Se0.2, where the S 2p3/2 and 2p1/2 peaks are located at binding energies of ≈160.5 and 161.6 eV, respectively (Figure 6B). Thus, within the resolution of the instrument, no shift to the S 2p peak is observed between pure TiS2 and TiS1.8Se0.2. However, a noticeable difference is noted in the S 2p peak for the TiS3–xSex intermediate. This region contains two sets of overlapping peaks, with maxima at ≈160.9 162.2, and 163.4 eV which correspond to S2– and S22– species. By analysis of the XPS spectrum in Figure 6C, the peak centered at ≈160.9 eV is assigned to the S2– 2p3/2 binding mode. The peak centered at ≈162.2 eV is a combination of the S2– 2p1/2 and S22– 2p3/2 binding modes. Finally, the peak centered at ≈163.4 eV can be assigned to the S22– 2p1/2 binding mode. As depicted in Figure 6A–C, the S2– doublet for the TiS3–xSex intermediate exists in a location similar to that of the TiS2 and TiS1.8Se0.2 species. The additional doublet highlighted by the red fitting corresponds to the S22– anion in the TiS3–xSex intermediate. For a stoichiometric TiS3 species, the ratio of S22– to S2– should be 2:1. However, given the instability of the intermediate (as evidenced through XRD), the ratio of the 2p3/2 peak areas is 0.66:1 for S22–:S2– in TiS3–xSex. Thus, rapid conversion to the TiS1.8Se0.2 product is confirmed.
Figure 6.
XPS spectra of TiS2, TiS1.8Se0.2, and TiS3–xSex nanobelts. The S 2p region is shown for (A) TiS2, (B) TiS1.8Se0.2, and (C) TiS3–xSex. The Ti 2p region is shown for (D) TiS2, (E) TiS1.8Se0.2, and (F) TiS3–xSex.
As shown in Figure 6D–F, the Ti 2p regions follow the same spin–orbit splitting pattern as that of S 2p. Each species displays a 2p doublet corresponding to bonding to the S/Se as well as an additional minor doublet (the green fitting in Figure 6D–F) corresponding to sample surface oxidation during loading into the instrument. The Ti 2p XPS region for TiS2 features a 2p3/2 peak at ≈456.3 eV and a 2p1/2 peak at ≈462.4 eV (Figure 6D). The TiS1.8Se0.2 sample shows two prominent peaks centered at 2p3/2 ≈ 455.9 eV and 2p1/2 ≈ 461.9 eV (Figure 6E). With the addition of Se into the structure, it is expected that the Ti 2p doublet will shift to lower binding energies due to more covalent-type electron sharing with the Se atoms. Though this trend is demonstrated, the differences in peak position are again inside the instrument line width resolution, so the difference in peak position is not quantitative. Figure 6F shows the XPS spectra for the Ti 2p region of the TiS3–xSex sacrificial scaffold, where the binding energies for the 2p3/2 and 2p1/2 regions (≈456.0 and 462.0, respectively) are in good agreement with the Ti bonding environments observed for pristine TiS2 and TiS1.8Se0.2 nanobelts, which is to be expected considering the minor change to the coordination environment following desulfurization.
In the region of the Se 3d photoelectron peak, all samples showed the presence of the Ti 3s singlet, centered at around 60 eV. As in the Ti 2p spectrum, the Ti 3s peak for TiS1.8Se0.2 displays significant oxidation. As expected, the TiS2 spectrum did not display a Se 3d photoelectron peak. The TiS1.8Se0.2 spectrum displays a Se 3d doublet centered at ≈53.5 eV, corresponding to a single Se oxidation state. The TiS3–xSex spectrum has a small doublet also centered at ≈53.5 eV but also an additional doublet that is centered at ≈55 eV. This is a trend similar to what is observed in the S 2p photoelectron peak for TiS3–xSex and indicates that Se is present as a dianion form in this intermediate state.
As discussed, it is well documented that TiS2 can show metallic, semimetallic, or semiconducting behavior depending on the defect states within its crystal structure (e.g., S/Ti vacancies, Ti adatoms, and/or S/Se adatoms).25Figure 7 shows the electrical conductivity as a function of temperature for TiS2 and TiS1.8Se0.2 nanobelts. In the measured range of 150–350 K, TiS2 nanobelts display semimetallic behavior, in agreement with previous studies.25,44,45 It is expected that TiS1.8Se0.2 nanobelts will have a higher electrical conductivity than TiS2 due to Se being less electronegative than S. The lower electronegativity of Se (relative to S) is expected to cause a partial filling of the Ti 3d conduction band and thus produce degenerate extrinsic electrical behavior. Indeed, such a trend is supported by the Hall electrical conductivity measurements presented in Figure 7. TiS1.8Se0.2 exhibits semimetallic behavior over the temperature range of 150–350 K, with a maximum electrical conductivity of 6.88 S cm–1 observed at 150 K. This represents a 6-fold increase over the maximum electrical conductivity of TiS2, which was 1.05 S cm–1 at the same temperature. For both materials, n-type conductivity is suggested by a negative value of the Hall coefficient across the measured temperature range. This concurs with previous analysis of TiS2 nanobelts where S vacancies are demonstrated to n-dope the materials.25
Figure 7.
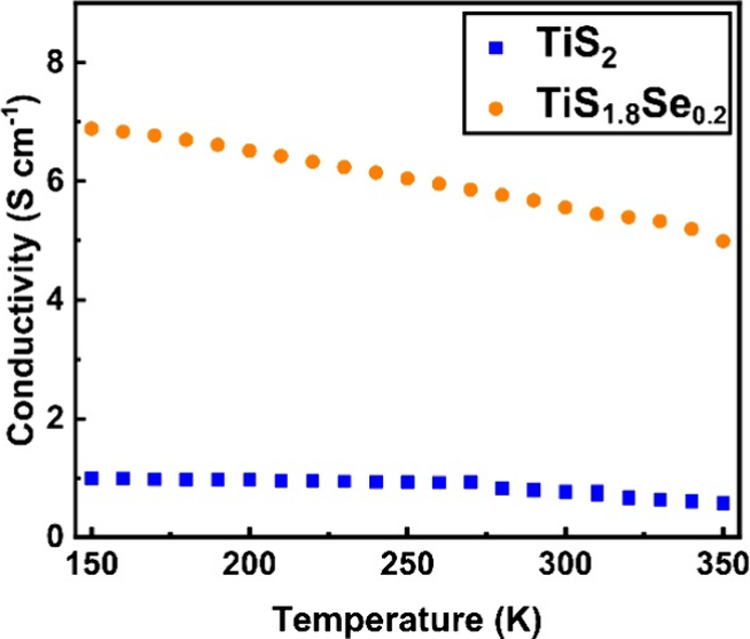
Hall electrical conductivity of TiS2 and TiS1.8Se0.2 nanobelts.
To determine the impact of Se incorporation on the kinetics of Li+ ion insertion within the van der Waals layers of our TiS2 nanobelts, electrochemical studies using cyclic voltammetry (CV) were performed. CV curves were acquired within the voltage range of 1–3 V (vs Li/Li+) at variable scan rates (0.1–5 mVs–1). As illustrated in Figure 8A,B, the CV curves for the Li-based half-cell for both the TiS2 and TiS1.8Se0.2 electrodes display peaks corresponding to the Ti3+/Ti4+ couple, which is the only observable redox process in this voltage window. While TiS2 displays small redox peaks in both the anodic and cathodic CV curves, these peaks are suppressed for the TiS1.8Se0.2 electrode, giving a line shape that more closely resembles a capacitive process.
Figure 8.
Rate-dependent cyclic voltammograms in the range of 0.1–5 mV/s for (A) TiS2 and (B) TiS1.8Se0.2. (C) b-value analysis of intercalation kinetics for TiS2 and TiS1.8Se0.2 was obtained from the anodic peak current density.
To evaluate the different limitations to ion motion in these materials, a b-value analysis of the anodic peak currents at each scan rate was used. Voltammetric response as a function of scan rate can be expressed using the following power law relation:
| 2 |
where i is the current measured at electrochemical potential V, v is the scan rate, and a and b are adjustable parameters.46 When the logarithmic anodic peak currents (log(i)) versus the logarithmic sweep rates (log(v)) are plotted, the slope of the linear fit should lie between 0.5 (purely diffusion-limited process) and 1.0 (purely surface-limited/capacitive process).38,47 The b-value obtained from the slope is indicative of what charge-transfer processes are rate-limiting for each material at the redox peak voltage. It is a salient point that the intercalation process of Li+ in TiS2 has been previously labeled as pseudocapacitive due to the continuous potential drop with increased Li+ content.21 Intercalation pseudocapacitance describes a capacitive-type process that arises from ion insertion into a host material rather than a classical capacitive double-layer. It is anticipated that charge transfer into intercalation-type electrodes contains contributions from faradaic as well as pseudocapacitive processes.
Using the rate-dependent CV curves presented in Figure 8A,B and following eq 2, we calculated the b-values for both TiS2 and TiS1.8Se0.2 (Figure 8C). The TiS2 electrode has a b-value of 0.79, lying between a diffusive and a capacitive process. However, the TiS1.8Se0.2 electrode exhibits a b-value of 0.97, indicating an almost purely capacitive process at the peak discharge voltage. TiS1.8Se0.2 demonstrates faradaic behavior in its cyclic voltammograms and thus deviates from ideal pseudocapacitive behavior, defined as a purely capacitive response arising from properties other than the classical double layer.48 However, the b-value analysis and a suppressed redox peak in our TiS1.8Se0.2 nanobelts indicate significant pseudocapacitive contributions to the charge storage mechanism, leading to fast Li+ ion kinetics near the open-circuit voltage
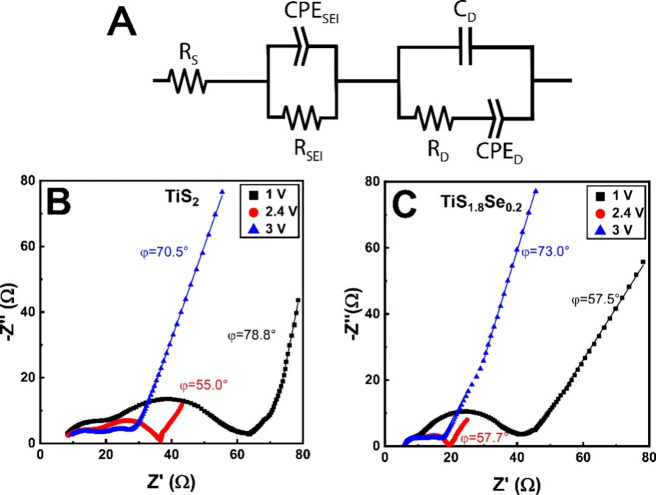
Electrochemical impedance spectroscopy (EIS) studies provide insights into the charge/ion transport, resistances, and interfacial processes in our Li-based TiS2 and TiS1.8Se0.2 electrochemical systems. Moreover, EIS may resolve different factors that contribute to impedance across an electrochemical cell, considering the different time scales of each limiting process. To isolate separate charge-transfer behaviors across each electrode, EIS data was collected across a frequency range of 10–2–105 Hz. This range allows for the analysis of three charge/mass-transfer mechanisms in the electrochemical cell in three distinctive frequency regimes, which are modeled in the equivalent circuit depicted in Figure 9A. The highest frequency regime (103–105 Hz) of this circuit is dominated by the series (S) resistance of the electrochemical cell and is represented by RS. Following this, the middle frequency regime (100–103 Hz) has contributions from charge/mass transfer from the electrolyte into the solid-state host at the solid electrolyte interphase (SEI), and it is modeled by RSEI and CPESEI in parallel. Finally, in the low frequency regime (10–2–100 Hz), the Warburg impedance is the major contributor, accounting for ion diffusion (D) through the solid electrode; this region is modeled by CD in parallel with RD and CPED. Figure 9B,C displays Nyquist plots of TiS2 and TiS1.8Se0.2 acquired from EIS studies. At all potentials, the series resistance of the cell is comparable for both materials with a value of RS ≈ 4 Ω. This is to be expected considering that the electrolyte resistance should not change significantly between species. However, at all potentials, TiS2 displays a larger mass/charge-transfer (SEI) resistance than that of TiS1.8Se0.2 solid solutions. The SEI resistance of TiS2 is 28 Ω at 3 V and 23 Ω at 2.4 V and increases significantly to 58 Ω at 1 V. TiS1.8Se0.2 is fit to SEI resistances of 13 Ω at 3 V, 12 Ω at 2.4 Ω, and 27 Ω at 1 V. Lower resistances at this interface can be attributed to the increased electrical conductivity and lattice spacing of TiS1.8Se0.2. This lower RSEI term is expected to be a significant contributor to the high capacitance of TiS1.8Se0.2 corroborated by the b-value analysis at the open circuit voltage. For both materials, a much larger charge-transfer resistance appears with decreased electrode polarization, evidenced graphically by the increase in the midfrequency semicircle when the cell voltage is lowered to 1 V.
Figure 9.
(A) Equivalent Randles circuit used for fitting. In this diagram, R is a resistor, C is an ideal capacitor, and the CPE is a constant phase element. Nyquist plots of (B) TiS2 and (C) TiS1.8Se0.2 spanning the cycling potential range of the electrochemical cells.
The low-frequency Warburg region of the EIS spectra allows further analysis of ion motion in each species, as diffusion through the electrode happens on this time scale. Phase angle analysis is a useful probe of the electrode behavior in this region. Phase angles of |Φ|= 45° in this frequency region are considered to arise from ideally diffusion-limited processes; higher angles contain contributions from surface-limited processes to the limit of a fully capacitive process at |Φ| = 1. At 3 V, phase angle analysis from the slope in the low frequency Warburg region shows |Φ| = 70.5° for TiS2 and |Φ| = 73.0° for TiS1.8Se0.2. Both materials thus show the presence of blocking electrode-type behavior at 3 V vs Li/Li+, which indicates that mass transfer into the electrode does not occur; instead, an electric double layer is formed by ions on the outside of the electrode. In this region, RD for TiS2 is 4.0 Ω, while RD for TiS1.8Se0.2 is 1.4 Ω.
At the open circuit voltage of 2.4 V, the TiS1.8Se0.2 electrode displays a steeper phase angle in the Warburg region, indicating more capacitive behavior of TiS1.8Se0.2 at this voltage. Phase angles from the Nyquist plot are |Φ| = 55.0° for TiS2 and |Φ| = 57.7° for TiS1.8Se0.2. Thus, in this region, a slightly greater value of |Φ| for TiS1.8Se0.2 indicates an incremental improvement of ion diffusion kinetics at the open-circuit voltage, in addition to the improved charge and mass transfer into the material from the low RSEI. Analysis from the equivalent circuit indicates that RD increases to 8.6 Ω for TiS2, while RD remains lower with a value of 3.1 Ω. As the voltage drops to 1 V, however, the phase angle of TiS2 becomes |Φ| = 78.8° while the phase angle of TiS1.8Se0.2 remains relatively constant at |Φ| = 57.5°. Phase angle analysis suggests that Li+ ion kinetics in TiS1.8Se0.2 remain limited with a decreased cell potential, while a similar reduction in potential improves the ion kinetics of TiS2. As with RSEI, both electrodes display an increase in RD with decreasing voltage, as TiS2 displays an RD value of 14 Ω and TiS1.8Se0.2 has only a slightly lower RD of 13 Ω.
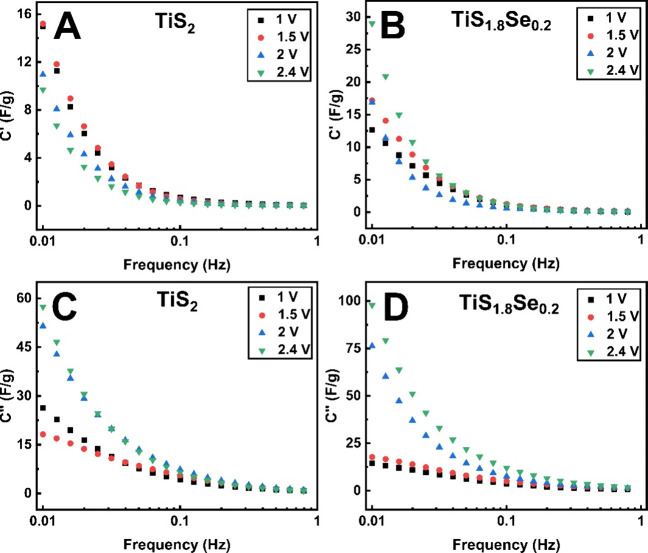
To further understand the ion kinetics of TiS1.8Se0.2 electrodes, capacitance in the low-frequency regime is modeled using a 2D Bode plot analysis (Figure 10). Analysis in the low-frequency regime (0.01–1 Hz) is the most relevant for ion kinetics because diffusive processes happen at this time scale. In this frequency range, the electrochemical characteristics of the cell can be simplified to a frequency-dependent resistor and capacitor in series.49 Using this model, it is possible to isolate the real (C′(ω)) and imaginary (C″(ω)) components of the capacitance of the cell. These can be calculated from the raw impedance data as per the following equations:49
| 3 |
| 4 |
where C′(ω) and C″(ω) are capacitance terms, ω is the angular frequency, Z′(ω) is the real component of the impedance, Z″(ω) is the imaginary component of the impedance, and |Z(ω)| is the magnitude of the impedance. These two terms provide insight into the frequency-dependent capacitive response of an electrochemical cell. C′(ω) represents the observable capacitance of the cell during discharge and arises from reversible electrochemical processes. C″(ω) is best described as accounting for energy dissipation from irreversible processes at the electrode; diffusion limitations are the key factor being evaluated here. Analysis of both C′ and C″ elucidates the effect of Se doping on ion kinetics in layered TiS2.
Figure 10.
2D Bode plots of frequency-dependent real and imaginary capacitance of TiS2 and TiS1.8Se0.2. C′ values for (A) TiS2 and (B) TiS1.8Se0.2, and C″ values for (C) TiS2 and (D) TiS1.8Se0.2 are shown.
Analysis of C′ for TiS2 and TiS1.8Se0.2 highlights opposite trends for each material. As displayed in Figure 10A,B, TiS2 displays an increase in C′ with lowering of the applied voltage, though C′ values are incrementally higher at 1.5 V than at the fully discharged 1 V. TiS1.8Se0.2, on the other hand, displays a spike in C′ around the open circuit voltage of 2.4 V, followed by a decrease in C′ at lower potentials. For both materials, C′ has minimal values above the open-circuit voltage (2.4 V), because while blocking electrode behavior gives rise to capacitive behavior, charge storage in this potential region is negligible. The TiS2C′ response follows the expected trend from the EIS Nyquist plot phase angle analysis: greater capacitive behavior is displayed at the minimum applied voltage of 1 V. However, the maximum in C′ for TiS1.8Se0.2 arises near the open-circuit voltage (2.4 V) and exists where phase angle analysis suggests mostly diffusion-limited behavior. Similar anomalous behavior (a maximum in C′ corresponding with low |Φ|) has been previously observed for Nb2O5 and was ascribed to the subtleties of its pseudocapacitive behavior.50 Fast Li+ transfer across the SEI and into the expanded interstitial layer brought about by Se incorporation is expected to be a major contributor to this observed phenomenon.
The maximum of C″ can be used to determine the time constant, τ, where the electrodes switch from displaying resistive to capacitive behavior. As observed in Figure 10C,D, C″ increases throughout the measured frequency range, without displaying any apparent maximum for any of the voltages tested. However, both electrodes appear to display a plateau in C″ around 0.01 Hz at 1 and 1.5 V, suggesting that the time constant for charge transfer at these voltages is τ ≈ 100 s. Both materials display τ > 100 s for higher potentials, suggesting that Li+ ion dynamics are too slow to be effectively investigated in this frequency window. These slow charge-transfer dynamics are typical of battery-like intercalation processes, meaning that pseudocapacitance is only a partial contributor to the charge-transfer process present in these electrodes. However, it is worth noting that the high C′ of TiS1.8Se0.2 occurs at the same high potential (2.4 V), where kinetics appear limited by C″ analysis.
Overall, C′ and Nyquist plot phase angle analysis indicate that the rate of charge transfer in TiS2 electrodes increases with decreasing voltage; this agrees with the recently reported behavior of TiS2 as being diffusion-limited at high voltages, while becoming more capacitive as the voltage lowers from the redox peak potential.38 It is well-reported that TiS2 interlayer spacing increases with Li+ occupation in its interstitial layers, with an expansion of ∼0.05 Å accompanying the full intercalation of Li+.1,38 Li+ ion diffusion kinetics thus increase with the increased interlayer spacing of the LixTiS2 solid solution. However, our C′ calculations and b-value analysis indicate a different ion kinetic behavior for TiS1.8Se0.2. Highly capacitive behavior is shown near the open-circuit voltage of TiS1.8Se0.2, contrary to what is observed for TiS2. Fast charge transfer in this region is thus suggested. However, C′ decreases with decreasing cell potential, even as the Nyquist plot phase angle remains relatively constant for the material. Se incorporation into TiS2 thus improves diffusion kinetics at high voltages, while the kinetic behavior of TiS1.8Se0.2 becomes similar to TiS2 as the voltage is lowered.
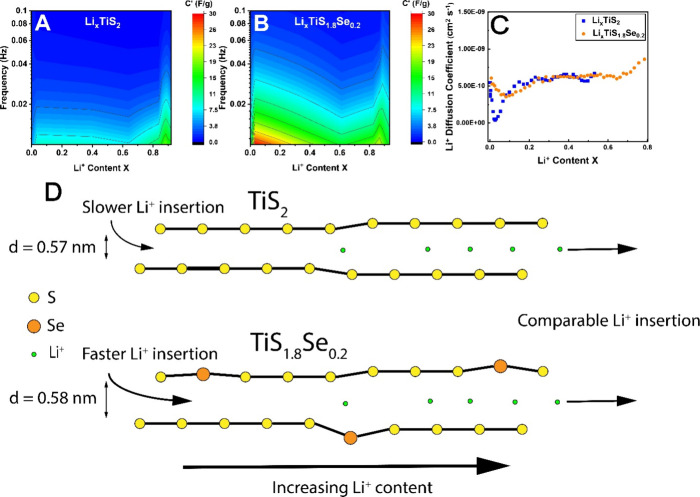
To directly correlate the material capacitance to Li+ content, C′ values are plotted versus the Li+ concentration at each respective voltage (Figure 11). Li+ concentrations are calculated from the theoretical specific capacity of each material, at which stoichiometric LiTiS2 or LiTi1.8Se0.2 is formed. Theoretical specific capacities are 239 m Ah g–1 for TiS2 and 221 m Ah g–1 for TiS1.8Se0.2. Specific capacities are collected at a 0.2 C rate in the second cell discharge to allow for solid-electrolyte interphase layer formation. The ratio of the experimental to theoretical specific capacity gives the Li+ content of the electrode at a given voltage. It is found that TiS2 exhibits a maximum Li+ loading of Li0.92TiS2, while TiS1.8Se0.2 has a maximum Li+ loading of Li0.93TiS1.8Se0.2. It is important to note that, despite the lower theoretical specific capacity of TiS1.8Se0.2, it can host an equivalent concentration of Li+ ions as stoichiometric TiS2.
Figure 11.
3D maps highlighting C′ of (A) TiS2 and (B) Ti1.8Se0.2 relative to Li+ content in the electrodes. (C) Li+ diffusion coefficients for TiS2 and TiS1.8Se0.2 were determined from GITT analysis. (D) Improvements to Li+ insertion due to Se incorporation are most pronounced at a low Li+ content.
Figure 11A,B indicates that the capacitive behavior of TiS2 is greatest when the material is almost fully lithiated, while a maximum capacitive behavior of TiS1.8Se0.2 occurs with low Li+ content in the material. As Li+ concentration in the material is increased, both electrodes display a minimum in C′ at [Li+] ≈ 0.6 per stoichiometric unit. In the region of [Li+] = 0.85–0.88, TiS2 and TiS1.8Se0.2 and have a spike in C′ of comparable magnitude. A slight downturn in C′ is observed at full Li+ insertion; this decrease is likely due to the nearly full occupancy of Li+ ions slowing down insertion kinetics.
Additional analysis of ion motion in TiS2 and TiS1.8Se0.2 is gathered through a galvanostatic intermittent titration technique (GITT) analysis. GITT analysis uses Fick’s second law of diffusion to quantify ion migration, allowing the Li+ ion diffusion coefficient (DLi) to be calculated by38,51
| 5 |
where τ is the current pulse time (600 s), m is the active material mass (excluding binder components), Vm is the molar volume, M is the molar mass, A is the electrode contact area (geometric area),38 ΔEs is the potential difference of the starting and equilibrium potential (after electrode rest), and ΔEτ is the potential difference of the starting and pulsed potential (before electrode rest). In Figure 11C, DLi for both TiS2 and TiS1.8Se0.2 is plotted versus the Li+ content in the material. Both materials display an increase in DLi with increasing Li+ content, though comparison of TiS2 and TiS1.8Se0.2 is limited in the [Li+] range of 0–0.6 due to excessive noise in the TiS2 data. Importantly, it is observed that, at low Li+ concentration ([Li+] ≈ 0.02), TiS2 displays a dip in DLi of over an order of magnitude. A similar dip in DLi is observed for TiS1.8Se0.2, although its magnitude is significantly reduced. TiS1.8Se0.2 thus mitigates a limitation to Li+ kinetics that is clearly present for TiS2 at a low Li+ content in the material, concurring with other analyses (vide supra). While GITT analysis indicates that Li+ kinetics of TiS1.8Se0.2 do improve with increasing Li+ content, the most drastic improvement relative to TiS2 occurs at low Li+ loading in the material. At higher Li+ content, DLi becomes comparable for both materials; given that both species are expected to show expanded interlayer spacing with increased Li+ content, this is the most likely cause of the increase in DLi with an increase in [Li+].
So, what drives the unusual ion kinetics in TiS1.8Se0.2 electrodes? It is anticipated that the large interlayer spacing and increased electrical conductivity both play a crucial role in allowing faster charge transfer into the material at a low Li+ content. As the Li+ content in the material increases, kinetics become comparable with the TiS2 and TiS1.8Se0.2 nanobelts, with the TiS2 nanobelts in fact demonstrating superior kinetics (through EIS phase angle analysis) at the low voltage limit. Considering the morphological similarity of TiS2 and TiS1.8Se0.2, differences in the electrochemical performance can be attributed to the presence of the extrinsic Se atom.
Conclusions
We developed a synthesis protocol for fabricating TiS1.8Se0.2 nanobelts that display wider interlayer spacing and higher electrical conductivity than their TiS2 counterparts. Electrochemical analysis indicates that TiS2 electrodes become more capacitive with increasing Li+ ion content. TiS1.8Se0.2 electrodes instead display almost purely capacitive behavior near the open-circuit voltage while becoming more resistive during cell discharge. It is therefore suggested that TiS1.8Se0.2 displays complex charge-transfer dynamics that consist of pseudocapacitive incorporation of Li+ into the host lattice at low Li+ content, as well as kinetic limitations to ion diffusion as Li+ approaches maximum loading. TiS1.8Se0.2 exhibits unusual behavior as it displays superior charge storage in a kinetically limited regime, while DLi rises in a region of lower capacitance of the electrode. Chalcogen substitution is demonstrated to improve Li+ incorporation into a model vdW material and presents a crucial improvement to the development of fast ion insertion mechanisms which can be further implemented and investigated in other 1D structures for future energy storage and neuromorphic computing applications.
Methods
Synthesis
Ti powder (Alfa Aesar, ∼325 mesh, 99.5% trace metals basis), S powder (Alfa Aesar 99.5%, ∼100 mesh), and SeS2 powder (Sigma-Aldrich, ∼100 mesh) were used without further purification. All work was done under inert conditions using a Schlenk line technique or in an Ar glovebox atmosphere to mitigate sample oxidation. To synthesize TiS3–xSex, Ti and SeS2 powder were ground in a 1:1 molar ratio using an agate mortar and pestle. The contents were placed in a borosilicate glass ampule, then evacuated to 1 × 10⁻³ Torr, and backfilled with N2 gas on a Schlenk line. Ampules were evacuated and backfilled three times, finishing under a final vacuum of 1 × 10⁻³ Torr, and were flame-sealed. Ampules were heated for 20 h at 450 °C. This produced the intermediate phase TiS3–xSex. TiS3–xSex was then placed in a new borosilicate glass ampule. Ti powder was added to the ampule, surrounded by glass wool, and ampules were evacuated and backfilled with N2 three times and flame-sealed. Heating for 24 h at 450 °C produced nanobelts of the desired phase and stoichiometry, TiS1.8Se0.2.
TiS2 nanobelts are synthesized following a similar, previously reported synthesis.25 Briefly, Ti powder and S powder were ground together in a stoichiometric ratio for the synthesis of TiS3. The homogeneous mixture of Ti and S was placed in a borosilicate glass ampule that was evacuated to 1 × 10⁻³ Torr and backfilled with N2 thrice. Ampules were placed under a final vacuum of 1 × 10⁻³ Torr and flame-sealed. Heating for 20 h at 450 °C produced TiS3 nanobelts. These nanobelts were placed in a new ampule along with Ti powder surrounded by glass wool. Ampules were evacuated and backfilled with N2 three times, placed under vacuum, and flame-sealed. Heating for 48 h at 500 °C produced nearly stoichiometric TiS2.
Characterization
X-ray diffraction (XRD) was performed on a Bruker D8 Advance X-ray diffractometer using monochromated Cu Kα radiation (1.5406 Å). Operating voltage and current were 40 kV and 40 mA, respectively. A scan rate of 1.2° min–1 was used in a 2θ range of 5–70°.
Scanning electron microscopy (SEM) was performed using a FEI Quanta 600F spectrometer. A field emission gun (FEI Nova Nano, FE-SEM 630) operated at 10 keV was used to image samples.
A JEOL JEM 2800 scanning transmission electron microscope (STEM) with a field emission gun operated at 200 keV was used to determine the crystallinity and measure the lattice parameters of the synthesized nanobelts. Selected area electron diffraction (SAED) was also performed by using this instrument. Energy dispersive X-ray spectroscopy (EDS) was gathered on the instrument by using dual SDD EDS detectors. Sample preparation was done by dispersing nanobelts in isopropyl alcohol, followed by deposition onto a 300 mesh holey carbon-coated copper grid (Ted Pella).
X-ray photoelectron spectroscopy (XPS) was gathered on a Kratos Axis Ultra DLD instrument equipped with a hemispherical analyzer. Aluminum Kα radiation (1486.6 eV) was used for spectra collection, with a pass energy of 40 eV used to collect high-resolution spectra. Measurements were taken at normal takeoff angles. All peaks acquired were normalized to the adventitious carbon peak at 284.6 eV. Data fitting was done using the CasaXPS software, where peaks were fit using a Gaussian–Lorentzian (30% Gaussian) line shape profile. A nonlinear Shirley-type background was used. Within samples, photoelectron peaks originating from the same orbital were fit with the same full width at half-maximum, which was confined between the values of 0.7–3 eV.
The electrical transport properties of pressed pellets and thin films of the synthesized materials were measured using an Ecopia 7000 Photonic Hall measurement system, following a four-point probe configuration.
Electrochemical Studies
Both TiS2 and TiS1.8Se0.2 were incorporated into the Li-ion half cells. Electrodes were prepared using 80% by mass active material (TiS2 or TiS1.8Se0.2), 10% poly(vinylidene fluoride) (PVDF), and 10% carbon black. Precursors were ground with n-methylpyrrolidone (NMP) in a mortar and pestle, and the resulting slurry was cast onto C–Al foil using a doctor blade. Electrodes were dried overnight in a vacuum oven at 60 °C. 1 M LiPF6 in ethylene carbonate was used as the electrolyte and Li foil, as the anode. Celgard (2400) membrane was used to separate the electrodes, and test cells were crimped together in CR2032 coin cells in an Ar glovebox.
Cyclic voltammetry (CV) and electrochemical impedance spectroscopy (EIS) were performed using a CH Instruments 600E Electrochemical Workstation. EIS data fitting to the equivalent circuit was done using the Zfit MATLAB code.52
Battery cycling was done on a Neware BT-4008 battery test station. Batteries were cycled in the range of 1–3 V vs Li/Li+, and variable current densities were used based on the theoretical specific capacity of each material. Galvanostatic intermittent titration technique (GITT) measurements were performed on the same instrument.
Acknowledgments
L.W.-B. acknowledges support from the NSF under award numbers CHEM 2203926 and CBET 2326228. Some of the experimental data were acquired using a Physical Property Measurement System funded by the NSF under award number DMR 2319964. L.W.-B. would also like to acknowledge the Sloan Foundation through an Alfred P. Sloan Research Fellowship in Chemistry and the Dreyfus Foundation through a Camille Dreyfus Teacher-Scholar Award. We gratefully acknowledge the Wilkes Center for Climate Science and Policy at the University of Utah.
Supporting Information Available
The Supporting Information is available free of charge at https://pubs.acs.org/doi/10.1021/acsnanoscienceau.3c00059.
(i) Dark field transmission electron micrographs for TiS2 and TiS1.8Se0.2 nanobelts; (ii) Standard X-ray diffraction patterns for TiS2, Ti, and TiS3; (iii) X-ray photoelectron spectroscopy spectra for the Se 3d and Ti 3s regions (PDF)
Author Contributions
CRediT: Edwin J Miller conceptualization, formal analysis, visualization, writing-original draft, writing-review & editing; Kameron R Hansen formal analysis, visualization, writing-review & editing; Luisa Whittaker-Brooks conceptualization, formal analysis, funding acquisition, writing-original draft, writing-review & editing.
The authors declare no competing financial interest.
Special Issue
Published as part of ACS Nanoscience Auvirtual special issue “Advances in Energy Conversion and Storage at the Nanoscale”.
Supplementary Material
References
- Whittingham M. S. Electrical Energy Storage and Intercalation Chemistry. Science (1979) 1976, 192 (4244), 1126–1127. 10.1126/science.192.4244.1126. [DOI] [PubMed] [Google Scholar]
- Zhu X.; Li D.; Liang X.; Lu W. D. Ionic Modulation and Ionic Coupling Effects in MoS2 Devices for Neuromorphic Computing. Nat. Mater. 2019, 18 (2), 141–148. 10.1038/s41563-018-0248-5. [DOI] [PubMed] [Google Scholar]
- Srimuk P.; Kaasik F.; Krüner B.; Tolosa A.; Fleischmann S.; Jäckel N.; Tekeli M. C.; Aslan M.; Suss M. E.; Presser V. MXene as a Novel Intercalation-Type Pseudocapacitive Cathode and Anode for Capacitive Deionization. J. Mater. Chem. A 2016, 4 (47), 18265–18271. 10.1039/C6TA07833H. [DOI] [Google Scholar]
- Liu C.; Li Y.; Lin D.; Hsu P.-C.; Liu B.; Yan G.; Wu T.; Cui Y.; Chu S. Lithium Extraction from Seawater through Pulsed Electrochemical Intercalation. Joule 2020, 4 (7), 1459–1469. 10.1016/j.joule.2020.05.017. [DOI] [Google Scholar]
- Al Hallaj S.; Venkatachalapathy R.; Prakash J.; Selman J. R. Entropy Changes Due to Structural Transformation in the Graphite Anode and Phase Change of the LiCoO2 Cathode. J. Electrochem. Soc. 2000, 147 (7), 2432. 10.1149/1.1393549. [DOI] [Google Scholar]
- Anantharamulu N.; Koteswara Rao K.; Rambabu G.; Vijaya Kumar B.; Radha V.; Vithal M. A Wide-Ranging Review on Nasicon Type Materials. J. Mater. Sci. 2011, 46 (9), 2821–2837. 10.1007/s10853-011-5302-5. [DOI] [Google Scholar]
- Liu Q.; Peng B.; Shen M.; Hu B.; Chen Q. Polymer Chain Diffusion and Li+ Hopping of Poly(Ethylene Oxide)/LiAsF6 Crystalline Polymer Electrolytes as Studied by Solid State NMR and AC Impedance. Solid State Ion 2014, 255, 74–79. 10.1016/j.ssi.2013.11.053. [DOI] [Google Scholar]
- Gascoin F.; Raghavendra N.; Guilmeau E.; Bréard Y. CdI2 Structure Type as Potential Thermoelectric Materials: Synthesis and High Temperature Thermoelectric Properties of the Solid Solution TiSxSe2-x. J. Alloys Compd. 2012, 521, 121–125. 10.1016/j.jallcom.2012.01.067. [DOI] [Google Scholar]
- Guilmeau E.; Maignan A.; Wan C.; Koumoto K. On the Effects of Substitution, Intercalation, Non-Stoichiometry and Block Layer Concept in TiS2 Based Thermoelectrics. Phys. Chem. Chem. Phys. 2015, 17 (38), 24541–24555. 10.1039/C5CP01795E. [DOI] [PubMed] [Google Scholar]
- Imai H.; Shimakawa Y.; Kubo Y. Large Thermoelectric Power Factor in TiS2 Crystal with Nearly Stoichiometric Composition. Phys. Rev. B 2001, 64 (24), 241104. 10.1103/PhysRevB.64.241104. [DOI] [Google Scholar]
- Chen J.; Li S.-L.; Tao Z.-L.; Shen Y.-T.; Cui C.-X. Titanium Disulfide Nanotubes as Hydrogen-Storage Materials. J. Am. Chem. Soc. 2003, 125 (18), 5284–5285. 10.1021/ja034601c. [DOI] [PubMed] [Google Scholar]
- Barawi M.; Flores E.; Ponthieu M.; Ares J.-R.; Cuevas F.; Leardini F.; Jiménez Ferrer I.; Sánchez C. Hydrogen Storage by Titanium Based Sulfides: Nanoribbons (TiS3) and Nanoplates (TiS2). J. Electr. Eng. 2015, 3 (1), 1. 10.17265/2328-2223/2015.01.004. [DOI] [Google Scholar]
- Liu Y.; Li X.; Wang E.; Zhong Q.; Zhou T.; Chen H.; Chen S.; Lu G.; Liang C.; Peng X. Exceptional Size-Dependent Property of TiS2 Nanosheets for Optical Limiting. Appl. Surf. Sci. 2021, 541, 148371. 10.1016/j.apsusc.2020.148371. [DOI] [Google Scholar]
- Qian X.; Shen S.; Liu T.; Cheng L.; Liu Z. Two-Dimensional TiS2 Nanosheets for in Vivo Photoacoustic Imaging and Photothermal Cancer Therapy. Nanoscale 2015, 7 (14), 6380–6387. 10.1039/C5NR00893J. [DOI] [PubMed] [Google Scholar]
- Ong S. P.; Chevrier V. L.; Hautier G.; Jain A.; Moore C.; Kim S.; Ma X.; Ceder G. Voltage, Stability and Diffusion Barrier Differences between Sodium-Ion and Lithium-Ion Intercalation Materials. Energy Environ. Sci. 2011, 4 (9), 3680. 10.1039/c1ee01782a. [DOI] [Google Scholar]
- Tian B.; Tang W.; Leng K.; Chen Z.; Tan S. J. R.; Peng C.; Ning G.-H.; Fu W.; Su C.; Zheng G. W.; Loh K. P. Phase Transformations in TiS2 during K Intercalation. ACS Energy Lett. 2017, 2 (8), 1835–1840. 10.1021/acsenergylett.7b00529. [DOI] [Google Scholar]
- Whittingham M. S.; Siu C.; Ding J. Can Multielectron Intercalation Reactions Be the Basis of Next Generation Batteries?. Acc. Chem. Res. 2018, 51 (2), 258. 10.1021/acs.accounts.7b00527. [DOI] [PubMed] [Google Scholar]
- Handy J. V.; Andrews J. L.; Perez-Beltran S.; Powell D. R.; Albers R.; Whittaker-Brooks L.; Bhuvanesh N.; Banerjee S. A “Li-Eye” View of Diffusion Pathways in a 2D Intercalation Material from Topochemical Single-Crystal Transformation. ACS Energy Lett. 2022, 7 (6), 1960–1962. 10.1021/acsenergylett.2c00739. [DOI] [Google Scholar]
- Handy J. V.; Zaheer W.; Albers R.; Agbeworvi G.; Boyko T. D.; Bakhmoutov V.; Bhuvanesh N.; Banerjee S. Protecting Groups in Insertion Chemistry: Site-Selective Positioning of Lithium Ions in Intercalation Hosts. Matter 2023, 6, 1125. 10.1016/j.matt.2023.01.028. [DOI] [Google Scholar]
- Miller E. J.; Whittaker-Brooks L. Precision Intercalation Chemistry: The Next Step for Battery Development?. Matter 2023, 6 (4), 1051–1053. 10.1016/j.matt.2023.03.008. [DOI] [Google Scholar]
- Conway B. E. Two-Dimensional and Quasi-Two-Dimensional Isotherms for Li Intercalation and Upd Processes at Surfaces. Electrochim. Acta 1993, 38 (9), 1249–1258. 10.1016/0013-4686(93)80055-5. [DOI] [Google Scholar]
- Bhimanapati G. R.; Lin Z.; Meunier V.; Jung Y.; Cha J.; Das S.; Xiao D.; Son Y.; Strano M. S.; Cooper V. R.; Liang L.; Louie S. G.; Ringe E.; Zhou W.; Kim S. S.; Naik R. R.; Sumpter B. G.; Terrones H.; Xia F.; Wang Y.; Zhu J.; Akinwande D.; Alem N.; Schuller J. A.; Schaak R. E.; Terrones M.; Robinson J. A. Recent Advances in Two-Dimensional Materials beyond Graphene. ACS Nano 2015, 9 (12), 11509–11539. 10.1021/acsnano.5b05556. [DOI] [PubMed] [Google Scholar]
- Wang Q. H.; Kalantar-Zadeh K.; Kis A.; Coleman J. N.; Strano M. S. Electronics and Optoelectronics of Two-Dimensional Transition Metal Dichalcogenides. Nat. Nanotechnol. 2012, 7 (11), 699–712. 10.1038/nnano.2012.193. [DOI] [PubMed] [Google Scholar]
- Inoue M.; Hughes H. P.; Yoffe A. D. The Electronic and Magnetic Properties of the 3d Transition Metal Intercalates of TiS2. Adv. Phys. 1989, 38 (5), 565–604. 10.1080/00018738900101142. [DOI] [Google Scholar]
- Hawkins C. G.; Whittaker-Brooks L. Controlling Sulfur Vacancies in TiS2-x Cathode Insertion Hosts via the Conversion of TiS3 Nanobelts for Energy-Storage Applications. ACS Appl. Nano Mater. 2018, 1 (2), 851–859. 10.1021/acsanm.7b00266. [DOI] [Google Scholar]
- Inoue M.; Negishi H.; Fujii T.; Takase K.; Hara Y.; Sasaki M. Transport Properties of Self-Intercalated Compounds Ti1+xS2. J. Phys. Chem. Solids 1996, 57 (6–8), 1109–1112. 10.1016/0022-3697(95)00405-X. [DOI] [Google Scholar]
- Friend R. H.; Yoffe A. D. Electronic Properties of Intercalation Complexes. Adv. Phys. 1987, 36 (1), 1–94. 10.1080/00018738700101951. [DOI] [Google Scholar]
- Guilmeau E.; Bréard Y.; Maignan A. Transport and Thermoelectric Properties in Copper Intercalated TiS2 Chalcogenide. Appl. Phys. Lett. 2011, 99 (5), 052107. 10.1063/1.3621834. [DOI] [Google Scholar]
- Meakin J. I.; Klipstein P. C.; Friend R. H. Transport and Magnetic Properties of Ag1/3TiS2. Journal of Physics C: Solid State Phys. 1987, 20 (2), 271–276. 10.1088/0022-3719/20/2/009. [DOI] [Google Scholar]
- Trevey J. E.; Stoldt C. R.; Lee S.-H. High Power Nanocomposite TiS2 Cathodes for All-Solid-State Lithium Batteries. J. Electrochem. Soc. 2011, 158 (12), A1282. 10.1149/2.017112jes. [DOI] [Google Scholar]
- Cucinotta C. S.; Dolui K.; Pettersson H.; Ramasse Q. M.; Long E.; O’Brian S. E.; Nicolosi V.; Sanvito S. Electronic Properties and Chemical Reactivity of TiS2 Nanoflakes. J. Phys. Chem. C 2015, 119 (27), 15707–15715. 10.1021/acs.jpcc.5b03212. [DOI] [Google Scholar]
- Jeong S.; Yoo D.; Ahn M.; Miró P.; Heine T.; Cheon J. Tandem Intercalation Strategy for Single-Layer Nanosheets as an Effective Alternative to Conventional Exfoliation Processes. Nat. Commun. 2015, 6 (1), 5763. 10.1038/ncomms6763. [DOI] [PubMed] [Google Scholar]
- Licklederer M.; Cha G.; Hahn R.; Schmuki P. Ordered Nanotubular Titanium Disulfide (TiS2) Structures: Synthesis and Use as Counter Electrodes in Dye Sensitized Solar Cells (DSSCs). J. Electrochem. Soc. 2019, 166 (5), H3009–H3013. 10.1149/2.0031905jes. [DOI] [Google Scholar]
- Hawkins C. G.; Verma A.; Horbinski W.; Weeks R.; Mukherjee P. P.; Whittaker-Brooks L. Decreasing the Ion Diffusion Pathways for the Intercalation of Multivalent Cations into One-Dimensional TiS2 Nanobelt Arrays. ACS Appl. Mater. Interfaces 2020, 12 (19), 21788–21798. 10.1021/acsami.9b21702. [DOI] [PubMed] [Google Scholar]
- Si H.; Seidl L.; Chu E. M. L.; Martens S.; Ma J.; Qiu X.; Stimming U.; Schneider O. Impact of the Morphology of V2O5 Electrodes on the Electrochemical Na+-Ion Intercalation. J. Electrochem. Soc. 2018, 165 (11), A2709–A2717. 10.1149/2.0621811jes. [DOI] [Google Scholar]
- Deng D.; Kim M. G.; Lee J. Y.; Cho J. Green Energy Storage Materials: Nanostructured TiO2 and Sn-Based Anodes for Lithium-Ion Batteries. Energy Environ. Sci. 2009, 2 (8), 818. 10.1039/b823474d. [DOI] [Google Scholar]
- Bruce P. G.; Scrosati B.; Tarascon J.-M. Nanomaterials for Rechargeable Lithium Batteries. Angew. Chem., Int. Ed. 2008, 47 (16), 2930–2946. 10.1002/anie.200702505. [DOI] [PubMed] [Google Scholar]
- Fleischmann S.; Shao H.; Taberna P.-L.; Rozier P.; Simon P. Electrochemically Induced Deformation Determines the Rate of Lithium Intercalation in Bulk TiS2. ACS Energy Lett. 2021, 6 (12), 4173–4178. 10.1021/acsenergylett.1c01934. [DOI] [Google Scholar]
- Whittingham M. S.; Gamble F. R. The Lithium Intercalates of the Transition Metal Dichalcogenides. Mater. Res. Bull. 1975, 10 (5), 363–371. 10.1016/0025-5408(75)90006-9. [DOI] [Google Scholar]
- Bhatt R.; Bhattacharya S.; Patel M.; Basu R.; Singh A.; Sürger C.; Navaneethan M.; Hayakawa Y.; Aswal D. K.; Gupta S. K. Thermoelectric Performance of Cu Intercalated Layered TiSe2 above 300 K. J. Appl. Phys. 2013, 114 (11), 114509. 10.1063/1.4821798. [DOI] [Google Scholar]
- Lin C.; Zhu X.; Feng J.; Wu C.; Hu S.; Peng J.; Guo Y.; Peng L.; Zhao J.; Huang J.; Yang J.; Xie Y. Hydrogen-Incorporated TiS2 Ultrathin Nanosheets with Ultrahigh Conductivity for Stamp-Transferrable Electrodes. J. Am. Chem. Soc. 2013, 135 (13), 5144–5151. 10.1021/ja400041f. [DOI] [PubMed] [Google Scholar]
- Lipatov A.; Loes M. J.; Lu H.; Dai J.; Patoka P.; Vorobeva N. S.; Muratov D. S.; Ulrich G.; Kästner B.; Hoehl A.; Ulm G.; Zeng X. C.; Rühl E.; Gruverman A.; Dowben P. A.; Sinitskii A. Quasi-1D TiS3 Nanoribbons: Mechanical Exfoliation and Thickness-Dependent Raman Spectroscopy. ACS Nano 2018, 12 (12), 12713–12720. 10.1021/acsnano.8b07703. [DOI] [PubMed] [Google Scholar]
- Hawkins C. G.; Whittaker-Brooks L. Vertically Oriented TiS2-x Nanobelt Arrays as Binder- and Carbon-Free Intercalation Electrodes for Li- and Na-Based Energy Storage Devices. J. Mater. Chem. A 2018, 6 (44), 21949–21960. 10.1039/C8TA05645E. [DOI] [Google Scholar]
- Kukkonen C. A.; Kaiser W. J.; Logothetis E. M.; Blumenstock B. J.; Schroeder P. A.; Faile S. P.; Colella R.; Gambold J. Transport and Optical Properties of Ti1+xS2. Phys. Rev. B 1981, 24 (4), 1691–1709. 10.1103/PhysRevB.24.1691. [DOI] [Google Scholar]
- Wu Z. Y.; Lemoigno F.; Gressier P.; Ouvrard G.; Moreau P.; Rouxel J.; Natoli C. R. Experimental and Theoretical Studies of the Electronic Structure of TiS2. Phys. Rev. B 1996, 54 (16), R11009–R11013. 10.1103/PhysRevB.54.R11009. [DOI] [PubMed] [Google Scholar]
- Ko J. S.; Sassin M. B.; Rolison D. R.; Long J. W. Deconvolving Double-Layer, Pseudocapacitance, and Battery-like Charge-Storage Mechanisms in Nanoscale LiMn2O4 at 3D Carbon Architectures. Electrochim. Acta 2018, 275, 225–235. 10.1016/j.electacta.2018.04.149. [DOI] [Google Scholar]
- Wang J.; Polleux J.; Lim J.; Dunn B. Pseudocapacitive Contributions to Electrochemical Energy Storage in TiO2 (Anatase) Nanoparticles. J. Phys. Chem. C 2007, 111 (40), 14925–14931. 10.1021/jp074464w. [DOI] [Google Scholar]
- Brousse T.; Bélanger D.; Long J. W. To Be or Not To Be Pseudocapacitive?. J. Electrochem. Soc. 2015, 162 (5), A5185–A5189. 10.1149/2.0201505jes. [DOI] [Google Scholar]
- Taberna P. L.; Simon P.; Fauvarque J. F. Electrochemical Characteristics and Impedance Spectroscopy Studies of Carbon-Carbon Supercapacitors. J. Electrochem. Soc. 2003, 150 (3), A292. 10.1149/1.1543948. [DOI] [Google Scholar]
- Ko J. S.; Lai C.-H.; Long J. W.; Rolison D. R.; Dunn B.; Nelson Weker J. Differentiating Double-Layer, Psuedocapacitance, and Battery-like Mechanisms by Analyzing Impedance Measurements in Three Dimensions. ACS Appl. Mater. Interfaces 2020, 12 (12), 14071–14078. 10.1021/acsami.0c02020. [DOI] [PubMed] [Google Scholar]
- Weppner W.; Huggins R. A. Determination of the Kinetic Parameters of Mixed-Conducting Electrodes and Application to the System Li3Sb. J. Electrochem. Soc. 1977, 124 (10), 1569–1578. 10.1149/1.2133112. [DOI] [Google Scholar]
- Dellis J.-L.Zfit; MATLAB Central File Exchange, 2023; https://www.mathworks.com/matlabcentral/fileexchange/19460-zfit?s_tid=FX_rc1_behav; Retrieved July 20, 2023.
Associated Data
This section collects any data citations, data availability statements, or supplementary materials included in this article.


