Abstract
Malignant cells can increase in number using immune escape mechanisms such as immune checkpoints. In this study, we evaluated the expression of an immune checkpoint programmed death 1 (PD-1) on T-cell subsets in chronic myeloid leukemia (CML). We obtained bone marrow aspirate samples from CML patients and from individuals without evidence of hematologic malignancies (controls). PD-1 expression on T-cell subsets was measured using flow cytometric analysis. PD-1 expression levels on CD8+ T-cells were significantly lower in complete hematologic response (CHR) than in controls, chronic phase, and blast phase (BP). In CML patients receiving imatinib and dasatinib, PD-1 expression levels on CD8+ T-cells were lower than that at diagnosis. PD-1 expression levels on CD8+ T-cells were positively correlated with quantitative levels of the BCR/ABL fusion gene. PD-1 expression levels on CD4+ T-cells were higher in BP than in CHR. PD-1 expression levels on CD4+ T-cells did not differ significantly according to different medications or quantitative BCR/ABL1 fusion gene levels. Low PD-1 expression on CD8+ T-cells might play a role in maintaining CHR in CML patients. Immune monitoring of PD-1 expression on CD8+ T-cells may predict the disease course. In cases of refractory disease or resistance to imatinib or dasatinib, the use of PD-1 inhibitors would be helpful.
Keywords: Chronic myeloid leukemia, PD-1, CD8+ T-cell, Disease phase, Tyrosine kinase inhibitor
Introduction
There are several ways for malignant cells to increase their number. One of them is to use immune checkpoints that protect malignant cells from immune-mediated injury. Immune checkpoints are inhibitors that block the activation of the immune system in the body. They usually prevent overactivation of T-cell responses. Immune checkpoints are critical inhibitors of immune activation that prevent the immune system from being damaged due to overbalancing and overactivation [1]. When tumor cells develop, a specific antigen from these cells attaches to the antigen presenting cells (APC) and signals the T-cells to begin their work. However, if the immune checkpoint ligands expressed on tumor cells meet the immune checkpoint receptors on T-cells, T-cells are inactivated and the tumor cells are no longer attacked [2]. Upregulation of immune checkpoints contributes to immune escape and tumor growth. Programmed death 1 (PD-1) pathway is one representative immune checkpoint regulation.
PD-1 is a receptor normally present on T-cells, B cells, monocytes, and NK T-cells, and programmed death ligand 1 or 2 (PD-L1/L2) is a ligand that exists in APCs, pancreatic islet cells, endothelial cells, and epithelial cells [3, 4]. It has already been reported that PD-L1/2 is highly expressed in tumor cells. Advanced studies on solid tumors and hematologic malignancies have been published. For melanoma, renal cell carcinoma, non-small cell lung cancer and bladder cancer, which are classically associated with clinical responses to immune checkpoint inhibition, PD-L1 expression ranges widely from 14 to 100%. Among the hematologic malignancies, PD-L1 expression in malignant cells ranges from 37 to 58% [5].
Chronic myeloid leukemia (CML) is a disease that completely shifts the treatment paradigm due to the discovery of BCR-ABL1 tyrosine kinase expression, and tyrosine kinase inhibitors (TKIs) are being developed that would be effective therapeutic agents in CML. It is clear that TKIs have opened a new era for CML patients; however, it is difficult to manage patients who show refractory CML with TKIs or develop intolerance after prolonged therapy. The recent goal of CML treatment is to cease TKI therapy. The lack of overt relapse in patients with treatment-free remission has been attributed to immunological control of CML [6]. However, its precise mechanisms are not clear yet. There are a few studies on immune checkpoints in CML, and the results are controversial [7, 8].
The aim of this study was to evaluate the differences in the expression of PD-1 on CD4+ and CD8+ T-cells in CML patients. We observed how immune checkpoint PD-1 actually modifies according to the disease phase, the type of therapeutic agent, and the quantity of the BCR/ABL1 fusion gene. The results of this study will provide important guidance in the direction of the treatment of CML with PD-1 inhibitors.
Materials and methods
Sample collection and data acquisition from patients and controls
We obtained 82 bone marrow (BM) aspirate samples from 54 patients with CML, both newly diagnosed and under treatment, at the Asan medical center in Korea, between May 2016 and May 2017. The disease phases and treatment responses in CML were judged according to WHO 2016 criteria and the NCCN guideline version 1.2017 [9, 10]. As controls, BM aspirate samples were collected from 32 individuals with no evidence of hematologic malignancies. We assessed the patient characteristics, medical history, and laboratory investigations including quantitative real-time polymerase chain reaction (RT-PCR) results for BCR-ABL1 fusion gene.
This study was approved by the institutional review board of Asan Medical Center (Approval number: 20161087) and was performed in accordance with the Declaration of Helsinki.
Flow cytometric measurement of PD-1 on T-cell subsets
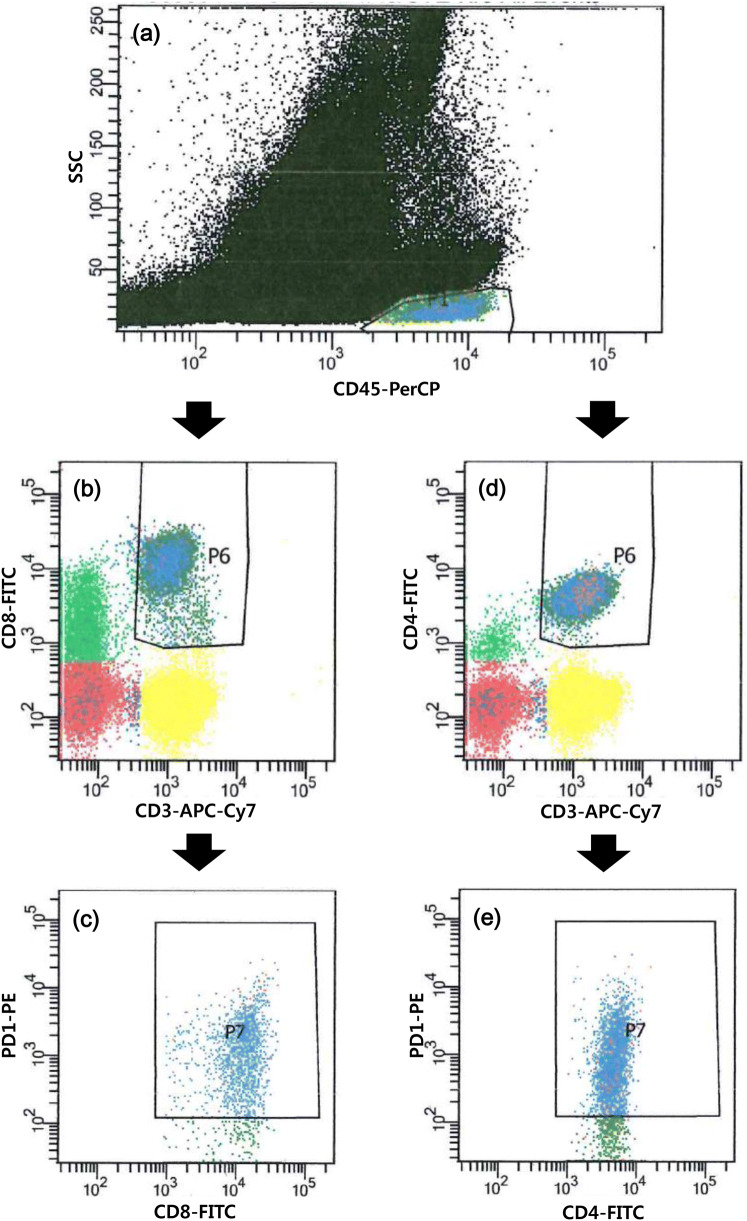
The BM aspirate samples were collected in EDTA tubes (BD Vacutainer, Franklin Lakes, NJ, USA). We incubated 100 uL of PBS-diluted BM aspirate (10,000–20,000/uL) with fluorescence conjugated antibodies (4–8 uL of each PE-conjugated anti-PD-1 [clone EH12.1, BD Pharmingen PE Mouse Anti-Human CD279], APC-Cy7-conjugated anti-CD3 [clone SK7, BD Pharmingen APC-Cy7 Mouse Anti-Human CD3], APC-conjugated anti-CD4 [clone RPA-T4, BD Pharmingen APC Mouse Anti-Human CD4], FITC-conjugated anti-CD8 [clone HIT8a, BD Pharmingen FITC Mouse Anti-Human CD8], and PerCP-conjugated anti-CD45 [clone 2D1, BD Pharmingen PerCP Mouse Anti-Human CD45] purchased from BD Pharmingen [San Diego, CA, USA]) for 20 min in the dark, at room temperature. After washing, the samples were lysed using the lysing solution for 10 min and washed and suspended in PBS. A minimum of 100,000 stained nucleated cells per tube were acquired using a flow cytometer (FACSCanto II, BD Biosciences, Sunnyvale, CA, USA) and analyzed using FACSDiva software (BD Biosciences). The positive percentages of PD-1 expression on CD4+ T-cells and CD8+ T-cells were measured (Fig. 1). Lymphocytes were gated with bright expression of CD45 and low SSC on CD45 vs. SSC cytogram, CD3+ CD8+ T-cells were regated on CD3 vs. CD8 cytogram, and positive PD-1 expression was measured on CD8 versus PD-1 cytogram. Positive PD-1 expression on CD3+ CD4+ T-cells was also measured following the above method using CD4 instead of CD8. The cutoff values for positivity were assigned according to the isotypic controls.
Fig. 1.
Measurement of PD-1 expression on T-cell subsets using flow cytometry. a Gate for lymphocytes, b gate for CD8+ T-cells among lymphocytes, c PD-1 expression on CD8+ T-cells, d gate for CD4+ T-cells among lymphocytes, e PD-1 expression on CD4+ T-cells
Statistical analysis
The statistical analyses were performed using SPSS version 17.0 (SPSS Inc., Chicago, IL, USA) and Excel 2007 (Microsoft, Redmond, WA, USA). Data were tested for normal distribution using the Kolmogorov–Smirnov test. Statistical comparison was calculated by the Kruskal–Wallis test and Mann–Whitney test. If a significant difference was found in the comparison between the groups in the Kruskal–Wallis test, one-way ANOVA test was performed, following ranking all the data, and a Scheffe test was used as a post hoc test. Spearman’s coefficient of rank correlation was used to evaluate the association between PD-1 expression percentages and BCR/ABL1 quantification results. Regression analysis was performed to construct a regression equation and calculate the correlation coefficient of determination. values < 0.05 were considered to indicate statistical significance. Data were given as median with 95% confidence interval.
Results
Patient characteristics
The median age of the CML patients was 47 years, ranging from 11 to 82 years, and that of BM controls was 54 years, ranging from 17 to 80 years. Male and female ratio was 2.72 in the CML patient group and 0.6 in the control group. The BM samples of CML patients included 22 samples collected at diagnosis (20 in chronic phase [CP] and 2 in blast phase [BP]) and 60 collected at follow-up (52 in complete hematologic response [CHR], 1 in CP, 1 in accelerated phase [AP], and 6 in BP). At follow-up, all patients were treated with imatinib (n = 41), dasatinib (n = 8), nilotinib (n = 9), or radotinib (n = 2) (Table 1). The percentage of CD3+ T-cells, CD3+ CD4+ T-cells, and CD3+ CD8+ T-cells among all the cells in BM and the T-cell ratio of CD4+/CD8+ are shown in Table 1. There was no statistical difference in lymphocyte subset status between patient groups based on the disease phase and the type of therapeutic agent.
Table 1.
Patient characteristics
| Clinical characteristics | At diagnosis (n = 22) | Follow-up (n = 60) | Patient total | Controls | |||||
|---|---|---|---|---|---|---|---|---|---|
| CP | AP | BP | CHR | CP | AP | BP | |||
| Patients, n | 20 | 0 | 2 | 52 | 1 | 1 | 6 | 82 | 32 |
| Male/female | 12/8 | 0/0 | 0/2 | 41/11 | 0/1 | 0/1 | 6/0 | 59/23 | 12/20 |
| Age, year median (range) |
54 (22–74) |
– |
60 (53, 66) |
50 (11–82) |
82 | 68 |
44 (19–68) |
47 (11–82) |
54 (17–80) |
| TKI therapy | |||||||||
| Imatinib | – | – | – | 40 | 0 | 1 | 0 | 41 | – |
| Dasatinib | – | – | – | 5 | 0 | 0 | 3 | 8 | – |
| Nilotinib | – | – | – | 5 | 1 | 0 | 3 | 9 | – |
| Radotinib | – | – | – | 2 | 0 | 0 | 0 | 2 | – |
| Lymphocyte subset, median (% of cells) | |||||||||
| CD3+ T-cell | 71.4 | – | 78.3 | 65.8 | 49.2 | 60.6 | 80.4 | 67.3 | 67.7 |
| CD3+ CD4+ T-cell | 29.5 | – | 34.7 | 26.8 | 24.1 | 35.3 | 29.8 | 28.2 | 27.2 |
| CD3+ CD8+ T-cell | 35.3 | – | 40.1 | 31.6 | 10.9 | 20.6 | 38.5 | 33.4 | 33.3 |
| CD4/CD8 ratio | 0.86 | – | 0.95 | 0.87 | 2.21 | 1.71 | 0.76 | 0.86 | 0.84 |
CP chronic phase, AP accelerated phase, BP blast phase, CHR complete hematologic response, TKI tyrosine kinase inhibitor
Expression of PD-1 on CD8+ T-cells according to the disease phases of CML
PD-1 expression on CD8+ T-cells was significantly lower in CML patients at CHR (median 21.2%, ranging from the 1st–3rd quartiles 20.2–27.2%), compared to those at CP (29.7%, 27.4–37.2%, P < 0.001), AP (40.0%), BP (40.3%, 22.3–60.9%, P < 0.001), and the control group (29.3%, 26.3–33.8%, P = 0.004) (Fig. 2).
Fig. 2.
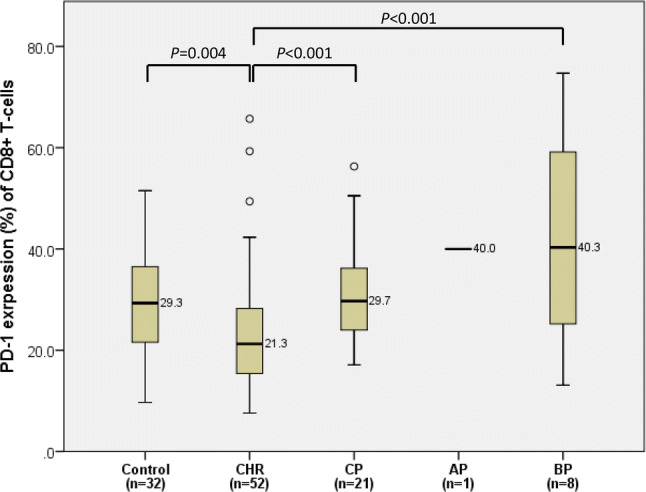
Comparison of PD-1 expression on CD8+ T-cells between bone marrow controls and chronic myeloid leukemia patients in complete hematologic response (CHR), chronic phase (CP), accelerated phase (AP), and blast phase (BP). In each box plot, the median value is reported besides the box. The upper, lower ends, and inner lines of the boxes correspond to the 3rd quartile, 1st quartile, and median values, respectively. Error bars denote minimum and maximum values, and circles indicate outlier values. One patient in AP was excluded from the statistical analysis and only denoted in the figure
Expression of PD-1 on CD8+ T-cells according to TKI medication
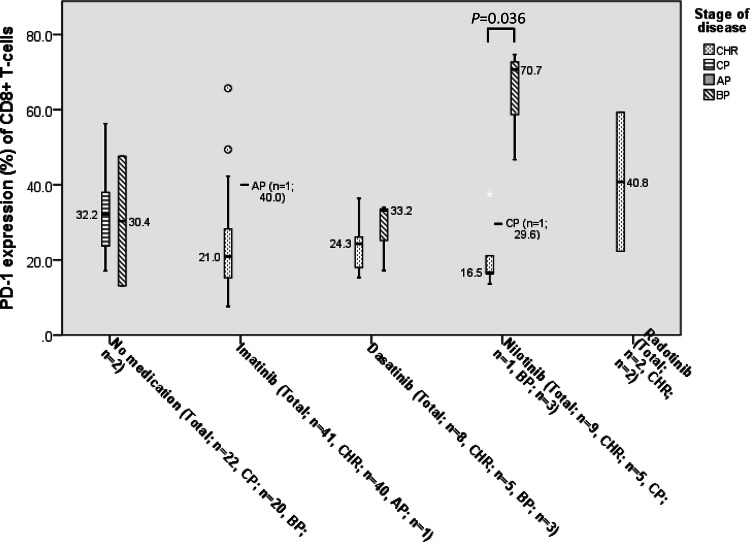
At diagnosis of CML, the median expression level of PD-1 on CD8+ T-cells was 32.2% (27.1–37.5%). In patients treated with imatinib, the expression levels of PD-1 on CD8+ T-cells (21.4%, 19.6–27.3%) were lower than that at diagnosis (P = 0.004) and in the control group (P = 0.006). CML patients treated with dasatinib had lower expression of PD-1 on CD8+ T-cells (25.2%, 18.6–32.5%) than those at diagnosis, although statistical significance was not reached. There was no difference in expression levels of PD-1 between patients treated with nilotinib (29.6%, 18.4–54.2%) and those at diagnosis (Fig. 3).
Fig. 3.
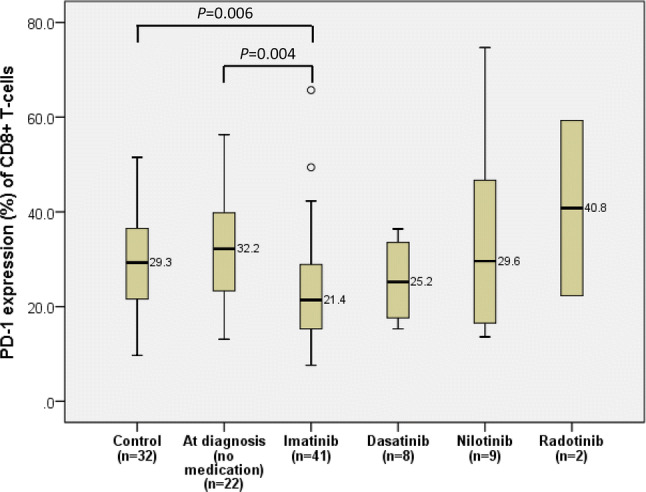
Comparison of PD-1 expression on CD8+ T-cells of chronic myeloid leukemia patients according to different TKI medications. In each box plot, the median value is reported besides the box. The upper, lower ends, and inner lines of the boxes correspond to the 3rd quartile, 1st quartile, and median values, respectively. Error bars denote minimum and maximum values, and circles indicate outlier values
Among patients treated with imatinib or dasatinib, only 4 patients (8.2%, 4/49) did not achieve CHR. Among patients using nilotinib, significant differences in PD-1 expression were found between CHR patients (16.5%, 9.1–32.9%) and BP patients (58.7%, 21.7–89.2%) (P = 0.027) (Fig. 4).
Fig. 4.
Differences in PD-1 expression on CD8+ T-cells between complete hematologic response (CHR) and non-CHR (chronic phase, accelerated phase, and blast phase) after treatment. In each box plot, the median value is reported besides the box. The upper, lower ends, and inner lines of the boxes correspond to the 3rd quartile, 1st quartile, and median values, respectively. Error bars denote minimum and maximum values, and circles and stars indicate outlier values
Correlation of PD-1 expressions on T-cell subsets with BCR/ABL1 fusion gene quantitation results
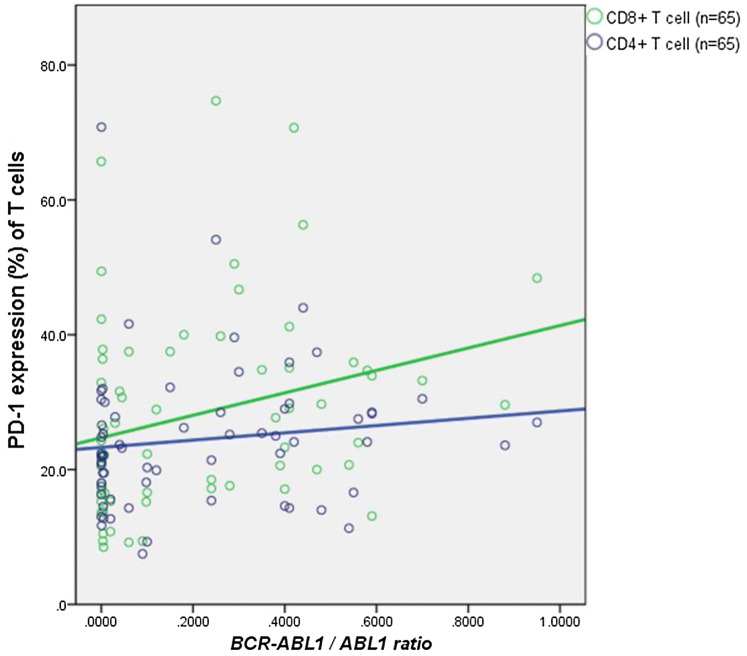
The levels of PD-1 expression on CD8+ T-cells positively correlated with the quantitative levels of BCR/ABL1, detected by RT-PCR in BM (P = 0.024, rho = 0.280) (Fig. 5).
Fig. 5.
Correlation between PD-1 expression on T-cell subsets and BCR/ABL1 quantification results. PD-1 expression level on CD8+ T-cells was positively related to BCR/ABL1 quantification results, but PD-1 expression level on CD4+ T-cells had no relationship with BCR/ABL1 quantification results
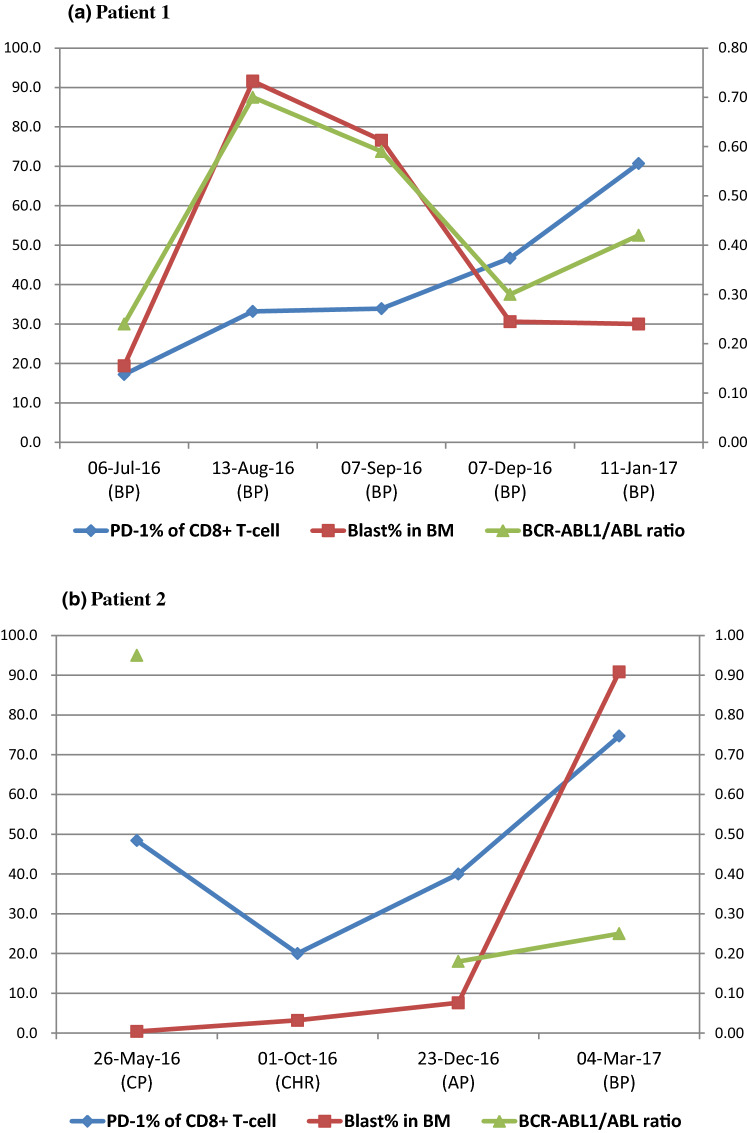
When 2 individual CML patients were assessed serially, the phase of the disease and percentage of PD-1 expression on CD8+ T-cells were found to be related. Patient 1 was diagnosed CML 10 years ago and kept CHR state with imatinib therapy. At the beginning of this study, the patient relapsed, E275K mutation was detected within BCR-ABL1 gene, and the treatment changed from imatinib to dasatinib. During this study, he remained in BP, although the blast count was variable. PD-1 tended to increase continuously, while the level of BCR/ABL1 was proportional to the number of blasts (Fig. 6a). Patient 2 had progressed to BP consisting of lymphoblasts after reaching CHR. The level of BCR/ABL1 did not change significantly in AP and BP after reaching CHR. PD-1 decreased significantly from 48.4% at diagnosis (in CP) to 20.0% at CHR and then increased up to 40.0% in AP and 74.7% in BP (Fig. 6b).
Fig. 6.
Serial data of PD-1 expression levels on CD8+ T-cells for two CML patients according to the change in disease phases during follow-up. PD-1 expression was shown to be weakly related to BCR/ABL1 quantification than blast percentage in BM but seemed to be better related to prediction of disease progression. Abbreviations: BP blast phase, CP chronic phase, CHR complete hematologic response, AP accelerated phase
Expression percentage of PD-1 on CD4+ T-cells
The median expression level of PD-1 on CD4+ T-cells for the CML patients in CHR was 21.3% (20.3–26.7%). The patients in BP had a higher expression percentage of PD-1 on CD4+ T-cells (29.5%, 22.4–43.2%, P < 0.001) than the patients in CHR. The expression of PD-1 on CD4+ T-cells was lowest in CHR patients and tended to increase in CP (25.0%, 20.8–28.5%), AP (26.2%), and BP in ascending order, but the statistical significance was shown only between CHR patients and BP patients (Fig. 7).
Fig. 7.
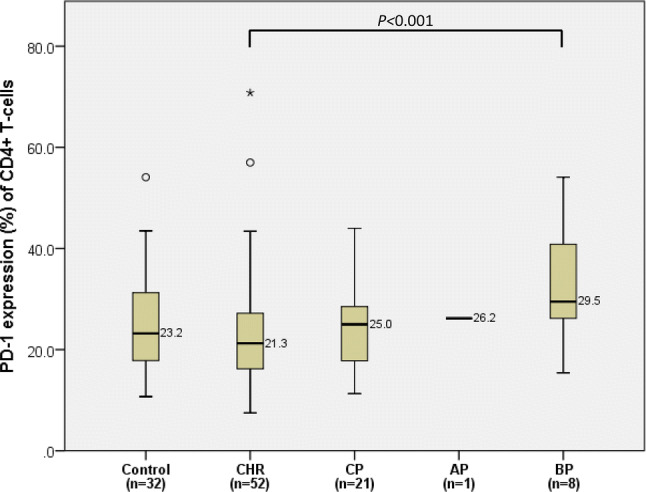
Comparison of PD-1 expression on CD4+ T-cells between BM controls and CML patients in complete hematologic response (CHR), in chronic phase (CP), in accelerated phase (AP), and blast phase (BP). In each box plot, the median value is reported besides the box. The upper, lower ends, and inner lines of the boxes correspond to the 3rd quartile, 1st quartile, and median values, respectively. Error bars denote minimum and maximum values, and circles and stars indicate outlier values. One patient in AP was excluded from the statistical analysis and only denoted in the figure
There was no statistical significance between expression levels of PD-1 on CD4+ T-cells and different medications or quantitative levels of BCR/ABL1 fusion gene.
Discussion
In the area of cancer therapy, the paradigm has shifted. Cancer therapy targets tumor cells and involves cytokines to turn on immune responses. Moreover, it works by blocking inhibitory pathways that limit anti-tumor immune responses. In immunotherapy, it is important to understand the fundamental mechanisms of T-cell activation and its regulation in the course of cancer-specific immunity, and to be able to target more immunogenic cells. CML is known to be an immunogenic tumor [11]. In CML, the immune system has long been considered to be important in malignant transformations as well as in therapeutic efficacy of allogenic hematopoietic stem cell transplantation and donor lymphocyte infusion-mediated graft-versus-leukemia effects [12]. The immune checkpoint is the central concept of the cancer immune system, and some antibodies targeting immune checkpoints were approved by the Food and Drug Administration (FDA) for the treatment of melanoma, lung cancer, and renal cell carcinoma. Although the importance of checkpoints has been growing in the field of hematologic malignancy, sufficient studies have not been reported, and the same is true for CML.
In one study showing differences in PD-1 expression according to Sokal score, the expression of PD-1 on CD8+ T-cells was significantly higher in the high-risk group than in the control group [7]. A study in Australia recently showed that PD-1 expression in CD8+ T-cells was high in CML patients and returned to levels similar to that of healthy individuals after reaching a molecular response through treatment [8]. We also found that the expression of PD-1 in CML was more dominant in CD8+ T-cells than in CD4+ T-cells, while on the discussion of T-cells in tumors, the so-called tumor infiltrating lymphocytes, CD8+ memory T-cells are known to be the key denominator for overall survival. As CD8+ T-cells seem to be more simplified in function than CD4+ T-cells, the clinical impact of CD8+ T memory cells is striking and obviously suggests their in situ function as direct cancer cell killers. For CML patients having CHR, the expression of PD-1 on CD8+ T-cells was lower than in patients at other disease phases (CP, AP, and BP), as well as significantly lower than in the controls. These results suggest that CD8+ T-cells play a crucial role in the treatment of CML and also emphasizes the importance of lowering the expression of PD-1 in order to control the disease.
In this study, the expression of PD-1 on CD8+ T-cells is not only dependent on the phase of the disease, but also the leukemic cell burden. A quantification of BCR-ABL1 mRNA performed by qRT-PCR represents the most sensitive tool for the assessment of the disease status, particularly the measurable residual disease [13]. The present study shows the positive correlation between PD-1 expression levels on CD8+ T-cells and BCR-ABL1/ABL1 ratio. According to a previous study by Mumprecht et al., the level of PD-1 expression did not correlate with the quantitative level of BCR/ABL1, contrary to our results [14]. In that study, they used peripheral blood samples, and the number of CML patients involved in the analysis was relatively small (n = 8).
Additionally, we analyzed two patients having the serial data of PD-1 expression on CD8+ T-cells and BCR/ABL1 quantifications to assess the change of PD-1 expression longitudinally. One patient was continuously in the blast phase of CML. The BCR-ABL1/ABL1 ratio almost matched the blast percentage in BM. PD-1 expression continuously increased from 17.20 to 70.70% (Fig. 6a). Another patient who was in CP at the diagnosis of CML reached CHR and then deteriorated to AP and BP. In this case, the change in the BCR-ABL1/ABL1 ratio was relatively small, even in the blast phase. However, the expression of PD-1 was greatly increased during aggravation to AP and BP (Fig. 6b). These results suggest that the expression level of PD-1 on CD8+ T-cells reflects the phase of the disease, as well as the quantification results of BCR/ABL1, in advance. It implies that PD-1 can reflect the patient’s immune status and predict the disease course, because it is present in lymphocytes that constitute the tumor's microenvironment. The previous two cases support this implication.
TKI therapy targeting BCR-ABL1 represents the current gold standard for the treatment of CML. In this study, all the follow-up patients were treated by TKI therapy. TKIs are known to affect the immune system in some ways. TKI-mediated immunomodulatory effects conferring immune system reactivation have also been reported in CML and gastrointestinal stromal tumor patients [15]. Since TKI therapy affects many complex stages of the immune system, its mechanism has not been clarified and there are many controversies. Balanchandran et al. reported that within the tumors, imatinib was shown to increase the number of activated CD8+ T-cells and decrease the frequency of regulatory T-cells (Treg) [16]. Pauken et al. revealed that the loss of PD-1 in CD8+ T-cells independently contributes to the immunity and clears tumor cells by increasing the ratio of CD8+ T-cells to Treg [17]. In dasatinib-treated patients, CD8+ T-cells showed less than 20% expression of PD-1 [18]. Dasatinib-induced lymphocytosis may also be responsible for the lowering of PD-1 expression. Our study showed that the PD-1 expression in CD8+ T-cells decreased in both the imatinib-treated and dasatinib-treated patients, regardless of the responsiveness to the medication. In nilotinib-treated patients, the PD-1 expression on CD8+ T-cells was not different from that in CML patients who did not start treatment. A recent study using multiplex immunohistochemistry showed similar results. They found a decrease in PD-1 on CD8+ T-cells after starting TKI therapy, as compared to that at diagnosis. They stated the trend was similar to imatinib, dasatinib, and nilotinib, although statistical significance was not reached due to small sample size. The decrease in PD-1 expression was much lesser after nilotinib administration than after the use of other TKIs [19]. We confirmed this trend with statistical significance with adequate number of CML patients. The difference of PD-1 expression by imatinib, dasatinib, and nilotinib in this and Brück et al.’s studies, which were conducted on CML patients, is expected to be due to the immune modulatory effect depending on TKI therapeutic dose. Imatinib and dasatinib showed inhibitory effects on immunosuppressive pathways at therapeutically relevant concentrations [20, 21]. However, nilotinib had immunomodulatory effects at concentrations of greater than 10 μM, which exceeded the mean serum levels achieved in patients to whom nilotinib was administered [22].
There is a limitation to our study. The control group in this study is not healthy control. Because it is very difficult to obtain BM specimens of healthy patients, among patients who underwent BM study due to cytopenia or fever unknown origin, the patients whose BM had no hematologic malignancies and were reported as normo/hypo/hypercellular marrow or immune thrombocytopenic purpura were designated as controls. It would be helpful, if future research using fully healthy population such as BM specimens from donors for BM transplantation could be conducted. However, the focus of this study is on showing differences in each disease stage or drug use among patients with CML rather than between controls and patients with CML. Care should be taken in the interpretation when compared to controls.
In conclusion, low expression of PD-1 on CD8+ T-cells plays a role in maintaining CHR in CML. Immune monitoring through the measurement of PD-1 expression on CD8+ T-cells may predict the course of the disease. Imatinib and dasatinib lowered the expression of PD-1 on CD8+ T-cells, while nilotinib did not at the clinical relevant dose. It might be helpful to use immune checkpoint inhibitors along with nilotinib which seems to have less effect on downregulation of PD-1 expression on CD8+ T-cells. In the case of refractory disease or resistance to imatinib or dasatinib, the use of immune checkpoints inhibitors would be helpful.
Acknowledgements
The authors would like to thank Chan Hee Yoon, MT, and Sang Hee Han, MT, in the department of laboratory medicine in Asan Medical Center for technical assistance with flow cytometry. Portions of this study have been published in Abstract Book at the 24th Congress of the European Hematology Association, Amsterdam, The Netherlands, on June 13–16, 2019 [23].
Abbreviations
- AP
Accelerated phase
- BP
Blastic phase
- CHR
Complete hematologic response
- CP
Chronic phase
Author contributions
CP and YC designed the study, and ML wrote the paper. ML and EY carried out the data management and analysis. SJ, CS, ES, EC, and JL provided study materials or patients. All authors have agreed with the final version of the paper.
Funding
This study was supported by a Grant (2016–635) from the Asan Institute for Life Science, Asan Medical Center, Seoul, Korea.
Data availability
The datasets used and analyzed during the current study are available from the corresponding author on reasonable request.
Compliance with ethical standards
Ethics approval
This study was approved by the institutional review board of Asan Medical Center (Approval number: 20161087) and was performed in accordance with the Declaration of Helsinki.
Conflicts of interest
No potential conflicts of interest relevant to this article were reported.
Footnotes
Publisher's Note
Springer Nature remains neutral with regard to jurisdictional claims in published maps and institutional affiliations.
Chan-Jeoung Park and Young-Uk Cho have contributed equally to this study.
Contributor Information
Chan-Jeoung Park, Email: cjpark@amc.seoul.kr.
Young-Uk Cho, Email: yucho@amc.seoul.kr.
References
- 1.Fife BT, Bluestone JA. Control of peripheral T-cell tolerance and autoimmunity via the CTLA-4 and PD-1 pathways. Immunol Rev. 2008;224:166–182. doi: 10.1111/j.1600-065X.2008.00662.x. [DOI] [PubMed] [Google Scholar]
- 2.Butte MJ, Keir ME, Phamduy TB, Sharpe AH, Freeman GJ. Programmed death-1 ligand 1 interacts specifically with the B7–1 costimulatory molecule to inhibit T cell responses. Immunity. 2007;27:111–122. doi: 10.1016/j.immuni.2007.05.016. [DOI] [PMC free article] [PubMed] [Google Scholar]
- 3.Francisco LM, Sage PT, Sharpe AH. The PD-1 pathway in tolerance and autoimmunity. Immunol Rev. 2010;236:219–242. doi: 10.1111/j.1600-065X.2010.00923.x. [DOI] [PMC free article] [PubMed] [Google Scholar]
- 4.Keir ME, Butte MJ, Freeman GJ, Sharpe AH. PD-1 and its ligands in tolerance and immunity. Annu Rev Immunol. 2008;26:677–704. doi: 10.1146/annurev.immunol.26.021607.090331. [DOI] [PMC free article] [PubMed] [Google Scholar]
- 5.Patel SP, Kurzrock R. PD-L1 expression as a predictive biomarker in cancer immunotherapy. Mol Cancer Ther. 2015;14:847–856. doi: 10.1158/1535-7163.MCT-14-0983. [DOI] [PubMed] [Google Scholar]
- 6.Hughes A, Yong AS. Immune effector recovery in chronic myeloid leukemia and treatment-free remission. Front Immunol. 2017;8:469. doi: 10.3389/fimmu.2017.00469. [DOI] [PMC free article] [PubMed] [Google Scholar]
- 7.Christiansson L, Söderlund S, Svensson E, Mustjoki S, Bengtsson M, Simonsson B, Olsson-Strömberg U, Loskog AS. Increased level of myeloid-derived suppressor cells, programmed death receptor ligand 1/programmed death receptor 1, and soluble CD25 in Sokal high risk chronic myeloid leukemia. PLoS ONE. 2013;8:e55818. doi: 10.1371/journal.pone.0055818. [DOI] [PMC free article] [PubMed] [Google Scholar]
- 8.Hughes A, Clarson J, Tang C, Vidovic L, White DL, Hughes TP, Yong AS (2017) CML patients with deep molecular responses to TKI have restored immune effectors, decreased PD-1 and immune suppressors. Blood:blood-2016–2010–745992 [DOI] [PubMed]
- 9.Pallera A, Altman JK, Berman E, Abboud CN, Bhatnagar B, Curtin P, DeAngelo DJ, Gotlib J, Hagelstrom RT, Hobbs G. NCCN guidelines insights: chronic myeloid leukemia, version 1.2017. J Natl Compr Cancer Netw. 2016;14:1505–1512. doi: 10.6004/jnccn.2016.0162. [DOI] [PubMed] [Google Scholar]
- 10.WHO Classification of Tumours of Haematopoietic and Lymphoid Tissues (2017). Media centre—IARC news
- 11.Vonka V, Petráčková M. Immunology of chronic myeloid leukemia: current concepts and future goals. Expert Rev Clin Immunol. 2015;11:511–522. doi: 10.1586/1744666X.2015.1019474. [DOI] [PubMed] [Google Scholar]
- 12.Yong AS, Keyvanfar K, Eniafe R, Savani BN, Rezvani K, Sloand EM, Goldman JM, Barrett AJ. Hematopoietic stem cells and progenitors of chronic myeloid leukemia express leukemia-associated antigens: implications for the graft-versus-leukemia effect and peptide vaccine-based immunotherapy. Leukemia. 2008;22:1721. doi: 10.1038/leu.2008.161. [DOI] [PMC free article] [PubMed] [Google Scholar]
- 13.Baccarani M, Pileri S, Steegmann J-L, Muller M, Soverini S, Dreyling M, Group EGW Chronic myeloid leukemia: ESMO clinical practice guidelines for diagnosis, treatment and follow-up. Ann Oncol. 2012;23:vii72–vii77. doi: 10.1093/annonc/mds228. [DOI] [PubMed] [Google Scholar]
- 14.Mumprecht S, Schürch C, Schwaller J, Solenthaler M, Ochsenbein AF. Programmed death 1 signaling on chronic myeloid leukemia–specific T cells results in T-cell exhaustion and disease progression. Blood. 2009;114:1528–1536. doi: 10.1182/blood-2008-09-179697. [DOI] [PubMed] [Google Scholar]
- 15.Kreutzman A, Porkka K, Mustjoki S. Immunomodulatory effects of tyrosine kinase inhibitors. Int Trends Immun. 2013;1:17–28. [Google Scholar]
- 16.Balachandran VP, Cavnar MJ, Zeng S, Bamboat ZM, Ocuin LM, Obaid H, Sorenson EC, Popow R, Ariyan C, Rossi F. Imatinib potentiates antitumor T cell responses in gastrointestinal stromal tumor through the inhibition of Ido. Nat Med. 2011;17:1094. doi: 10.1038/nm.2438. [DOI] [PMC free article] [PubMed] [Google Scholar]
- 17.Pauken KE, Juneja V, McGuire K, LaFleur M, Kuchroo J, Sage P, Chevrier N, Freeman GJ, Sharpe AH. CD8+ T cell-independent mechanisms of PD-1-mediated suppression of anti-tumor immunity in mice. Am Assoc Immnol. 2017;198(205):11. [Google Scholar]
- 18.Kreutzman A, Ladell K, Koechel C, Gostick E, Ekblom M, Stenke L, Melo T, Einsele H, Porkka K, Price D. Expansion of highly differentiated CD8+ T-cells or NK-cells in patients treated with dasatinib is associated with cytomegalovirus reactivation. Leukemia. 2011;25:1587. doi: 10.1038/leu.2011.135. [DOI] [PubMed] [Google Scholar]
- 19.Brück O, Blom S, Dufva O, Turkki R, Chheda H, Ribeiro A, Kovanen P, Aittokallio T, Koskenvesa P, Kallioniemi O. Immune cell contexture in the bone marrow tumor microenvironment impacts therapy response in CML. Leukemia. 2018;32:1643–1656. doi: 10.1038/s41375-018-0175-0. [DOI] [PubMed] [Google Scholar]
- 20.Larmonier N, Janikashvili N, LaCasse CJ, Larmonier CB, Cantrell J, Situ E, Lundeen T, Bonnotte B, Katsanis E. Imatinib mesylate inhibits CD4+ CD25+ regulatory T cell activity and enhances active immunotherapy against BCR-ABL− tumors. J Immunol. 2008;181:6955–6963. doi: 10.4049/jimmunol.181.10.6955. [DOI] [PMC free article] [PubMed] [Google Scholar]
- 21.Fei F, Yu Y, Schmitt A, Rojewski MT, Chen B, Götz M, Döhner H, Bunjes D, Schmitt M. Dasatinib inhibits the proliferation and function of CD4+ CD25+ regulatory T cells. Br J Haematol. 2009;144:195–205. doi: 10.1111/j.1365-2141.2008.07433.x. [DOI] [PubMed] [Google Scholar]
- 22.Fei F, Yu Y, Schmitt A, Rojewski MT, Chen B, Greiner J, Götz M, Bunjes D, Schmitt M. Effects of nilotinib on regulatory T cells: the dose matters. Mol Cancer. 2010;9:22. doi: 10.1186/1476-4598-9-22. [DOI] [PMC free article] [PubMed] [Google Scholar]
- 23.Lee M, Park C-J, Cho Y-U, Jang S. Expression levels of PD-1 on T cells in chronic myloid leukemia: PB1936. HemaSphere. 2019;3:880–881. doi: 10.1097/01.HS9.0000566240.73600.4a. [DOI] [Google Scholar]
Associated Data
This section collects any data citations, data availability statements, or supplementary materials included in this article.
Data Availability Statement
The datasets used and analyzed during the current study are available from the corresponding author on reasonable request.


