

Abstract
Myeloid-derived suppressor cells (MDSC) are believed to play a role in immune suppression and subsequent failure of T cells to mount an efficient anti-tumor response, by employing both direct T-cell inhibition as well as induction of regulatory T cells (Tregs). Investigating the frequency and function of immune suppressive cell subsets in the peripheral blood of 41 patients with prostate cancer (PC) and 36 healthy donors (HD) showed a significant increase in circulating CD14+ HLA-DRlow/neg monocytic MDSC (M-MDSC) and Tregs in patients with PC compared to HD. Furthermore, M-MDSC frequencies correlated positively with Treg levels. In vitro proliferation assay with autologous T cells confirmed M-MDSC-mediated T-cell suppression, and intracellular staining of immune suppressive enzyme iNOS revealed a higher expression in M-MDSC from patients with PC. Increased frequencies of M-MDSC correlated with known negative prognostic markers in patients with PC including elevated levels of lactate dehydrogenase and prostate-specific antigen. Accordingly, high levels of M-MDSC were associated with a shorter median overall survival. Our data strongly suggest that M-MDSC, possibly along with Tregs, play a role in establishing an immune suppressive environment in patients with PC. Moreover, correlation of M-MDSC frequency with known prognostic markers and the observed impact on OS could reflect a possible role in tumor progression. Further insight into the generation and function of MDSC and their interplay with Tregs and other cell types may suggest ways to tackle their induction and/or function to improve immunological tumor control.
Electronic supplementary material
The online version of this article (doi:10.1007/s00262-014-1591-2) contains supplementary material, which is available to authorized users.
Keywords: Myeloid-derived suppressor cells, MDSC, Regulatory T cell, Treg, Prostate cancer, PSA
Introduction
Prostate cancer (PC) is the most frequent type of male cancer and only second to lung cancer as the most common cancer-related cause of death in the male population in the western world [1]. Approximately, 30 % of all cases presenting with localized PC will eventually progress and metastasize, often leading to involvement of the skeleton. Plasma concentrations of prostate-specific antigen (PSA) correlate with tumor volume in localized PC, and PSA levels are used as a surrogate marker for the tumor burden when performing clinical evaluations in both the local- and metastatic setting [2]. The primary treatment of metastatic PC is androgen-deprivation therapy (ADT), and in the majority of patients, this provides a temporary control of the disease. Nevertheless, despite this initial response to ADT cancer cells eventually become castration resistant resulting in disease progression.
In the recent years, several immune therapies have been investigated for the treatment of PC. Importantly, results from the clinical trials leading to the approval of Sipuleucel-T by the U.S. Food and Drug Administration (FDA) [3], demonstrated that immune therapies may significantly impact overall survival (OS) in patients with castration resistant metastatic PC (mCRPC). PROSTVAC-VF is a newer recombinant viral vector-based cancer vaccine. Results from a randomized phase II trial involving patients with asymptomatic or minimal symptomatic mCRPC failed to demonstrate an improvement in progression-free survival, but in line with the results from the Sipuleucel-T trials, a significant benefit in OS was seen [4]. A randomized phase III trial with OS as the primary endpoint is now ongoing (NCT01322490). Available data thus suggest that mCRPC can be targeted by the immune system, with some clinical impact. However, it has been speculated that lack of more powerful and durable clinical benefits of therapeutic vaccination may be accredited to an immune suppressive tumor microenvironment, blunting the activation/function of induced anti-tumor immunity [5].
In the past decade, myeloid-derived suppressor cells (MDSC) have been under intense investigation and MDSC have been shown to accumulate at the tumor site, as well as in the peripheral blood of cancer patients [6, 7]. They have been recognized to play a major role in suppression of anti-tumor immunity by suppressing cells of both the innate and adaptive immune system by a variety of mechanisms. Some MDSC subsets have been shown to express indoleamine 2,3 dioxygenase (IDO), depleting the microenvironment of tryptophan, and through expression of inducible nitric oxide synthase (iNOS) and arginase-1, l-arginine that serves as a substrate for both enzymes, is depleted from the microenvironment [8]. Importantly, T cells are particularly sensitive to amino acid deprivation [9]. In addition, nitric oxide (NO), a product of l-arginine catabolism by iNOS, is in itself able to suppress T-cell function. NO inhibits MHC class II expression on antigen-presenting cells (APCs), thus, inhibiting CD4+ T-cell activation and induces T-cell apoptosis [10].
Regulatory T cells (Tregs) are potent inhibitors of the immune system, important for maintaining peripheral tolerance as well as regulating immune responses, preventing excessive immune activation and autoimmune diseases. Tregs suppress cytotoxic T cells, NK cells, dendritic cells (DCs) and neutrophils directly, both via cell–cell contact and secretion of anti-inflammatory cytokines [11].
Several studies have demonstrated a correlation between MDSC and Tregs in a variety of cancers including glioblastoma [12], hepatocellular- [13] and renal cell carcinoma (RCC) [14], thus linking the two immune suppressive cell subsets in cancer patients. In vitro, MDSC have been shown to indirectly inhibit anti-tumor immunity through the induction of immune suppressive Tregs from both naïve and activated CD4+ T cells [15]. These studies suggest that part of the observed immune suppression by MDSC is mediated through the induction of Tregs and that MDSC and Tregs collaborate in blunting anti-tumor immunity in cancer patients. We therefore studied the frequencies of MDSC and Tregs in the peripheral blood of patients with PC and the immune suppressive function of MDSC. We also aligned with the clinical data of the patients including several known prognostic markers, to investigate any potential correlation between MDSC/Treg and tumor burden.
Materials and methods
Patient material and PBMC isolation
Forty-one patients with PC were included in the project. The project was approved by the local ethics committee, and informed consent was obtained from all patients before participation. All patients had castration-resistant disease and were treated at Department of Oncology at University Hospital Herlev, Denmark. Thirty patients were chemotherapy naïve, and 11 patients were treated with docetaxel 75 mg/m2/q3 weeks in combination with prednisone 5 mg given twice daily a median of 6 months (range 3–19 months) prior to inclusion. Mean age for patients was 72 years (range 57–85, median 70 years). Peripheral blood mononuclear cells (PBMCs) from healthy donors from the blood bank at Rigshospitalet, Copenhagen, Denmark, were used as controls (mean age 38.5 years, estimated range 17–67, median unknown). Blood samples of 60 ml obtained by venipuncture were collected in heparin tubes from each patient and transported at room temperature. Processing was completed within <6 h for all sample specimens. PBMC were isolated by centrifugation with Lymphoprep™ (Axis-Shield PoC)(30 min at 1,200 RPM) and cryopreserved at −150 °C in fecal bovine serum (FBS) (GibcoBRL) + 10 % dimethylsulfoxide (DMSO) (Sigma-Aldrich) using a CoolCell® (Bioscision) gradual freezing device. Cells were thawed in pre-warmed 37 °C RPMI and counted after thawing using trypan blue staining and a microscope. For proliferation assays, cells were sorted directly after PBMC isolation.
Flow cytometry
For analyses of MDSC and Tregs, PBMC were thawed, washed and placed on ice in 100 μL PBS + 2 % FBS. Mouse serum (Jackson ImmunoResearch) was added for 10 min to block unspecific binding of Fc-receptors prior to adding monoclonal antibodies (mAbs). For assessment of MDSC, cells were stained with mAbs CD14-APC-Cy7 (BD), CD15-PB (Biolegend), HLA-DR-PerCP (BD), CD11b-APC (BD), CD33-PE (Dako), CD66b-FITC (BD) and the lineage markers CD3-PE-Cy7 (BD), CD56-PE-Cy7 (BD), CD19-PE-Cy7 (BD). Treg panel consisted of mAbs: CD127-FITC (eBioscience), CD25-APC (eBioscience) CD3-APC-Cy7 (BD), CD4-PerCP (BD), CD49d-PE (BD), CD8-PB (DAKO). In addition, LIVE/DEAD® Fixable Aqua Dead Cell Stain (Invitrogen) was added to both panels to rule out dead cells. CD14+HLA-DR−/low cells were analyzed for expression of iNOS, and T cells for expression of the CD3ζ chain, by intracellular staining (ICS), without any prior stimulation. Once thawed and washed, cells were stained with mouse serum and surface mAbs as described above. mAbs included: HLA-DR-PerCP (BD), Lin-PE-Cy7 (see above), CD14-APC (BD), CD15-PB (Biolegend), for MDSC staining, and CD3-PE-Cy7 (BD), CD4-PerCP (BD), CD8-pacific blue (Dako) for T-cell staining. LIVE/DEAD® Near-Infrared Fixable Dead cell stain (Invitrogen) was included in both panels for dead cell exclusion. Cells were washed once and then fixed and permeabilized over night (ON) with Fixation/Permeabilization buffer and Permeabilization Wash buffer (eBiosciences), according to manufacturer’s instructions. The next day, cells were washed and stained with intracellular mAbs for 20 min on ice: iNOS-PE (Abcam), and CD3ζ (CD247)-FITC (ThermoScientific). Samples were acquired on a BD FACScantoII flow cytometer, and all data analyses were conducted using the BD FacsDiva Software. At least 2 × 10⁵ cells were acquired and recorded for analyses. To reduce inter-assay variation, we included both patient and healthy donor samples for each staining-round. Relevant isotypes were used for all panels of mAbs.
Cell sorting
PBMC were washed twice directly after lymphoprep isolation and stained with 20 µl antibody labeled microbeads (Miltenyi Biotec) according to manufacturer’s recommendations. Effector cells (HLA-DRneg/low CD14+ cells) were obtained by first depleting HLA-DR+ cells (Reference cell population) followed by enrichment of CD14+ cells from the HLA-DRneg/low fraction. The target cell population were obtained by CD14 depletion. Cells were incubated 15 min at 4 °C. Cells were washed and passed through a LS column (MACS®) upon magnetic labeling of cells and placed in a QuadroMACS separator (Miltenyi). Purity of sorted populations was assessed by flow cytometry, according to staining protocol described above using mAbs: HLA-DR-PerCP (BD), CD14-APC-Cy7 (BD), and LIVE/DEAD® Fixable Aqua Dead Cell Stain-Amcyan (Invitrogen).
Proliferation assay
Cells were isolated from patient blood samples as well as healthy donors and sorted as described above. Target cells (CD14 depleted PBMC) were labeled with PKH26 membrane stain (Sigma-Aldrich) according to manufacturer’s recommendations. All cells were resuspended in X-vivo15™ (BioWhittaker) + 5 % human serum (Sigma-Aldrich), counted using trypan blue staining, and held at 4 °C in the darkness until use. A 96-well microtiter plate pre-coated with 0.5ug/ml anti-CD3 (OKT3, eBioscience) was added 5 × 10⁴ target cells; 6 anti-CD3 coated wells served as positive controls, while 6 uncoated wells served as negative controls. CD14+HLA-DRneg/low or HLA-DR+ cells were added in doublets at effector:target ratio 1:1. The plate incubated 6 days at 37 °C, 5 % CO2. Proliferation was assessed by flow cytometry using mAbs: FITC—CD4 (BD Bioscience), PB—CD8 (Dako), and LIVE/DEAD® Fixable Near Infraread Dead Cell Stain (Invitrogen).
Statistical analysis
Statistical analyses were performed using Graphpad Prism v5. We assumed that frequencies of regulatory immune cells in the blood did not follow a normal distribution, and thus analyzed all frequency related data using nonparametric statistical tests. The frequencies were compared using Mann–Whitney test, while correlation analyses of these cell populations and plasma PSA concentration were done using Spearman’s rank correlation test. Survival statistics were analyzed by log rank. Due to small sample size, the use of nonparametric tests would lack power, thus inhibition of T-cell proliferation was analyzed using paired t test. As the effector-, target- and reference cell populations compared originate from the same donor inhibition were assumed to follow a normal distribution. P values below 0.05 were considered significant.
Results
Frequencies of monocytic MDSC are elevated in the peripheral blood of patients with PC
Cryopreserved PBMC from 41 patients with PC and 36 healthy donors were analyzed by flow cytometry. We defined MDSC as HLA-DRlow/neg Lin− CD11b+ CD33+, distinguishing between CD14+ monocytic MDSC (M-MDSC) and CD15+ polymorphonuclear MDSC (PMN-MDSC) (Fig. 1a). For further characterization of PMN-MDSC, we included the CD66b granulocytic marker (Suppl. figure 1). 11 of the 41 patients in this study had received treatment with docetaxel and prednisolon a median of 6 months (range 3–19 months) prior to inclusion in the project (See Table 1 for patient characteristics). Frequencies of M-MDSC in untreated and docetaxel-treated patients did not differ (Suppl. figure 2A) thus we rationed a joining of data from the two groups. Both untreated and docetaxel-treated patients had significantly higher frequencies of circulating M-MDSC compared to healthy donors (P < 0.001, Fig. 1b). We found a slightly higher frequency of PMN-MDSC from patients with PC compared to healthy donors (Suppl. figure 1), however, as PMN-MDSC are highly vulnerable to freeze–thaw cycles (data not shown), we decided to focus our study on M-MDSC.
Fig. 1.
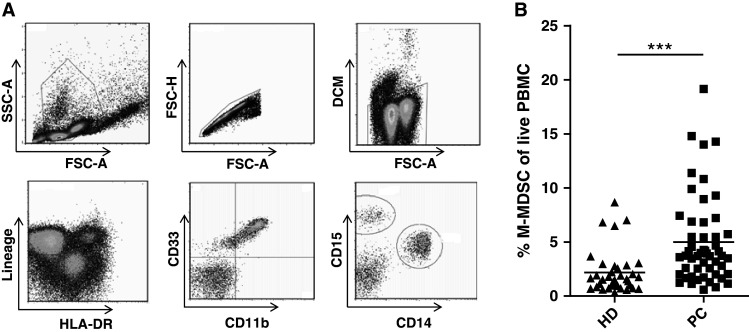
Elevated frequencies of M-MDSC in patients with prostate cancer compared to healthy donors. The frequencies of immune cell subsets were analyzed by flow cytometry of extracellular markers. a Gating strategy of M-MDSC. M-MDSC were gated from live single PBMC by FSC-A/SSC-A, FSC-A/FSC-H and FSC-A/DCM. M-MDSC were identified as Lin− HLA-DRlow/neg CD11b+ CD33+ and CD14+. b Levels of M-MDSC are significantly increased in the peripheral blood of patients with PC (n = 41) compared to healthy donors (n = 36). MDSC frequencies are shown as percentage of the live PBMCs to decrease the effect of inter-population variation. PC prostate cancer, HD healthy donors, DCM dead cell marker. Mann–Whitney test, ***P < 0.0001
Table 1.
Patient characteristics
| Variable/trait | Total (%) | PC (%)a | PC + DO (%) | P value (χ 2 test) |
|---|---|---|---|---|
| No. of patients | 41 (100 %) | 30 (73 %) | 11 (27 %) | 0.71 |
| Age (Median) | 70 | 70 | 71 | |
| Performance status | ||||
| 0 | 19 | 15 (50 %) | 4 (36 %) | 0.13 |
| 1 | 18 | 13 (43 %) | 5 (45 %) | 0.83 |
| 2 | 4 | 2 (7 %) | 2 (18 %) | 0.03 |
| Median Gleason scorea | 8 | 8 | 8 | |
| <7 | 5 (12 %) | 1 (3 %) | 4 (36 %) | <0.01 |
| =7 | 9 (23 %) | 8 (28 %) | 1 (9 %) | <0.01 |
| >7 | 26 (65 %) | 20 (69 %) | 6 (55 %) | 0.21 |
| Bone metastasesa | 35 (85 %) | 24 (80 %) | 11 (100 %) | 0.43 |
| Prior treatment | ||||
| Total androgen blockade | 37 (90 %) | 27 (90 %) | 10 (91 %) | 0.94 |
| Treatment post inclusion | ||||
| Docetaxel (First line) | 28 (68 %) | 26 (96 %) | 2 (18 %) | <0.01 |
| Abiraterone | 20 (49 %) | 16 (53 %) | 4 (36 %) | 0.07 |
| Cabazitaxel | 10 (24 %) | 19 (63 %) | 9 (82 %) | 0.12 |
| positive for negative prognostic factorsa | ||||
| Anemia | 25 (63 %) | 15 (52 %) | 10 (91 %) | <0.01 |
| Serum LDH (elevated) | 18 (45 %) | 13 (45 %) | 5 (45 %) | 1 |
| Alkaline phosphatase (elevated) | 31 (78 %) | 24 (83 %) | 7 (64 %) | 0.12 |
A total of 41 patients were included in this study, 11 of whom had received docetaxel treatment prior to inclusion. P value designates any difference between the untreated (PC) and docetaxel-treated (PC + DO) groups (χ 2 test)
aData on prognostic markers from one patient is unknown
M-MDSC inhibit T-cell proliferation in vitro and express immune suppressive iNOS
We tested whether M-MDSC were able to inhibit the proliferation of autologous T cells stimulated with anti-CD3 antibody. CD14 depleted PBMCs were used as target cells (purity; 97.7–99.8 %) combined with effector cells being either M-MDSCs (CD14+ HLA-DR−/low, purity; 60–75 %) or reference cells (HLA-DR+, purity; 65–86 %). After 6 days in culture, proliferation was assessed by flow cytometry (Fig. 2a). At effector:target ratio of 1:1, we found that isolated M-MDSC significantly inhibited CD4+ T-cell proliferation (P < 0.05, Fig. 2b) compared with a HLA-DR+ reference- and effector population. M-MDSC were able to suppress CD8+ T-cell proliferation less potently (Fig. 2c). Marked inter-assay variation in cell viability at the time of analysis was observed by use of a dead cell marker (data not shown).
Fig. 2.
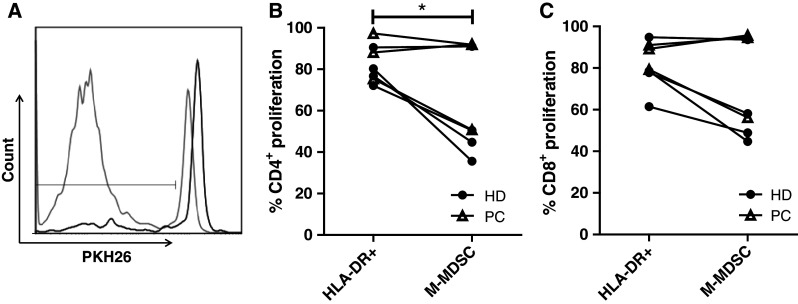
M-MDSC inhibit T-cell proliferation. CD14 depleted target cells were co-cultured with either autologous M-MDSC or HLA-DR+ reference effector cells. Target and effector populations were enriched from freshly isolated PBMC by magnetic activated cell sorting. Target cells were stained with PKH26. a After 6 days in culture, the cells were analyzed by flow cytometry, where a decrease in mean fluorescence intensity (MFI) was a measure of proliferation. CD8+ proliferation in presence of M-MDSC (black) or HLA-DR+ reference population (gray). b CD4+ T-cell proliferation is significantly inhibited by the presence of M-MDSC when compared to HLA-DR+ reference cell (effector:target ratio 1:1), and also c CD8+ T-cell proliferation seem to be suppressed (P = 0.07). Due to limited fresh material n = 7, including 3 patients with PC (triangles) and 4 healthy donors (circles). Paired t test, *P < 0.05
Immune suppressive activity has been associated with high expression of iNOS. Thus, by intracellular staining and flow cytometry, we examined the expression of iNOS in M-MDSC. Due to limited material, only 27 of the 41 patient samples were tested for intracellular expression of iNOS. These included both chemotherapy-naïve (n = 22) and docetaxel-treated patients (n = 5). M-MDSC from both healthy donors and patients with PC express iNOS compared to isotype controls (Fig. 3a); however, we found that expression of iNOS was significantly higher in M-MDSC from patients with PC compared to healthy donors (P < 0.001, Fig. 3b). There was no difference in iNOS expression by M-MDSC between chemotherapy-naïve and docetaxel-treated patients (Suppl. figure 2C). Because iNOS-mediated l-arginine depletion has been implicated to down regulate CD3ζ expression and T-cell dysfunction, we examined the functional status of T cells by intracellular staining of CD3ζ. We found CD3ζ expression by both CD4+ and CD8+ T cells to be similar in patients with PC and healthy donors. In addition, no correlation between M-MDSC frequencies and T-cell expression of CD3ζ was found (data not shown).
Fig. 3.

M-MDSC from patients with PC express higher levels of iNOS. Expression of iNOS was analyzed by intracellular staining and flow cytometry and measured by comparing the mean fluorescence intensity (MFI). a M-MDSC from both PC (black) and HD (gray) express iNOS compared to the isotype (marked by gate), however, b iNOS expression is significantly higher in M-MDSC from patients with PC (n = 27) compared to M-MDSC from healthy donors (n = 17). Both chemotherapy-naïve (n = 22) and docetaxel-treated patients (n = 5) are represented in the PC group. PC prostate cancer patients, HD healthy donors. Mann–Whitney test, ***P < 0.0001
M-MDSC frequencies correlate positively to increased levels of Tregs
Aside from direct inhibition of T cells, MDSC have been shown to indirectly suppress T-cell function through the induction of Tregs. Previous data have shown that >85 % of CD3+ CD4+ CD25hi CD127low cells are in fact also FoxP3+ [16]. Thus, we defined Tregs based on these surface markers (Fig. 4a), which we have previously demonstrated possess regulatory capacity [17]. We found significantly higher frequencies of circulating Tregs in patients with PC when compared to healthy donors (P < 0.05 Fig. 4b). Moreover, we found a significant positive correlation between frequencies of M-MDSC and circulating Treg cells in peripheral blood of patients with PC (P < 0.05, ρ = 0.3 Fig. 4c). This was not the case in healthy donors (data not shown).
Fig. 4.

Elevated frequencies of Treg among PBMC from patient with PC and correlation with frequencies of M-MDSC. Frequencies of circulating Tregs were analyzed by flow cytometry and a were gated as CD3+ CD4+ CD25hi CD127low. b PBMC from patients with PC contains significantly higher levels of Tregs, than those of healthy donors. c Frequencies of M-MDSC correlate positively with the levels of circulating Tregs in the blood from patients with PC (n = 41, P = 0.04, ρ = 0.3). This is not the case in blood from HD. Data analyzed by Spearman’s rank correlation test
Frequencies of M-MDSC in the blood correlate with negative prognostic markers and overall survival in patients with PC
Elevated levels of lactate dehydrogenase, alkaline phosphatase, PSA and anemia are all known prognostic factors in mCRPC [18]. We found that the levels of M-MDSC were significantly higher in patients with three of these negative prognostic factors, compared to patients with ≤1 negative factor (Fig. 5a). In line with this, MDSC frequencies were associated with a high sum of Gleason scores at diagnosis, though not reaching statistical significance (Fig. 5b). We observed a significant positive correlation with levels of PSA and M-MDSC frequency (Fig. 5c), P < 0.05, ρ = 0.4). Because four patients had exceptionally high PSA levels, we tested whether these four outliers might have biased the statistical analysis. However, when excluding the four outliers, our data still showed a significant positive correlation (data not shown). In light of M-MDSC frequencies being associated with a poor prognosis in this study population, we also investigated a possible impact on OS. Patients were stratified into groups of low M-MDSC levels (below the mean) and high M-MDSC levels (above the mean). When comparing these two groups, high levels of M-MDSC tended to correlate with a poorer median OS (19 vs. 33 months, P = 0.12, log rank). Due to the small sample size, OS was not adjusted known prognostic factors.
Fig. 5.

M-MDSC levels correlate with negative prognostic markers, plasma PSA and decreased overall survival. Stratifying patients into groups; a harboring ≤1 (n = 17), 2 (n = 11) or 3 (n = 13) independently negative prognostic markers, and b according to low (<7, n = 5), intermediate (7, n = 10) or high (>7, n = 25) sum of Gleason score at diagnoses, compared to frequencies of M-MDSC. *P < 0.05 Mann–Whitney test. Error bars designate standard error of the mean. c Positive correlation between frequency of circulating M-MDSC and PSA levels in patients with PC. Four patients with exceptionally high PSA levels were excluded; however, correlation between M-MDSC frequencies and PSA levels is still significant (Spearman’s rank; All patients included, n = 41, P = 0.02, ρ = 0.4. Without the 4 outliers n = 38, P = 0.03 ρ = 0.3). d Patients stratified according to M-MDSC frequencies above (high, n = 16) or below (low, n = 25) the mean. High M-MDSC levels tend to impact OS in patients with PC; 19 months versus 33 months (P = 0.13)
Of note, the level of circulating Tregs neither correlated with any of the negative prognostic factors mentioned, nor the sum of Gleason scores. However, levels of Tregs showed a tendency toward a correlation with plasma levels of PSA without impacting OS (Suppl. figure 3 A-D).
Discussion
Over the past few years, MDSC have been intensely studied in mice models of cancer as well as in cancer patients. MDSC are a heterogeneous population of cells consisting of immature myeloid cells, immature granulocytes, immature DC and immature monocytes. In mice, MDSC are characterized by co-expression of CD11b and GR-1 [19]. However, discerning MDSC in humans, is made difficult by the lack of specific markers, and the heterogeneity of MDSC makes their characterization complicated [7]. To underline the heterogeneity of MDSC in humans, Walter et al. [20] report the accumulation of 6 different MDSC subtypes in the blood of patients with RCC. Interestingly, elevated frequencies of two of the subtypes, one being CD14+ HLA-DRlow/neg M-MDSC, negatively associated with overall survival. This suggests that M-MDSC have an impact on cancer progression and response to immune therapy. To this end, we studied the levels of CD14+ HLA-DRlow/neg M-MDSC among PBMC from patients with PC and found increased levels of M-MDSC in patients compared to HD. Very few studies have scrutinized MDSC in PC, however, two recent studies demonstrated that M-MDSC frequencies are elevated among PBMC in patients with PC [21, 22]. Direct comparison of our data with those of the two studies is not possible since we report M-MDSC frequencies as percentage of live PBMC (of 200,000 acquired events per sample), whereas Vuk-Pavlović et al. reported frequencies of M-MDSC as percentage of CD14 + cells and Brusa et al. report frequencies as percentages of 10,000 events of an undescribed population. One could argue that the smaller the reference population, the greater the risk of bias by fluctuations in leukocyte subpopulations. Nonetheless, although there are differences in the groups of patients analyzed between our studies, and the way of reporting M-MDSC frequencies, the data in both cases support our findings.
Due to the mentioned difficulties in selecting appropriate markers used to study MDSC, suppressive activity is vital for characterization of MDSC. MDSC can utilize a wide variety of suppressive mechanisms. Their means of suppression depends both on the subtype of MDSC and on the cancer in which they are found, and often includes more than a single mechanism [7, 23]. We examined the immune suppressive function of M-MDSC and found that M-MDSC inhibited the proliferation of CD4+ and CD8+ T cells. It was clear that M-MDSC from some individuals were more suppressive than those isolated from others. We observed a large inter-assay variation of cell viability after the 6 days of culture. It could be speculated that some cell populations are more prone to cell death during the culture. Another aspect to consider is the varying purity of the enriched effector cell populations (HLA-DR+ and CD14+ HLA-DRlow/neg cells), which may have affected the results.
Functional testing of M-MDSC reported here was carried out using freshly isolated PBMC, because in our hands attempts at using M-MDSC isolated from cryopreserved PBMC were unsuccessful (data not shown). A recent study by Kotsakis et al. (2012) documents how cryopreservation/thawing of PBMC affects the functionality of MDSC, abolishing the suppressive activity compared to the use of fresh PBMC from the same donor [24]. In line with this, previous data showing that M-MDSC from patients with PC-mediated T-cell suppression were performed using fresh material, in a membrane labeling assay similar to ours [21]. This warrants for harmonization of material used for the functional testing of MDSC.
We further investigated the means of suppression and found a significant increase in iNOS expression in M-MDSC from patients with PC, when compared to healthy donors. This could indicate that M-MDSC from cancer patients are more potent inhibitors of T-cell function, than M-MDSC from healthy donors. Indeed, in similar studies of M-MDSC function, CD14+ HLA-DRlow/neg M-MDSC from patients with malignant melanoma [25], PC [21], and multiple myeloma [26] were shown to possess more pronounced inhibitory capacity compared to healthy donors. However, due to limited fresh material, we were unable to show this in a functional assay.
iNOS is an enzyme producing NO by metabolism of l-Arginine. The depletion of l-arginine in the tumor microenvironment has been shown to induce down regulation of CD3 ζ chain on T cells, thus rendering the T cells unresponsive [27]. Down regulation of CD3 ζ on T cells has been observed in a variety of cancers and has been suggested as a biomarker for poor prognosis in cancer patients [28]. However, reports of CD3 ζ chain expression in PBMC from patients with PC are contradictory. We found CD3 ζ chain expression to be similar in PBMC from patients with PC and healthy donors. This is supported by data from Bronte et al. [29], whereas Meidenbauer et al. [30] reported that down regulation of CD3 ζ chain was rescued by vaccination in patients with PC. In the study by Bronte et al., PBMC were obtained from patients undergoing radical prostatectomy, whereas the patient group in Meidenbauer’s study had undergone previous surgery, chemotherapy or radiotherapy. Thus, the patients in the latter study were at a later stage of their disease, which may explain the difference in CD3 ζ chain expression, on the condition that CD3 ζ down regulation is stage dependent. Another explanation could be differences in the handling of blood samples before processing for PBMC. Afonso et al. [31] suggested that the CD3 ζ chain was down regulated on PBMC isolated later than 3 h post venipuncture, as a result of activated granulocytes in the blood sample, rendering the T cells less responsive. Moreover, iNOS may suppress the immune system by other mechanisms than depletion of l-arginine.
We observed increased frequencies of circulating Tregs compared to healthy donors, supporting previous findings in patients with PC [32]. Tregs have been implicated in tumor progression and in blunting of anti-tumor responses [33], while others report that T-cell tolerance and clinical response to anti-cancer vaccines in prostate cancer is independent of Tregs [32].
We have found that frequencies of two distinct immune suppressive subsets, M-MDSC and Tregs, are increased in patients with PC. A link between the two has been suggested, as in vitro studies have demonstrated CD14+ HLA-DRneg/low M-MDSC are capable of inducing Tregs in co-culture with autologous CD4 + T cells [15, 34]. This is supported by studies showing a positive correlation between MDSC frequencies and circulating Tregs in patients with a variety of cancers [35]. We are the first to report that a similar positive correlation between M-MDSC frequencies and circulating Tregs exists in the peripheral blood of patients with PC. Although this correlation is significant, some patients with lower M-MDSC frequencies have a high level of Tregs and vice versa, which suggests that the induction of Tregs may take routes independent of MDSC. It could be speculated that the correlation between M-MDSC and Tregs might be even stronger if correlation to functionally verified M-MDSC was possible; however, this awaits characterization of appropriate surface markers. Moreover, it should be noted that the age of the study group of cancer patients in this (and other studies) is higher than that of the control group. Only very few studies have focused on MDSC and Treg frequencies in old versus young healthy individuals; however, some data have suggested higher frequencies and/or functionality of these suppressor cell types with age [36, 37]. Accordingly, there is a call for studies that compare these cell subsets in aging healthy individuals.
Not only are levels of MDSC increased in the blood of patients with cancer, MDSC frequencies correlate to clinical cancer stage in several cancers including bladder cancer [38] and breast cancer [39], as well as tumor progression in hepatocellular carcinoma [40]. Here, we report that M-MDSC frequencies are significantly positively associated with known negative prognostic factors in patients with mCRPC indicating a possible link between M-MDSC and tumor progression. The observed difference in median OS between patients with high versus low M-MDSC frequencies in the blood supports this possible link, but unfortunately, due to the sample size in this study, we were not able to adjust for known prognostic factors and the sole impact of M-MDSC in regard to OS could therefore not be evaluated. PC cells secrete IL-6 resulting in increased levels of plasma/serum IL-6 [41] and IL-6 have been shown recruit MDSC in a mouse model [42]. Inhibition of IL-6 abrogated the recruitment of MDSCs in tumor-bearing mice and was associated with delayed tumor growth and attenuated angiogenesis. This could suggest that tumor secreted factors recruit MDSC, which in turn suppress anti-tumor immunity. Indeed, Brusa et al. [22] showed that increased frequencies of M-MDSC are directly linked to the presence of tumor in patients with localized PC. They did not find a correlation between M-MDSC levels and plasma PSA; however, quite few patient samples were analyzed.
No single set of markers have been agreed upon for the characterization of Treg, and thus, comparison between studies can be somewhat difficult. FoxP3 has been widely accepted as the Treg marker, because FoxP3 is essential for the differentiation and function of Tregs [43]. However, not all FoxP3+ T cells are Tregs, and thus gating on FoxP3+ T cells may include contaminating effector T cells [44]. We chose to look at CD3+ CD4+ T cells with high expression of CD25 and low or no expression of CD127. This population has been shown to comprise >85 % FoxP3+ Tregs [16]. FoxP3 may be a stronger marker for Tregs, thus gating on CD25hi CD127low/neg, where <15 % of the FoxP3− cells are unaccounted for, could be at the cost of significance.
Regarding OS and Tregs, our findings are in line with a study recently published by Weide et al. [45] showing that increased M-MDSC levels negatively impacted survival in patients with malignant melanoma, whereas Tregs did not.
Although some patients were characterized by relatively few MDSC and a high frequency of Treg or vice versa, the main conclusion drawn from the present study is that there is a connection between induction of suppressor cells and negative prognosis/outcome of disease. Thus, further insight into the cells and molecules involved with induction of MDSC and Treg could lead to development of strategies aiming at targeting of suppressor-induction pathways in combination with immune therapy.
Electronic supplementary material
Below is the link to the electronic supplementary material.
Acknowledgments
The authors thank Kirsten Nikolajsen for technical support and Tobias Wirenfeldt Klausen for assistance with the statistical analyses. Grants from the Danish Cancer Society, The Danielsen Foundation, and Toyota Fonden funded the study.
Conflict of interest
None of the authors have any conflict of interest.
References
- 1.Klotz L, Zhang L, Lam A, et al. Clinical results of long-term follow-up of a large, active surveillance cohort with localized prostate cancer. J Clin Oncol. 2010;28:126–131. doi: 10.1200/JCO.2009.24.2180. [DOI] [PubMed] [Google Scholar]
- 2.Carvalhal GF, Daudi SN, Kan D, et al. Correlation between serum prostate-specific antigen and cancer volume in prostate glands of different sizes. Urology. 2010;76:1072–1076. doi: 10.1016/j.urology.2009.11.056. [DOI] [PMC free article] [PubMed] [Google Scholar]
- 3.Small EJ, Schellhammer PF, Higano CS, et al. Placebo-controlled phase III trial of immunologic therapy with sipuleucel-T (APC8015) in patients with metastatic, asymptomatic hormone refractory prostate cancer. J Clin Oncol. 2006;24:3089–3094. doi: 10.1200/JCO.2005.04.5252. [DOI] [PubMed] [Google Scholar]
- 4.Kantoff PW, Schuetz TJ, Blumenstein Ba, et al. Overall survival analysis of a phase II randomized controlled trial of a Poxviral-based PSA-targeted immunotherapy in metastatic castration-resistant prostate cancer. J Clin Oncol. 2010;28:1099–1105. doi: 10.1200/JCO.2009.25.0597. [DOI] [PMC free article] [PubMed] [Google Scholar]
- 5.Rigamonti N, Bellone M. Prostate cancer, tumor immunity and a renewed sense of optimism in immunotherapy. Cancer Immunol Immunother. 2012;61:453–468. doi: 10.1007/s00262-012-1216-6. [DOI] [PMC free article] [PubMed] [Google Scholar]
- 6.Filipazzi P, Valenti R, Huber V, et al. Identification of a new subset of myeloid suppressor cells in peripheral blood of melanoma patients with modulation by a granulocyte-macrophage colony-stimulation factor-based antitumor vaccine. J Clin Oncol. 2007;25:2546–2553. doi: 10.1200/JCO.2006.08.5829. [DOI] [PubMed] [Google Scholar]
- 7.Poschke I, Kiessling R. On the armament and appearances of human myeloid-derived suppressor cells. Clin Immunol. 2012;144:250–268. doi: 10.1016/j.clim.2012.06.003. [DOI] [PubMed] [Google Scholar]
- 8.Bronte V, Zanovello P. Regulation of immune responses by l-arginine metabolism. Nat Rev Immunol. 2005;5:641–654. doi: 10.1038/nri1668. [DOI] [PubMed] [Google Scholar]
- 9.Habibi D, Jalili RB, Forouzandeh F, et al. High expression of IMPACT protein promotes resistance to indoleamine 2,3-dioxygenase-induced cell death. J Cell Physiol. 2010;225:196–205. doi: 10.1002/jcp.22220. [DOI] [PubMed] [Google Scholar]
- 10.Gabrilovich DI, Nagaraj S. Myeloid-derived suppressor cells as regulators of the immune system. Nat Rev Immunol. 2009;9:162–174. doi: 10.1038/nri2506. [DOI] [PMC free article] [PubMed] [Google Scholar]
- 11.Beyer M, Schultze JL. Regulatory T cells in cancer. Blood. 2006;108:804–811. doi: 10.1182/blood-2006-02-002774. [DOI] [PubMed] [Google Scholar]
- 12.Gustafson MP, Lin Y, New KC, et al. Systemic immune suppression in glioblastoma: the interplay between CD14+ HLA-DRlo/neg monocytes, tumor factors, and dexamethasone. Neuro Oncol. 2010;12:631–644. doi: 10.1093/neuonc/noq001. [DOI] [PMC free article] [PubMed] [Google Scholar]
- 13.Kalathil S, Lugade Aa, Miller A, et al. Higher Frequencies of GARP+ CTLA-4+ Foxp3+ T regulatory cells and myeloid-derived suppressor cells in hepatocellular carcinoma patients are associated with impaired T-Cell functionality. Cancer Res. 2013;73:2435–2444. doi: 10.1158/0008-5472.CAN-12-3381. [DOI] [PMC free article] [PubMed] [Google Scholar]
- 14.Ko JS, Zea AH, Rini BI, et al. Sunitinib mediates reversal of myeloid-derived suppressor cell accumulation in renal cell carcinoma patients. Clin Cancer Res. 2009;15:2148–2157. doi: 10.1158/1078-0432.CCR-08-1332. [DOI] [PubMed] [Google Scholar]
- 15.Hoechst B, Gamrekelashvili J, Manns MP, et al. Plasticity of human Th17 cells and iTregs is orchestrated by different subsets of myeloid cells. Blood. 2011;117:6532–6541. doi: 10.1182/blood-2010-11-317321. [DOI] [PubMed] [Google Scholar]
- 16.Liu W, Putnam AL, Xu-Yu Z, et al. CD127 expression inversely correlates with FoxP3 and suppressive function of human CD4+ T reg cells. J Exp Med. 2006;203:1701–1711. doi: 10.1084/jem.20060772. [DOI] [PMC free article] [PubMed] [Google Scholar]
- 17.Riley CH, Jensen MK, Brimnes MK, et al. Increase in circulating CD4+CD25+Foxp3+ T cells in patients with Philadelphia-negative chronic myeloproliferative neoplasms during treatment with IFN-α. Blood. 2011;118:2170–2173. doi: 10.1182/blood-2011-03-340992. [DOI] [PubMed] [Google Scholar]
- 18.Halabi S, Lin C-Y, Kelly WK, et al. Updated prognostic model for predicting overall survival in first-line chemotherapy for patients with metastatic castration-resistant prostate cancer. J Clin Oncol. 2014;32:671–677. doi: 10.1200/JCO.2013.52.3696. [DOI] [PMC free article] [PubMed] [Google Scholar]
- 19.Bronte V, Wang M, Overwijk WW, et al. Apoptotic death of CD8+ T lymphocytes after immunization: induction of a suppressive population of Mac-1+/Gr-1+ cells. J Immunol. 1998;161:5313–5320. [PMC free article] [PubMed] [Google Scholar]
- 20.Walter S, Weinschenk T, Stenzl A, et al. Multipeptide immune response to cancer vaccine IMA901 after single-dose cyclophosphamide associates with longer patient survival. Nat Med. 2012;18:1254–1261. doi: 10.1038/nm.2883. [DOI] [PubMed] [Google Scholar]
- 21.Vuk-Pavlović S, Bulur Pa, Lin Y, et al. Immunosuppressive CD14+ HLA-DRlow/- monocytes in prostate cancer. Prostate. 2010;70:443–455. doi: 10.1002/pros.21078. [DOI] [PMC free article] [PubMed] [Google Scholar]
- 22.Brusa D, Simone M, Gontero P, et al. Circulating immunosuppressive cells of prostate cancer patients before and after radical prostatectomy: profile comparison. Int J Urol. 2013;20:971–978. doi: 10.1111/iju.12086. [DOI] [PubMed] [Google Scholar]
- 23.Filipazzi P, Huber V, Rivoltini L. Phenotype, function and clinical implications of myeloid-derived suppressor cells in cancer patients. Cancer Immunol Immunother. 2012;61:255–263. doi: 10.1007/s00262-011-1161-9. [DOI] [PMC free article] [PubMed] [Google Scholar]
- 24.Kotsakis A, Harasymczuk M, Schilling B, et al. Myeloid-derived suppressor cell measurements in fresh and cryopreserved blood samples. J Immunol Methods. 2012;381:14–22. doi: 10.1016/j.jim.2012.04.004. [DOI] [PMC free article] [PubMed] [Google Scholar]
- 25.Poschke I, Mougiakakos D, Hansson J, et al. Immature immunosuppressive CD14+ HLA-DR-/low cells in melanoma patients are Stat3hi and overexpress CD80, CD83, and DC-sign. Cancer Res. 2010;70:4335–4345. doi: 10.1158/0008-5472.CAN-09-3767. [DOI] [PubMed] [Google Scholar]
- 26.Ramachandran IR, Martner A, Pisklakova A, et al. Myeloid-derived suppressor cells regulate growth of multiple myeloma by inhibiting T cells in bone marrow. J Immunol. 2013;190:3815–3823. doi: 10.4049/jimmunol.1203373. [DOI] [PMC free article] [PubMed] [Google Scholar]
- 27.Rodriguez PC, Zea AH, Culotta KS, et al. Regulation of T cell receptor CD3zeta chain expression by l-arginine. J Biol Chem. 2002;277:21123–21129. doi: 10.1074/jbc.M110675200. [DOI] [PubMed] [Google Scholar]
- 28.Whiteside TL. Down-regulation of zeta-chain expression in T cells: a biomarker of prognosis in cancer? Cancer Immunol Immunother. 2004;53:865–878. doi: 10.1007/s00262-004-0521-0. [DOI] [PMC free article] [PubMed] [Google Scholar]
- 29.Bronte V, Kasic T, Gri G, et al. Boosting antitumor responses of T lymphocytes infiltrating human prostate cancers. J Exp Med. 2005;201:1257–1268. doi: 10.1084/jem.20042028. [DOI] [PMC free article] [PubMed] [Google Scholar]
- 30.Meidenbauer N, Gooding W, Spitler L, Harris D, Whiteside TL (2002) Recovery of zeta-chain expression and changes in spontaneous IL-10 production after PSA-based vaccines in patients with prostate cancer. Br J Cancer 86(2):168–178 [DOI] [PMC free article] [PubMed]
- 31.Afonso G, Scotto M, Renand A, et al. Critical parameters in blood processing for T-cell assays: validation on ELISpot and tetramer platforms. J Immunol Methods. 2010;359:28–36. doi: 10.1016/j.jim.2010.05.005. [DOI] [PubMed] [Google Scholar]
- 32.Derhovanessian E, Adams V, Hähnel K, et al. Pretreatment frequency of circulating IL-17+ CD4+ T-cells, but not Tregs, correlates with clinical response to whole-cell vaccination in prostate cancer patients. Int J Cancer. 2009;125:1372–1379. doi: 10.1002/ijc.24497. [DOI] [PubMed] [Google Scholar]
- 33.Nishikawa H, Sakaguchi S. Regulatory T cells in tumor immunity. Int J Cancer. 2010;127:759–767. doi: 10.1002/ijc.25429. [DOI] [PubMed] [Google Scholar]
- 34.Hoechst B, Ormandy LA, Ballmaier M, et al. A new population of myeloid-derived suppressor cells in hepatocellular carcinoma patients induces CD4(+)CD25(+)Foxp3(+) T cells. Gastroenterology. 2008;135:234–243. doi: 10.1053/j.gastro.2008.03.020. [DOI] [PubMed] [Google Scholar]
- 35.Mougiakakos D, Choudhury A, Lladser A, et al. Regulatory T cells in cancer. Adv Cancer Res. 2010;107:57–117. doi: 10.1016/S0065-230X(10)07003-X. [DOI] [PubMed] [Google Scholar]
- 36.Gregg R, Smith CM, Clark FJ, et al. The number of human peripheral blood CD4+ CD25high regulatory T cells increases with age. Clin Exp Immunol. 2005;140:540–546. doi: 10.1111/j.1365-2249.2005.02798.x. [DOI] [PMC free article] [PubMed] [Google Scholar]
- 37.Verschoor CP, Johnstone J, Millar J, et al. Blood CD33(+)HLA-DR(-) myeloid-derived suppressor cells are increased with age and a history of cancer. J Leukoc Biol. 2013;93:633–637. doi: 10.1189/jlb.0912461. [DOI] [PMC free article] [PubMed] [Google Scholar]
- 38.Yuan X-K, Zhao X-K, Xia Y-C, et al. Increased circulating immunosuppressive CD14+ HLA-DR-/low cells correlate with clinical cancer stage and pathological grade in patients with bladder carcinoma. J Int Med Res. 2011;39:1381–1391. doi: 10.1177/147323001103900424. [DOI] [PubMed] [Google Scholar]
- 39.Diaz-Montero CM, Salem ML, Nishimura MI, et al. Increased circulating myeloid-derived suppressor cells correlate with clinical cancer stage, metastatic tumor burden, and doxorubicin-cyclophosphamide chemotherapy. Cancer Immunol Immunother. 2009;58:49–59. doi: 10.1007/s00262-008-0523-4. [DOI] [PMC free article] [PubMed] [Google Scholar]
- 40.Arihara F, Mizukoshi E, Kitahara M, et al. Increase in CD14(+)HLA-DR (-/low) myeloid-derived suppressor cells in hepatocellular carcinoma patients and its impact on prognosis. Cancer Immunol Immunother. 2013;62:1421–1430. doi: 10.1007/s00262-013-1447-1. [DOI] [PMC free article] [PubMed] [Google Scholar]
- 41.Azevedo A, Cunha V, Teixeira AL, Medeiros R. IL-6/IL-6R as a potential key signaling pathway in prostate cancer development. World J Clin Oncol. 2011;2:384–396. doi: 10.5306/wjco.v2.i12.384. [DOI] [PMC free article] [PubMed] [Google Scholar]
- 42.Wu C-T, Hsieh C–C, Lin C–C, et al. Significance of IL-6 in the transition of hormone-resistant prostate cancer and the induction of myeloid-derived suppressor cells. J Mol Med. 2012;90:1343–1355. doi: 10.1007/s00109-012-0916-x. [DOI] [PubMed] [Google Scholar]
- 43.Hori S, Nomura T, Sakaguchi S. Control of regulatory T cell development by the transcription factor Foxp3. Science. 2003;299:1057–1061. doi: 10.1126/science.1079490. [DOI] [PubMed] [Google Scholar]
- 44.Kleinewietfeld M, Starke M, Di Mitri D, et al. CD49d provides access to “untouched” human Foxp3+ Treg free of contaminating effector cells. Blood. 2009;113:827–836. doi: 10.1182/blood-2008-04-150524. [DOI] [PubMed] [Google Scholar]
- 45.Weide B, Martens A, Zelba H, et al. Myeloid-derived suppressor cells predict survival of patients with advanced melanoma: comparison with regulatory T cells and NY-ESO-1- or Melan-A-specific T cells. Clin Cancer Res. 2014;20:1601–1609. doi: 10.1158/1078-0432.CCR-13-2508. [DOI] [PubMed] [Google Scholar]
Associated Data
This section collects any data citations, data availability statements, or supplementary materials included in this article.