

Abstract
Renal cell carcinoma (RCC) accounts for 80–95 % of kidney tumors, and approximately 30 % of RCC patients have metastatic disease at diagnosis. Conventional chemotherapy is not effective in patients with metastatic RCC (MRCC); therefore, immunotherapy with interferon-α (IFN-α) has been employed to improve survival. However, the response rate of MRCC to IFN-α therapy is low. We previously reported that a signal transducer and activator 3 (STAT3) polymorphism was a useful diagnostic marker to predict the response to IFN-α therapy in patients with MRCC. Therefore, we hypothesized the inhibition of STAT3 in the addition of IFN-α therapy might be useful. Moreover, the blockage of STAT3 itself has been reported to enhance the antitumor effects. However, because IFN-α is thought to elicit its therapeutic effect via enhancement of an antitumor immune response mediated by lymphocytes that can be activated by IFN-α administrations, it is probable that the suppression of STAT3 in vivo relates to autoimmune disorders. In the present study, we found Y-box binding protein-1 (YB-1) was poorly expressed in T lymphocytes, as compared with cancer tissues. YB-1 was reported to have an important effect on the STAT3 pathway. Suppression of STAT3 by YB-1 inhibition did not seem to enhance the potential risk for autoimmune disorders. Moreover, we found sensitivity to IFN-α was increased by YB-1 suppression, and this suppression did not down-regulate IFN-α activation of T lymphocytes.
Keywords: YB-1, STAT3, Interferon-α, Immunotherapy, Renal cancer
Introduction
Renal cell carcinoma (RCC) accounts for 80–95 % of kidney tumors, and around 30 % of RCC patients have metastatic disease at diagnosis, with a median survival of 12 months [1, 2]; cell carcinomas, which account for 75–85 % of renal tumors, are characterized by the loss of the von Hippel-Lindau tumor-suppressor gene, leading to overexpression of proangiogenic vascular endothelial growth factor and platelet-derived growth factor-β [3]. Conventional chemotherapy is not effective in patients with metastatic RCC (MRCC); therefore, immunotherapy with interferon-α (IFN-α) and/or interleukin-2 (IL-2) has been employed to improve survival. However, the response rate of MRCC to IFN-α therapy is 5–20 % [4].
IFN-α therapy is associated with low response rate and substantial adverse effects; therefore, identification of reliable predictive markers for response to IFN-α is essential in establishing optimal treatment strategies for patients with MRCC. We previously reported that a polymorphism in signal transducer and activator 3 (STAT3) was a useful diagnostic marker to predict the response to IFN-α therapy in patients with MRCC [5]. We also showed that STAT3 expression was reduced in the genotype responding to IFN-α, and suppression of STAT3 by small interfering RNAs (siRNAs) enhanced the inhibitory effect of IFN-α on renal cancer cell proliferation in vitro [5]. STAT3 belongs to a family of commonly expressed proteins and has a dual role as a cytoplasmic mediator of cytokine signaling and nuclear transcription factor [6–8]. STAT3 is constitutively activated at a very high frequency in human cancers and is critical for tumor cell proliferation, survival, angiogenesis, and invasion [9–12]. As a result, blocking of STAT3 activity in tumor cells is a promising strategy to induce the production of proinflammatory cytokines and chemokines, thereby activating innate immune cells, and ultimately prompting antitumor T-cell immune responses. Furthermore, blockage of STAT3 has been reported to enhance these antitumor effects [9, 11, 12]. Therefore, we hypothesized that the inhibition of STAT3 in the addition of IFN-α therapy enhanced this effect. Because IFN-α is thought to elicit its therapeutic effects via enhancement of antitumor immune response mediated by lymphocytes that can be activated by IFN-α, it is probable that the suppression of STAT3 in vivo is associated with autoimmune disorders [13–15]. As STAT3 is an essential negative regulator in the immune system and tissue-specific Stat3 knockout mice exhibit autoimmunity, targeting of STAT3 imposes the potential risk of autoimmune disorders [13–15]. Moreover, we and others reported that regulatory T cells (Tregs) were significantly decreased immediately after the administration of IFN-α [16–18]. Because Tregs play a critical role in preventing autoimmune diseases by suppressing self-reactive T cells, the administration of IFN-α further imposes the potential risk of autoimmune disorders.
We focused on the Y-box binding protein-1 (YB-1); YB-1 controls gene expression is involved in various biological activities such as brain development, chemoresistance, and tumor progression [19–22]. A link between YB-1 and STAT3 has been previously reported; inhibition of YB-1 decreased STAT3 activity, suggesting that YB-1 could have an important effect on the STAT3 pathway [23]. In addition, to our surprise, in the present study, we found YB-1 was poorly expressed in the lymphocytes, as compared with cancer cell lines. Suppression of STAT3 by the inhibition of YB-1 did not seem to enhance the potential risk of autoimmunity disorders, because inhibition of YB-1 did not result in the activation of lymphocytes. We hypothesized that the addition of an YB-1 inhibitor would enhance the therapeutic efficacy of IFN-α in RCC through down-regulation of STAT3 in the tumor and secondary to enhance the same level of T-cell-mediated tumor cytotoxicity, as compared with that of STAT3 inhibitor.
Materials and methods
Chemical
Human lymphoblastoid interferon-α (HLBI) and mouse interferon-α (mIFN-α) were supplied by Dainippon Sumitomo Pharma Co., Ltd. (Osaka, Japan). HLBI and mIFN-α were prepared as previously described [24].
Cell culture and reagents
Human renal cell cancer KG2, KPK13, SKR1, KPK1, and SN12C cells were established and maintained as described previously [25–28]. KG2 cells were kindly gifted from Dr. Kazuo Gohji (Kobe University, Kobe, Japan). Human renal cell cancer Caki-1 cells were cultured in Eagle’s minimal essential medium (Invitrogen, Carlsbad, CA, USA). RENCA was kindly provided by Dr. T. Fujioka (Iwate Medical University, Morioka, Japan). ACHN and 786-O cells were purchased from American Type Culture Collection (Manassas, USA). These cell lines were maintained as previously described [25].
Antibodies
Anti-YB-1 and anti-STAT3 (#4904) antibodies were purchased from Epitomics (Burlingame, CA, USA) and Cell Signaling Technology (Danvers, MA, USA). Anti-β-actin antibody was purchased from Sigma (St. Louis, MO, USA).
Knockdown analysis using small interfering RNAs (siRNAs)
Knockdown analysis using siRNAs was performed as described previously [29, 30]. The following double-stranded 25-bp siRNA oligonucleotides were commercially generated (Invitrogen): 5′-UGGAUAGCGUCUAUAAUGGUUACGG-3′ (sense) and 5′-CCGUAACCAUUAUAGACGCUAUCCA-3′ (antisense) for human YB-1 #1; 5′-UUUGCUGGUAAUUGCGUGGAGGACC-3′ (sense) and 5′-GGUCCUCCACGCAAUUACCAGCAAA-3′ (antisense) for human YB-1 #2; 5′-UGGAUAGCGUCUAUAAUGGUUACGG-3′ (sense) and 5′-CCGUAACCAUUAUAGACGCUAUCCA-3′ (antisense) for mouse YB-1 #1; 5′-UGAAGUUUCGGCGAUACCGACGUUG-3′ (sense) and 5′-CAACGUCGGUAUCGCCGAAACUUCA-3′ (antisense) for mouse YB-1 #2. Renal cancer cells were transfected with 40 nM of the indicated siRNAs using Lipofectamine 2000 (Invitrogen), according to the manufacturer’s protocol.
Cytotoxicity analysis
Cytotoxicity analysis was performed as previously described [29, 30]. Briefly, renal cancer cells (1.5 × 10³) transfected with 40 nM of the indicated siRNA as described above were seeded into 96-well plates. The following day, various concentrations of interferon α were added. After 96 h, the surviving cells were stained using the alamarBlue assay (TREK Diagnostic Systems, Cleveland, OH, USA) for 180 min at 37 °C. Absorbance of each well was measured using a plate reader (ARVO™ MX; PerkinElmer Inc., Waltham, MA, USA).
RNA isolation, reverse transcription, and quantitative real-time PCR
These procedures were performed as previously described [29, 30]. Quantitative real-time PCR using TaqMan Gene Expression Assay for YB-1 (Hs00898625_g1), STAT3 (Hs00374280_m1) and GAPDH (Hs02758991_g1) (Applied Biosystems, Foster City, CA, USA), and TaqMan Gene Expression Master Mix (Applied Biosystems) was performed using ABI 7900HT.
Western blotting
Whole-cell lysates were prepared as previously described [29, 30]. The protein concentration was determined using a Protein Assay Kit (Bio-Rad, Hercules, CA, USA), based on the Bradford method. Whole-cell lysates (30 μg) were separated by SDS–PAGE and transferred to PVDF membranes (GE Healthcare Bio-Science, Piscataway, NJ, USA) using a semi-dry blotter. Blotted membranes were incubated for 1 h at room temperature with a primary antibody. Membranes were then incubated for 40 min at room temperature with a peroxidase-conjugated secondary antibody. Bound antibody was visualized using an ECL kit (GE Healthcare Bio-Science), and membranes were exposed to Kodak X-OMAT film. For the correlation assay, the intensity of each signal was quantified using the NIH Imaging program, version 1.62 (NIH, Bethesda, MD, USA).
Cell proliferation assay
Cell proliferation assay was performed as previously described [29, 30]. Briefly, renal cancer cells (2.5 × 10⁴) were seeded into 12-well plates and transfected with 40 nM of the indicated siRNA. The time point of 12 h after transfection was set as 0 h. Cells were harvested with trypsin and counted daily using a cell counter (Beckman Coulter, Fullerton, CA, USA). The results were normalized by the cell counts at 0 h and are representative of at least three independent experiments.
Flow cytometry analysis for in vitro
Flow cytometry analysis was performed as described previously [29, 30]. Briefly, renal cancer cells (2.0 × 10⁵) were seeded in 6-well plates transfected with 40 nM of the indicated siRNA and cultured for 72 h. Cells were harvested, washed twice with ice-cold PBS containing 0.1 % bovine serum albumin (BSA), and resuspended in 70 % ethanol. After washing twice with ice-cold PBS, cells were resuspended in PBS containing 0.1 % BSA, incubated with RNase (Roche Applied Science, Indianapolis, IN, USA), and stained with propidium iodide (Sigma). Cells were analyzed using a FACS Calibur (BD Biosciences, San Jose, CA, USA).
Animals
Female BALB/c (H-2d) mice (6–8 weeks old) and female NCr-nu/nu mice (6–8 weeks old) were obtained from Charles River Laboratories (Yokohama, Japan).
Challenge with tumor cells
RENCA (5.0 × 10⁶), ACHN (5.0 × 10⁷), and 786-O cells (5.0 × 10⁷) were inoculated subcutaneously (s.c.) into the shaved lateral flanks of the mice. After establishing the injected tumors (usually 7 days after tumor inoculation), mice were randomly divided into four groups. These groups included YB-1 siRNA plus IFN-α (HLBI: 1MU/body, mINF-α: 1 × 10⁴ IU/body), control siRNA plus PBS (no treatment group), control siRNA plus IFN-α (HLBI: 1 MU/body, mINF-α: 1 × 10⁴ IU/body), YB-1 siRNA plus PBS, and control siRNA plus PBS. We chose the doses of IFN-α by referring previous studies [24]. IFN-α or PBS was administered intraperitoneally (i.p) once daily for 15 days. An s.c. injection of siRNA or control siRNA targeting YB-1 was given every 3 days. For local administration of siRNAs, AteloGene (Koken, Tokyo, Japan) was used as the delivery system according to the manufacturer’s instructions. AteloGene is mediated by atelocollagen, which electrostatically forms a complex with dsRNAs and is subsequently taken up by endocytosis. These four groups were treated for 15 days. Down-regulation of YB-1 in the tumor was confirmed by Western blotting every 3 days before siRNA injection (data not shown). The sizes of primary tumors were determined every 2 or 3 days using calipers. Tumor volume was calculated using the formula V = (A × B 2)/2, where V is the volume (mm3), A is the long diameter (mm), and B is the short diameter (mm).
Abs and reagents
Fluorescein isothiocyanate (FITC)-conjugated anti-CD44 (IM7), anti-Foxp3 (FJK-16s), anti-CD3 (145-2C11), and anti-CD25 mAbs (7D4); phycoerythrin (PE)-conjugated anti-NK1.1 (DX-5) and anti-CD8 mAbs (53–6.7); allophycocyanin (APC)-conjugated anti-CD3, anti-Foxp3, and anti-CD44 mAbs were purchased from e-Bioscience (San Diego, CA, USA). PerCP-Cy5.5-labeled anti-CD4 mAb was purchased from BD PharMingen (San Diego, CA, USA). Armenian Hamster IgG1 was purchased from Wako Pure Chemicals (Osaka, Japan).
T lymphocytes isolation
T lymphocytes isolation was performed as described previously [31]. The column was prepared by packing 0.5 g of scrubbed and combed ready-for-use nylon wool fiber (Polysciences Inc., Warrington, PA, USA) into a 10-ml syringe and autoclaving for 15 min. The column was washed with RPMI medium containing 10 % fetal calf serum and incubated at 37 °C for 1 h, after which it was loaded with 1 × 10⁸–2 × 10⁸ viable cells in a volume of 2 ml. The loaded column was incubated for 1 h at 37 °C, and the no adherent cells were collected using two 50-ml washes. Collected cells were centrifuged at 250g for 10 min; then, the cell pellet was resuspended in RPMI medium containing 10 % FBS, and viable cells were counted. The purity of cells obtained after panning or nylon wool purification was checked by fluorescence-activated cell sorter (FACS) analysis, and the percentage of T cells was found to be 60–70 % (data not shown).
Statistical analysis
The significance of the data was determined by Student’s t test. P < 0.05 was taken as the level of significance. Analysis was carried out using Stat-View 5.0 software (Abacus Concept, Berkeley, CA, USA). Spearman correlation coefficients were used to examine pairwise correlations between YB-1 and STAT3 expression levels. Two-sided P values of <0.05 were considered statistically significant.
Results
Suppression of YB-1 sensitizes renal cancer cells to IFN-α in vitro
YB-1 is known to be involved in several DNA-damaging agents including irradiation, cisplatin, and MMC [22]. However, until now, the effect of YB-1 regarding cellular sensitivity to immune-modulating agents was unknown. We first examined whether YB-1 suppression improves the cytotoxic effect by IFN-α to renal cancer cells (ACHN, 786-O, and RENCA cells). ACHN and RENCA cells possess wild-type von Hippel-Lindau gene, whereas 786-O cells harbor a von Hippel-Lindau mutation. When YB-1 in ACHN cells was suppressed using two kinds of YB-1-specific siRNA, the cellular sensitivity to IFN-α was significantly augmented in all range of IFN-α concentration employed in this assay (Fig. 1a). In addition, YB-1 knockdown in the other two cell lines (786-O and RENCA cells) improved the treatment efficiency of IFN-α similar to that observed in ACHN cells (Fig. 1b, c).
Fig. 1.
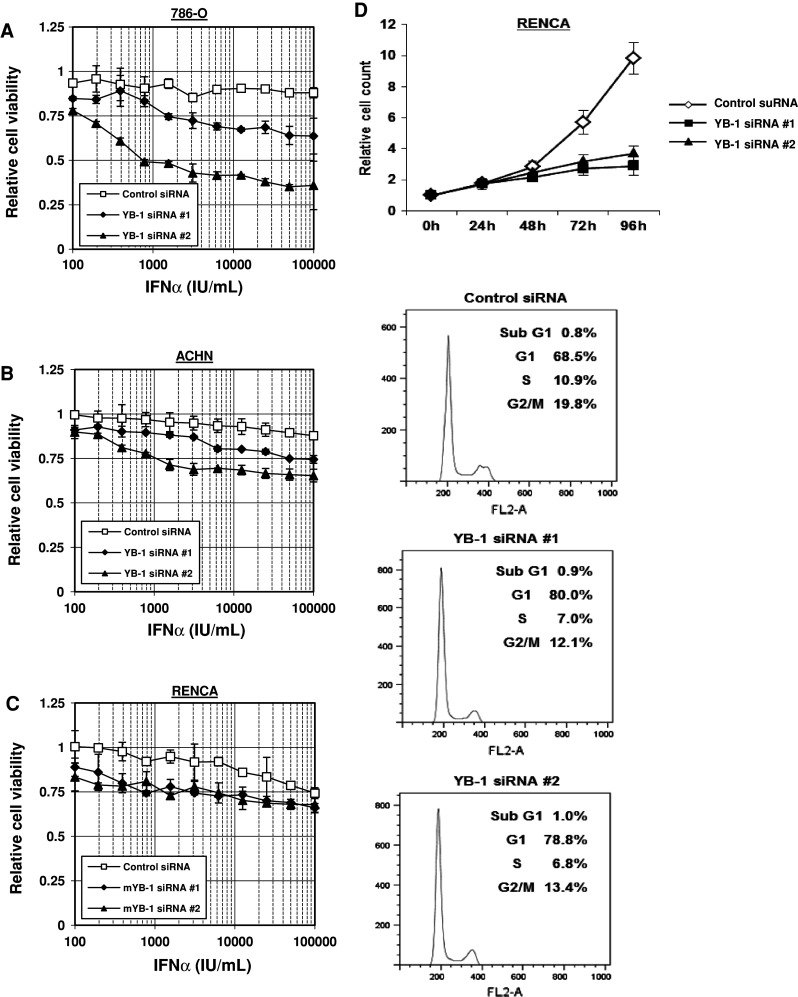
Suppression of YB-1 sensitizes renal cancer cells to IFN-α in vitro. ACHN (a), 786-O (b), and RENCA (c) cells transfected with 40 nM of the indicated siRNA were seeded into 96-well plates. The following day, various concentrations of IFN-α were added. Following incubation for 96 h, cell survival was analyzed by a cytotoxicity assay. Cell survival in the absence of IFN-α corresponds to 1. All values are representative of at least three independent experiments. Boxes, mean; bars, ±sd. d RENCA cells were transfected with 40 nM of the indicated siRNA. Cell numbers were counted at the indicated time points. The results were normalized by the cell numbers at 0 h. All values are representative of at least three independent experiments. Boxes, mean; bars, ±sd. RENCA cells were transfected with 40 nM of the indicated siRNA. At 72 h after transfection, the cells were stained with propidium iodide and analyzed by flow cytometry. The cell-cycle fractions are shown at the top right of each graph
YB-1 induces cell-cycle arrest at G1 phase and reduces cell proliferation of RENCA cells
Next, we investigated the mechanism of growth inhibition by YB-1 suppression. First, we measured the proliferation rate of RENCA cells in vitro when YB-1 was silenced. As shown in Fig. 1d, YB-1 knockdown significantly reduced RENCA-cell proliferation. Cell-cycle analysis by flow cytometry revealed that YB-1 suppression induced cell-cycle arrest at G1 phase. About 786-O and ACHN cell lines, we obtained similar data (data not shown).
YB-1 expression level correlates with STAT3 expression in renal cancer cells
STAT3 is also known to be implicated in the cellular sensitivity to IFN-α [5]. We investigated the relationship between YB-1 and STAT3 expression level in a panel of renal cancer cells. Eight untreated RCC cell lines were subjected to quantitative real-time PCR and Western blot analysis, to assess YB-1 and STAT3 mRNA expression levels. As shown in Fig. 2a, a correlation between YB-1 and STAT3 mRNA expression level was indicated (r = 0.80, P < 0.01). There was also a correlation between YB-1 and STAT3 protein expression level, but this was not statistically significant (Fig. 2b).
Fig. 2.

YB-1 expression level correlates with STAT3 expression in renal cancer cells. a Total RNA was extracted from the indicated 8 renal cancer cell lines. Following extraction of total RNA and synthesis of cDNA, quantitative real-time PCR was performed using the primers and probes for YB-1, STAT3, and GAPDH. YB-1 and STAT3 transcript levels were corrected for the corresponding GAPDH transcript levels, respectively. All values represent at least three independent experiments. Correlation between YB-1 and STAT3 transcript levels was analyzed. The transcript levels of YB-1 and STAT3 in SN12C cells were set to 1. b Whole-cell lysates were extracted from the indicated 8 renal cancer cell lines and subjected to SDS–PAGE. Western blotting was performed using the indicated antibodies. Correlations between YB-1 and STAT3 protein level were analyzed. The protein levels of YB-1 and STAT3 in SN12C cells were set to 1
YB-1 suppression reduces STAT3 protein level through proteasomal degradation
The results described above regarding YB-1 and STAT3 expression level prompted us to investigate a functional link between YB-1 and STAT3. YB-1 is a transcription factor and binds to an inverted CCAAT element called the Y-box [21]. We investigated whether YB-1 regulated STAT3 expression at transcriptional level or not by quantitative real-time PCR method. However, STAT3 transcription was unaffected by YB-1 (data not shown). Protein levels are controlled by translational or degradation processes; therefore, we investigated STAT3 protein levels following YB-1 suppression when treated with cycloheximide (CHX, translation inhibitor) and MG132 (proteasome inhibitor) in ACHN cells. The results showed that STAT3 protein level was reduced by YB-1 suppression when cells were treated with vehicle and CHX, but not with MG132 (Fig. 3a). This suggests that STAT3 protein reduction by YB-1 suppression is dependent on proteasomal degradation, which is inhibited by MG132. Similar results were obtained in both 786-O and RENCA cells (Fig. 3b, c).
Fig. 3.
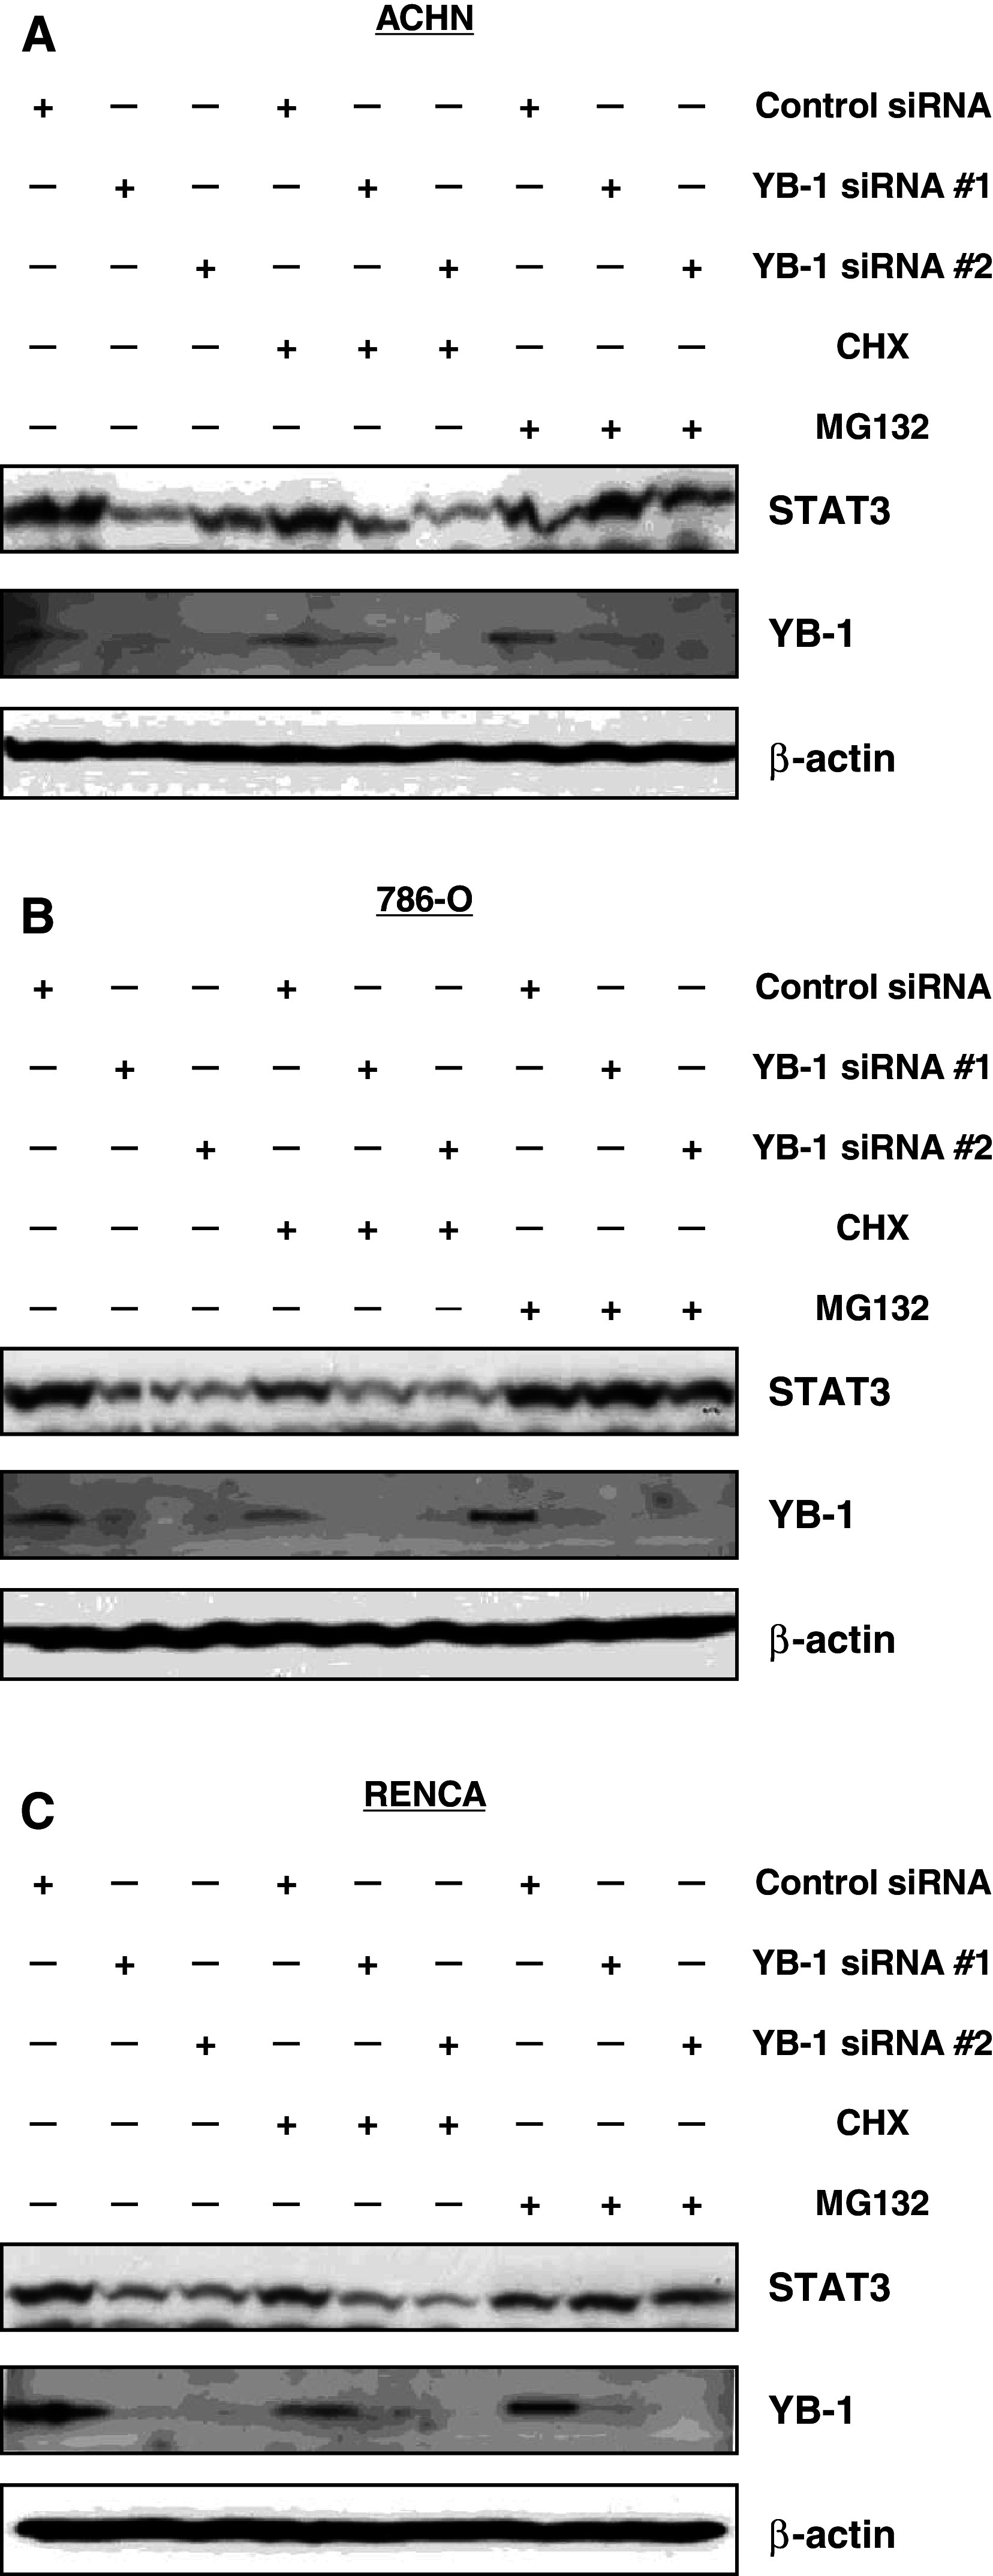
YB-1 suppression reduces STAT3 protein level through proteasomal degradation. ACHN (a), 786-O (b), and RENCA (c) cells were transfected with 40 nM of the indicated siRNA. After 24 h, cells were treated with vehicle, 1 μg/ml of cycloheximide, or 5 μM of MG132 for additional 24 h. Whole-cell extracts were subjected to SDS–PAGE, and Western blotting was performed using the indicated antibodies
Antitumor effects of YB-1 siRNA on IFN-α in a mouse model
Athymic nude mice were s.c. implanted with ACHN and 786-O tumors (5 × 10⁷ cells/body), and treatment with IFN-α (1 MU/body) and/or YB-1 siRNA was initiated when tumors had established. Treatment with YB-1 siRNA plus IFN-α produced more efficient inhibition of ACHN and 786-O tumor growth than IFN-α alone (Fig. 4a, b). Treatment with mIFN-α 1.0 × 10⁴ IU/body and/or YB-1 siRNA was initiated after the establishment of injected syngeneic RENCA tumors (5.0 × 10⁶) in BALB/c mice. RENCA tumor growth was significantly suppressed in mice receiving YB-1siRNA plus IFN-α compared with those treated with IFN-α alone (Fig. 4c). Moreover, we analyzed the effector cells for antitumor activity in the above three groups with flow cytometry on day 18 after treatment start in the immunocompetent BALB/c-RENCA mouse model. There were no significant differences in the proportions of CD3-NK1.1+ cells (NK cells), CD4+ cells, CD8+ cells, CD44highCD8+ T cells (memory CD 8 T cells), and CD4+ CD25+ foxp3+ T cells (regulatory T cells) among the three groups (Table 1).
Fig. 4.

Antitumor effects of YB-1 siRNA on IFN-α in a mouse model. ACHN, 786-O cells (5.0 × 10⁷), and RENCA (5.0 × 10⁶) were inoculated subcutaneously (s.c.) into the shaved lateral flanks of the mice. After establishment of tumor, 15 mice were randomly divided into three groups. IFN-α was administered intraperitonelly, once a day, for 15 days. YB-1 siRNA or control siRNA was administered by s.c injection, once every 3 days, for 15 days. The sizes of primary tumors were determined every 2 or 3 days using calipers. a, b Athymic nude mice were subcutaneously implanted with ACHN and 786-O tumors, and treatment with HLBI and/or YB-1si RNA was initiated when tumors were established (*P < 0.05 compared with other 2 groups). c BALB/c mice were subcutaneously implanted with RENCA tumors (5.0 × 10⁶) and treatment with mIFN-α and/or YB-1 siRNA was initiated when tumors were established (*P < 0.05 compared with other 2 groups)
Table 1.
Effects of the three groups on the proportion of T lymphocytes
| Surface marker | PBS + control (%) | mIFN-α + control (%) | mIFN-α + YB-1siRNA (%) |
|---|---|---|---|
| NK1.1+ CD3− (lymphocyte-gated) | 5.3 ± 0.21* | 5.5 ± 0.54 | 5.1 ± 0.49 |
| CD4+ CD8− (CD3+-gated) | 47.6 ± 3.5* | 46.7 ± 5.1 | 47.3 ± 5.0 |
| CD4− CD8+ (CD3+-gated) | 27.6 ± 3.5* | 28.6 ± 3.0 | 28.3 ± 3.1 |
| CD44+ CD8+ (lymphocyte-gated) | 8.3 ± 2.5* | 9.3 ± 1.5 | 8.3 ± 3.5 |
| CD25+ foxp3+ (CD4+-gated) | 11.8 ± 1.7* | 11.0 ± 1.3 | 12.6 ± 1.9 |
NK1.1+ CD3−, CD4+ CD8−, CD4− CD8+, CD44+ CD8+, and CD25+ foxp3+ cells demonstrate NK cells, CD4 T cells, CD8 T cells, memory CD8 T cells, and regulatory T cells, respectively
Abs and reagents: Fluorescein isothiocyanate (FITC)-conjugated anti-CD44 (IM7), anti-Foxp3 (FJK-16s), anti-CD3 (145-2C11), and anti-CD25 mAbs (7D4); phycoerythrin (PE)-conjugated anti-NK1.1 (DX-5) and anti-CD8 mAbs (53–6.7); allophycocyanin (APC)-conjugated anti-CD3, anti-Foxp3, and anti-CD44 mAbs were purchased from e-Bioscience (San Diego, CA). PerCP-Cy5.5-labeled anti-CD4 mAb was purchased from BD PharMingen (San Diego, CA). Armenian Hamster IgG1 was purchased from Wako Pure Chemicals (Osaka, Japan)
* Not specific compared with the other 2 groups
YB-1 expression is poorly expressed in mouse lymphocytes
We obtained T lymphocytes from the spleen cells of tumor-bearing BALB/C mice by nylon wool methods. IFN-α is thought to exert its cytotoxic effect to tumor cells acting through lymphocytes. We compared YB-1 and STAT3 expression levels in both renal tumor tissues and mouse lymphocytes. YB-1 expression in mouse lymphocytes was apparently lower compared to that in renal tumor tissues (Fig. 5).
Fig. 5.

YB-1 expression in mouse lymphocytes and renal tumor tissues. Spleen cells from tumor-bearing mice treated with IFN-α and/or YB-1 siRNA were removed 19 days after tumor inoculation. Lysates were extracted from tissues formed by the indicated inoculated cells in mice and lymphocytes isolated from mouse spleen. Whole-cell lysates were subjected to SDS–PAGE, and Western blotting was performed using the indicated antibodies
Discussion
IFN-α is known to have powerful effects on immune cells, including enhancement of natural killer (NK) cell tumor cytotoxicity, dendritic cell maturation, Th1 skewing, enhancement of T-cell survival, immunologic memory induction, and inhibition of the invasive ability of cancer cells [24]. Therapy for MRCC has historically been cytokine-based such as IFN-α, as immune system manipulation resulted in greater antitumor effects when compared with traditional chemotherapeutic agents. However, IFN-α has produced objective response rates in the order of 10–15 %, with progression-free survival of approximately 5–6 months. Thus, there is a clear clinical need to identify treatment modalities that exert therapeutic effects in MRCC.
STATs are ligand-induced transcriptional factors that are activated in response to growth factors and cytokines such as IFN-α [6–8]. Among the STAT family, STAT3 is recognized as a primordial STAT protein because it is activated by a wide variety of cytokines, growth factors and other stimuli, and participates in a wide variety of physiological processes [7, 8, 10, 12]. STAT3 has been reported to be frequently overexpressed in various cancers and has, therefore, been recognized as a type of oncogene [9–12]. Additionally, laboratory-induced mutation, resulting in constitutive STAT3 activation, can transform normal cells, whereas no naturally occurring mutations of STAT3 have been reported [11]. In previous studies on RCC, the most frequently activated STAT was reported to be STAT3 and the expression of STAT3 was associated with clinical outcome [12, 32]. These findings suggest that inherited STAT3 polymorphisms, which correlate with STAT3 expression, might have a substantial effect on the progression or survival of cancer cells. A relationship between STAT3 activation in tumor cells and antitumor immunity has also been reported [33]. Activation of STAT3 in tumor cells promotes the expression of factors that inhibit the functional differentiation and mutation of dendritic cells, resulting in suppression of proinflammatory cytokines and the chemokines necessary for antitumor immunity.
In our previous study, to identify a genetic marker to predict response to IFN-α therapy, we performed an association study of 463 SNPs on 33 candidate genes and found that a STAT3 polymorphism was a useful diagnostic marker to predict the response to IFN-α therapy in patients with MRCC [5]. In another study, Kreil et al. [34] reported STAT3 expression levels in CML patients were associated with IFN-α response, as observed in our study. In our report, STAT3 expression was reduced in the genotype responding to IFN-α, and suppression of STAT3 by siRNA enhanced the inhibitory effect of IFN-α on cell growth in vitro. However, to investigate the involvement of STAT3 in the sensitivity of IFN-α, we needed to consider the two different aspects of STAT3: its roles in tumor cells and in the immune system. As STAT3 is an essential negative regulator in the immune system and tissue-specific Stat3 knockout mice exhibit autoimmunity, targeting STAT3 also imposes a potential risk of autoimmune disorders [13–15]. Therefore, we have searched for a molecular target that is associated with STAT3 in tumor cells and is not involved in the immune system. As shown in Fig. 5, YB-1 expression in mouse lymphocytes was apparently lower compared to that in renal tumor tissues. We hypothesized this led to a reduction in the risk of autoimmune disease occurring. YB-1 is thought to possess various biological activities in both the nucleus and the cytoplasm. YB-1 overexpression is also considered to be a prognostic factor of an unfavorable clinical outcome [21, 22]. Recently, it has been reported that YB-1 regulates cancer cell invasion [35]. In the present study, YB-1 knockdown significantly reduced renal cancer cells proliferation, and YB-1 suppression induced cell-cycle arrest at G1 phase (Fig. 1c). Moreover, we showed that STAT3 protein level was reduced by YB-1 suppression when cells were treated with vehicle and CHX, but not with MG132 (Fig. 3a). This result suggests that STAT3 protein reduction by YB-1 suppression is dependent on proteasomal degradation, which is inhibited by MG132. Similar results were obtained in both 786-O and RENCA cells (Fig. 3b, c). We reported the results first in the world. Recently, clinical trials evaluating combinations of targeted agents with proteasome inhibitor have been initiated, with the objective of enhancing its single-agent activity in hematologic malignancies (myeloma and mantle cell lymphoma), as well as expanding its efficacy in solid tumors [36]. In these cases, preclinical studies have provided a supportive rationale for these combination studies. Actually, small molecule-targeted agents being investigated with bortezomib (the first-in-class proteasome inhibitor) in clinical trials include protein deacetylase inhibitors, kinase inhibitors, farnesyltransferase inhibitors, heat-shock protein 90 inhibitors, pan-Bcl-2 family inhibitors, and other classes of targeted inhibitors [36]. However, the compatibility of YB-1 inhibitor and proteasome inhibitor might not be ideal.
With regard to associations between YB-1 and STAT3, it was previously reported that STAT3 is phosphorylated at S727 in breast cancer cells as an event downstream of HER-2 and its dimerization partner EGFR, which are both transcriptionally regulated by YB-1 [37–40]. Actually, in the present study, we demonstrated a correlation between YB-1 and STAT3 mRNA expression level and protein level (Fig. 2). We found that cellular sensitivities to IFN-α were significantly augmented by two YB-1-specific siRNAs at all IFN-α concentrations employed in cell proliferation assays (Fig. 1). In addition to its immunomodulatory effects, IFN-α has direct antitumor as well as antiangiogenic activity [24]. Eisenkraft et al. [41] reported that IFN-α regulated the expression of EGFR in renal cancer cells. Therefore, suppression of YB-1 might enhance the inhibitory action of IFN-α on EGFR.
While the reason why the suppression of STAT3 after the inhibition of YB-1 is associated with sensitive to IFN-α therapy remains unclear, Kong et al. [42] reported the immune modulatory effects of STAT3 blockade can enhance the therapeutic efficacy of IFN-α immunotherapy by enhancing both innate and adaptive cytotoxic T-cell activities in murine melanoma model. In that report, the combination of IFN-α and WP1193 (STAT3 blockade agent) enhanced tumor cytotoxicity mediated by both the NK and CD8+ T-cell populations. In the present study, the enhanced antitumor effect of YB-1-specific siRNA on IFN-α was clearly demonstrated in the RENCA-BALB/c model (Fig. 4c). Because YB-1 expression in mouse lymphocytes was apparently lower compared to that in renal tumor tissues, we hypothesized that the inhibition of YB-1 was difficult to affect CTL and NK activities (Fig. 5). However, we considered to prove it the further experiments were needed. Moreover, the treatment with YB-1-specific siRNA alone tended to retard tumor growth in ACHN cells, 786-O, and RENCA cells, although that was not statistically significant (data not shown). To show the efficiency of the treatment with YB-1-specific siRNA alone, it was ideal to implant with cells containing YB-1-specific siRNA according to other reports [23, 43]. Actually, we obtained similar data (data not shown). However, in the present study, we started the cancer treatment after establishing the injected tumors, because we considered the clinical application. As a result, we could clearly show the enhancement of YB-1-specific siRNA to IFN-α. In ACHN cells and 786-O nude mice models, the enhanced antitumor effect of YB-1-specific siRNA on IFN-α was also clearly demonstrated (Fig. 4a, b), indicating the direct effects of each agent on tumor growth in vivo, because immunological effects in nude mice are not taken in account. Although lymphocytes were absent under in vitro condition, cellular sensitivities to IFN-α were significantly augmented at all concentrations of IFN-α (Fig. 1). Taken together, YB-1 increased IFN-α activity in this regard when used in combination (Figs. 1, 4, 5). Therefore, when combined in vivo, one sees synergistic activity, due to presumed combination of antitumor, antiangiogenic, and immunologic responses.
Regarding autoimmune disease, Tregs which were defined by the expression of CD4, CD25, and the transcription factor forkhead box P3 (Foxp3) have a central role in protecting an individual from autoimmunity [44]. This role was first identified in mice in which the absence of Tregs, or the depletion of Tregs, resulted in the development of autoimmune gastritis, thyroiditis, diabetes, and inflammatory bowel disease [45]. Subsequently, numerous studies in animal models of autoimmunity showed that defects in CD4+ CD25+ Foxp3+ Tregs can contribute to the development of autoimmunity [46]. In our previous study, we reported that Tregs in patients with MRCC were significantly decreased for 2 weeks after the initiation of IFN-α monotherapy, but recovered later as treatment proceeded [16]. Actually, in the present study, the addition of YB-1 siRNA to INF-α gave no effect on the proportion of Tregs in the spleen cells of tumor-bearing BALB/c mice, irrespective of IFN-α (+ control siRNA) or PBS (+ control siRNA) (Table 1). These results also seem to lead to the prevention of autoimmune disease.
In conclusion, the present study showed that the inhibition of YB-1 expression enhanced STAT3 suppression and the antitumor activity of IFN-α, both in vitro and in vivo, in human and murine RCC cell lines. The expression of YB-1 was hardly observed in T lymphocytes; thus, we expect a decrease in the risk of autoimmune disease. Moreover, the therapeutic gains are predicted to be better than STAT3 inhibiting therapy. Our findings suggest that combination therapy using siRNA knockdown of YB-1 with IFN-α could be an attractive candidate for treatment for RCC by exploiting the weak point of the STAT3 suppressor.
Acknowledgments
We would like to thank Dr. Kazuo Gohji (Kobe University, Kobe, Japan) for a gift of KG2 cells, Dr. Dongchon Kang (Kyushu University, Fukuoka, Japan) for helping with quantitative real-time PCR, and Noriko Hakoda and Seiko Kamori for their technical assistances.
Conflict of interest
The authors declare that they have no conflict of interest.
Footnotes
Ario Takeuchi and Masaki Shiota equally contributed to this work.
References
- 1.Mancuso A, Sternberg CN. New treatments for metastatic kidney cancer. Can J Urol. 2005;12(Suppl 1):66–70. [PubMed] [Google Scholar]
- 2.Kim HL, Seligson D, Liu X, Janzen N, Bui MH, Yu H, Shi T, Belldegrun AS, Horvath S, Figlin RA (2005) Using tumor markers to predict the survival of patients with metastatic renal cell carcinoma. J Urol 1496–14501 [DOI] [PubMed]
- 3.Motzer RJ, Bander NH, Nanus DM. Renal-cell carcinoma. N Engl J Med. 1996;335:865–875. doi: 10.1056/NEJM199609193351207. [DOI] [PubMed] [Google Scholar]
- 4.Naito S, Yamamoto N, Takayama T, Muramoto M, Shinohara N, Nishiyama K, Takahashi A, Maruyama R, Saika T, Hoshi S, Nagao K, Yamamoto S, Sugimura I, Uemura H, Koga S, Takahashi M, Ito F, Ozono S, Terachi T, Tomita Y. Prognosis of Japanese metastatic renal cell carcinoma patients in the cytokine era: a cooperative group report of 1,463 patients. Eur Urol. 2010;57:317–325. doi: 10.1016/j.eururo.2008.12.026. [DOI] [PubMed] [Google Scholar]
- 5.Ito N, Eto M, Nakamura E, Takahashi A, Tsukamoto T, Toma H, Nakazawa H, Hirao Y, Uemura H, Kagawa S, Kanayama H, Nose Y, Kinukawa N, Nakamura T, Jinnai N, Seki T, Takamatsu M, Masui Y, Naito S, Ogawa O. STAT3 polymorphism predicts interferon-alpha response in patients with metastatic renal cell carcinoma. J Clin Oncol. 2007;25:2785–2791. doi: 10.1200/JCO.2006.09.8897. [DOI] [PubMed] [Google Scholar]
- 6.Darnell JE., Jr STATs and gene regulation. Science. 1997;277:1630–1635. doi: 10.1126/science.277.5332.1630. [DOI] [PubMed] [Google Scholar]
- 7.Bowman T, Garcia R, Turkson J, Jove R. STATs in oncogenesis. Oncogene. 2000;19:2474–2488. doi: 10.1038/sj.onc.1203527. [DOI] [PubMed] [Google Scholar]
- 8.Takeda K, Akira S. STAT family of transcription factors in cytokine-mediated biological responses. Cytokine Growth Factor Rev. 2000;11:199–207. doi: 10.1016/S1359-6101(00)00005-8. [DOI] [PubMed] [Google Scholar]
- 9.Yu H, Jove R. The STATs of cancer—new molecular targets come of age. Nat Rev Cancer. 2004;4:97–105. doi: 10.1038/nrc1275. [DOI] [PubMed] [Google Scholar]
- 10.Bromberg JF, Wrzeszczynska MH, Devgan G, Zhao Y, Pestell RG, Albanese C, Darnell JE., Jr Stat3 as an oncogene. Cell. 1999;98:295–303. doi: 10.1016/S0092-8674(00)81959-5. [DOI] [PubMed] [Google Scholar]
- 11.Darnell JE. Validating Stat3 in cancer therapy. Nat Med. 2005;11:595–596. doi: 10.1038/nm0605-595. [DOI] [PubMed] [Google Scholar]
- 12.Bromberg J. Stat proteins and oncogenesis. J Clin Invest. 2002;109:1139–1142. doi: 10.1172/JCI15617. [DOI] [PMC free article] [PubMed] [Google Scholar]
- 13.Welte T, Zhang SS, Wang T, Zhang Z, Hesslein DG, Yin Z, Kano A, Iwamoto Y, Li E, Craft JE, Bothwell AL, Fikrig E, Koni PA, Flavell RA, Fu XY. STAT3 deletion during hematopoiesis causes Crohn’s disease-like pathogenesis and lethality: a critical role of STAT3 in innate immunity. Proc Natl Acad Sci USA. 2003;100:1879–1884. doi: 10.1073/pnas.0237137100. [DOI] [PMC free article] [PubMed] [Google Scholar]
- 14.Takeda K, Clausen BE, Kaisho T, Tsujimura T, Terada N, Forster I, Akira S. Enhanced Th1 activity and development of chronic enterocolitis in mice devoid of Stat3 in macrophages and neutrophils. Immunity. 1999;10:39–49. doi: 10.1016/S1074-7613(00)80005-9. [DOI] [PubMed] [Google Scholar]
- 15.Alonzi T, Newton IP, Bryce PJ, Di Carlo E, Lattanzio G, Tripodi M, Musiani P, Poli V. Induced somatic inactivation of STAT3 in mice triggers the development of a fulminant form of enterocolitis. Cytokine. 2004;26:45–56. doi: 10.1016/j.cyto.2003.12.002. [DOI] [PubMed] [Google Scholar]
- 16.Tatsugami K, Eto M, Naito S. Influence of immunotherapy with interferon-alpha on regulatory T cells in renal cell carcinoma patients. J Interferon Cytokine Res. 2010;30:43–48. doi: 10.1089/jir.2009.0014. [DOI] [PubMed] [Google Scholar]
- 17.Ascierto PA, Napolitano M, Celentano E, Simeone E, Gentilcore G, Daponte A, Capone M, Caraco C, Calemma R, Beneduce G, Cerrone M, De Rosa V, Palmieri G, Castello G, Kirkwood JM, Marincola FM, Mozzillo N. Regulatory T cell frequency in patients with melanoma with different disease stage and course, and modulating effects of high-dose interferon-alpha 2b treatment. J Transl Med. 2010;8:76. doi: 10.1186/1479-5876-8-76. [DOI] [PMC free article] [PubMed] [Google Scholar]
- 18.Schwandt A, Garcia JA, Elson P, Wyckhouse J, Finke JH, Ireland J, Triozzi P, Zhou M, Dreicer R, Rini BI. Clinical and Immunomodulatory effects of celecoxib plus interferon-alpha in metastatic renal cell carcinoma patients with COX-2 Tumor Immunostaining. J Clin Immunol. 2011;31(4):690–698. doi: 10.1007/s10875-011-9530-x. [DOI] [PubMed] [Google Scholar]
- 19.Uchiumi T, Fotovati A, Sasaguri T, Shibahara K, Shimada T, Fukuda T, Nakamura T, Izumi H, Tsuzuki T, Kuwano M, Kohno K. YB-1 is important for an early stage embryonic development: neural tube formation and cell proliferation. J Biol Chem. 2006;281:40440–40449. doi: 10.1074/jbc.M605948200. [DOI] [PubMed] [Google Scholar]
- 20.Lu ZH, Books JT, Ley TJ. YB-1 is important for late-stage embryonic development, optimal cellular stress responses, and the prevention of premature senescence. Mol Cell Biol. 2005;25:4625–4637. doi: 10.1128/MCB.25.11.4625-4637.2005. [DOI] [PMC free article] [PubMed] [Google Scholar]
- 21.Kohno K, Izumi H, Uchiumi T, Ashizuka M, Kuwano M. The pleiotropic functions of the Y-box-binding protein, YB-1. BioEssays. 2003;25:691–698. doi: 10.1002/bies.10300. [DOI] [PubMed] [Google Scholar]
- 22.Kuwano M, Oda Y, Izumi H, Yang SJ, Uchiumi T, Iwamoto Y, Toi M, Fujii T, Yamana H, Kinoshita H, Kamura T, Tsuneyoshi M, Yasumoto K, Kohno K. The role of nuclear Y-box binding protein 1 as a global marker in drug resistance. Mol Cancer Ther. 2004;3:1485–1492. [PubMed] [Google Scholar]
- 23.Lee C, Dhillon J, Wang MY, Gao Y, Hu K, Park E, Astanehe A, Hung MC, Eirew P, Eaves CJ, Dunn SE. Targeting YB-1 in HER-2 overexpressing breast cancer cells induces apoptosis via the mTOR/STAT3 pathway and suppresses tumor growth in mice. Cancer Res. 2008;68:8661–8666. doi: 10.1158/0008-5472.CAN-08-1082. [DOI] [PubMed] [Google Scholar]
- 24.Takeuchi A, Eto M, Tatsugami K, Yamada H, Oki T, Kiyoshima K, Yoshikai Y, Naito S. Mechanism of synergistic antitumor effect of sorafenib and interferon-alpha on treatment of renal cell carcinoma. J Urol. 2010;184:2549–2556. doi: 10.1016/j.juro.2010.07.033. [DOI] [PubMed] [Google Scholar]
- 25.Naito S, Kotoh S, Goto K, Koga H, Hasegawa S, Noma H, Yamasaki T, Kumazawa J. Establishment of two human renal cell carcinoma cell lines with different chemosensitivity. Hum Cell. 1996;9:101–108. [PubMed] [Google Scholar]
- 26.Naito S, Kanamori T, Hisano S, Tanaka K, Momose S, Kamata N. Human renal cell carcinoma: establishment and characterization of two new cell lines. J Urol. 1982;128:1117–1121. doi: 10.1016/s0022-5347(17)53357-1. [DOI] [PubMed] [Google Scholar]
- 27.Naito S, von Eschenbach AC, Fidler IJ. Different growth pattern and biologic behavior of human renal cell carcinoma implanted into different organs of nude mice. J Natl Cancer Inst. 1987;78:377–385. [PubMed] [Google Scholar]
- 28.Gohji K, Fidler IJ, Tsan R, Radinsky R, von Eschenbach AC, Tsuruo T, Nakajima M. Human recombinant interferons-beta and -gamma decrease gelatinase production and invasion by human KG-2 renal-carcinoma cells. Int J Cancer. 1994;58:380–384. doi: 10.1002/ijc.2910580313. [DOI] [PubMed] [Google Scholar]
- 29.Shiota M, Yokomizo A, Kashiwagi E, Tada Y, Inokuchi J, Tatsugami K, Kuroiwa K, Uchiumi T, Seki N, Naito S. Foxo3a expression and acetylation regulate cancer cell growth and sensitivity to cisplatin. Cancer Sci. 2010;101:1177–1185. doi: 10.1111/j.1349-7006.2010.01503.x. [DOI] [PMC free article] [PubMed] [Google Scholar]
- 30.Shiota M, Yokomizo A, Tada Y, Inokuchi J, Kashiwagi E, Masubuchi D, Eto M, Uchiumi T, Naito S. Castration resistance of prostate cancer cells caused by castration-induced oxidative stress through Twist1 and androgen receptor overexpression. Oncogene. 2010;29:237–250. doi: 10.1038/onc.2009.322. [DOI] [PubMed] [Google Scholar]
- 31.Takeuchi A, Eto M, Yamada H, Tatsugami K, Naito S, Yoshikai Y. A reduction of recipient regulatory T cells by cyclophosphamide contributes to an anti-tumor effect of nonmyeloablative allogeneic stem cell transplantation in mice. Int J Cancer. 2012;130(2):365–376. doi: 10.1002/ijc.26009. [DOI] [PubMed] [Google Scholar]
- 32.Horiguchi A, Oya M, Shimada T, Uchida A, Marumo K, Murai M. Activation of signal transducer and activator of transcription 3 in renal cell carcinoma: a study of incidence and its association with pathological features and clinical outcome. J Urol. 2002;168:762–765. doi: 10.1016/S0022-5347(05)64741-6. [DOI] [PubMed] [Google Scholar]
- 33.Kortylewski M, Yu H. Stat3 as a potential target for cancer immunotherapy. J Immunother. 2007;30:131–139. doi: 10.1097/01.cji.0000211327.76266.65. [DOI] [PubMed] [Google Scholar]
- 34.Kreil S, Waghorn K, Ernst T, Chase A, White H, Hehlmann R, Reiter A, Hochhaus A, Cross NC. A polymorphism associated with STAT3 expression and response of chronic myeloid leukemia to interferon alpha. Haematologica. 2010;95:148–152. doi: 10.3324/haematol.2009.011510. [DOI] [PMC free article] [PubMed] [Google Scholar]
- 35.Gimenez-Bonafe P, Fedoruk MN, Whitmore TG, Akbari M, Ralph JL, Ettinger S, Gleave ME, Nelson CC. YB-1 is upregulated during prostate cancer tumor progression and increases P-glycoprotein activity. Prostate. 2004;59:337–349. doi: 10.1002/pros.20023. [DOI] [PubMed] [Google Scholar]
- 36.Wright JJ. Combination therapy of bortezomib with novel targeted agents: an emerging treatment strategy. Clin Cancer Res. 2010;16:4094–4104. doi: 10.1158/1078-0432.CCR-09-2882. [DOI] [PubMed] [Google Scholar]
- 37.Yeh YT, Ou-Yang F, Chen IF, Yang SF, Wang YY, Chuang HY, Su JH, Hou MF, Yuan SS. STAT3 ser727 phosphorylation and its association with negative estrogen receptor status in breast infiltrating ductal carcinoma. Int J Cancer. 2006;118:2943–2947. doi: 10.1002/ijc.21771. [DOI] [PubMed] [Google Scholar]
- 38.Fernandes A, Hamburger AW, Gerwin BI. ErbB-2 kinase is required for constitutive stat 3 activation in malignant human lung epithelial cells. Int J Cancer. 1999;83:564–570. doi: 10.1002/(SICI)1097-0215(19991112)83:4<564::AID-IJC20>3.0.CO;2-Q. [DOI] [PubMed] [Google Scholar]
- 39.Garcia R, Yu CL, Hudnall A, Catlett R, Nelson KL, Smithgall T, Fujita DJ, Ethier SP, Jove R. Constitutive activation of Stat3 in fibroblasts transformed by diverse oncoproteins and in breast carcinoma cells. Cell Growth Differ. 1997;8:1267–1276. [PubMed] [Google Scholar]
- 40.Stratford AL, Habibi G, Astanehe A, Jiang H, Hu K, Park E, Shadeo A, Buys TP, Lam W, Pugh T, Marra M, Nielsen TO, Klinge U, Mertens PR, Aparicio S, Dunn SE. Epidermal growth factor receptor (EGFR) is transcriptionally induced by the Y-box binding protein-1 (YB-1) and can be inhibited with Iressa in basal-like breast cancer, providing a potential target for therapy. Breast Cancer Res. 2007;9:R61. doi: 10.1186/bcr1767. [DOI] [PMC free article] [PubMed] [Google Scholar]
- 41.Eisenkraft BL, Nanus DM, Albino AP, Pfeffer LM. Alpha-interferon down-regulates epidermal growth factor receptors on renal carcinoma cells: relation to cellular responsiveness to the antiproliferative action of alpha-interferon. Cancer Res. 1991;51:5881–5887. [PubMed] [Google Scholar]
- 42.Kong LY, Gelbard A, Wei J, Reina-Ortiz C, Wang Y, Yang EC, Hailemichael Y, Fokt I, Jayakumar A, Qiao W, Fuller GN, Overwijk WW, Priebe W, Heimberger AB. Inhibition of p-STAT3 enhances IFN-alpha efficacy against metastatic melanoma in a murine model. Clin Cancer Res. 2010;16:2550–2561. doi: 10.1158/1078-0432.CCR-10-0279. [DOI] [PMC free article] [PubMed] [Google Scholar]
- 43.Lasham A, Samuel W, Cao H, Patel R, Mehta R, Stern JL, Reid G, Woolley AG, Miller LD, Black MA, Shelling AN, Print CG, Braithwaite AW. YB-1, the E2F pathway, and regulation of tumor cell growth. J Natl Cancer Inst. 2012;104:133–146. doi: 10.1093/jnci/djr512. [DOI] [PMC free article] [PubMed] [Google Scholar]
- 44.Sakaguchi S. Regulatory T cells: history and perspective. Methods Mol Biol. 2011;707:3–17. doi: 10.1007/978-1-61737-979-6_1. [DOI] [PubMed] [Google Scholar]
- 45.Ochs HD, Gambineri E, Torgerson TR. IPEX, FOXP3 and regulatory T-cells: a model for autoimmunity. Immunol Res. 2007;38:112–121. doi: 10.1007/s12026-007-0022-2. [DOI] [PubMed] [Google Scholar]
- 46.Sakaguchi S, Ono M, Setoguchi R, Yagi H, Hori S, Fehervari Z, Shimizu J, Takahashi T, Nomura T. Foxp3+ CD25+ CD4+ natural regulatory T cells in dominant self-tolerance and autoimmune disease. Immunol Rev. 2006;212:8–27. doi: 10.1111/j.0105-2896.2006.00427.x. [DOI] [PubMed] [Google Scholar]