

Abstract
MUC1 (CA15-3) and MUC16 (CA125) tumor-associated antigens are upregulated in ovarian cancer and can be detected in patients’ sera by standardized tests. We postulated that increased MUC1 and MUC16 antigens augment antibody responses in platinum-resistant ovarian cancer patients and that the frequency and intensity of these responses can be used as immune biomarkers of treatment response and disease outcome. We measured MUC1 and MUC16 tumor expression by immunohistochemistry (IHC), assessed serum antigenic levels and quantitated circulating antibodies by ELISA in a cohort of 28 ovarian cancer patients with platinum-resistant or platinum-refractory ovarian cancer, and treated with intraperitoneal (IP) interleukin-2 (IL-2). MUC1 and MUC16 were overexpressed in tumor samples and showed differential distribution profiles. Serum MUC1 (CA15-3) measurements were elevated in all patients and significantly correlated with increased risk of death (P = 0.003). MUC1-specific IgM and IgG anitbodies were found in 92 and 50% of cases, respectively. Patients with progressive disease had higher mean anti-MUC1 IgG than responders at both early (P = 0.025) and late (P = 0.022) time points during IP IL-2 treatment. Anti-MUC1 IgM antibodies inversely correlated with overall survival at both early (P = 0.052) and late (P = 0.009) time points. In contrast to MUC1, neither soluble MUC16 nor MUC16-specific antibodies were significantly associated with clinical response or overall survival in this study. Increased serum MUC1 and high anti-MUC1 antibody levels are prognostic for poor clinical response and reduced overall survival in platinum-resistant or platinum-refractory ovarian cancer.
Electronic supplementary material
The online version of this article (doi:10.1007/s00262-011-1010-x) contains supplementary material, which is available to authorized users.
Keywords: Ovarian cancer, Platinum resistance, MUC1 (CA15-3), MUC16 (CA125), Humoral immunity, Interleukin-2, Biomarkers
Introduction
Ovarian cancer treatment typically combines surgery and platinum–taxane-based chemotherapy. While the majority of patients initially respond to platinum-based therapy, in approximately 25% of cases no response can be achieved. The 5-year survival for this patient category with platinum-resistant or platinum-refractory tumors is extremely poor [1]. Given the limited ability of current approaches to effectively manage treatment-resistant ovarian cancer, early prognostic markers and novel therapeutic targets are needed in order to stratify patients, to reduce unnecessary treatment-associated morbidities from ineffective chemotherapy, and to provide new treatment options. Mucins are well-known epithelial cell markers, extensively studied for their potential in the diagnosis, prognosis, and therapy of epithelial cancers. The best described member of the mucin family is mucin 1 (MUC1), a tumor-associated antigen and an oncoprotein widely studied in breast, pancreatic, and lung cancers [2, 3]. Soluble MUC1 (also known as CA15-3) is an extensively used tumor marker routinely employed in the clinic for the diagnosis and disease management of invasive breast cancer. In a recent ranking of 75 tumor antigens based on predefined and pre-weighted criteria (including, among others, therapeutic function, immunogencity, oncogenicity, and specificity), MUC1 received the second highest priority score (after WT1), emphasizing its potential for future translational studies and vaccine development [4].
MUC16, most commonly known as CA125, is another transmembrane mucin expressed by ovarian tumor cells and detected at high levels in the peripheral blood of ovarian cancer patients. Serum CA125 continues to be the best validated marker for ovarian cancer and is currently widely employed for monitoring response to therapy and for detecting disease recurrence [5–7].
Overproduction of MUC1 and MUC16 in ovarian cancer leads to increased circulating levels of both molecules, detectable by standardized tests (CA15-3 and CA125, respectively). The ability of these abundant antigens to influence immune surveillance in platinum-resistant ovarian cancer patients has not been assessed. We postulated here that overexpressed MUC1 and MUC16 augment antibody production and that the frequency and intensity of humoral responses can be used as immune biomarkers of treatment and disease outcome. To address this, we measured tumor MUC1 and MUC16 antigen expression, determined soluble antigenic levels, and quantified MUC1- and MUC16-specific antibodies in a cohort of 28 ovarian cancer patients with platinum-resistant or platinum-refractory ovarian tumors. All patients have received intraperitoneal (IP) Interleukin-2 (IL-2) in a phase II clinical trial conducted at our institution between 1995 and 1999. We have recently reported the demographics and clinical outcomes of this patient cohort and have described the T-lymphocyte measurements that can be used as immune biomarkers [8]. Our clinical trial identified several long-term survivors, some with survival rates of over 10 years [8]. Because of the long-term survival data and the encouraging response rates seen in a subset of patients, this trial provided us with a valuable opportunity to test the effect of naturally occurring MUC1- and MUC16-specific antibodies on both treatment response and survival.
Materials and methods
Patients and samples
Following University of Pittsburgh Institutional Review Board approval, serum and tissue samples were obtained from 28 patients with biopsy-proven, persistent ovarian cancer who had previously participated in a phase II clinical trial at our institution. Patient eligibility and characteristics have been previously reported [8].
Patients must have completed greater than five courses of platinum or taxane-containing regimen with a disease-free interval of less than 6 months. Disease status was evaluated surgically no more than 6 weeks to being enrolled, and the disease burden was required to be intra-abdominal.
Peripheral blood was collected prior to each of the weekly IP infusions with 6 × 10⁵ IU/m2 of recombinant IL-2 (Proleukin, Aldesleukin, Chiron). From each patient, we used the banked serum samples collected from early (baseline) and late time points (after the last or next to the last IL-2 infusion). Sera were collected using non-heparinized tubes and stored at ultra-low temperatures until ready to use. Tumor samples were collected at the time of primary surgical debulking procedure and were stored either as snap-frozen specimens or formalin-fixed, paraffin-embedded (FFPE) tissue blocks.
The diagram in Suppl. Fig. 1 outlines the number of available clinical specimens used in this study and indicates which were evaluable for clinical response. Archived tumor samples were available from 19 patients and were grouped into 4 major histologic subtypes: serous (n = 7), endometrioid (n = 2), clear cell (n = 4), and poorly differentiated adenocarcinoma (n = 6); none of our study cohort patients had mucinous histology.
Immunohistochemistry
All FFPE tissue blocks from the primary tumors were cut at 4 μm. Tissue sections were deparaffinized and peroxidase activity was blocked with 10% hydrogen peroxide in methanol (Sigma) for 30 min. Antigen retrieval was performed by boiling tissue sections in 0.1 M citrate buffer (pH 6.0) for 20 min. MUC1 (clone HMPV 1:400, BD Biosciences), CA125 (clone X325 1:500, Abcam), and isotype control (mouse IgG1 1:400 BD Biosciences) primary antibodies were incubated on tissue sections for 1 h at room temperature. A goat anti-mouse IgG biotinylated secondary antibody (1:50, BD Biosciences) was incubated on tissue sections for 30 min, followed by avidin-HRP (Vectastain ABC kit) for 30 min at room temperature. Lastly, tissue sections were incubated with diaminobenzadene (DAB) substrate and then counterstained with hematoxylin (SelecTech).
All hematoxylin and eosin (H&E) and immuno-stained slides were reviewed by a pathologist (EE) with expertise in gynecologic oncology. The images were acquired with a PowerShot A640 Canon camera attached to an Axiostar Plus Zeiss microscope, using AxioVision Rel. 4.6 software, Carl Zeiss.
ELISA
Soluble MUC1 (CA15-3) was assessed in the sera of patients at early and late time points (described above), using a commercially available sandwich ELISA kit (Prolias, PS-1015). Briefly, experimental and control sera (from healthy subjects without known gynecologic malignancies) were diluted 51-fold using the sample diluent and dispensed, in duplicates. An internal standard curve allowed for the measurement of CA15-3 concentrations (U/mL) in the diluted serum samples. Serum CA-125 levels (U/mL) were determined at Magee-Women’s Hospital clinical laboratory. Early values were considered to be the serum CA-125 levels immediately prior to study enrollment or otherwise the first recorded measurements following enrollment. Late values were considered to be the serum CA-125 level occurring near the time of each patient’s final IP IL-2 treatment.
Serum anti-MUC1 and anti-MUC16 IgM and IgG antibody levels were measured using an indirect enzyme-linked immunosorbent assay (ELISA) [9–11]. Briefly, 96-well Immulon4 ELISA plates (Thermo Electro Corporation) were half-coated with 2.5% bovine serum albumin (BSA) and either MUC1 (10μg/mL) [12, 13] or CA125 (1,000 U/mL) peptides. The MUC1 100mer peptide comprises five 20 amino acid long tandem repeats [HGVTSAPDTRPAPGSTAPPA]5. This sequence is derived from the MUC1 extracellular domain and was synthesized at the University of Pittsburgh Peptide Synthesis Facility. The CA125 peptide used to coat the plate was purchased from Biodesign International. Following overnight incubation at room temperature, the wells were incubated with 2.5% BSA to block non-specific absorption sites. Serum samples (1:40) were incubated for 1 h at room temperature, and peptide-bound serum immunoglobulins were detected using alkaline phosphatase-conjugated goat anti-human IgG (1:2,000, Sigma) or goat anti-human IgM antibodies (1:2,000, Sigma). P-nitrophenyl phosphate substrate was then added to all wells and incubated for 30 min at room temperature. Samples were run in triplicates, and assay results were calculated using Ascent Software for Multiskan version 2.6 (Thermo Scientific). The results were reported and used for further analysis after extracting the optical density (OD) values from control (BSA-coated) wells.
Statistical analysis
The overall survival (OS) was defined as the time interval between start date of treatment and date of death (or last follow-up date if the patient was still alive). Kaplan–Meier method was used to estimate the survival function. Associations between early and late changes in anti-MUC1 and anti-CA125 IgM or IgG levels and overall survival or treatment response were determined by proportional hazard regression or Kruskal–Wallis tests, respectively. Differences between early and late time point IgG or IgM levels for both anti-MUC1 and anti-CA125 antibodies were determined via Wilcoxon Rank Sum Tests. Four categories of clinical response were defined as follows: stable disease (SD), progressive disease (PD), partial response (PR), and complete response (CR). Patients with SD, PR, and CR were grouped as “responders” and compared to those with PD or “non-responders”. Statistical analyses was performed using SAS v 9.1 (Cary, NC), and a P value < 0.05 was considered statistically significant.
Results
MUC1 and MUC16 antigens show differential expression in platinum-resistant ovarian tumors
We identified tumor MUC1 and MUC16 by immunohistochemistry (IHC) on paraffin-embedded tissue sections, using MUC1- and MUC16-specific monoclonal antibodies. While both mucins are normally present in low levels in the lumen of benign endometrial glands, they were undetectable or only minimally expressed on benign ovarian surface epithelium (OSE; Fig. 1a).
Fig. 1.

MUC1 and MUC16 expression in healthy tissues and ovarian tumors according to histology. Immunohistochemical staining for MUC1 (clone HMPV, 1:400) and MUC16 (clone X325 1:500) were performed on all available formalin-fixed, paraffin-embedded tissue biopsies (n = 19). MUC1- or MUC16-expressing cells are shown in brown. a MUC1 and MUC16 are undetectable on the normal ovarian surface epithelium (OSE, top left and right panels, respectively). The endometrial glands express low levels of both MUC1 and MUC16 on the apical side, facing the lumen of ducts (lower left and right panels, respectively). b Increased MUC1 and MUC16 expression in ovarian epithelial tumors, according to histology. c Immunohistochemical staining score based on area (percentage of positive-stained cells): 0, no staining; 1+, <10% of tissue with positive staining; 2+ , 10–50% of tissue with positive staining; 3+, >50% of tissue with positive staining. All tumor sections were scored for MUC1 and MUC16, and summarized data are shown in Table 1
Nineteen archived tumor samples were available for immunohistochemical study with MUC1 and MUC16, from our 28 previously reported IP IL-2 clinical trial enrolled patients (Suppl. Fig 1, consort diagram) [8]. These were divided into 4 histologic subtypes: serous (n = 7), endometrioid (n = 2), clear cell (n = 4), and poorly differentiated adenocarcinoma (n = 6). Our results show that in contrast to baseline OSE cells, which are mostly negative for both mucins, the epithelial ovarian tumors variably expressed MUC1 and MUC16, regardless of histologic subtype (Fig. 1b).
The immunohistochemical results were semiquantitatively analyzed based on the proportion of stained tumor cells and the staining intensity, using a scoring scale of 0–3+ and 0–4+, respectively (Table 1). Examples of immunohistochemical scoring system based on area are shown in Fig. 1c. Our evaluation showed that while all tumors were MUC1 positive and expressed extremely high MUC1 levels (scores ≥3+ in 100% of tumors), MUC16 positive tumors were less prevalent (78.9%, P = 0.05) in this cohort (Table 1). The greatest proportion of tumors (31.6%) received MUC16 intensity scores of 2+, and 4 of 19 tumors (21%) were entirely negative, consistent with previous reports [14–16]. Approximately 16% of tumors (3 of 19) had MUC16 present in more than 50% of the examined tumor areas. Both staining intensity and area scores were significantly higher for tumor MUC1 than MUC16 (P < 0.0001, Table 1).
Table 1.
Semiquantitative analysis of MUC1 and MUC16 tumor expression by immunohistochemistry (n = 19)
| Intensity scoringa | MUC1 n (%) | MUC16 n (%) | Area scoringb | MUC1 n (%) | MUC16 n (%) |
|---|---|---|---|---|---|
| 0 | 0 (0%) | 4 (21.1%) | 0 | 0 (0%) | 4 (21.1%) |
| 1+ | 0 (0%) | 3 (15.8%) | 1+ | 0 (0%) | 3 (15.8%) |
| 2+ | 0 (0%) | 6 (31.6%) | 2+ | 0 (0%) | 9 (47.4%) |
| 3+ | 9 (47.4%) | 4 (21.1%) | 3+ | 19 (100%) | 3 (15.8%) |
| 4+ | 10 (52.6%) | 2 (10.5%) | N/A | N/A | N/A |
Average area scoring for MUC1 and MUC16 were 3 and 1.58, respectively (P < 0.0001, Students t test)
N/A not applicable
aMUC1 and MUC16 were scored for staining intensity using a 0–4+scale: 0, no staining; 1+, faintly positive; 2+, positive; 3+, strongly positive; 4+, very strongly positive; Average intensity scoring for MUC1 and MUC16 were 3.53 and 1.84, respectively (P < 0.0001, Students t test)
bMUC1 and MUC16 staining was scored for the percentage of positive cells of total area occupied by tumor, using a 0–3 + scoring system: 0, no staining; 1+, <10% of tissue with positive staining; 2+ , 10–50% of tissue with positive staining; 3+ , >50% of tissue with positive staining
We also identified differential cellular localization for MUC1 and MUC16. MUC16 remained mostly membrane-bound, while MUC1 was variably present on the membrane and throughout the cytoplasm in the majority of the epithelial ovarian cancer, regardless of histologic subtypes (Fig. 1). Furthermore, MUC1 expression appeared to vary between membranous and cytoplasmic staining, depending on the nuclear grade of the tumor (Suppl Fig. 2). It was expressed in the cytoplasm of high-grade (poorly differentiated) tumors, whereas cell surface, circumscribed expression was seen in lower-grade (well differentiated) tumors. When present, MUC16 remained membranous, regardless of nuclear grade (Suppl Fig. 2). These data suggest that although they are both membrane-bound mucins with some shared similarities (increased tumor expression from baseline OSE levels), MUC1 and MUC16 have many contrasting features (expression intensity, cellular distribution pattern) that are likely to affect their immunogenic potential.
Soluble MUC1 (CA15-3) and MUC16 (CA125) as prognostic factors
Tumor MUC1 and MUC16 can also be found in a soluble, serum-circulating form [2]. Given the observed overall overexpression of tumor-bound MUC1 and MUC16 antigens, we examined the sera of all patients for the presence of both mucins in a secreted form.
We measured soluble MUC1 (CA 15-3) and MUC16 (CA125) serum levels from 28 patients with platinum-resistant or -refractory ovarian tumors and studied the changes in those levels during treatment with IP IL-2. The upper limit for a normal reading in both assays was 35 U/mL.
Our results (Table 2) show that at baseline, 100 and 43% patients had increased MUC1 and MUC16 levels, respectively, correlating with our immunohistochemical findings. MUC1 tissue overexpression largely mirrored the elevated serum MUC1 levels (>35 U/mL, CA 15-3 test). Furthermore, the average measurements for soluble MUC1 (1,556.42 U/mL) were much more prominent than for MUC16 (132.72 U/mL, P < 0.001). Upon treatment completion, the average values continued to remain elevated for both mucins. The increases from baseline (early time points) to treatment completion (late time points) were significant for MUC16 (P = 0.0258, Wilcoxon rank sum test), but not for MUC1 (P = 0.8347, Wilcoxon rank sum test).
Table 2.
Serum MUC1 (CA15-3) and MUC16 (CA125) measurements in patients with treatment-resistant tumors receiving IP IL-2
| Study time pointa | Within normal limitsb n (%) | Elevated serum levelsc n (%) | Average Serum Leveld (min–max) |
|---|---|---|---|
| MUC1 (CA15-3) | |||
| Early (N = 28) | 0 (0%) | 28 (100%) | 1,556.42 (60.92–5,172.77) |
| Late (N = 27) | 0 (0%) | 27 (100%) | 1,968.00 (44.18–9,007.68) |
| MUC16 (CA125) | |||
| Early (N = 28) | 16 (57.1%) | 12 (42.9%) | 132.72 (10–1,456.2) |
| Late (N = 27) | 8 (28.6%) | 20 (71.4%) | 301.1 (10–2,475) |
aMeasurements were taken at two time points: early (baseline) and late (treatment completion)
bTable values represent the number (n) and percentage of the patients with MUC1 or MUC16 serum values within normal limits (35 U/mL for both MUC1 and MUC16)
cMUC1 and MUC16 measurements >35U/mL were considered elevated
dAverage serum levels (Minimum, Maximum) for MUC1 or MUC16 expressed as units/mL
Further statistical analyses, however, revealed that persistently increased soluble MUC1 levels were significant risk factors for survival. Higher MUC1 values at late time points and rising MUC1 values during treatment were both associated with increased risk of death (P = 0.003 and P = 0.006, respectively), consistent with results from breast cancer patients showing elevated soluble MUC1 as a negative predictor of outcome [17, 18]. Although early soluble MUC1 levels were not significant predictors (P = 0.075), significance could potentially be reached with a larger patient cohort.
Somewhat paradoxically, 57% of patients in our cohort showed baseline MUC16 (CA125) within normal limits, despite having evidence of residual disease, confirmed by laparoscopy or laparotomy. Importantly, however, most subjects had CA125 levels greater than 10 U/mL, consistent with data from Markman et al. [19] demonstrating nadir CA125 levels >10 U/mL were associated with shorter time to recurrence. Nevertheless, CA125 showed here significant increases during serial measurements, supporting its clinical usability to monitor persistent disease.
While confirming MUC16 (CA125) as a reliable marker for monitoring treatment response, our findings reveal increased soluble MUC1 (CA15-3) as a negative outcome predictor in treatment-resistant ovarian cancer.
MUC1- and MUC16-specific antibodies as immune correlates of response to treatment and survival
Given the elevated levels of MUC1 and MUC16 at the tumor site and as soluble antigens, we hypothesized that spontaneous humoral immunity to these antigens can be triggered and that specific immunoglobulins will be detected in the patients’ sera. To test this, we measured MUC1- and MUC16-specific antibodies by ELISA, using well established, standardized protocols [9–11]. For each patient, antibodies were quantified in sera collected at two time points (early and late) during IP IL-2 treatment. The ELISA readings that were significantly higher than those obtained from control protein-coated wells were indicative of antigen-specific antibody presence. Our results showed that at baseline, 92 and 50% of patients had detectable MUC1-specific IgM and IgG antibodies, respectively. The frequency of these responses was only 60 and 28% for MUC16-specific IgM and IgG antibodies, respectively. Furthermore, the amplitude of MUC1- versus MUC16-specific antibody responses was strikingly different, as evidenced by the increased ELISA measurements for MUC1 and much less for MUC16 antibodies (Fig. 2). No significant changes in either MUC1 or MUC16 antibody levels (IgM or IgG) were observed from early to late time points during IL-2 treatment (n = 28 patients, Wilcoxon signed rank test).
Fig. 2.
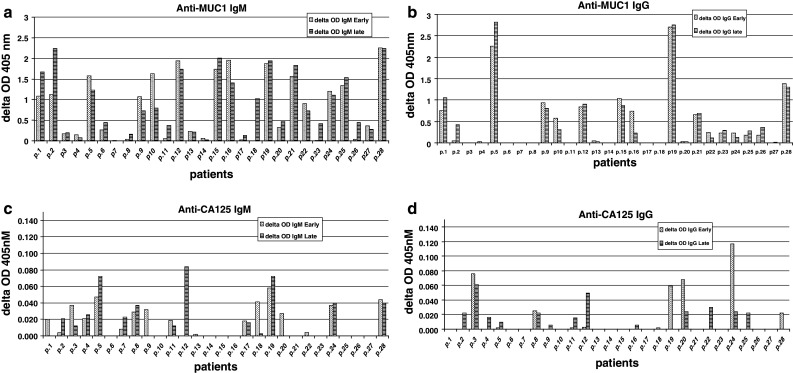
Frequency and amplitude of MUC1- and MUC16-specific antibodies by ELISA. Serum samples from n = 28 patients were run in triplicate and average values were plotted. Early (divot) and late (narrow horizontal) IgM (left panels) and IgG (right panels) antibody response to MUC1 (a and b) and CA125 (c and d). The y axis shows the average delta OD (optical density) measurements (OD sample-OD control) at 405 nm
We next postulated that MUC1- and MUC16-specific antibodies influence the tumor biology and may serve as markers of response to treatment and disease outcome. The patients were grouped by treatment response as either responders or non-responders (defined in Materials and Methods). Of the 31 patients enrolled, only 24 patients were available for laparoscopic evaluation of response [8]. In the responders group (n = 13), we included patients with complete response (CR, n = 4), stable disease (SD, n = 7), and partial response (PR, n = 2) and compared their marker expression to those with progressive disease (PD, non-responders, n = 11), using Kruskal–Wallis statistical analysis. Our results revealed significant differences in mean measurements of MUC1 IgG antibodies among responders and non-responders (Table 3) with non-responders showing higher mean anti-MUC1 IgG than responders at both early and late time points (P = 0.025 and P = 0.022, respectively Fig. 3). In comparison, there was no significant difference between early and late anti-MUC16 IgG measurements among responders and non-responders (P = 0.334 and P = 0.174, respectively; Table 3). Similarly, neither MUC1- nor MUC16-specific IgM antibody responses were significantly associated with treatment response (Table 3).
Table 3.
MUC1 and MUC16 antigen and antibody correlations with treatment response (n = 24) and overall survival (n = 28)
| Measurementa | Study time pointb | Treatment responsec P value | Overall survival P value (HRd) |
|---|---|---|---|
| Serum MUC1 (CA15-3) | Early | 0.977 | 0.075 |
| Late | 0.854 | 0.003 (1.0004) | |
| Change | 0.951 | 0.006 (1.0007) | |
| MUC1-IgG | Early | 0.034 | 0.070 |
| Late | 0.039 | 0.082 | |
| Change | 0.254 | 0.382 | |
| MUC1-IgM | Early | 0.137 | 0.052 (1.42) |
| Late | 0.962 | 0.009 (1.50) | |
| Change | 0.620 | 0.106 | |
| Serum MUC16 (CA125) | Early | 0.750 | 0.202 |
| Late | 0.750 | 0.116 | |
| Change | 0.325 | 0.161 | |
| MUC16-IgG | Early | 0.334 | 0.732 |
| Late | 0.174 | 0.325 | |
| Change | 0.369 | 0.797 | |
| MUC16-IgM | Early | 0.655 | 0.786 |
| Late | 0.536 | 0.201 | |
| Change | 0.111 | 0.303 |
aSoluble MUC1 and MUC16 were measured by CA15-3 and CA125 assays, respectively. Antibodies were measured by ELISA
bMeasurements were taken at early (baseline) and late time points (treatment completion)
cPatients were grouped in responders (CR + SD + PR, n = 13) and non-responders (PD, n = 11) as explained in Materials and Methods. Correlations with treatment response were performed via Kruskal–Wallis testing
dCorrelations with overall survival were performed via Wald proportional hazard regression modeling. HR hazard ratio. Significant values (P < 0.05) are highlighted in bold. The HR measurements for significant p values only are shown
Fig. 3.

MUC1 antibody responses by treatment response. Patients (n = 24) were classified as responders and non-responders according to criteria described in “Materials and methods”. Kruskal–Wallis tests were used to detect significant differences in mean early and late IgM (a, b) and IgG (c, d) antibody measurements by ELISA among responders and non-responders. Neither anti-MUC1 early (a) or late (b) IgM antibody responses showed significant differences between responders and non-responders. Non-responders have higher early mean IgG than responders (a, P = 0.025) and higher late mean IgG than responders (b, P = 0.022). Using statistical analysis software (SAS), schematic box-plots were made for significant associations
We also analyzed the changes in anti-MUC1 and anti-MUC16 antibodies from early to late time points during IL-2 treatment, according to treatment response. The only significant changes were for MUC1-specific IgM antibodies in the responders group. Patients in this group showed an increase in IgM antibody levels (P = 0.033, Wilcoxon signed rank test). No significant changes were observed for anti-MUC1 IgG. Antibodies to MUC16 of either isotype did not significantly change during IL-2 treatment in either responders or non-responders.
We also identified significant antibody correlations with survival. The anti-MUC1 IgM antibodies were inversely correlated with the overall survival at both early (P = 0.052) and late (P = 0.009) time points (Table 3). As seen with IgG response, higher anti-MUC1 IgM measurements were associated with reduced survival and poorer prognosis. We found a non-significant association between higher early or late anti-MUC1 IgG measurements and poorer prognosis (P = 0.07 and P = 0.08, respectively; Table 3).
MUC16-specific antibodies showed no significant associations between early or late anti-MUC16 IgG or IgM measurements and overall survival (Table 3).
Discussion
The vast majority of translational cancer research studies to date have primarily focused on quantitative and qualitative measurements of natural or vaccine-induced tumor antigen-specific T-cell responses and their utility as immune biomarkers for disease management [20–22]. Much less is known, however, about how often humoral immune responses against tumor antigens are generated in cancer patients and how tumor biology and ultimately disease outcomes may be modulated by naturally occurring, circulating antibodies [23]. We reported here several important characteristics of MUC1 and MUC16, two of the most commonly studied ovarian tumor-associated antigens [2], using a side-by-side comparison of their tissue expression, serum antigen levels, and natural immunogenicity. Based on a small cohort of patients treated with IP IL-2, our studies revealed marked MUC1 overexpression in 100% of the platinum-resistant and platinum-refractory tumors studied and identified soluble MUC1 and serum MUC1-specific antibodies as markers of clinical response and survival. Despite its small sample size, we chose this patient cohort because of the availability of long-term survival data, which in some patients exceeded 10 years [8], and the encouraging clinical responses seen in a patient subset. While IL-2 in vivo effects are likely cell mediated, we postulated that the immune modulatory properties of IL-2 can indirectly trigger systemic variations in tumor-associated antigens and in antigen-specific antibody responses. We found that the increases from baseline (early time points) to treatment completion (late time points) were significant for MUC16 but not for MUC1 antigen. The MUC1- and MUC16-specific antibodies varied with treatment although the only significant changes were for MUC1-specific IgM and only for patients in the responder group. We also identified several correlations between MUC1 antibodies and response and survival, suggesting that a combination of tests measuring MUC16 and humoral immunity to MUC1 may provide prognostic importance in platinum-resistant ovarian cancer.
In contrast to cellular immunity, where well-documented evidence shows that robust Th1 and cytotoxic lymphocyte-mediated tumor-specific immune responses correlate with better prognosis [24–26], many unanswered questions still remain regarding the biologic significance of anti-tumor antibodies and their utility for early disease detection, post-therapy surveillance and/or estimation of prognosis. Using MUC16 as the hallmark antigen for ovarian cancer, we compared and contrasted MUC1 and MUC16 based on their tissue expression, serum levels, and targeted antibodies. Our report shows high frequency and high amplitude of MUC1-specific IgM and IgG antibodies among patients with recurrent platinum-resistant or -refractory ovarian cancer. Although all patients had MUC1 positive lesions and abnormally high soluble MUC1 (CA15-3) levels, not all exhibited similar antibody levels or isotype profiles, revealing notable variability of host-versus-cancer humoral immune surveillance mechanisms. The increased frequency of MUC1-specific IgM responses observed is likely due to the augmented MUC1 antigenic load (confirmed by our histologic findings and serum antigen measurements), which can directly influence B-cell responses [27, 28]. In addition, we observed significant increases in IgM levels during treatment in the responders group, further suggesting that IgM antibodies (likely the first ones to fluctuate in response to variations in tumor antigen levels) may be better for monitoring the effects of treatment-induced, antigen-specific humoral immunity. The presence of IgG antibodies, on the other hand, demonstrates an in vivo IgM-to-IgG isotype switch, likely mediated by CD4 Th2 cells [29]. Although we have not addressed here the Th2 status of the enrolled patients, a Th2-driven immune imbalance has been often reported in cancer and is generally seen as negatively influencing survival [30, 31]. Humoral immune responses against other tumor antigens, like p53 [32] and NY-ESO-1 [33], have also been reported as poor prognostic indicators in ovarian cancer. Consistent with these findings, our results show an inverse correlation between naturally occurring MUC1-specific antibodies and clinical response or survival in patients with platinum-resistant or -refractory disease. Oei et al. also showed that platinum-sensitive ovarian cancer patients with natural immunity to MUC1 had no clear benefit in disease-free survival and overall survival [34], suggesting that platinum resistance might not play a role in the negative association seen in our study.
In contrast to our findings, anti-MUC1 antibodies have been reported as favorable prognostic indicators in patients with pancreatic, lung, and breast cancer and are believed to interfere with MUC1-induced tumor growth and metastasis [35–37]. These apparent organ-specific discrepancies underline the need for better defined criteria of antibody measurements (like titer and isotype) as indicators of optimal immunity. Furthermore, there may also be differential consequences between humoral MUC1 immunity generated in young women in response to benign modifications, which seems to be inversely associated with ovarian cancer risk [38], and antibody responses accompanying advanced stage tumors, which may be negative predictors of response and survival. Understanding these qualitative and quantitative differences in pre-existing antibody profiles will not only improve their prognostic value but will also influence the development of new therapeutic and preventive MUC1 vaccines many of which are designed to trigger de novo antibodies in the host. In light of our results, antigen-specific immunization of late stage cancer patients with platinum-resistant disease should take into consideration the baseline antibody levels and tailor the response via Th1 and cytotoxic T-cell-mediated immunity, rather than further increasing the patients’ pre-existing anti-MUC1 antibody titers.
In summary, while MUC16 (CA125) continues to remain a useful biomarker for monitoring disease recurrence and response to treatment [39–41], MUC1 (CA15-3) and MUC1-specific antibodies may serve as prognostic immune biomarkers in platinum-resistant ovarian cancer and can provide valuable insight for the immune status of the host. Larger studies in both platinum sensitive and refractory disease are required in order to confirm MUC1 antibodies as markers of survival and clinical response to therapy and to validate their significance for ovarian tumor immune biology.
Electronic supplementary material
Below is the link to the electronic supplementary material.
Acknowledgments
We would like to thank Lindsay Mock and Joan Brozick for their excellent technical assistance and Drs Kristin Zorn and Daniel Cramer for critically reviewing the manuscript. This work was supported in part by NIH R21 CA74105-02S1, the American Cancer Society, the Scaife Foundation and the Pennsylvania Department of Health.
Footnotes
The authors R. A. Budiu and G. Mantia-Smaldone contributed equally to this work.
References
- 1.Guarneri V, Piacentini F, Barbieri E, Conte PF. Achievements and unmet needs in the management of advanced ovarian cancer. Gynecol Oncol. 2010;117:152–158. doi: 10.1016/j.ygyno.2009.11.033. [DOI] [PubMed] [Google Scholar]
- 2.Kufe DW. Mucins in cancer: function, prognosis and therapy. Nat Rev Cancer. 2009;9:874–885. doi: 10.1038/nrc2761. [DOI] [PMC free article] [PubMed] [Google Scholar]
- 3.Vlad AM, Kettel JC, Alajez NM, Carlos CA, Finn OJ. MUC1 immunobiology: from discovery to clinical applications. Adv Immunol. 2004;82:249–293. doi: 10.1016/S0065-2776(04)82006-6. [DOI] [PubMed] [Google Scholar]
- 4.Cheever MA, Allison JP, Ferris AS, Finn OJ, Hastings BM, Hecht TT, Mellman I, Prindiville SA, Viner JL, Weiner LM, Matrisian LM. The prioritization of cancer antigens: a national cancer institute pilot project for the acceleration of translational research. Clin Cancer Res. 2009;15:5323–5337. doi: 10.1158/1078-0432.CCR-09-0737. [DOI] [PMC free article] [PubMed] [Google Scholar]
- 5.Hunter VJ, Daly L, Helms M, Soper JT, Berchuck A, Clarke-Pearson DL, Bast RC., Jr The prognostic significance of CA 125 half-life in patients with ovarian cancer who have received primary chemotherapy after surgical cytoreduction. Am J Obstet Gynecol. 1990;163:1164–1167. doi: 10.1016/0002-9378(90)90680-6. [DOI] [PubMed] [Google Scholar]
- 6.Chauhan SC, Singh AP, Ruiz F, Johansson SL, Jain M, Smith LM, Moniaux N, Batra SK. Aberrant expression of MUC4 in ovarian carcinoma: diagnostic significance alone and in combination with MUC1 and MUC16 (CA125) Mod Pathol. 2006;19:1386–1394. doi: 10.1038/modpathol.3800646. [DOI] [PubMed] [Google Scholar]
- 7.Bast RC, Jr, Feeney M, Lazarus H, Nadler LM, Colvin RB, Knapp RC. Reactivity of a monoclonal antibody with human ovarian carcinoma. J Clin Invest. 1981;68:1331–1337. doi: 10.1172/JCI110380. [DOI] [PMC free article] [PubMed] [Google Scholar]
- 8.Vlad AM, Budiu RA, Lenzner DE, Wang Y, Thaller JA, Colonello K, Crowley-Nowick PA, Kelley JL, Price FV, Edwards RP. A phase II trial of intraperitoneal interleukin-2 in patients with platinum-resistant or platinum-refractory ovarian cancer. Cancer Immunol Immunother. 2010;59:293–301. doi: 10.1007/s00262-009-0750-3. [DOI] [PMC free article] [PubMed] [Google Scholar]
- 9.Gordon AN, Schultes BC, Gallion H, Edwards R, Whiteside TL, Cermak JM, Nicodemus CF. CA125- and tumor-specific T-cell responses correlate with prolonged survival in oregovomab-treated recurrent ovarian cancer patients. Gynecol Oncol. 2004;94:340–351. doi: 10.1016/j.ygyno.2004.04.024. [DOI] [PubMed] [Google Scholar]
- 10.Pfisterer J, du Bois A, Sehouli J, Loibl S, Reinartz S, Reuss A, Canzler U, Belau A, Jackisch C, Kimmig R, Wollschlaeger K, Heilmann V, Hilpert F. The anti-idiotypic antibody abagovomab in patients with recurrent ovarian cancer. A phase I trial of the AGO-OVAR. Ann Oncol. 2006;17:1568–1577. doi: 10.1093/annonc/mdl357. [DOI] [PubMed] [Google Scholar]
- 11.Silk AW, Schoen RE, Potter DM, Finn OJ. Humoral immune response to abnormal MUC1 in subjects with colorectal adenoma and cancer. Mol Immunol. 2009;47:52–56. doi: 10.1016/j.molimm.2008.12.025. [DOI] [PMC free article] [PubMed] [Google Scholar]
- 12.Lepisto AJ, Moser AJ, Zeh H, Lee K, Bartlett D, McKolanis JR, Geller BA, Schmotzer A, Potter DP, Whiteside T, Finn OJ, Ramanathan RK. A phase I/II study of a MUC1 peptide pulsed autologous dendritic cell vaccine as adjuvant therapy in patients with resected pancreatic and biliary tumors. Cancer Ther. 2008;6:955–964. [PMC free article] [PubMed] [Google Scholar]
- 13.Ramanathan RK, Lee KM, McKolanis J, Hitbold E, Schraut W, Moser AJ, Warnick E, Whiteside T, Osborne J, Kim H, Day R, Troetschel M, Finn OJ. Phase I study of a MUC1 vaccine composed of different doses of MUC1 peptide with SB-AS2 adjuvant in resected and locally advanced pancreatic cancer. Cancer Immunol Immunother. 2005;54:254–264. doi: 10.1007/s00262-004-0581-1. [DOI] [PMC free article] [PubMed] [Google Scholar]
- 14.Rosen DG, Wang L, Atkinson JN, Yu Y, Lu KH, Diamandis EP, Hellstrom I, Mok SC, Liu J, Bast RC., Jr Potential markers that complement expression of CA125 in epithelial ovarian cancer. Gynecol Oncol. 2005;99:267–277. doi: 10.1016/j.ygyno.2005.06.040. [DOI] [PubMed] [Google Scholar]
- 15.BJR JacobsI. CA125 tumour-associated antigen: a review of the literature. Hum Reprod. 1989;4:1–12. doi: 10.1093/oxfordjournals.humrep.a136832. [DOI] [PubMed] [Google Scholar]
- 16.Rosen DG, Huang X, Deavers MT, Malpica A, Silva EG, Liu J. Validation of tissue microarray technology in ovarian carcinoma. Mod Pathol. 2004;17:790–797. doi: 10.1038/modpathol.3800120. [DOI] [PubMed] [Google Scholar]
- 17.Al-azawi D, Kelly G, Myers E, McDermott EW, Hill AD, Duffy MJ, Higgins NO. CA 15-3 is predictive of response and disease recurrence following treatment in locally advanced breast cancer. BMC Cancer. 2006;6:220. doi: 10.1186/1471-2407-6-220. [DOI] [PMC free article] [PubMed] [Google Scholar]
- 18.Duffy MJ, Duggan C, Keane R, Hill AD, McDermott E, Crown J, O’Higgins N. High preoperative CA 15-3 concentrations predict adverse outcome in node-negative and node-positive breast cancer: study of 600 patients with histologically confirmed breast cancer. Clin Chem. 2004;50:559–563. doi: 10.1373/clinchem.2003.025288. [DOI] [PubMed] [Google Scholar]
- 19.Markman M, Federico M, Liu PY, Hannigan E, Alberts D. Significance of early changes in the serum CA-125 antigen level on overall survival in advanced ovarian cancer. Gynecol Oncol. 2006;103:195–198. doi: 10.1016/j.ygyno.2006.02.024. [DOI] [PubMed] [Google Scholar]
- 20.Clarke B, Tinker AV, Lee CH, Subramanian S, Rijn M, Turbin D, Kalloger S, Han G, Ceballos K, Cadungog MG, Huntsman DG, Coukos G, Gilks CB. Intraepithelial T cells and prognosis in ovarian carcinoma: novel associations with stage, tumor type, and BRCA1 loss. Mod Pathol. 2008;22(3):393–402. doi: 10.1038/modpathol.2008.191. [DOI] [PubMed] [Google Scholar]
- 21.Jeong IG, Han KS, Joung JY, Choi WS, Hwang SS, Yang SO, Seo HK, Chung J, Lee KH. Analysis of changes in the total lymphocyte and eosinophil count during immunotherapy for metastatic renal cell carcinoma: correlation with response and survival. J Korean Med Sci. 2007;22(Suppl):S122–S128. doi: 10.3346/jkms.2007.22.S.S122. [DOI] [PMC free article] [PubMed] [Google Scholar]
- 22.Sato E, Olson SH, Ahn J, Bundy B, Nishikawa H, Qian F, Jungbluth AA, Frosina D, Gnjatic S, Ambrosone C, Kepner J, Odunsi T, Ritter G, Lele S, Chen YT, Ohtani H, Old LJ, Odunsi K. Intraepithelial CD8 + tumor-infiltrating lymphocytes and a high CD8 +/regulatory T cell ratio are associated with favorable prognosis in ovarian cancer. Proc Natl Acad Sci USA. 2005;102:18538–18543. doi: 10.1073/pnas.0509182102. [DOI] [PMC free article] [PubMed] [Google Scholar]
- 23.Reuschenbach M, von Knebel Doeberitz M, Wentzensen N. A systematic review of humoral immune responses against tumor antigens. Cancer Immunol Immunother. 2009;58:1535–1544. doi: 10.1007/s00262-009-0733-4. [DOI] [PMC free article] [PubMed] [Google Scholar]
- 24.Egeter O, Mocikat R, Ghoreschi K, Dieckmann A, Rocken M. Eradication of disseminated lymphomas with CpG-DNA activated T helper type 1 cells from nontransgenic mice. Cancer Res. 2000;60:1515–1520. [PubMed] [Google Scholar]
- 25.Hunder NN, Wallen H, Cao J, Hendricks DW, Reilly JZ, Rodmyre R, Jungbluth A, Gnjatic S, Thompson JA, Yee C. Treatment of metastatic melanoma with autologous CD4 + T cells against NY-ESO-1. N Engl J Med. 2008;358:2698–2703. doi: 10.1056/NEJMoa0800251. [DOI] [PMC free article] [PubMed] [Google Scholar]
- 26.Muller-Hermelink N, Braumuller H, Pichler B, Wieder T, Mailhammer R, Schaak K, Ghoreschi K, Yazdi A, Haubner R, Sander CA, Mocikat R, Schwaiger M, Forster I, Huss R, Weber WA, Kneilling M, Rocken M. TNFR1 signaling and IFN-gamma signaling determine whether T cells induce tumor dormancy or promote multistage carcinogenesis. Cancer Cell. 2008;13:507–518. doi: 10.1016/j.ccr.2008.04.001. [DOI] [PubMed] [Google Scholar]
- 27.Lanzavecchia A. Antigen-specific interaction between T and B cells. Nature. 1985;314:537–539. doi: 10.1038/314537a0. [DOI] [PubMed] [Google Scholar]
- 28.Rock KL, Benacerraf B, Abbas AK. Antigen presentation by hapten-specific B lymphocytes. I. Role of surface immunoglobulin receptors. J Exp Med. 1984;160:1102–1113. doi: 10.1084/jem.160.4.1102. [DOI] [PMC free article] [PubMed] [Google Scholar]
- 29.Cerutti A, Zan H, Schaffer A, Bergsagel L, Harindranath N, Max EE, Casali P. CD40 ligand and appropriate cytokines induce switching to IgG, IgA, and IgE and coordinated germinal center and plasmacytoid phenotypic differentiation in a human monoclonal IgM + IgD + B cell line. J Immunol. 1998;160:2145–2157. [PMC free article] [PubMed] [Google Scholar]
- 30.Romagnani S. The Th1/Th2 paradigm. Immunol Today. 1997;18:263–266. doi: 10.1016/S0167-5699(97)80019-9. [DOI] [PubMed] [Google Scholar]
- 31.Terabe M, Park JM, Berzofsky JA. Role of IL-13 in regulation of anti-tumor immunity and tumor growth. Cancer Immunol Immunother. 2004;53:79–85. doi: 10.1007/s00262-003-0445-0. [DOI] [PMC free article] [PubMed] [Google Scholar]
- 32.Hogdall EV, Hogdall CK, Blaakaer J, Heegaard NH, Glud E, Christensen L, Bock JE, Norgaard-Pedersen B, Wiik A, Kjaer SK. P53 autoantibodies in sera from Danish ovarian cancer patients and their correlation with clinical data and prognosis. Apmis. 2002;110:545–553. doi: 10.1034/j.1600-0463.2002.11007805.x. [DOI] [PubMed] [Google Scholar]
- 33.Odunsi K, Jungbluth AA, Stockert E, Qian F, Gnjatic S, Tammela J, Intengan M, Beck A, Keitz B, Santiago D, Williamson B, Scanlan MJ, Ritter G, Chen YT, Driscoll D, Sood A, Lele S, Old LJ. NY-ESO-1 and LAGE-1 cancer-testis antigens are potential targets for immunotherapy in epithelial ovarian cancer. Cancer Res. 2003;63:6076–6083. [PubMed] [Google Scholar]
- 34.Oei AL, Moreno M, Verheijen RH, Sweep FC, Thomas CM, Massuger LF, von Mensdorff-Pouilly S. Induction of IgG antibodies to MUC1 and survival in patients with epithelial ovarian cancer. Int J Cancer. 2008;123:1848–1853. doi: 10.1002/ijc.23725. [DOI] [PubMed] [Google Scholar]
- 35.Hamanaka Y, Suehiro Y, Fukui M, Shikichi K, Imai K, Hinoda Y. Circulating anti-MUC1 IgG antibodies as a favorable prognostic factor for pancreatic cancer. Int J Cancer. 2003;103:97–100. doi: 10.1002/ijc.10801. [DOI] [PubMed] [Google Scholar]
- 36.Hirasawa Y, Kohno N, Yokoyama A, Kondo K, Hiwada K, Miyake M. Natural autoantibody to MUC1 is a prognostic indicator for non-small cell lung cancer. Am J Respir Crit Care Med. 2000;161:589–594. doi: 10.1164/ajrccm.161.2.9905028. [DOI] [PubMed] [Google Scholar]
- 37.von Mensdorff-Pouilly S, Verstraeten AA, Kenemans P, Snijdewint FG, Kok A, Van Kamp GJ, Paul MA, Van Diest PJ, Meijer S, Hilgers J. Survival in early breast cancer patients is favorably influenced by a natural humoral immune response to polymorphic epithelial mucin. J Clin Oncol. 2000;18:574–583. doi: 10.1200/JCO.2000.18.3.574. [DOI] [PubMed] [Google Scholar]
- 38.Cramer DW, Titus-Ernstoff L, McKolanis JR, Welch WR, Vitonis AF, Berkowitz RS, Finn OJ. Conditions associated with antibodies against the tumor-associated antigen MUC1 and their relationship to risk for ovarian cancer. Cancer Epidemiol Biomarkers Prev. 2005;14:1125–1131. doi: 10.1158/1055-9965.EPI-05-0035. [DOI] [PubMed] [Google Scholar]
- 39.Rustin GJ, Bast RC, Jr, Kelloff GJ, Barrett JC, Carter SK, Nisen PD, Sigman CC, Parkinson DR, Ruddon RW. Use of CA-125 in clinical trial evaluation of new therapeutic drugs for ovarian cancer. Clin Cancer Res. 2004;10:3919–3926. doi: 10.1158/1078-0432.CCR-03-0787. [DOI] [PubMed] [Google Scholar]
- 40.Rustin GJ, Nelstrop AE, McClean P, Brady MF, McGuire WP, Hoskins WJ, Mitchell H, Lambert HE. Defining response of ovarian carcinoma to initial chemotherapy according to serum CA 125. J Clin Oncol. 1996;14:1545–1551. doi: 10.1200/JCO.1996.14.5.1545. [DOI] [PubMed] [Google Scholar]
- 41.Rustin GJ, Nelstrop AE, Tuxen MK, Lambert HE. Defining progression of ovarian carcinoma during follow-up according to CA 125: a North Thames Ovary Group Study. Ann Oncol. 1996;7:361–364. doi: 10.1093/oxfordjournals.annonc.a010602. [DOI] [PubMed] [Google Scholar]
Associated Data
This section collects any data citations, data availability statements, or supplementary materials included in this article.