

Abstract
T-box transcription factors, T-box expressed in T cells (T-bet) encoded by Tbx21 and Eomesodermin (Eomes), drive the differentiation of effector/memory T cell lineages and NK cells. The aim of the study was to determine the prognostic influence of the expression of these transcription factors in peripheral blood (pB) in a cohort of 41 metastatic (m) RCC patients before receiving sorafenib treatment and to analyze their association with the immunophenotype in pB. In contrast to Tbx21, in the multivariate analysis including clinical features, Eomes mRNA expression was identified as an independent good prognostic factor for progression-free survival (PFS, p = 0.042) and overall survival (OS, p = 0.001) in addition to a favorable ECOG performance status (p = 0.01 and p = 0.008, respectively). Eomes expression correlated positively not only with expression of Tbx21 and TGFβ1 mRNA, but also with mRNA expression of the activation marker ICOS, and with in vivo activated HLA-DR+ T cells. Eomes expression was negatively associated with TNFα-producing T cells. On protein level, Eomes was mainly expressed by CD56+CD3− NK cells in pB. In conclusion, we identified a higher Eomes mRNA expression as an independent good prognostic factor for OS and PFS in mRCC patients treated with sorafenib.
Keywords: Renal cell carcinoma, Memory T cells, Effector T cells, T-box expressed in T cells, Eomesodermin, Natural killer cells
Introduction
Metastatic renal cell cancer (mRCC) is associated with an immunosuppressive phenotype characterized by increased frequencies of regulatory T cells (Treg), type 2 cells, and inflammatory cells like myeloid-derived suppressor cells (MDSC) and neutrophils. However, not only increased frequencies of immunosuppressive cells but also alterations in the frequency and the function of effector cells of both the adaptive and the innate immunity may play a role in tumor-induced immune dysbalance [1].
The T-box transcription factors T-box expressed in T cells (T-bet) and Eomesodermin (Eomes) have been well defined as key drivers not only of immune cell development but also of cytolytic function. They are highly expressed in type 1 immune cells such as Th1, Tc1, NK, NKT, and ɣδ T cells. Their expression increases as peripheral cells become more differentiated, with the exception for NK cells. The more differentiated CD56dim cells contain less Eomes than their predecessor CD56bright cells [2]. The balance of expression of the transcription factors Eomes and T-bet has been reported to influence whether CD8+ T lymphocytes commit to memory or effector cells [3]. High T-bet expression seemed to favor effector cells [2]. T-bet levels declined as cells became more memory-like, whereas Eomes expression increased [2, 4]. The generation of a potent T cell memory response is important for mediating protective long-lasting immunity against tumors [5–7].
T-bet and Eomes drive Tc1 differentiation by preventing alternative CD8+ T cell differentiation to Tc17 or Tc2 cell [8]. T-bet has been reported to be critical for the effector function of Th1 and NK cells, but to be only partially required for CD8+ Tc1 cells. In contrast, Eomes, which is only weakly expressed in CD4+ T cells, has been proposed to play a key role in the effector function of CD8+ T cells [2, 9]. However, T-bet and Eomes act synergistically for eliminating cancer cells, but both the factors were not critical for the generation of systemic CTL activities against cancer cells. Instead, they were crucial for tumor infiltration by CD8+ T cells by controlling migration of antitumor T cells to the tumor site through regulating chemokine receptors [2].
In NK cells, T-bet and Eomes fulfill complementary roles in lineage decision. Murine studies and co-expression analysis in humans support a sequential maturation model as Eomes is necessary for the generation and maintenance of mature NK cells, whereas T-bet is necessary to attain the most terminal stages of maturation [2, 5, 6].
Also in the era of targeted therapies, there are several hints that immune dysbalance has a crucial influence on RCC course and that it might play a prognostic role. Not only markers of a systemic inflammatory response, such as neutrophils and C-reactive protein [7, 10, 11], but also immunosuppressive cells, as Treg, and soluble molecules, such as IL6, IL8, and VEGF [12–14], have been reported to have a negative prognostic impact on survival in RCC patients treated with targeted therapies. In contrast, we have previously shown that high TGFβ1 mRNA expression levels in pB were associated with improved survival in mRCC patients treated with sorafenib [15].
However, little is known about the prognostic influence of factors regulating the effector function of the antitumor immune response in mRCC patients treated with targeted therapies. The aim of the study was to determine the prognostic influence of the expression of the T-box transcription factors T-bet, encoded by Tbx21, and Eomes in peripheral blood (pB) in the previously analyzed cohort of 41 mRCC patients before receiving sorafenib treatment on mRNA and protein level. Several reports about their expression in tumor tissue underline that they are important regulators for antitumor immune response and impact on prognosis [16–19].
Here, we identified Eomes mRNA expression as an independent good prognostic factor for progression-free survival (PFS) and overall survival (OS) likely due to its association with a favorable immune signature.
Materials and methods
Patients and blood samples
This study was carried out on 41 patients with histologically proven metastatic or unresectable RCC before receiving oral treatment with the multikinase inhibitor sorafenib as described in Busse et al. [15]. All patients had measurable disease and were included in European expanded access program. Treatment response was evaluated at baseline and every eight weeks thereafter or, as clinically indicated, by CT scans or MRI of the chest, abdomen, and brain following RECIST criteria [20]. Disease impact on patients daily living abilities was measured according to the ECOG Scale of Performance Status: 0—fully active, able to carry on all pre-disease performance without restriction; 1—restricted in physically strenuous activity but ambulatory and able to carry out work of a light or sedentary nature, e.g., light house work, office work; 2—ambulatory and capable of all self-care but unable to carry out any work activities, up and about more than 50 % of waking hours [21]. To categorize the RCC patients into risk groups for predicting survival, the MSKCC for pretreated patients was used [22].
Approval by our institutional review board for investigation of prognostic and immunologic factors has been obtained, and all patients provided written informed consent before enrollment.
mRNA extraction, reverse transcription, and quantitative real-time PCR
After separation of human blood mononuclear cells by Ficoll-Isopaque density gradient centrifugation (Pharmacia, Erlangen, Germany), total RNA was extracted from mononuclear cells using the RNeasy Mini Kit including RNase-Free DNase Set (Qiagen, Hilden, Germany) according to the manufacturers’ recommendations. RNA was converted to cDNA using the Omniscript Reverse Transcriptase Kit (Qiagen, Hilden, Germany). Quantitative real-time reverse transcriptase (RT)-PCR was performed by LightCycler Technology (Roche), and data were analyzed with the LightCycler software (version 3, Roche). All samples were run in duplicate, and the average value of both duplicates was used for quantification of gene expression.
Primer and probe sequences of Tbx21, Eomes, transforming growth factor beta 1 (TGFβ1), interleukin 10 (IL10), inducible T cell co-stimulator (ICOS), and the housekeeping gene of hydroxymethylbilane synthase (HMBS), also known as porphobilinogen deaminase (PBGD), are listed in Table 1.
Table 1.
Primer and probe sequences
| PCR product | Primer and probe sequences |
|---|---|
| HBMS a | Fw 5′-TGCAGGCTACCATCCATGTCCCTGC-3′ |
| 187 bp | Rev 5′-AGCTGCCGTGCAACATCCAGGATGT-3′ |
| Probes | 5′-CGTGGAATGTTACGAGCAGTGATGCCTACC-Fluorescein-3′ |
| 5′-LCRed640-TGTGGGTCATCCTCAGGGCCATCTTC-phosphate-3′ | |
| ICOS a | Fw 5′-ACAGGAGGATATTTGCATATTTATGA-3′ |
| 120 bp | Rev 5′-CCAACAAATAAGTATGCATCCC-3′ |
| Probe | 5′-FAM-TGCAGCCTTTGTTGTAGTCTGC-Tamra-3′ |
| Eomes b | Fw 5′-ACTGGTTCCCACTGGATGAG-3′ |
| 160 bp | Rev 5′-CCACGCCATCCTCTGTAACT-3′ |
| Probe | 5′-FAM-AGGCGCAAATAACAACAACACCCAG-Tamra-3′ |
| Tbx21 b | Fw 5′-GGGAAACTAAAGCTCACAAAC-3′ |
| 337 bp | Rev 5′-CCCCAAGGAATTGACAGTTG-3′ |
| Probe | 5′-FAM-TGTGACCCAGATGATTGTGCTCCA-Tamra-3′ |
| TGFβ1 a | Fw 5′-CCCACAACGAAATCTATGAC-3′ |
| 314 bp | Rev 5′-GCTAAGGCGAAAGCCC-3′ |
| Probes | 5′-GGCACCCAGCGACTCG-Fluorescein-3′ |
| 5′-LCRed640-AGAGTGGTTATCTTTTGATGTCACCG-phosphate-3′ | |
| IL10 a | Fw 5′-CCTTCCAGTGTCTCGG-3′ |
| 357 bp | Rev 5′-TGGAGTACAGGGGCAT-3′ |
| Probes | 5′-AGGCGGGTGGATCACT-Fluorescein-3′ |
| 5′-LCRed640-AGGTCAGGAGTTCCTAACCAG-phosphate-3′ |
aPrimer and Probes were created using LightCycler Probe Design 2.0 Software (Roche)
bPrimers according to [50], probes were created by using the online tool: eu.idtdna.com/PrimerQuest/Home/Index
For the generation of standard curves, PCR products generated from cDNAs of all markers analyzed were cloned into the vector pCR2.1-TOPO (Invitrogen, Karlsruhe, Germany). A standard curve with three plasmid dilutions of duplicates was included in each respective PCR run. The quantification of serial plasmid dilutions yielded linear crossing point increases over a range of 6 logs (up to 10−5 pg/µl) for all markers analyzed.
Flow cytometric analysis
Cells were stained for surface antigens with fluorescence-conjugated monoclonal antibodies (mAbs) against CD3, CD4, CD45RA, CCR7, CD56, CD11b, CD14, HLA-DR (Biolegend, Fell, Germany), and CD8 (Becton–Dickinson, Heidelberg, Germany). Expression of transcription factors was measured by intracellular staining with mAbs against T-bet and Eomes (Biolegend, Fell, Germany, and eBioscience, Frankfurt a.M., Germany, respectively) following cell permeabilization by 0.1 % saponin. Samples were acquired on a FACSCantoII flow cytometer (Becton–Dickinson, Heidelberg, Germany), and data were analyzed by FlowJo software version 7.6.5 (TreeStar, Ashland, USA).
Statistical considerations
Nonparametric tests were used to evaluate the mRNA expression levels of Eomes and Tbx21, as well as protein expression of Eomes. The Mann–Whitney U test was used for comparing two groups, and the Kruskal–Wallis test was used for comparing more than two groups. The Wilcoxon rank-sum test was used to compare samples before treatment and after 8 weeks of treatment. Correlations were evaluated using the Spearman correlation test.
All tests were two-sided, and statistical significance was assumed if the null hypothesis could be rejected at the p < 0.05 level. Progression-free survival (PFS) was defined as from treatment start to the date of progression, death, or cutoff date for analysis. Overall survival (OS) was defined as from treatment start to death or cutoff date for analysis. Univariate Cox regression analysis was performed to examine the potential relationships between pre-treatment factors and survival. Multivariate analysis using a stepwise forward Cox regression technique was performed to investigate potential interactions between the entered covariates. Survival curves were estimated using the Kaplan–Meier method, and they were compared with the log-rank test. All statistical analyses were carried out using SPSS software (release 20.0).
Results
Patients
Patients’ characteristics are listed in Table 2. Forty-one patients with mRCC received sorafenib for a median of 9 months (0.4–19.8 months). The overall response rate was 80.5 % with 9 partial responses and 24 stable diseases. The median follow-up for progression-free patients was 13.3 months (2.3–27.8 months).
Table 2.
Patients’ characteristics
| N | |
|---|---|
| Patient samples available | 41 |
| Male/female | 26/15 |
| Median age | 65 (37–78) |
| Prior nephrectomy yes/no | 39/2 |
| Cytokine pretreatment yes/no | 35/6 |
| ECOG 0/1/2 | 14/19/8 |
| MSKCC favorable/intermediate/poor | 6/20/15 |
| Hb normal/decreased | 9/32 |
| Corrected serum Ca normal/elevated | 29/12 |
| AP normal/elevated | 34/7 |
| Median PFS (95 % CI) | 9.3 (5.2–13.3) months |
| Median OS (95 % CI) | 17 (13.3–20.7) months |
| Median follow-up for progression-free patients | 13.3 (2.3–27.8) months |
mRNA expression of Tbx21 and Eomes in peripheral blood
Transcripts of the housekeeping gene HMBS could be detected in all samples with a median transcript level of 7.87 × 10⁻² pg/µl (range 2.03 × 10⁻²–1.86 × 10⁻¹ pg/µl). Therefore, all samples were regarded as informative.
Tbx21 and Eomes mRNA expression was detectable in pB of all 41 mRCC patients with a level up to 1.98 × 10⁻⁴ and 1.71 × 10⁻³, respectively. Values were within the detection limit (up to 10−5 pg/µl) for both markers.
The median ratio of Tbx21/HMBS was 4.56 × 10⁻¹ (range 1.71 × 10⁻³–1.85) and of Eomes/HMBS was 2.2 × 10⁻¹ (range 8.67 × 10⁻³–1.12), respectively (Fig. 1).
Fig. 1.
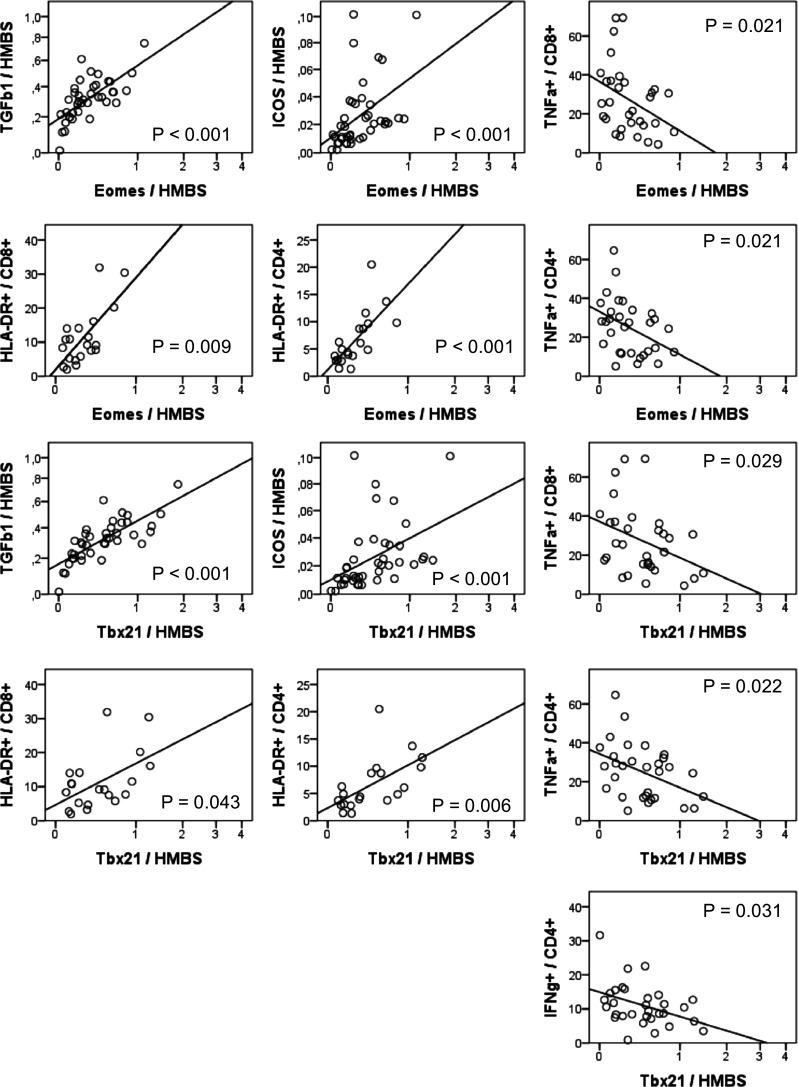
Correlation of mRNA expression of Eomes and Tbx21 with mRNA expression of TGFβ1 and ICOS and with HLA-DR+ T cells and cytokine-producing T cells. mRNA expression levels of Tbx21, Eomes, TGFβ1, and ICOS in PBMCs were determined by quantitative RT-PCR. The relative amount was expressed as ratio marker (pg/µl)/HMBS (pg/µl). The sample concentration was calculated using a plasmid standard curve. mRNA levels of all markers were within the respective detection range in all patient samples. HLA-DR surface expression on CD8+ and CD4+ T cells was determined by flow cytometry. IFNγ- and TNFα- producing T cells were measured by intracellular flow cytometry after in vitro stimulation of PBMCs by PMA/ionomycin
Prior cytokine therapy as well as response to cytokine therapy had no influence on mRNA expression levels of Tbx21 (p = 0.928 and p = 0.757, respectively) and Eomes (p = 0.733 and p = 0.935, respectively). There were no significant differences in mRNA expression levels of Tbx21 (p = 0.695) and Eomes (p = 0.867) after 8-week treatment with sorafenib (n = 28, data not shown).
Correlation of Tbx21 and Eomes mRNA levels with the immunophenotype in pB
We investigated whether Tbx21 and Eomes mRNA expression levels were associated with a specific immunophenotype in pB. We analyzed mRNA expression levels of ICOS by RT-PCR and frequencies of HLA-DR+ CD4+ and CD8+ T cells by flow cytometry to identify in vivo activated T cells. Moreover, we determined frequencies of effector/memory T cell subpopulations by flow cytometry by expression of CCR7 and CD45RA. Eomes and Tbx21 mRNA expression showed a positive correlation with mRNA expression of the activation marker ICOS (p < 0.001, n = 41), as well as with frequencies of HLA-DR+ CD4+ (p < 0.001 and p = 0.006, respectively, n = 20) and CD8+ T cells (p = 0.009 and p = 0.043, respectively, n = 20), representing in vivo activated T cells (Fig. 1). mRNA expression levels of Eomes or Tbx21 or the ratio of Tbx21/Eomes mRNA levels was not associated with frequencies of effector or memory CD4+ or CD8+ T cells.
In a previous study, we determined mRNA expression levels of immunosuppressive cytokines IL10 and TGFβ1 and frequencies of TNFα- and IFNɣ-producing CD4+ and CD8+ T cells after PMA/ionomycin treatment in vitro from the patients enrolled in this research study [23]. We included these data in our current analysis. We found that Eomes and Tbx21 mRNA expression showed a positive correlation with mRNA expression of TGFβ1 (p < 0.001, n = 41, Fig. 1). In contrast, Eomes and Tbx21 mRNA expression levels were negatively correlated with TNFα-producing CD8+ (p = 0.021 and p = 0.029) and CD4+ T cells (p = 0.021 and p = 0.022, n = 31) after in vitro activation by PMA/ionomycin. Moreover, Tbx21 mRNA expression was negatively correlated with INFɣ-producing CD4+ cells (p = 0.031, Fig. 1).
To conclude, Eomes and Tbx21 mRNA expression in pB correlated positively not only with markers of activated T cells producing less TNFα but also with mRNA expression of the immunosuppressive cytokine TGFβ1.
Eomes mRNA and ECOG were independently associated with PFS and OS
Data of 41 patients were available to analyze the influence of clinical features and mRNA expression levels of Eomes and Tbx21 on survival. In 23 patients, immune cell subpopulations were measured by flow cytometry, and their influence on survival was analyzed. Clinical features considered for univariate analysis were selected on the basis of previously identified factors that impact on survival of mRCC patients [22, 24] and included Eastern Cooperative Oncology Group (ECOG) performance status score, hemoglobin (Hb), alkaline phosphatase (AP), and corrected serum calcium (Ca) concentrations. Decreased Hb, elevated Ca, AP serum concentrations, and a high ECOG performance status score had a negative prognostic influence on PFS and OS. However, this was only significant for ECOG performance status (p < 0.001; Table 3; Fig. 2). Prior cytokine therapy as well as response to cytokine therapy had no influence on PFS and OS.
Table 3.
Univariate and multivariate Cox regression analysis
| Univariate, p value | Multivariate, p value | |||
|---|---|---|---|---|
| PFS | PFS | OS | PFS | |
| Hb (decreased vs. not decreased) | 0.308 | 0.241 | n.i. | n.i. |
| AP (elevated vs. not elevated) | 0.379 | 0.247 | n.i. | n.i. |
| Ca (elevated vs. not elevated) | 0.935 | 0.764 | n.i. | n.i. |
| ECOG (0 vs. 1 vs. 2) | 0.004 | <0.001 | 0.011 | <0.001 |
| Tbx21 mRNA level | 0.012 | 0.057 | 0.628 | 0.16 |
| Eomes mRNA level | 0.008 | 0.007 | 0.016 | 0.009 |
Statistically significant p-values are printed in bold
n.i. not included
Fig. 2.
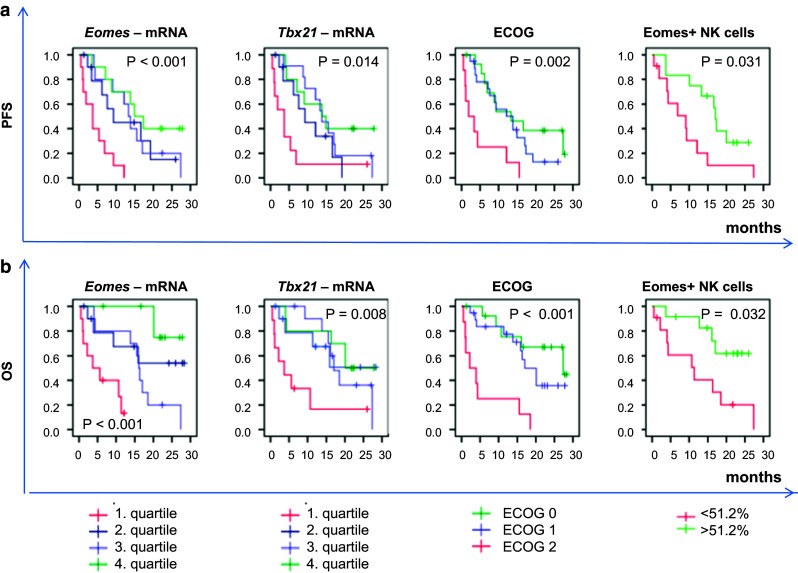
Kaplan–Meier curves for Tbx21 mRNA, Eomes mRNA, ECOG, and Eomes+/CD56+CD3− NK cells. mRNA was derived from PBMCs. mRNA expression levels were divided into quartiles with low (1. quartile), intermediate low (2. quartile), intermediate high (3. quartile), and high (4. quartile) mRNA expression. Eomes+/CD56+CD3− NK cells were determined by intracellular flow cytometry and divided into two groups based on the median frequency of Eomes+ cells (51.2 %) in the CD56+CD3− population. Survival curves were compared with the log-rank test. a PFS progression-free survival, b OS overall survival
Univariate Cox regression analysis (Table 3) revealed a positive prognostic influence of Tbx21 and Eomes mRNA expression on PFS (p = 0.012 and p = 0.008, respectively) and OS (p = 0.057 and p = 0.007, respectively). This is reflected in the survival curves (Fig. 2, Kaplan–Meier, n = 41).
In a multivariate Cox proportional hazards model, containing those clinical features with p value ≤0.2 upon univariate analysis and mRNA levels of Eomes and Tbx21 (Table 3), a low ECOG and higher Eomes mRNA expression were independently associated with favorable PFS (p = 0.011 and p = 0.016, respectively) and favorable OS (p < 0.001 and p = 0.009, respectively). This was also observed when patients without prior cytokine therapy were excluded (PFS p = 0.015 and p = 0.002, respectively, and OS p = 0.001 and p = 0.011, respectively).
Eomes was particularly expressed by NK cells in peripheral blood
We asked whether there was a specific Eomes-expressing immune cell population with favorable impact on survival. Protein expression of Eomes was analyzed by flow cytometry in pB samples of 25 patients. As Eomes+ cells/total lymphocyte population had no influence on OS and PFS, we looked in more detail at lymphocyte subpopulations, especially at CD8+CD3+ T cells and CD56+CD3− NK cells (Fig. 3a, b), because their differentiation and effector function are regulated by Eomes [2, 8, 9].
Fig. 3.
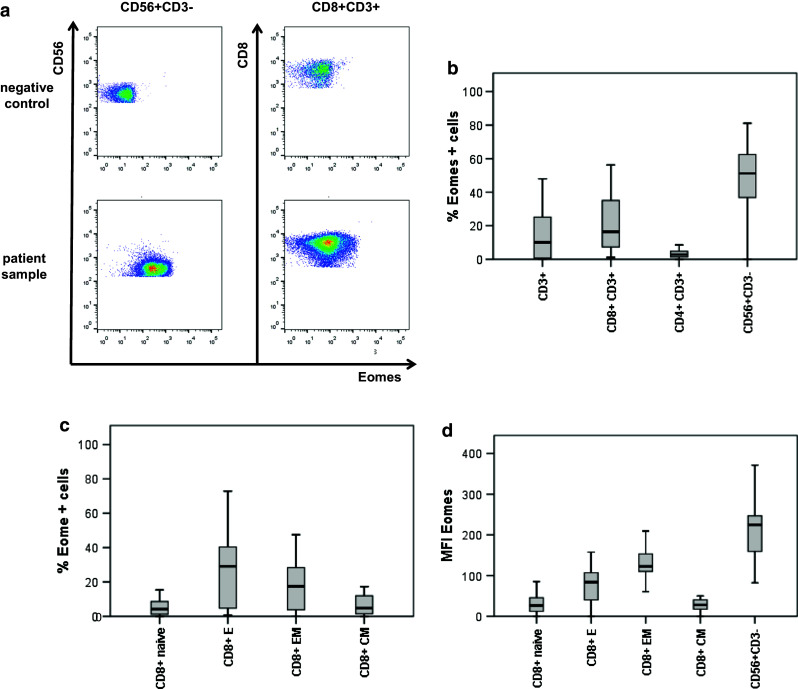
Expression of Eomes in peripheral lymphocyte subpopulations of mRCC patients. Eomes expression was determined by intracellular flow cytometry staining in lymphocyte subpopulations as indicated. The box/whisker graphs display 25–75 % (box) and 10–90 % (whisker). The line in the box represents the median value. a Exemplary flow cytometry plots from one patient showing Eomes expression in CD56+CD3− NK cells and CD8+CD3+ T cells. b Frequency of Eomes-expressing cells in CD3+ T cells, CD8+CD3+ T cells, CD4+CD3+ T cells, and CD56+CD3− NK cells. c Frequency of Eomes-expressing CD8+ T cells within CD45RA+CCR7+ Tnaive cells, CD45RA+CCR7− TE, CD45RA−CCR7− TEM, and CD45RA−CCR7+ TCM. d Eomes median fluorescence intensity (MFI) values in CD8+ memory/effector subpopulations and in CD56+CD3− NK cells
Eomes was expressed particularly in the CD56+CD3− NK cells with a median frequency of 51.2 % (range 0.12–81.1 %). In the CD8+CD3+ T cell population, the median frequency of Eomes+ cells was 16.4 % (1.15–56.3 %) and was significantly lower compared to NK cells (p < 0.001, Fig. 3b). In contrast, compared to CD8+CD3+ T cells, the median frequency of Eomes+ cells in the CD4+CD3+ lymphocyte population (Fig. 3b) was only 2.7 % (0–39.7 %, p < 0.001). This is in line with previous reports [2].
As Eomes is known to regulate the balance between effector and memory T cells [3], we explored its expression in effector/memory populations of CD8+ T cells. Frequencies of Eomes+ cells differed in memory and effector T cells (p = 0.043). They were higher in CD45RA+CCR7− effector T cells (TE) with a median frequency of 29 % (range 6–72.8 %) and CD45RA−CCR7− effector memory T cells (TEM) with a median frequency of 17.5 % (range 3–47.5 %) compared to CD45RA−CCR7+ central memory T cells (TCM) with a median frequency of 4.7 % (range 0–30.4 %) and CD45RA+CCR7+ naïve T (Tnaive) cells with a median frequency of 4.1 % (range 0–30.6 %, Fig. 3c). To determine Eomes protein expression levels, we analyzed median fluorescence intensities (MFI) of Eomes (Fig. 3d). TE and TEM had higher MFI of Eomes [MFI 84 (range 0–158) and 122 (range 0–210)], respectively, compared to TCM and Tnaive cells [MFI 28 (range 0–76) and 27 (range 0–86), respectively, p < 0.001]. However, Eomes MFI was highest in CD56+CD3− NK cells (MFI 225 [range 0–387]) compared to CD8+ T cell effector/memory subpopulations (p < 0.001).
Univariate Cox regression analyses revealed that neither frequencies of CD56+CD3− NK cells nor frequencies of effector/memory CD8+ T cells had an influence on PFS or OS (n = 23, data not shown). However, a high frequency of Eomes-expressing cells in the CD56+CD3− cell population was significantly associated with increased PFS (p = 0.035) and OS (p = 0.028). This is also reflected in the Kaplan–Meier curves (Fig. 2). Due to the low number of patient samples (n = 23), frequencies of Eomes+CD56+CD3− cells were not included in the multivariate Cox model.
Discussion
Here, we demonstrated that mRNA expression levels of T-box transcription factors Eomes and Tbx21 in pB impact on survival in sorafenib-treated mRCC patients, with Eomes mRNA expression being an independent prognostic factor for OS and PFS.
Treatment options for patients with RCC have significantly improved in recent years. Nonetheless, mRCC treated with the new targeted therapies will progress in the majority of patient’s overtime with variable course. Therefore, there is a need to determine patient’s risk of cancer progression in order to stratify for treatment. Heterogeneity of clinical and laboratory features is acknowledged to be a dominant factor that impact on survival of RCC patients [22, 25]. In addition to tumor tissue biomarkers, various soluble molecules and cellular populations in pB have been identified as potential biomarkers [13, 26, 27]. Here, we could show that higher Eomes mRNA expression levels were an independent good prognostic factor for PFS and OS, in addition to a favorable ECOG. Several reports about their expression in tumor tissue underline that they are important regulators for antitumor immune response [8, 16–19]. Eomes mRNA expression positively correlated with mRNA expression of Tbx21. However, Tbx21 mRNA was not an independent prognostic factor in the multivariate analysis. The T-box transcription factors Eomes and T-bet, encoded by Tbx21, are master regulators of effector cells in adaptive and innate immunity. They were found not only to be important to regulate the balance between memory and effector T cells but also to maintain effector function in long-term memory CD8+ T cells [2, 4]. However, we found neither influence of cytokine-producing Tc1 cells or Th1 nor influence of memory T cells that have been reported to be crucial for long-term antitumor immune response.
Therefore, we asked whether the favorable prognostic role of Eomes mRNA expression on survival might be related to a specific Eomes-expressing cell population. Thus, we analyzed Eomes expression on protein level in the whole lymphocyte population and in lymphocyte subpopulations known to express Eomes. However, neither frequencies of Eomes-expressing lymphocytes nor Eomes-expressing memory/effector T cell subpopulations influenced survival. Interestingly, frequency of Eomes+ cells/CD56+CD3− NK cell population, most likely representing mature NK cells [2, 5, 28], had a positive prognostic influence on PFS and OS in univariate analysis. Gordon et al. could show that mature Eomes+DX5+ NK cells expressed modestly more perforin1 mRNA than immature Eomes−TRAIL+ NK cells, consistent with a role for Eomes in inducing perforin1 [3, 5, 9]. Moreover, CD56dimCD3− cells, which are normally found in pB, were described to exhibit rather cytolytic and less immunoregulatory functions by cytokine production [2, 29]. However, due to the low sample number, multivariate analysis was not conducted. Therefore, these results must be regarded as descriptive and might only give a hint that also innate immunity, especially mature Eomes+ cytotoxic NK cells, plays a critical role in tumor immune response in RCC [30].
It seemed to be more likely that the favorable prognostic influence of higher Eomes mRNA levels was not related to a specific Eomes-expressing cell population but rather to the fact that higher Eomes mRNA expression might be part of a favorable immune signature.
Higher Eomes mRNA expression correlated not only positively with Tbx21 mRNA but also positively with TGFβ1 mRNA expression. This seemed to be contradictory, because TGFβ1 is known to have various immunosuppressive properties. However, we previously demonstrated that high TGFβ1 mRNA expression in pB was associated with improved survival in mRCC patients treated with sorafenib [15]. Therefore, TGFβ1 mRNA might be part of this favorable immune signature.
How can this be explained? Both Eomes and T-bet are highly expressed in type 1 immune cells, and not only important for their development, but for their cytolytic function. Therefore, high Eomes and Tbx21 mRNA expression might reflect an effective antitumor immune response. Activated CD8+ T cells express TGFβ1 mRNA and produce TGFβ [31]. TGFβ is not only produced by T cells. In our patient cohort, monocytes seemed to be the major source of TGFβ production [15]. TGFβ1 mRNA might be induced in immune cells as a feedback mechanism to avoid inflammatory overreaction that might cause immunosuppression, angiogenesis, and tumor progression [32].
Previous studies have demonstrated that endogenous and exogenous TGFβ regulate T cell differentiation and homeostasis. By differentially regulating Eomes and T-bet expression, TGFβ1 blocked central memory T cell development in favor of effector memory T cells [31]. Moreover, depending on the cytokine environment, TGFβ induced Treg, Th9 and Th17 and inhibited IL12-induced Th1 development. Nevertheless, in the presence of IL4, TGFβ1 enhanced IFNγ-induced CD103+ Th1 through induction of both Eomes and T-bet [33, 34]. Therefore, it might enhance antitumor immune response. CD103+ Th1 preferentially expressed Eomes, and both IFNγ-induced T-bet and TGFβ were required for Eomes expression [33]. This might explain the positive correlation of TGFβ1 mRNA expression with mRNA expression of Eomes and Tbx21.
Moreover, Eomes and Tbx21 mRNA levels were associated with higher mRNA expression of the activation marker ICOS and with higher frequencies of HLA-DR+-activated T cells, but also with T cells producing less TNFα. Whether those cells have higher cytolytic activity due to perforin or FasL expression and less immunoregulatory or inflammatory function needs to be determined [3, 5, 9, 35]. It is interesting in this context that not only immunosuppressive cells like Treg [12] but also clinical and laboratory factors associated with inflammation like neutrophils, C-reactive protein, and TNFα serum levels [7, 10, 11, 36–40] are known to have a negative impact on survival.
Surprisingly, Tbx21 mRNA expression is associated with less IFNɣ-producing CD4+ T cells, although T-bet is known as a master regulator of IFNɣ expression in Th1 [41]. However, Tbx21 mRNA expression in PBMCs does not necessarily correlate with Tbx21 mRNA expression or with T-bet protein expression in CD4+ T cells. T-bet protein expression in CD4+ T cells did not show any negative correlation with IFNγ production or significant positive correlation (data not shown). Nevertheless, although T-bet is crucial for IFNɣ production in T cells, the overall cytokine environment might modify not only T cell development but also their function. Ylikoski et al. [42] demonstrated that human CD4+ T cells, stimulated by IFNɣ or IL12, expressed the same amounts of T-bet, but they differed in IFNγ production. Moreover, the effect of TGFβ1 on IFNɣ production and T-bet expression in human CD4+ T cells has been reported to be dependent on the cytokine environment [42]. In mouse CD4+ T cells, IFNɣ suppression is mediated by T-bet at recall stimulation but not at priming [43]. Therefore, Tbx21 mRNA level and T-bet protein expression do not necessarily correlate with IFNɣ production.
Whether a higher Eomes mRNA level as an indicator of a favorable immune signature is a useful marker alone or in combination with other already established clinicopathological factors or with other circulating angiogenic biomarkers [27, 44], needs to be investigated in larger patient cohorts in a prospective study.
These angiogenic biomarkers may include VEGF and VEGF-related proteins or cytokines. Baseline VEGF has been identified as an independent negative prognostic marker for survival in patients treated with targeted therapies or IFNα [45–47]. However, regarding sorafenib therapy, higher baseline VEGF levels may be associated with better clinical outcome with sorafenib therapy [48]. Among cytokines, IL6 seems to be the most promising marker despite so far mainly analyzed in sunitinib-treated and pazopanib-treated patients [13]. High concentrations of IL6 were predictive of improved relative PFS benefit from pazopanib [14]. Besides specific angiogenic factors (CAF), multi-CAF signatures might also be considered. A phase II study comparing first-line sorafenib with sorafenib plus IFNα in advanced RCC identified a six-marker baseline CAF proangiogenic signature [osteopontin, vascular endothelial growth factor (VEGF), carbonic anhydrase 9, collagen IV, VEGF receptor-2, and tumor necrosis factor-related apoptosis-inducing ligand] that correlated with PFS benefit [49].
Conclusions
We identified higher Eomes mRNA expression as an independent good prognostic factor for OS and PFS in our patient cohort treated with sorafenib. This might be due to its association with a favorable immune signature. Further investigations in a larger patient cohort are warranted to evaluate whether Eomes mRNA expression in pB is a clinically usable prognostic marker that provides prognostic information beyond that of standard clinicopathological factors. Moreover, it would be interesting to determine the prognostic role of Eomes expression in patients treated with mTOR inhibitors and TKIs like sunitinib that might differentially modulate tumor-induced inflammation and Eomes expression.
Acknowledgments
We thank AnneMarie Asemissen for her support with collecting patient samples.
Abbreviations
- AP
Alkaline phosphatase
- Ca
Corrected serum calcium concentrations
- CAF
Cytokine and angiogenic factor
- CCR
C–C chemokine receptor
- CD
Cluster of differentiation
- CT
X-ray computed tomography
- CTL
Cytotoxic T cells
- ECOG
Eastern Cooperative Oncology Group
- Eomes
Eomesodermin
- Hb
Hemoglobin
- HLA-DR
Human leukocyte antigen class II
- HMBS
Hydroxymethylbilane synthase
- ICOS
Inducible T cell co-stimulator
- IFN
Interferon
- IL
Interleukin
- mAb
Monoclonal antibody
- MDSC
Myeloid-derived suppressor cells
- MFI
Mean fluorescence intensity
- mRCC
Metastatic renal cell cancer
- MRI
Magnetic resonance imaging
- mRNA
Messenger ribonucleic acid
- MSKCC
Memorial Sloan-Kettering Cancer Center score
- mTOR
Mechanistic target of rapamycin, previously known as mammalian target of rapamycin
- NK cells
Natural killer cells
- NKT cells
Natural killer T cells
- OS
Overall survival
- pB
Peripheral blood
- PBGD
Porphobilinogen deaminase
- PBMCs
Peripheral blood mononuclear cells
- PFS
Progression-free survival
- PMA
Phorbol 12-myristate 13-acetate
- RECIST
Response Evaluation Criteria in Solid Tumors
- RT-PCR
Reverse transcriptase polymerase chain reaction
- T-bet
T-box expressed in T cells
- TCM
Central memory T cells
- TE
Effector T cells
- TEM
Effector memory T cells
- TGF
Transforming growth factor
- Th1
Type 1 T helper cells
- TKI
Tyrosine kinase inhibitor
- TNF
Tumor necrosis factor
- Treg
Regulatory T cells
- VEGF
Vascular endothelial growth factor
Compliance with ethical standards
Conflict of interest
All authors declare that they have no conflict of interest including any financial, personal, or other relationships with other people or organizations within that could inappropriately influence their work.
References
- 1.Busse A, Keilholz U. Immune self-tuning in renal cell carcinoma. Eur Oncol. 2010;6(1):70–75. [Google Scholar]
- 2.Knox JJ, Cosma GL, Betts MR, McLane LM. Characterization of T-bet and eomes in peripheral human immune cells. Front Immunol. 2014;5:217. doi: 10.3389/fimmu.2014.00217. [DOI] [PMC free article] [PubMed] [Google Scholar]
- 3.Intlekofer AM, Takemoto N, Wherry EJ, Longworth SA, Northrup JT, Palanivel VR, Mullen AC, Gasink CR, Kaech SM, Miller JD, Gapin L, Ryan K, Russ AP, Lindsten T, Orange JS, Goldrath AW, Ahmed R, Reiner SL. Effector and memory CD8+ T cell fate coupled by T-bet and eomesodermin. Nat Immunol. 2005;6(12):1236–1244. doi: 10.1038/ni1268. [DOI] [PubMed] [Google Scholar]
- 4.Rao RR, Li Q, Odunsi K, Shrikant PA. The mTOR kinase determines effector versus memory CD8+ T cell fate by regulating the expression of transcription factors T-bet and Eomesodermin. Immunity. 2010;32(1):67–78. doi: 10.1016/j.immuni.2009.10.010. [DOI] [PMC free article] [PubMed] [Google Scholar]
- 5.Gordon SM, Chaix J, Rupp LJ, Wu J, Madera S, Sun JC, Lindsten T, Reiner SL. The transcription factors T-bet and Eomes control key checkpoints of natural killer cell maturation. Immunity. 2012;36(1):55–67. doi: 10.1016/j.immuni.2011.11.016. [DOI] [PMC free article] [PubMed] [Google Scholar]
- 6.Townsend MJ, Weinmann AS, Matsuda JL, Salomon R, Farnham PJ, Biron CA, Gapin L, Glimcher LH. T-bet regulates the terminal maturation and homeostasis of NK and Valpha14i NKT cells. Immunity. 2004;20(4):477–494. doi: 10.1016/S1074-7613(04)00076-7. [DOI] [PubMed] [Google Scholar]
- 7.Beuselinck B, Vano YA, Oudard S, Wolter P, De Smet R, Depoorter L, Teghom C, Karadimou A, Zucman-Rossi J, Debruyne PR, Van Poppel H, Joniau S, Lerut E, Strijbos M, Dumez H, Paridaens R, Van Calster B, Schoffski P. Prognostic impact of baseline serum C-reactive protein in patients with metastatic renal cell carcinoma (RCC) treated with sunitinib. BJU Int. 2014;114(1):81–89. doi: 10.1111/bju.12494. [DOI] [PubMed] [Google Scholar]
- 8.Zhu Y, Ju S, Chen E, Dai S, Li C, Morel P, Liu L, Zhang X, Lu B. T-bet and eomesodermin are required for T cell-mediated antitumor immune responses. J Immunol. 2010;185(6):3174–3183. doi: 10.4049/jimmunol.1000749. [DOI] [PubMed] [Google Scholar]
- 9.Pearce EL, Mullen AC, Martins GA, Krawczyk CM, Hutchins AS, Zediak VP, Banica M, DiCioccio CB, Gross DA, Mao CA, Shen H, Cereb N, Yang SY, Lindsten T, Rossant J, Hunter CA, Reiner SL. Control of effector CD8+ T cell function by the transcription factor Eomesodermin. Science. 2003;302(5647):1041–1043. doi: 10.1126/science.1090148. [DOI] [PubMed] [Google Scholar]
- 10.Heng DY, Xie W, Regan MM, Warren MA, Golshayan AR, Sahi C, Eigl BJ, Ruether JD, Cheng T, North S, Venner P, Knox JJ, Chi KN, Kollmannsberger C, McDermott DF, Oh WK, Atkins MB, Bukowski RM, Rini BI, Choueiri TK. Prognostic factors for overall survival in patients with metastatic renal cell carcinoma treated with vascular endothelial growth factor-targeted agents: results from a large, multicenter study. J Clin Oncol. 2009;27(34):5794–5799. doi: 10.1200/JCO.2008.21.4809. [DOI] [PubMed] [Google Scholar]
- 11.Yasuda Y, Saito K, Yuasa T, Kitsukawa S, Urakami S, Yamamoto S, Yonese J, Takahashi S, Fukui I. Prognostic impact of pretreatment C-reactive protein for patients with metastatic renal cell carcinoma treated with tyrosine kinase inhibitors. Int J Clin Oncol. 2013;18(5):884–889. doi: 10.1007/s10147-012-0454-0. [DOI] [PubMed] [Google Scholar]
- 12.Polimeno M, Napolitano M, Costantini S, Portella L, Esposito A, Capone F, Guerriero E, Trotta A, Zanotta S, Pucci L, Longo N, Perdona S, Pignata S, Castello G, Scala S. Regulatory T cells, interleukin (IL)-6, IL-8, vascular endothelial growth factor (VEGF), CXCL10, CXCL11, epidermal growth factor (EGF) and hepatocyte growth factor (HGF) as surrogate markers of host immunity in patients with renal cell carcinoma. BJU Int. 2013;112(5):686–696. doi: 10.1111/bju.12068. [DOI] [PubMed] [Google Scholar]
- 13.Funakoshi T, Lee CH, Hsieh JJ. A systematic review of predictive and prognostic biomarkers for VEGF-targeted therapy in renal cell carcinoma. Cancer Treat Rev. 2014;40(4):533–547. doi: 10.1016/j.ctrv.2013.11.008. [DOI] [PubMed] [Google Scholar]
- 14.Tran HT, Liu Y, Zurita AJ, Lin Y, Baker-Neblett KL, Martin AM, Figlin RA, Hutson TE, Sternberg CN, Amado RG, Pandite LN, Heymach JV. Prognostic or predictive plasma cytokines and angiogenic factors for patients treated with pazopanib for metastatic renal-cell cancer: a retrospective analysis of phase 2 and phase 3 trials. Lancet Oncol. 2012;13(8):827–837. doi: 10.1016/S1470-2045(12)70241-3. [DOI] [PubMed] [Google Scholar]
- 15.Busse A, Asemissen A, Nonnenmacher A, Ochsenreither S, Fusi A, Braun F, Stather D, Schmittel A, Miller K, Thiel E, Keilholz U. Systemic immune tuning in renal cell carcinoma: favorable prognostic impact of TGF-beta1 mRNA expression in peripheral blood mononuclear cells. J Immunother. 2011;34(1):113–119. doi: 10.1097/CJI.0b013e3181fb6580. [DOI] [PubMed] [Google Scholar]
- 16.Galon J, Costes A, Sanchez-Cabo F, Kirilovsky A, Mlecnik B, Lagorce-Pages C, Tosolini M, Camus M, Berger A, Wind P, Zinzindohoue F, Bruneval P, Cugnenc PH, Trajanoski Z, Fridman WH, Pages F. Type, density, and location of immune cells within human colorectal tumors predict clinical outcome. Science. 2006;313(5795):1960–1964. doi: 10.1126/science.1129139. [DOI] [PubMed] [Google Scholar]
- 17.Pages F, Berger A, Camus M, Sanchez-Cabo F, Costes A, Molidor R, Mlecnik B, Kirilovsky A, Nilsson M, Damotte D, Meatchi T, Bruneval P, Cugnenc PH, Trajanoski Z, Fridman WH, Galon J. Effector memory T cells, early metastasis, and survival in colorectal cancer. N Engl J Med. 2005;353(25):2654–2666. doi: 10.1056/NEJMoa051424. [DOI] [PubMed] [Google Scholar]
- 18.Atreya I, Schimanski CC, Becker C, Wirtz S, Dornhoff H, Schnurer E, Berger MR, Galle PR, Herr W, Neurath MF. The T-box transcription factor eomesodermin controls CD8 T cell activity and lymph node metastasis in human colorectal cancer. Gut. 2007;56(11):1572–1578. doi: 10.1136/gut.2006.117812. [DOI] [PMC free article] [PubMed] [Google Scholar]
- 19.Chen LJ, Zheng X, Shen YP, Zhu YB, Li Q, Chen J, Xia R, Zhou SM, Wu CP, Zhang XG, Lu BF, Jiang JT. Higher numbers of T-bet(+) intratumoral lymphoid cells correlate with better survival in gastric cancer. Cancer Immunol Immunother. 2013;62(3):553–561. doi: 10.1007/s00262-012-1358-6. [DOI] [PMC free article] [PubMed] [Google Scholar]
- 20.Therasse P. Measuring the clinical response. What does it mean? Eur J Cancer. 2002;38(14):1817–1823. doi: 10.1016/S0959-8049(02)00182-X. [DOI] [PubMed] [Google Scholar]
- 21.Oken MM, Creech RH, Tormey DC, Horton J, Davis TE, McFadden ET, Carbone PP. Toxicity and response criteria of the Eastern Cooperative Oncology Group. Am J Clin Oncol. 1982;5(6):649–655. doi: 10.1097/00000421-198212000-00014. [DOI] [PubMed] [Google Scholar]
- 22.Motzer RJ, Bacik J, Schwartz LH, Reuter V, Russo P, Marion S, Mazumdar M. Prognostic factors for survival in previously treated patients with metastatic renal cell carcinoma. J Clin Oncol. 2004;22(3):454–463. doi: 10.1200/JCO.2004.06.132. [DOI] [PubMed] [Google Scholar]
- 23.Busse A, Asemissen AM, Nonnenmacher A, Braun F, Ochsenreither S, Stather D, Fusi A, Schmittel A, Miller K, Thiel E, Keilholz U. Immunomodulatory effects of sorafenib on peripheral immune effector cells in metastatic renal cell carcinoma. Eur J Cancer. 2011;47(5):690–696. doi: 10.1016/j.ejca.2010.11.021. [DOI] [PubMed] [Google Scholar]
- 24.Roosen JU, Engel U, Jensen RH, Kvist E, Schou G. Renal cell carcinoma: prognostic factors. Br J Urol. 1994;74(2):160–164. doi: 10.1111/j.1464-410X.1994.tb16579.x. [DOI] [PubMed] [Google Scholar]
- 25.Finley DS, Pantuck AJ, Belldegrun AS. Tumor biology and prognostic factors in renal cell carcinoma. Oncologist. 2011;16(Suppl 2):4–13. doi: 10.1634/theoncologist.2011-S2-04. [DOI] [PMC free article] [PubMed] [Google Scholar]
- 26.Brannon AR, Haake SM, Hacker KE, Pruthi RS, Wallen EM, Nielsen ME, Rathmell WK. Meta-analysis of clear cell renal cell carcinoma gene expression defines a variant subgroup and identifies gender influences on tumor biology. Eur Urol. 2012;61(2):258–268. doi: 10.1016/j.eururo.2011.10.007. [DOI] [PMC free article] [PubMed] [Google Scholar]
- 27.Maroto P, Rini B. Molecular biomarkers in advanced renal cell carcinoma. Clin Cancer Res. 2014;20(8):2060–2071. doi: 10.1158/1078-0432.CCR-13-1351. [DOI] [PubMed] [Google Scholar]
- 28.Poli A, Michel T, Theresine M, Andres E, Hentges F, Zimmer J. CD56bright natural killer (NK) cells: an important NK cell subset. Immunology. 2009;126(4):458–465. doi: 10.1111/j.1365-2567.2008.03027.x. [DOI] [PMC free article] [PubMed] [Google Scholar]
- 29.Cheng M, Chen Y, Xiao W, Sun R, Tian Z. NK cell-based immunotherapy for malignant diseases. Cell Mol Immunol. 2013;10(3):230–252. doi: 10.1038/cmi.2013.10. [DOI] [PMC free article] [PubMed] [Google Scholar]
- 30.Schleypen JS, Baur N, Kammerer R, Nelson PJ, Rohrmann K, Grone EF, Hohenfellner M, Haferkamp A, Pohla H, Schendel DJ, Falk CS, Noessner E. Cytotoxic markers and frequency predict functional capacity of natural killer cells infiltrating renal cell carcinoma. Clin Cancer Res. 2006;12(3 Pt 1):718–725. doi: 10.1158/1078-0432.CCR-05-0857. [DOI] [PubMed] [Google Scholar]
- 31.Takai S, Schlom J, Tucker J, Tsang KY, Greiner JW. Inhibition of TGF-beta1 signaling promotes central memory T cell differentiation. J Immunol. 2013;191(5):2299–2307. doi: 10.4049/jimmunol.1300472. [DOI] [PMC free article] [PubMed] [Google Scholar]
- 32.Mantovani A, Garlanda C, Allavena P. Molecular pathways and targets in cancer-related inflammation. Ann Med. 2010;42(3):161–170. doi: 10.3109/07853890903405753. [DOI] [PubMed] [Google Scholar]
- 33.Tofukuji S, Kuwahara M, Suzuki J, Ohara O, Nakayama T, Yamashita M. Identification of a new pathway for Th1 cell development induced by cooperative stimulation with IL-4 and TGF-beta. J Immunol. 2012;188(10):4846–4857. doi: 10.4049/jimmunol.1103799. [DOI] [PubMed] [Google Scholar]
- 34.Lingnau K, Hoehn P, Kerdine S, Koelsch S, Neudoerfl C, Palm N, Ruede E, Schmitt E. IL-4 in combination with TGF-beta favors an alternative pathway of Th1 development independent of IL-12. J Immunol. 1998;161(9):4709–4718. [PubMed] [Google Scholar]
- 35.Eshima K, Chiba S, Suzuki H, Kokubo K, Kobayashi H, Iizuka M, Iwabuchi K, Shinohara N. Ectopic expression of a T-box transcription factor, eomesodermin, renders CD4(+) Th cells cytotoxic by activating both perforin- and FasL-pathways. Immunol Lett. 2012;144(1–2):7–15. doi: 10.1016/j.imlet.2012.02.013. [DOI] [PubMed] [Google Scholar]
- 36.Hu Q, Gou Y, Sun C, Ding W, Xu K, Gu B, Xia G, Ding Q. The prognostic value of C-reactive protein in renal cell carcinoma: a systematic review and meta-analysis. Urologic oncology. 2014;32(1):50e1–50e8. doi: 10.1016/j.urolonc.2013.07.016. [DOI] [PubMed] [Google Scholar]
- 37.Negrier S, Perol D, Menetrier-Caux C, Escudier B, Pallardy M, Ravaud A, Douillard JY, Chevreau C, Lasset C, Blay JY, Groupe Francais dI Interleukin-6, interleukin-10, and vascular endothelial growth factor in metastatic renal cell carcinoma: prognostic value of interleukin-6–from the Groupe Francais d’Immunotherapie. J Clin Oncol. 2004;22(12):2371–2378. doi: 10.1200/JCO.2004.06.121. [DOI] [PubMed] [Google Scholar]
- 38.Perez-Gracia JL, Prior C, Guillen-Grima F, Segura V, Gonzalez A, Panizo A, Melero I, Grande-Pulido E, Gurpide A, Gil-Bazo I, Calvo A. Identification of TNF-alpha and MMP-9 as potential baseline predictive serum markers of sunitinib activity in patients with renal cell carcinoma using a human cytokine array. Br J Cancer. 2009;101(11):1876–1883. doi: 10.1038/sj.bjc.6605409. [DOI] [PMC free article] [PubMed] [Google Scholar]
- 39.Vermaat JS, van der Tweel I, Mehra N, Sleijfer S, Haanen JB, Roodhart JM, Engwegen JY, Korse CM, Langenberg MH, Kruit W, Groenewegen G, Giles RH, Schellens JH, Beijnen JH, Voest EE. Two-protein signature of novel serological markers apolipoprotein-A2 and serum amyloid alpha predicts prognosis in patients with metastatic renal cell cancer and improves the currently used prognostic survival models. Ann Oncol. 2010;21(7):1472–1481. doi: 10.1093/annonc/mdp559. [DOI] [PubMed] [Google Scholar]
- 40.Sengupta S, Lohse CM, Cheville JC, Leibovich BC, Thompson RH, Webster WS, Frank I, Zincke H, Blute ML, Kwon ED. The preoperative erythrocyte sedimentation rate is an independent prognostic factor in renal cell carcinoma. Cancer. 2006;106(2):304–312. doi: 10.1002/cncr.21617. [DOI] [PubMed] [Google Scholar]
- 41.Szabo SJ, Kim ST, Costa GL, Zhang X, Fathman CG, Glimcher LH. A novel transcription factor, T-bet, directs Th1 lineage commitment. Cell. 2000;100(6):655–669. doi: 10.1016/S0092-8674(00)80702-3. [DOI] [PubMed] [Google Scholar]
- 42.Ylikoski E, Lund R, Kylaniemi M, Filen S, Kilpelainen M, Savolainen J, Lahesmaa R. IL-12 up-regulates T-bet independently of IFN-gamma in human CD4+ T cells. Eur J Immunol. 2005;35(11):3297–3306. doi: 10.1002/eji.200526101. [DOI] [PubMed] [Google Scholar]
- 43.Lin JT, Martin SL, Xia L, Gorham JD. TGF-beta 1 uses distinct mechanisms to inhibit IFN-gamma expression in CD4+ T cells at priming and at recall: differential involvement of Stat4 and T-bet. J Immunol. 2005;174(10):5950–5958. doi: 10.4049/jimmunol.174.10.5950. [DOI] [PubMed] [Google Scholar]
- 44.Garcia-Roig M, Ortiz N, Lokeshwar V. Molecular marker for predicting treatment response in advanced renal cell carcinoma: does the promise fulfill clinical need? Curr Urol Rep. 2014;15(1):375. doi: 10.1007/s11934-013-0375-0. [DOI] [PMC free article] [PubMed] [Google Scholar]
- 45.Porta C, Paglino C, De Amici M, Quaglini S, Sacchi L, Imarisio I, Canipari C. Predictive value of baseline serum vascular endothelial growth factor and neutrophil gelatinase-associated lipocalin in advanced kidney cancer patients receiving sunitinib. Kidney Int. 2010;77(9):809–815. doi: 10.1038/ki.2009.552. [DOI] [PubMed] [Google Scholar]
- 46.Escudier B, Eisen T, Stadler WM, Szczylik C, Oudard S, Staehler M, Negrier S, Chevreau C, Desai AA, Rolland F, Demkow T, Hutson TE, Gore M, Anderson S, Hofilena G, Shan M, Pena C, Lathia C, Bukowski RM. Sorafenib for treatment of renal cell carcinoma: Final efficacy and safety results of the phase III treatment approaches in renal cancer global evaluation trial. J Clin Oncol. 2009;27(20):3312–3318. doi: 10.1200/JCO.2008.19.5511. [DOI] [PubMed] [Google Scholar]
- 47.Harmon CS, DePrimo SE, Figlin RA, Hudes GR, Hutson TE, Michaelson MD, Negrier S, Kim ST, Huang X, Williams JA, Eisen T, Motzer RJ. Circulating proteins as potential biomarkers of sunitinib and interferon-alpha efficacy in treatment-naive patients with metastatic renal cell carcinoma. Cancer Chemother Pharmacol. 2014;73(1):151–161. doi: 10.1007/s00280-013-2333-4. [DOI] [PMC free article] [PubMed] [Google Scholar]
- 48.Pena C, Lathia C, Shan M, Escudier B, Bukowski RM. Biomarkers predicting outcome in patients with advanced renal cell carcinoma: Results from sorafenib phase III Treatment Approaches in Renal Cancer Global Evaluation Trial. Clin Cancer Res. 2010;16(19):4853–4863. doi: 10.1158/1078-0432.CCR-09-3343. [DOI] [PubMed] [Google Scholar]
- 49.Zurita AJ, Jonasch E, Wang X, Khajavi M, Yan S, Du DZ, Xu L, Herynk MH, McKee KS, Tran HT, Logothetis CJ, Tannir NM, Heymach JV. A cytokine and angiogenic factor (CAF) analysis in plasma for selection of sorafenib therapy in patients with metastatic renal cell carcinoma. Ann Oncol. 2012;23(1):46–52. doi: 10.1093/annonc/mdr047. [DOI] [PMC free article] [PubMed] [Google Scholar]
- 50.Hertoghs KM, Moerland PD, van Stijn A, Remmerswaal EB, Yong SL, van de Berg PJ, van Ham SM, Baas F, ten Berge IJ, van Lier RA. Molecular profiling of cytomegalovirus-induced human CD8+ T cell differentiation. J Clin Investig. 2010;120(11):4077–4090. doi: 10.1172/JCI42758. [DOI] [PMC free article] [PubMed] [Google Scholar]