

Abstract
Invasive ovarian cancer is associated with poor outcome. The presence of infiltrating regulatory T-cells (Tregs) suppresses protective anti-tumor immune responses, and their accumulation into the tumor microenvironment correlates with reduced survival in ovarian cancer patients. Here, we conducted a detailed characterization of CD4+ T-cells, CD8+ T-cells and Treg subsets in the peripheral blood and malignant ascites fluid from seventeen patients with ovarian carcinoma of epithelial origin. Cell distribution, activation status and proliferation status were assessed by multi-color flow cytometry. In ascites fluid, a significant accumulation of CD8+ cytotoxic T-cells and Tregs was observed compared to peripheral blood. Furthermore, a skewing toward the CD45RA− effector/memory compartment was observed in all T-cell subsets in the ascites fluid, but was most pronounced in the Treg population. Regulatory T-cells in the malignant ascites were more activated and had a higher proliferation rate compared to blood-derived cells from the same patient, and their number in ascites was positively correlated with the number of epithelial cells in effusion. In summary, we demonstrate an accumulation of activated CD4+, CD8+ and regulatory T-cells in the cancer microenvironment of ovarian carcinoma.
Electronic supplementary material
The online version of this article (doi:10.1007/s00262-014-1636-6) contains supplementary material, which is available to authorized users.
Keywords: Tumor-infiltrating lymphocytes, Regulatory T-cells, Ovarian carcinoma, Ascites fluid, CD147
Introduction
Ovarian cancer is the sixth most common malignant neoplasm in women worldwide, and the seventh most common cause of cancer death [1]. Despite development of surgical techniques and chemotherapeutic regimens, the overall survival rate is still below 40 % [2]. This is mainly due to innate or acquired drug resistance and the fact that the majority of tumors have progressed to an advanced stage at the time of diagnosis. Ovarian cancer typically spreads into the peritoneal cavity and is the most common primary tumor that leads to the production of ascitic fluid; an exudate containing tumor, inflammatory and mesothelial cells and mirroring the tumor microenvironment [3].
Similar to the situation in other cancer types, tumor-associated and tumor-infiltrating lymphocytes (TALs and TILs, respectively) are observed in or around tumors of the ovary, which has raised increasing interest and possibilities for prognostication [4, 5]. A number of studies relate TALs and TILs to disease progression and patient outcome by correlating data from histology of tumor sections or flow cytometry of ascites to progression-free survival and overall survival time. High levels of CD3+ TILs in ovarian carcinomas indicate a better prognosis than low levels or absence of intra-tumoral CD3+ TILs [6, 7]. Furthermore, a high ratio of cytotoxic CD8+ to FoxP3+ (forkhead box P3) positive TILs [8–10] and high numbers of cytotoxic CD8+ alone [8–12] may be independent markers for prolonged survival. In contrast, high numbers of regulatory T-cells (Tregs) and recruitment of Tregs to the cancer environment via CCL22/CCR4 (chemokine (C–C motif) ligand 22/chemokine (C–C motif) receptor 4) are independent markers for reduced survival with a stronger prognostic power than traditional histopathological classification [13]. In addition to recruitment and induction of Tregs, tumors in general also present a variety of other immune escape mechanisms including MHC (major histocompatibility complex) downregulation, secretion of inflammatory mediators, IDO (indoleamine 2,3-dioxygenase) secretion, activation of inhibitory pathways such as CTLA4 (cytotoxic T-lymphocyte-associated protein 4) and others [14], many of which may also be active in ovarian cancer.
The CD4+FoxP3+ Treg population can, in humans, be divided into three functionally separate subsets based on the expression of CD45RA and the transcription factor FoxP3 [15]. Two subsets have suppressive capacity; resting Tregs (CD4+CD45RA+FoxP3+) and the highly suppressive activated/effector Tregs (CD4+CD45RA−FoxP3++). Based on our recent observation, this activated and highly suppressive effector Treg subset is also delineated by high expression of CD147 [16]. The third FoxP3+ subset (CD4+CD45RA−FoxP3+) seems to contain non-suppressive cytokine-secreting cells, hereafter called cytokine-secreting cells. In malignant diseases, tumor cells are not only able to recruit thymus-derived (naturally occurring) Tregs from the periphery [13, 17] but also induce a tumor-associated immunosuppressive microenvironment that leads to differentiation of adaptive or peripherally induced Tregs from conventional naive T-cells by prolonged antigen stimulation and cytokine exposure [18–23].
The interaction between the tumor and the host immune response is complex [24]. As the presence of TALs and TILs represents a strong positive prognostic factor, whereas Tregs may prevent an effective anti-tumor response, characterization of the tumor infiltrate may yield important prognostic and therapeutic information. Therefore, a comprehensive characterization of the lymphocyte network in the tumor environment may lead to a better understanding of the mechanisms behind tumor-associated immune suppression and indicate future therapeutic targets to improve the anti-tumor immunity.
In this study, we have analyzed T-cells and cancer cells in ascites fluid of patients with epithelial ovarian carcinoma using a multicolor flow cytometry approach. We assessed different T-cell populations with respect to their abundance and activation status and compared the results with data obtained from analysis of T-cells from peripheral blood of the same patients and healthy blood donors. We show that the frequency of memory cells and activated Tregs are elevated among the TALs of ascites indicating that these cells may have been activated by the tumor or the tumor-associated microenvironment. This is the first report demonstrating the skewing of the Treg population toward an increased frequency of the activated Treg subset in a local cancer environment.
Materials and methods
Patients and study controls
The study was approved by the Regional Ethical Committee, and written informed consents were obtained from all patients. Ascites fluid and blood samples were obtained in a prospective, nonselective fashion from 17 patients referred consecutively to the Haukeland University Hospital (Bergen, Norway) for primary surgery. Clinical information from all patients was collected (Supplementary Table 1 for a detailed characterization of the study group). The blood samples were taken just before the initiation of the surgical procedure, and ascitic fluid samples were obtained during laparotomy, immediately after the peritoneal cavity was opened. Buffy coats from healthy blood donors (Oslo University Hospital Blood Centre) were used as controls.
Isolation of cells
Peripheral blood mononuclear cells were isolated using Isopaque-Ficoll (Lymphoprep, Fresenius Kabi Norge AS, Norway) gradient centrifugation. Cells from 100 to 500 mL ascites fluid were isolated using a protocol where the ascites was filtered through a 40 µM mesh to remove tissue remains and centrifuged in 50-mL tubes (10 min, 350 g). After two washes in PBS (phosphate buffered saline), the cells were directly fixed in Buffer A (Human FoxP3 Buffer Set, BD Biosciences) and stored at −80 °C until analysis.
Flow cytometry
After thawing, cells were permeabilized using the Human FoxP3 Buffer Set (BD Biosciences) and stained with CD3-Pacific Blue (clone: UCHT1), CD4-PerCP (L200), CD8-PE-Cy7 (RPA-T8), CD45RA-APC-H7 (HI100) and FoxP3-Alexa Fluor 647 (259D/C7) in combination with CD38-FITC (HB7) and CD69-PE (L78), CD147-FITC (HIM6), PD1-FITC (MIH4) and CTLA4-PE (BNI3) (BD Biosciences) or Ki-67-PE (20Raj1, eBioscience) and CCR4-FITC (205410, R&D Systems) to characterize lymphoid cell populations. Furthermore, cells were stained with CD45-V450 (HI30) and EpCAM-FITC (EBA-1) (BD Biosciences) to identify tumor cells. Subsequently, stained samples were run on a FACSCanto II (BD Biosciences) for data acquisition followed by gating, data analysis and visualization in Cytobank (www.cytobank.org). For all markers, the percentage of positive cells was assessed, except for CD147, where cells were divided into non-expressers, medium(CD147+)- and high(CD147++)-expressing cells (Supplementary Fig. 2). The total number of CD147-expressing cells (intermediate plus high expressing cells) is indicated with CD147total.
Statistical analysis
Paired patient data were analyzed using paired t tests if the data passed a Saphiro-Wilk normality test, or alternatively with Wilcoxon signed rank test. Unpaired data were analyzed using t tests in case of normal distribution or Mann–Whitney rank-sum tests. Correlations were calculated with Pearson product-moment analysis. All statistical analyses were carried out either in PASW Statistics 18 (IBM) or in SigmaPlot 11 (Systat Software), and graphs were plotted in SigmaPlot.
Results
Collection of patient samples and phenotypic analysis
Malignant ascites and peripheral blood were collected during the primary surgery from seventeen patients (Supplementary Table 1) suffering from epithelial ovarian carcinoma. None of the patients had received chemotherapy in advance. Of the seventeen patients, only two had an early-stage disease, FIGO (International Federation of Gynecology and Obstetrics) IA and IIB, whereas thirteen were classified as IIIC and two had stage IV. Most of the tumors were classified as high-grade serous adenocarcinomas.
Leukocytes derived from the malignant ascites as well as patient PBMC were analyzed using multicolor flow cytometry. Based on lineage markers, the mixed cell samples were first gated to identify singlet T lymphocytes (Supplementary Fig. 1A, B) and next subdivided into nine populations: total, naive, effector/memory CD4+ and CD8+, as well as resting Tregs, activated/effector Tregs and FoxP3+ cytokine-secreting cells (Supplementary Fig. 1D-F). Next, the percentage of CD38, CD69, CTLA4, PD1 (programmed cell death 1), Ki-67 (marker of proliferation Ki-67), CD147 medium (CD147+), CD147 high (CD147++) and CD147total positive cells was determined for each subpopulation (see Supplementary Fig. 2 for gating of marker-positive cells).
Comparison of patient blood with healthy donor blood
Comparison of patient PBMC (n = 17) with PBMC from healthy blood donors (n = 16) revealed that the percentage of CD3+ T-cells in circulation was significantly decreased in the patients compared to normal blood donors (Supplementary Table 2, P = 0.002). Within the CD3+ population, the percentage of CD4+CD8− T-cells tended to increase in patient PBMC (P = 0.074). In addition, the distribution of CD4+ T-cells as well as CD8+ cytotoxic T-cells between the naive (CD45RA+) and the effector/memory (CD45RA−) T-cell compartments in peripheral blood from the patients was skewed toward naive T-cells with an increase in the naive CD4+ T-cells and especially the naive CD8+ T-cell population (Supplementary Table 2, P = 0.045 and P = 0.022, respectively).
Between patient and healthy donor blood, several cell surface activation markers were differently expressed. CD4+FoxP3−CD45RA− effector/memory cells in general were less activated in patients as displayed by fewer CTLA4+ cells (Fig. 1a). In contrast, CD8+CD45RA− T-cells in patient blood showed higher levels of activation, monitored by elevated cell numbers expressing CD38 (Fig. 1c) and accompanied by higher percentage of CD147++ (Fig. 1d). However, CTLA4 showed no difference in CD8+ cell populations (Supplementary Table 3). In the CD4+FoxP3+ compartment, expression of CD38 (Fig. 1f) and CD147total (Fig. 1g) on cytokine-secreting FoxP3+ cells, which are described as non-suppressive, were higher in patient blood, while their expression on activated Tregs displayed no difference. However, the percentage of proliferating cells, expressing Ki-67, was higher in all analyzed cell populations in the patient blood compared to healthy donor blood (Fig. 1b, e, h).
Fig. 1.

Comparison of the phenotype of CD4+, CD8+ and FoxP3+ T-cell populations between healthy donor and patient PBMC. Flow cytometric analysis of activation marker expression on effector/memory CD4+ (a–b) and CD8+ (c–e) as well as activated Tregs (CD4+FoxP3++CD45RA−) and cytokine-secreting effector/memory T-cells (CD4+FoxP3+CD45RA−) (f–h). For CTLA4 (a), Ki-67 (b, e, h) and CD38 (c, f) all displayed populations were split into a marker-positive and a marker-negative subpopulation, whereas for CD147 (d, g) three expression levels were identified in the analysis (no, medium and high expression indicated as CD147−, CD147+ and CD147++, respectively). DB: PBMC from blood bank donors (n = 10 except for CTLA4 where n = 14), PB: PBMC from ovarian carcinoma patients (n = 17 except for Ki-67 where n = 8). Plots show the median, 25th–75th percentiles as vertical boxes with 10th–90th percentiles as error bars. Outliers are displayed as dots. Statistically significant differences between DB and PB are marked with “*” for P < 0.05, “#” for P < 0.01, “**” for P < 0.005 and “##” for P < 0.001
Comparison of patient PBMC T-cell populations with ascites-derived T-cell populations
Next, we compared T-cells isolated from malignant ascites with T-cells from PBMC from the same patient. The proportion of CD3+ T-cells in the ascites compared to patient blood was clearly increased (Supplementary Table 2, P = 0.003). Indeed, the percentage of CD3+ T-cells in patient ascites was more similar to healthy donor PBMC (P = 0.552). Furthermore, we observed a skewing of the CD4+/CD8+ T-cell distribution within the CD3+ cells of the ascites toward CD8+ T-cells (Fig. 2a, c, e, Supplementary Table 2). Moreover, a shift toward the effector/memory compartment in the CD4+ T-cell population as well as in the CD8+ T-cell population was found (Fig. 2a, c, e, Supplementary Table 2). Besides the CD8+ shift, we observed accumulation of CD4+FoxP3+ in the ascites fluid (up to 27 % of total CD4+ cells, Fig. 2d, Supplementary Table 2). This increase was caused by the CD45RA−FoxP3+ cytokine-secreting cells and CD45RA−FoxP3++ activated/memory Tregs (Fig. 2b, d, e, Supplementary Table 2) where the median was approximately doubled, whereas the percentages of CD45RA+FoxP3+ resting Tregs in ascites and patient PBMC were similar (Fig. 2d, Supplementary Table 2).
Fig. 2.
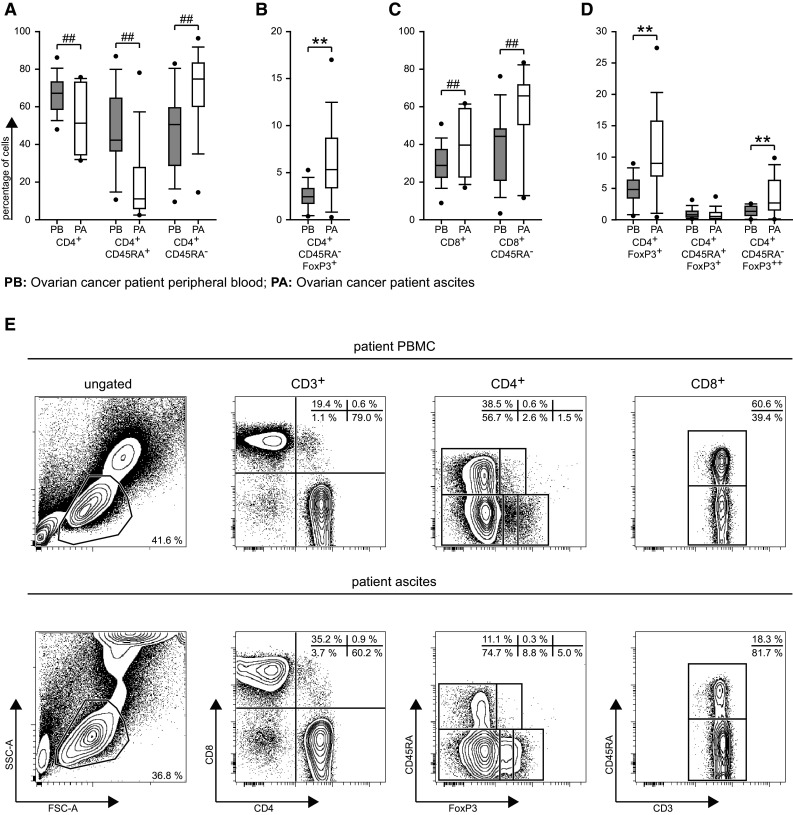
Comparison of cell populations between patient PBMC and ascites fluid samples. a–d Relative distribution of cell populations as calculated during the gating procedure (Supplementary Fig. 1) and plotted as in Fig. 1. PB: patient peripheral blood, PA: patient ascites, n = 17. e Example plots from one representative patient demonstrating the differences between the patient PBMC (upper panel) and ascites (lower panel)
CD4+FoxP3− and CD8+ T-cells derived from the ascites fluid are highly activated
We next compared patient PBMC and ascites-derived T-cells with regard to their activation status. Expression of the early activation marker CD69 was elevated in CD4+CD45RA− and CD8+CD45RA− effector/memory T-cells from ascites (fourfold–sixfold) (Fig. 3a, f, Supplementary Table 3). In contrast to the upregulation of CD69, the steady-state activation parameter CD38 did not show any clear changes in ascites compared to patient PBMC (Supplementary Table 3). However, the fractions of effector/memory CD4+ and CD8+ T-cells positive for CTLA4 in ascites were increased 2.0- and 2.7-fold, respectively, compared to the patients’ peripheral blood (Fig. 3b, g). The expression of PD1 was doubled in effector/memory CD4+ T-cells of the ascites (Fig. 3c) and tended to be elevated in effector/memory CD8+ T-cells (Fig. 3h). Furthermore, the number of cells expressing the activation marker CD147 was increased in ascites in all analyzed CD4+ and CD8+ cell populations (Fig. 3d, i, Supplementary Table 3). In the CD4+ compartment, the enhanced activation was also correlated with a higher proliferation rate, which was displayed by higher abundance of Ki-67+ cells in the ascites (Fig. 3e). A similar tendency was observed in the CD8+ compartment, but did not reach statistical significance (Fig. 3j).
Fig. 3.

Comparison of the phenotype of effector/memory CD4+FoxP3−CD45RA−and CD8+CD45RA− T-cell subpopulations between patient PBMC (PB) and ascites (PA). Presentation as for Fig. 1, sample numbers: a, f CD69 and b, g CTLA4 n = 17, c, h PD1 n = 16, d, i CD147 PB n = 17, PA n = 16, e, j Ki-67 PB n = 8, PA n = 15
Activation markers on CD4+FoxP3+ cells in ascites
When comparing the expression of activation markers on CD4+FoxP3+ T-cells between patient blood and ascites, we found significant changes for CD69 (increase) on activated/effector Tregs and for CD38 (reduction) on FoxP3+ cytokine-secreting T-cells (Supplementary Table 3). Furthermore, the proportion of CTLA4-expressing T-cells was elevated in all ascites CD4+FoxP3+ T-cell populations (Fig. 4a). CD147total-expression was similar in activated/effector Tregs between patient PBMC and ascites (P = 0.599, Supplementary Table 3). However, activated/effector Tregs in PBMC contained a larger fraction of CD147++ cells and a smaller fraction of CD147+ T-cells compared to ascites (Fig. 4b, c). Similarly, within FoxP3+ cytokine-secreting cells, the proportion of CD147+ cells was higher in ascites and the proportion of CD147++ cells higher in PBMC. As expected, in both PBMC and ascites, cytokine-secreting cells expressed lower levels of CD147 than activated/effector Tregs (Fig. 4b, c). Finally, only the resting Tregs in the FoxP3+ compartment had a higher percentage of Ki-67 expressers in ascites (Fig. 4d).
Fig. 4.

Comparison of the phenotype of CD4+FoxP3+ populations between patient PBMC (PB) and ascites (PA). Flow cytometric analysis of surface marker expression on the FoxP3+ cell populations activated/effector Tregs (FoxP3++CD45RA−) and cytokine-secreting cells (FoxP3+CD45RA−). a CTLA4, b CD147++ (high), c CD147+ (medium) and Ki-67 (d), presentation as for Fig. 1, sample numbers as for Fig. 3
Distribution of CD4+FoxP3+ resting and activated Tregs in malignant ascites differs from that in PBMC
We next explored the possibility that the distribution of T-cell subsets in the ascites depended on the distribution of the respective subsets in patient blood. For that reason, we calculated the Pearson product moment for total CD4+ T-cells, effector/memory CD4+ T-cells, total CD8+ T-cells, effector/memory CD8+ T-cells, total CD4+FoxP3+ T-cells, resting Tregs and activated/effector Tregs cell populations between patient PBMC and ascites cells. There was a clear positive correlation for the total CD4+ T-cells, effector/memory CD4+ T-cells (Fig. 5a), total CD8+ T-cells and effector/memory CD8+ T-cells (Fig. 5b), with R 2 values of approximately 0.5 and P < 0.002 for all comparisons, which indicates a strong dependency between the respective T-cell proportions in blood and ascites. Plotting the relative T-cell subpopulation levels in ascites against those of PBMC further underscores the lower CD4+ T-cell and higher effector/memory CD4+ T-cell, CD8+ T-cell and effector/memory CD8+ T-cell fractions in the ascites compared to PBMC within almost every patient. However, for the CD4+FoxP3+ T-cell populations, no correlation between the relative cell number in circulation and ascites was found, except for the CD4+CD45RA+FoxP3+ T-cells where a weak correlation between PBMC and ascites was calculated (R 2 = 0.36, P = 0.01). For the CD4+FoxP3+ T-cell populations in general, the correlation plots revealed a higher occurrence of CD4+FoxP3+ T-cells and particularly CD4+CD45RA−FoxP3++ T-cells in ascites compared to peripheral blood (Fig. 5c).
Fig. 5.

a–c Correlations between relative abundance of cell populations in patient blood (Y-axis) and ascites (X-axis). Gray shaded area: higher percentage of cells in patient PBMC, white area: higher percentage of cells in patient ascites fluid (n = 17). d–f Expression of CCR4. DB n = 10, PB n = 8, PA n = 15. g, h Gating strategy for non-lymphoid cells in ascites: g Cells were selected based on FSC-A/SSC-A plot. h Expression of CD45 and EpCAM was used to split the ascites cells into effused CD45−EpCAM+ epithelial cells (black gate, 1.7 %), CD45−EpCAM− double negative cells (dashed gate, 3.3 %) and CD45+EpCAM− lymphocytes (dotted gate, 95 %). i Correlations between the relative abundances of CD4+FoxP3+ cell populations in the ascites (Y-axis) and the epithelial cells in effusion (X-axis)
Recruitment of CD4+ T-cell populations
The elevated numbers of effector/memory CD4+ T-cells and CD4+FoxP3+ T-cell populations in the ascites fluid suggested an active recruitment of these T-cell populations to the cancer microenvironment. Therefore, we assessed the levels of CCR4, among others a receptor for recruitment of Tregs via CCL17 (chemokine (C–C motif) ligand 17) and CCL22. Surprisingly, only the CD45RA+ T-cell populations, the naive CD4+ T-cells and resting Tregs, showed a significantly higher expression of CCR4 in the cancer environment, compared to patient PBMC or healthy donor PBMC (Fig. 5d, e), which indicated a possibility for recruitment of these T-cell subsets. Furthermore, the Ki-67 expression and accordingly the proliferation in naive CD4+CCR4+ T-cells were significantly increased in the patient blood compared to healthy donor blood and tended to be higher in ascites compared to patient blood (P = 0.073, Fig. 5f).
CD4+FoxP3+ relative cell abundance in the ascites fluid correlates with the percentage of epithelial cells in effusion
The fact that the high percentage of CD4+FoxP3+ T-cells in the ascites fluid was independent of the frequency of CD4+FoxP3+ T-cell in peripheral blood in the patients, but associated with proliferation and chemotactic recruitment of resting Tregs, raised the question of whether the presence of cancer cells influenced ascites Treg number and activation status. For that reason, we characterized the ascites with respect to non-lymphoid cells. Cells present in the ascites fluid were divided in three categories based on the expression of the surface markers CD45 and EpCAM (Epithelial Cell Adhesion Molecule, CD326), a marker for epithelial cells [25, 26] (Fig. 5g, h). The percentages of epithelial CD45−EpCAM+ cells in effusion and CD45−EpCAM− double negative cells were calculated and correlated with the previously defined lymphocyte populations. One of the patients represented a clear outlier having 12 % CD45−EpCAM+ cells in the ascites, compared to the remaining sixteen patients with a median of 1.05 % and a range of 0.04–4.44 % of CD45−EpCAM+ cells, and was therefore excluded from the analysis. Statistically significant correlations were observed between epithelial cells in effusion and total CD4+FoxP3+, activated/memory Tregs and cytokine-secreting T-cells with R 2 values ≥0.5 and P values ≤0.002 (Fig. 5i), but not for resting Tregs (data not shown). Neither were correlations observed for the total CD4+ T-cells, effector/memory CD4+ T-cells (Supplementary Fig. 3a), total CD8+ T-cells, nor for the effector/memory CD8+ T-cells (Supplementary Fig. 3b).
Discussion
The concept of an immunosuppressive microenvironment that surrounds human malignant tumors and shields the tumor from an adaptive anti-tumor immune response is now well established from experimental models, functional data from human cancers and from histological characterization of tissue specimens. The tumor biology, lymphocytes and inflammatory cells, extracellular matrix components and a rich cytokine environment contribute in concert to a microenvironment, that fosters inflammation, which paradoxically drives tumor growth, angiogenesis and promotes tumor infiltration and metastasis, while simultaneously inhibiting anti-tumor immunity. In ovarian carcinoma, the immediate tumor microenvironment is extended to the abdominal cavity in the presence of malignant ascites. Therapeutically, this represents an additional obstacle; as the tumor may then metastasize throughout the abdominal cavity severely limiting the possibilities for curative surgical treatment. Malignant ascites represents a tumor-triggered inflammatory exudate that often contains cancer cells. In addition, the malignant ascites contains leukocytes of different origin including lymphocytes (TALs) that are likely to reflect the TILs that are to be found in the immediate tumor microenvironment of the primary tumor.
CD3+ T-cell infiltration in malignant tumors is associated with a favorable prognosis, whereas the presence of Tregs may inhibit an otherwise beneficial and effective anti-tumor immune response [6, 8–10, 13, 18]. Therefore, characterization of the TILs and TALs may yield valuable clinical information that may improve prognostication and direct therapeutic choices.
Here, we provide a detailed characterization of TALs in ovarian carcinoma malignant ascites taking into account the most recent developments in understanding effector/memory and Treg development and compartmentalization. We demonstrate that the cancer induces a cytotoxic immune response, as evident from the abundance of CD8 effector/memory T-cells, which we anticipate migrate in concomitantly with Tregs. Furthermore, we show for the first time increased levels of activated Tregs in a cancer environment and address their origin and development.
Our flow cytometry-based dissection of the abundance and activation status of different conventional CD4+ and CD8+ T-cell subsets revealed two major shifts in these T-cell populations in patient ascites compared to the corresponding blood samples. Specifically, we found increased percentages of cytotoxic CD8+ cells, which might indicate that the immune responses were skewed toward Th1, although cytokine profiles like interferon gamma and transcription factors like T-bet would be necessary to assess the Th direction in detail. Within the ascites CD4+ and CD8+ T-cell populations, most conventional T-cells belong to the effector/memory T-cell compartment, identified by the absence of CD45RA expression. Additionally, the conventional CD4+ and CD8+ T-cells in the ascites were more activated with a higher proliferative index, as shown by increased levels of the activation markers CD69, CD147 [16] and CTLA4, as well as the proliferation marker Ki-67. Moreover, a significant part of the CD4+CD45RA+ T-cells in ascites exhibits a high expression level of the chemotaxis receptor CCR4, which positively correlates with the expression of Ki-67, indicating that these cells are already recruited and proliferating, which could mean that they either are naïve T-cells undergoing transformation to effector CD4+ T-cells or terminal effector T-cells. Despite these differences, the distributions of conventional T-cell subtypes in blood and ascites still correspond, as also reported earlier [26]. This indicates that conventional T-cells in the ascites to some extent reflect the blood picture, but with clear signs of activation and recruitment by tumor cells or the tumor-associated microenvironment. However, correlation analysis of T-cell subset and activation marker levels versus clinicopathological characteristics did not reveal any clear dependencies.
When assessing FoxP3 expressing CD4+ T-cell populations, we found an accumulation of cytokine-secreting CD4+CD45RA−FoxP3+ T-cells and especially CD4+CD45RA−FoxP3++ activated Tregs in the patient ascites. Based on CTLA4 expression, cytokine-secreting effector T-cells and activated Tregs displayed a higher degree of activation in the ascites than in blood. However, contrary to a previous study [26], no correlation between Treg numbers in blood and ascites was observed. In line with this previous study, however, the proportion of Tregs positively correlated with the proportion of EpCAM+ cancer-derived epithelial cells in ascites fluid, which may indicate active recruitment or de novo induction of Tregs from naïve CD4+ T-cells by cancer cells, as has been observed in vitro [20]. The suggestion of active recruitment of resting, thymus-derived Tregs from circulation is supported by their high expression levels of the migration marker CCR4, indicating antigen-dependent triggering and Ki-67, indicating proliferation. Interestingly, CD147 levels were also highly increased, which is compatible with our recent observation that increasing CD147 expression on Tregs correlates with suppressive capacity [16]. However, no clear relation to clinical status could be established for Treg markers.
In summary, our study provides novel insights into a cancer-associated immune response at the time of diagnosis and how activation of Tregs proceeds to establish a microenvironment which might suppress tumor immune responses. The impact of our findings on disease progression will have to be evaluated in a prospective follow-up of the patient cohort.
Electronic supplementary material
Below is the link to the electronic supplementary material.
Acknowledgments
We thank the pathologists from the Department of Pathology, The Gade Institute, Haukeland University Hospital, Bergen, Norway for routine histopathological diagnosis of the tumor specimens. Furthermore, we thank Isabelle Cornez, Kristoffer W. Brudvik and Simer J. Bains for help with processing samples for subsequent analysis. This work was supported by the Research Council of Norway, the Norwegian Cancer Society, the Kristian Gerhard Jebsen Foundation and Anders Jahre’s Foundation.
Conflict of interest
The authors declare no conflict of interest.
Abbreviations
- CCL17
Chemokine (C–C motif) ligand 17
- CCL22
Chemokine (C–C motive) ligand 22
- CCR4
Chemokine (C–C motive) receptor 4
- CTLA4
Cytotoxic T-lymphocyte-associated protein 4
- EpCAM
Epithelial cell adhesion molecule
- FIGO
International Federation of Gynaecology and Obstetrics
- FoxP3
Forkhead box P3
- IDO
Indoleamine 2,3-dioxygenase
- Ki-67
Marker of proliferation Ki-67
- MHC
Major histocompatibility complex
- PBMC
Peripheral blood mononuclear cells
- PBS
Phosphate buffered saline
- PD1
Programmed cell death 1
- TALs
Tumor-associated lymphocytes
- TILs
Tumor-infiltrating lymphocytes
- Treg
Regulatory T-cell
References
- 1.Boyle P, Levin B, editors. World cancer report 2008. Lyon: International Agency for Research on Cancer; 2008. [Google Scholar]
- 2.Morgan RJ, Jr, Alvarez RD, Armstrong DK, Boston B, Burger RA, Chen LM, Copeland L, Crispens MA, Gershenson D, Gray HJ, Grigsby PW, Hakam A, Havrilesky LJ, Johnston C, Lele S, Matulonis UA, O’Malley DM, Penson RT, Remmenga SW, Sabbatini P, Schilder RJ, Schink JC, Teng N, Werner TL, National Comprehensive Cancer N Epithelial ovarian cancer. J Natl Compr Canc Netw. 2011;9(1):82–113. doi: 10.6004/jnccn.2011.0008. [DOI] [PubMed] [Google Scholar]
- 3.Parsons SL, Watson SA, Steele RJ. Malignant ascites. Br J Surg. 1996;83(1):6–14. doi: 10.1002/bjs.1800830104. [DOI] [PubMed] [Google Scholar]
- 4.Yu P, Fu YX. Tumor-infiltrating T lymphocytes: friends or foes? Lab Invest. 2006;86(3):231–245. doi: 10.1038/labinvest.3700389. [DOI] [PubMed] [Google Scholar]
- 5.Nelson BH. The impact of T-cell immunity on ovarian cancer outcomes. Immunol Rev. 2008;222:101–116. doi: 10.1111/j.1600-065X.2008.00614.x. [DOI] [PubMed] [Google Scholar]
- 6.Zhang L, Conejo-Garcia JR, Katsaros D, Gimotty PA, Massobrio M, Regnani G, Makrigiannakis A, Gray H, Schlienger K, Liebman MN, Rubin SC, Coukos G. Intratumoral T cells, recurrence, and survival in epithelial ovarian cancer. N Engl J Med. 2003;348(3):203–213. doi: 10.1056/NEJMoa020177. [DOI] [PubMed] [Google Scholar]
- 7.Raspollini MR, Castiglione F, Rossi Degl’innocenti D, Amunni G, Villanucci A, Garbini F, Baroni G, Taddei GL. Tumour-infiltrating gamma/delta T-lymphocytes are correlated with a brief disease-free interval in advanced ovarian serous carcinoma. Ann Oncol. 2005;16(4):590–596. doi: 10.1093/annonc/mdi112. [DOI] [PubMed] [Google Scholar]
- 8.Sato E, Olson SH, Ahn J, Bundy B, Nishikawa H, Qian F, Jungbluth AA, Frosina D, Gnjatic S, Ambrosone C, Kepner J, Odunsi T, Ritter G, Lele S, Chen YT, Ohtani H, Old LJ, Odunsi K. Intraepithelial CD8+ tumor-infiltrating lymphocytes and a high CD8+/regulatory T cell ratio are associated with favorable prognosis in ovarian cancer. Proc Natl Acad Sci USA. 2005;102(51):18538–18543. doi: 10.1073/pnas.0509182102. [DOI] [PMC free article] [PubMed] [Google Scholar]
- 9.Leffers N, Gooden MJ, de Jong RA, Hoogeboom BN, ten Hoor KA, Hollema H, Boezen HM, van der Zee AG, Daemen T, Nijman HW. Prognostic significance of tumor-infiltrating T-lymphocytes in primary and metastatic lesions of advanced stage ovarian cancer. Cancer Immunol Immunother. 2009;58(3):449–459. doi: 10.1007/s00262-008-0583-5. [DOI] [PMC free article] [PubMed] [Google Scholar]
- 10.Barnett JC, Bean SM, Whitaker RS, Kondoh E, Baba T, Fujii S, Marks JR, Dressman HK, Murphy SK, Berchuck A. Ovarian cancer tumor infiltrating T-regulatory (T(reg)) cells are associated with a metastatic phenotype. Gynecol Oncol. 2010;116(3):556–562. doi: 10.1016/j.ygyno.2009.11.020. [DOI] [PubMed] [Google Scholar]
- 11.Hamanishi J, Mandai M, Iwasaki M, Okazaki T, Tanaka Y, Yamaguchi K, Higuchi T, Yagi H, Takakura K, Minato N, Honjo T, Fujii S. Programmed cell death 1 ligand 1 and tumor-infiltrating CD8+ T lymphocytes are prognostic factors of human ovarian cancer. Proc Natl Acad Sci USA. 2007;104(9):3360–3365. doi: 10.1073/pnas.0611533104. [DOI] [PMC free article] [PubMed] [Google Scholar]
- 12.Adams SF, Levine DA, Cadungog MG, Hammond R, Facciabene A, Olvera N, Rubin SC, Boyd J, Gimotty PA, Coukos G. Intraepithelial T cells and tumor proliferation: impact on the benefit from surgical cytoreduction in advanced serous ovarian cancer. Cancer. 2009;115(13):2891–2902. doi: 10.1002/cncr.24317. [DOI] [PMC free article] [PubMed] [Google Scholar]
- 13.Curiel TJ, Coukos G, Zou L, Alvarez X, Cheng P, Mottram P, Evdemon-Hogan M, Conejo-Garcia JR, Zhang L, Burow M, Zhu Y, Wei S, Kryczek I, Daniel B, Gordon A, Myers L, Lackner A, Disis ML, Knutson KL, Chen L, Zou W. Specific recruitment of regulatory T cells in ovarian carcinoma fosters immune privilege and predicts reduced survival. Nat Med. 2004;10(9):942–949. doi: 10.1038/nm1093. [DOI] [PubMed] [Google Scholar]
- 14.Zou W. Regulatory T cells, tumour immunity and immunotherapy. Nat Rev Immunol. 2006;6(4):295–307. doi: 10.1038/nri1806. [DOI] [PubMed] [Google Scholar]
- 15.Miyara M, Yoshioka Y, Kitoh A, Shima T, Wing K, Niwa A, Parizot C, Taflin C, Heike T, Valeyre D, Mathian A, Nakahata T, Yamaguchi T, Nomura T, Ono M, Amoura Z, Gorochov G, Sakaguchi S. Functional delineation and differentiation dynamics of human CD4+ T cells expressing the FoxP3 transcription factor. Immunity. 2009;30(6):899–911. doi: 10.1016/j.immuni.2009.03.019. [DOI] [PubMed] [Google Scholar]
- 16.Solstad T, Bains SJ, Landskron J, Aandahl EM, Thiede B, Tasken K, Torgersen KM. CD147 (Basigin/Emmprin) identifies FoxP3+CD45RO+CTLA4+-activated human regulatory T cells. Blood. 2011;118(19):5141–5151. doi: 10.1182/blood-2011-02-339242. [DOI] [PubMed] [Google Scholar]
- 17.Gobert M, Treilleux I, Bendriss-Vermare N, Bachelot T, Goddard-Leon S, Arfi V, Biota C, Doffin AC, Durand I, Olive D, Perez S, Pasqual N, Faure C, Ray-Coquard I, Puisieux A, Caux C, Blay JY, Menetrier-Caux C. Regulatory T cells recruited through CCL22/CCR4 are selectively activated in lymphoid infiltrates surrounding primary breast tumors and lead to an adverse clinical outcome. Cancer Res. 2009;69(5):2000–2009. doi: 10.1158/0008-5472.CAN-08-2360. [DOI] [PubMed] [Google Scholar]
- 18.Li X, Ye DF, Xie X, Chen HZ, Lu WG. Proportion of CD4+CD25+ regulatory T cell is increased in the patients with ovarian carcinoma. Cancer Invest. 2005;23(5):399–403. [PubMed] [Google Scholar]
- 19.Liu VC, Wong LY, Jang T, Shah AH, Park I, Yang X, Zhang Q, Lonning S, Teicher BA, Lee C. Tumor evasion of the immune system by converting CD4+CD25− T cells into CD4+CD25+ T regulatory cells: role of tumor-derived TGF-beta. J Immunol. 2007;178(5):2883–2892. doi: 10.4049/jimmunol.178.5.2883. [DOI] [PubMed] [Google Scholar]
- 20.Zhao X, Ye F, Chen L, Lu W, Xie X. Human epithelial ovarian carcinoma cell-derived cytokines cooperatively induce activated CD4+CD25−CD45RA+ naive T cells to express forkhead box protein 3 and exhibit suppressive ability in vitro. Cancer Sci. 2009;100(11):2143–2151. doi: 10.1111/j.1349-7006.2009.01286.x. [DOI] [PMC free article] [PubMed] [Google Scholar]
- 21.Mahic M, Yaqub S, Johansson CC, Tasken K, Aandahl EM. FOXP3+CD4+CD25+ adaptive regulatory T cells express cyclooxygenase-2 and suppress effector T cells by a prostaglandin E2-dependent mechanism. J Immunol. 2006;177(1):246–254. doi: 10.4049/jimmunol.177.1.246. [DOI] [PubMed] [Google Scholar]
- 22.Mahic M, Yaqub S, Bryn T, Henjum K, Eide DM, Torgersen KM, Aandahl EM, Tasken K. Differentiation of naive CD4+ T cells into CD4+CD25+FOXP3+ regulatory T cells by continuous antigen stimulation. J Leukoc Biol. 2008;83(5):1111–1117. doi: 10.1189/jlb.0507329. [DOI] [PubMed] [Google Scholar]
- 23.Yaqub S, Henjum K, Mahic M, Jahnsen FL, Aandahl EM, Bjornbeth BA, Tasken K. Regulatory T cells in colorectal cancer patients suppress anti-tumor immune activity in a COX-2 dependent manner. Cancer Immunol Immunother. 2008;57(6):813–821. doi: 10.1007/s00262-007-0417-x. [DOI] [PMC free article] [PubMed] [Google Scholar]
- 24.Bhardwaj N. Harnessing the immune system to treat cancer. J Clin Invest. 2007;117(5):1130–1136. doi: 10.1172/JCI32136. [DOI] [PMC free article] [PubMed] [Google Scholar]
- 25.Dong HP, Kleinberg L, Davidson B, Risberg B. Methods for simultaneous measurement of apoptosis and cell surface phenotype of epithelial cells in effusions by flow cytometry. Nat Protoc. 2008;3(6):955–964. doi: 10.1038/nprot.2008.77. [DOI] [PubMed] [Google Scholar]
- 26.Bamias A, Tsiatas ML, Kafantari E, Liakou C, Rodolakis A, Voulgaris Z, Vlahos G, Papageorgiou T, Tsitsilonis O, Bamia C, Papatheodoridis G, Politi E, Archimandritis A, Antsaklis A, Dimopoulos MA. Significant differences of lymphocytes isolated from ascites of patients with ovarian cancer compared to blood and tumor lymphocytes. Association of CD3+CD56+ cells with platinum resistance. Gynecol Oncol. 2007;106(1):75–81. doi: 10.1016/j.ygyno.2007.02.029. [DOI] [PubMed] [Google Scholar]
Associated Data
This section collects any data citations, data availability statements, or supplementary materials included in this article.