Abstract
Recombinant human interleukin-2 (rhIL-2) therapy is approved for treating patients with advanced melanoma yet significant responses are observed in only 10–15% of patients. Interleukin-2 induces Foxp3 expression in activated human CD8 T cells in vitro and expands circulating CD8 Foxp3+ T cells in melanoma patients. Employing IL-2 responsive (B16-F1, B16-BL6, JB/MS, MCA-205) and nonresponsive (JB/RH, B16-F10) subcutaneous tumor mouse models, we evaluated CD8 Foxp3+ T cell distribution and changes in response to rhIL-2 (50,000 U, i.p. or s.q., twice daily for 5 days). In tumor-free mice and subcutaneous tumor-bearing mouse models, CD8 Foxp3+ T cells were a rare but naturally occurring cell subset. Primarily located in skin-draining lymph nodes, CD8 Foxp3+ T cells expressed both activated T cell (CD28+, CD44+) and Treg (CTLA4+, PD1lo/var, NKG2A+/var) markers. Following treatment with rhIL-2, a dramatic increase in CD8 Foxp3+ T cell prevalence was observed in the circulation and tumor-draining lymph nodes (TD.LNs) of animals bearing IL-2 nonresponsive tumors, while no significant changes were observed in the circulation and TD.LNs of animals bearing IL-2 responsive tumors. These findings suggest expansion of CD8 Foxp3+ T cell population in response to rhIL-2 treatment may serve as an early marker for tumor responsiveness to immunotherapy in an immune competent model. Additionally, these data may provide insight to predict response in patients with melanoma undergoing rhIL-2 treatment.
Electronic supplementary material
The online version of this article (doi:10.1007/s00262-011-1035-1) contains supplementary material, which is available to authorized users.
Keywords: Melanoma, Interleukin-2, Foxp3, CD8 T cells
Introduction
Epidemiological data report that while overall cancer incidence and cancer-related mortality are declining in the United States, incidence of melanoma continues to rise [1]. In 2010, an estimated 68,130 new diagnoses of melanoma will be made in the United States and 8,700 deaths will occur [1]. Treatment options for patients with unresectable stage III and metastatic stage IV melanoma remain limited. To date, response rates to chemotherapy (dacarbazine, temozolomide) are <15%, and these responses are typically partial, although complete responses have been reported [2]. Immunotherapy provides a valuable treatment modality for select patients with late-stage melanoma. At the forefront of this approach to treat melanoma, recombinant human interleukin-2 (rhIL-2) is approved by the US-FDA to treat stage IV disease and elicits a response in 10–15% of patients. Remarkably, ≈5% of the patients with widely metastatic melanoma treated with high-dose rhIL-2 undergo a complete clinical response with the disappearance of widespread disease that is durable [3–5].
Despite intensive research efforts, no accurate biomarkers have been validated to predict the patients likely to respond to rhIL-2 treatment. For melanoma, and other solid tumors, the extent of tumor invasion by tumor-infiltrating lymphocytes (TILs) is thought to correlate with outcome [6]. However, the composition of TILs is heterogeneous, and the function of tumor-specific CD8 + cytotoxic T lymphocytes (CTLs) may be compromised as a result of accumulation of immunoregulatory cells and immune escape mechanisms [7]. Interleukin-2 receptors are expressed on both effector and regulatory cells, and IL-2 is reported to enhance effector as well as regulatory function [8]. These findings are in contrast to the earlier paradigm that postulated IL-2 specifically enhances antitumor immune surveillance and elimination by promoting T, B, and NK cell growth and effector differentiation [9].
In addition, recent studies report polyclonal activation of human CD8 CTLs in vitro, in the presence of rhIL-2, induces Forkhead box P3 (Foxp3) transcription factor expression [10]. In healthy individuals, circulating Foxp3-expressing CD8 (CD8 Foxp3+) lymphocytes represent a relatively small fraction (<1%) of peripheral T cells. In contrast, melanoma patients exhibit significant increases in their CD8 Foxp3+ T cell population [11], an incremental increase being reported in melanoma patients undergoing rhIL-2 immunotherapy [10]. While Foxp3 expression by T cells is induced upon activation, this transcription factor is a lineage marker for regulatory T cells [12]. Frameshift mutations of Foxp3 lead to multiple autoimmune conditions in human (immunodysregulation, polyendocrinopathy, enteropathy, X-linked-IPEX) [13] or animal models (scurfy phenotype in mice) [14].
In this study, we hypothesized that changes in CD8 Foxp3+ prevalence prior to, and after, treatment with rhIL-2 may predict responsiveness to immunotherapy. To test this hypothesis, we first characterized the phenotype and the distribution of Foxp3-expressing CD8 T cells in immunocompetent C57BL/6 mice. Changes in CD8 Foxp3+ T cell prevalence were evaluated in 6 models of subcutaneous tumor-bearing mice treated with rhIL-2, of which 5 were established melanoma cell lines (B16-F1, B16-BL6, B16-F10, JB/MS, and JB/RH), and one was a fibroblastic sarcoma (MCA-205). Using this approach, we report CD8 Foxp3+ T cells are a rare (<1% total lymphocytes) but naturally occurring cell subset, preferentially located in the axillary and brachial lymph nodes (AB.LNs). CD8 Foxp3+ T lymphocytes are distinct from their CD8 Foxp3− counterparts due to a concomitant expression of both activated T cell markers (CD25+, CD28lo, CD44+) and immunosuppressive markers (CTLA-4+, PD1lo, NKAG2A+/var). The uneven distribution of CD8 Foxp3+ T cells in homeostatic mice also correlates with constitutive expression of skin-homing receptors and integrin expression (e.g., CCR4, CCR10, CXCR3, and CD103). Screening 5 models of subcutaneous melanoma as well as one model of fibrosarcoma for IL-2 responsiveness, we demonstrate 4 models respond to rhIL-2 treatment (B16-F1, B16-BL6, JB/MS, and MCA-205), while JB/RH and B16-F10 were unresponsive. Furthermore, CD8 Foxp3+ T cells dramatically expand exclusively in JB/RH and B16-F10 melanoma-bearing animals undergoing rhIL-2 treatment, while no significant change in CD8 Foxp3+ T cell expansion occurred in the other (rhIL-2-responsive) tumor models.
Materials and methods
Animals
C57BL/6 WT (B6) mice and B6.Cg.Foxp3Tm2tch/J (B6 Fox3-GFP) breeding animals were purchased from Jackson Laboratory (Bar Harbor, ME). Female mice (8–10 weeks) were used, and the Institutional Animal Care and Use Committee approved all studies.
Materials
B16-F1, B16-BL6, and B16-F10, spontaneous, melanoma cell lines [15, 16] were purchased from the NCI-Frederick tumor repository (Frederick, MD). JB/MS and JB/RH, DMBA-induced, melanoma cell lines [17] were a generous gift from Dr. E. Celis (H. Lee Moffitt Cancer Center, Tampa, FL). The MCA-induced fibroblastic sarcoma cell line, MCA-205 [18], was generously provided by Dr. A. Chang (University of Michigan, Ann Arbor, MI). RPMI 1640 medium and phosphate buffered saline (PBS) were purchased from Mediatech (Manassas, VA). l-Glutamine, peni-streptomycin, and 0.1% trypsin/EDTA were purchased from Life Technologies (Rockville, MA). Nonessential amino acids, 4-(2-hydroxyethyl)-1-piperazineethanesulfonic acid (HEPES), sodium pyruvate, 2-β mercaptoethanol (βME), sodium azide, red blood cell (RBC) lysis buffer, and Ficoll-Histopaque 1077 were purchased from Sigma–Aldrich (St. Louis, MO). Fetal bovine serum (FBS) was purchased from Thermo Scientific (Waltham, MA). Highly purified rhIL-2 (lot LQP-046) was a gift from Chiron Corp. (Emeryville, CA).
Tumor cell lines and establishment of skin tumor models in vivo
All cell lines were cultured in RPMI 1640 (with l-Glutamine) supplemented with 10% (v/v) FBS, 1% (v/v) nonessential amino acids, 1 mM sodium pyruvate, penicillin [100 units/ml], and streptomycin [50 μg/ml] (37°C, 5%/95% CO2/air, humidified incubator). For the MCA-205 cell line only, culture medium also contained 50 μM βME. Subcultures were obtained by detachment (trypsin/EDTA) and reseeding at a ratio of 1:100, with the exception of the MCA-205 cell line that was reseeded at a 1:5 ratio. Additionally, MCA-205 cells were maintained by inoculation (s.q.) in B6 mice and reculture (3–5 days) prior to use.
To establish tumors in vivo, B6 Foxp3-GFP animals were injected with 2 × 10⁵ melanoma (B16-F1, B16-BL6, B16-F10, JB/MS, JB/RH) or fibrosarcoma (MCA-205) cells (s.q.). Two weeks later, animals were euthanized by cervical dislocation and single leukocyte suspensions prepared for analysis. Tumor volume (V) was calculated using the equation for typical ellipsoid volume [V = π/6 × (length) × (width) × (height)].
Murine rhIL-2 treatment
Lyophilized rhIL-2 (specific activity 1.8 × 10⁶ International Units/mg) was reconstituted in 1.8 ml distilled water and diluted with PBS containing 0.1% (w/v) BSA to obtain a final concentration of 5,000 or 50,000 units/200 μl (volume of injection). Mice were injected (s.q.) twice daily with rhIL-2 at 8 h intervals for 5 consecutive days. One week after commencing rhIL-2 injections (2 days after the last injection), animals were euthanized by cervical dislocation and single leukocyte suspensions prepared for analysis.
Preparation of single leukocyte suspensions
Spleen, axillary (A. LNs) and brachial lymph nodes (B.LNs) were resected and disrupted in culture medium through a 70-μm nylon cell strainer using a 3-ml syringe plunger. Splenocyte suspensions, or pooled suspensions obtained from A. LNs and B.LNs (AB.LNs), were washed with RPMI 1640 culture medium and centrifuged (200×g, 7 min, 25°C). Red blood cell (RBC) lysis buffer was employed to remove any remaining RBCs as per the manufacturer’s protocol. Cells were then washed (×2) in RPMI 1640 culture medium prior to analysis.
For circulating leukocyte analysis, blood was collected by submandibular bleeding and mixed immediately with heparin (1,000 U/ml). Peripheral blood mononuclear cells (PBMCs) were enriched by Ficoll-Histopaque 1077 density-gradient centrifugation as per the manufacturer’s protocol and washed twice in RPMI culture medium prior to analysis.
Staining for flow cytometry analysis and gating strategy
Leukocytes (1.5 × 10⁶) were suspended in 50 μl staining buffer (PBS without Ca2+/Mg2+, 0.5% (w/v) BSA, 1 mM sodium azide) and incubated for 20 min at 4°C with 1:100 blocking CD16/CD32 (FCγ III/II Receptor) antibodies (BD Bioscience, San Jose, CA). Samples were then incubated with surface staining antibodies for 20 min in the dark (4°C) prior to washing with staining buffer (×2).
To determine frequency and phenotype of CD8 Foxp3+ T cells, flow cytometry analysis was performed using the following antibodies and their appropriate isotype controls: anti-CD5, anti-CD8, and anti-Foxp3 (or Foxp3-GFP mice) for initial gating; anti-CD4, anti-CD25, anti-CD28, and anti-CD44 to investigate activation state; anti-CTLA-4, anti-NKG2A, and anti-PD-1 to investigate immunosuppressive phenotype; anti-CCR4, anti-CCR10, anti-CXCR3, and anti-CD103 to investigate homing pattern. (Table 1, Supplemental Data).
Intranuclear Foxp3 staining was performed using a FITC anti-mouse/rat Foxp3 kit as per the manufacturer’s instructions (eBioscience, San Diego, CA). Phenotypic analysis of CD8 Foxp3+ T cells was measured using a FACS Calibur (Becton–Dickinson, Franklin Lakes, NJ), and data analysis performed using FlowJo 8.8.4 software (Treestar, Ashland, OR). Positive events were gated based on data obtained with a FITC rat IgG2a isotype control. Spleen lymphocyte analysis was performed individually, while PBMC and AB.LN lymphocytes were pooled from 2 mice prior to analysis.
Statistical analysis
Results are expressed as mean ± SEM. Paired t test was used to compare the results from normal versus tumor-bearing animals or treated versus untreated animals. Statistical analyses were performed using Prism5 software (Graphpad Software Inc., La Jolla, CA). P < 0.05 was considered significant.
Results
CD8 Foxp3+ T lymphocytes are preferentially located in skin-draining lymph nodes
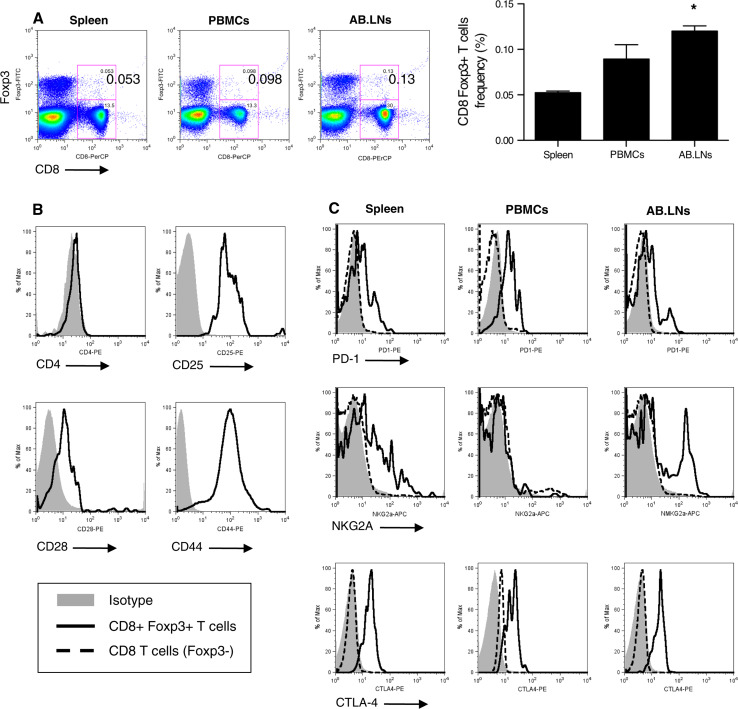
Single cell suspensions were prepared from primary or secondary lymphoid organs [spleen, axillary, and brachial lymph nodes (AB.LNs), and peripheral blood mononuclear cells (PBMCs)] harvested from C57BL/6 wild-type (B6 WT) mice. Foxp3-expressing CD8 T cell (CD8 Foxp3+ T cell) prevalence among total T lymphocytes (CD5+ cells) was then measured by flow cytometry. Using this approach, we demonstrated Foxp3-expressing CD8 T cells (CD8 Foxp3+ T cells) were a rare but naturally occurring cell subset in homeostatic B6 WT mice (Fig. 1a). Distribution analysis of CD8 Foxp3+ T cells in B6 WT mice (or Foxp3-GFP mice, data not shown) demonstrated prevalence of this cell subset was significantly higher in lymphocytes isolated from AB.LNs than splenocytes (0.120 ± 0.017% [of total lymphocytes] versus 0.052% ± 0.004%, respectively, n = 9 independent experiments, P < 0.05, Fig. 1a).
Fig. 1.
Murine Foxp3-expressing CD8 T cells are distinct from their Foxp3− counterparts and unevenly distributed in homeostatic animals. a Representative flow cytometry analysis of CD8 Foxp3+ T lymphocyte distribution in lymphocyte populations isolated from spleen, peripheral blood mononuclear cells (PBMCs), and axillary-brachial lymph nodes (AB.LNs) (left panels). Cumulative analysis is expressed as the percentage of total lymphocytes (right panel). *P < 0.05 versus splenocytes. b Representative flow cytometry analysis of CD8 Foxp3+ T lymphocytes (solid histogram) “activated phenotype” using antibodies against CD4 and activation markers (CD25, CD28, CD44). c Representative flow cytometry analysis of CD8+ Foxp3+ T cells (solid histogram) and Foxp3− counterpart (dashed histogram), “immunosuppressive phenotype” in splenic lymphocytes using antibodies against PD-1, NKG2A, and CTLA-4
CD8 Foxp3+ T cells share the expression of activation markers and immunosuppressive receptors
To discriminate CD8 Foxp3+ T cells from CD4 regulatory T cells (CD4+, Foxp3+, CD25+) or suppressor T cells (Ts cells; CD8+, CD28−, Foxp3var), splenocytes from B6 WT mice were stained with anti-CD4 and anti-CD28 antibodies. Gated for CD5+ T cells, CD8 Foxp3+ lymphocytes were distinct from Ts cells (CD28+) and existed as a CD8 single positive cell subset (CD4−) (Fig. 1b). Of note, CD8 Foxp3+ lymphocytes also stained positive for T cell activation markers (CD25 and CD44) in homeostatic B6 WT mice (Fig. 1b). These data indicate that CD8 Foxp3+ T cells are an independent cell subset capable of being activated in vivo.
To address whether Foxp3 expression by murine CD8 T cells identifies an independent cell lineage, or merely correlates with an activated state of CD8 T cells, leukocyte preparations from homeostatic B6 WT or Foxp3-GFP mice (spleen, PBMCs, and AB.LNs) were analyzed by flow cytometry for immunosuppressive marker expression: cytotoxic T lymphocyte antigen-4 (CTLA-4), natural killer G2A (NKG2A), and programmed death-1 (PD-1) receptor (Fig. 1c). Unlike their Foxp3− counterparts, CD8 Foxp3+ T lymphocytes were CTLA-4+, NKG2A+/var, and PD-1lo/var (Fig. 1c).
rhIL-2 stimulates CD8 Foxp3 T cell expansion in the periphery
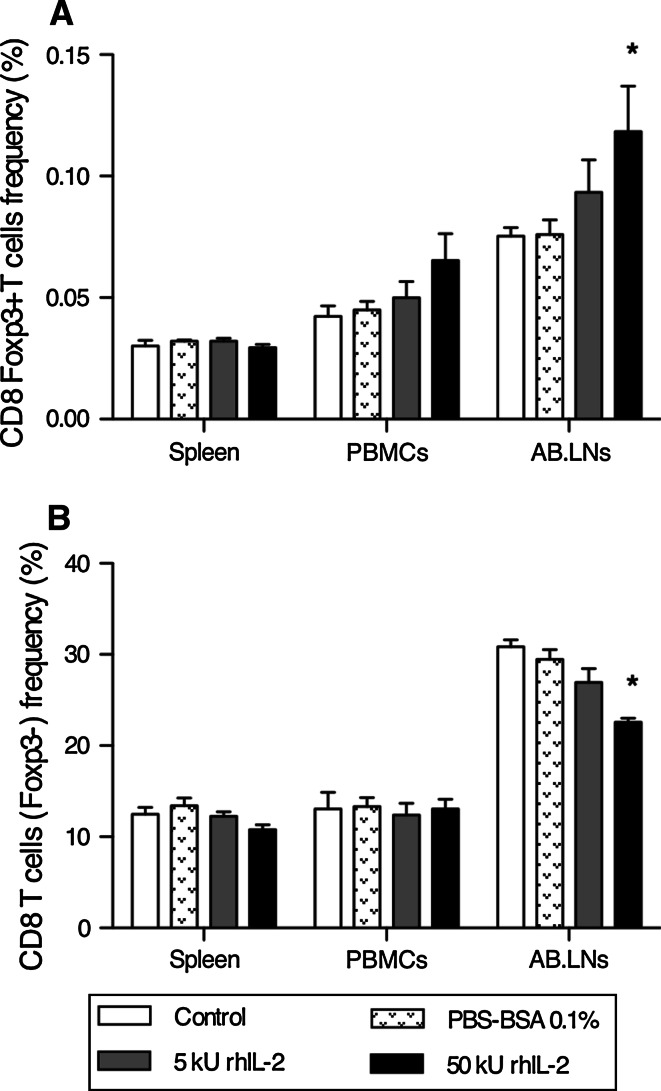
C57BL/6 Foxp3-GFP (B6 Foxp3-GFP) mice were injected twice daily (s.q.) with low- (5,000 Units) or high- (50,000 Units) dose rhIL-2 for 5 consecutive days. One week after commencing rhIL-2 treatment, CD8 Foxp3+ T cell prevalence among lymphocytes (CD5+) was analyzed by flow cytometry. No significant changes were noted systemically (Spleen and PBMCs) in response to rhIL-2 (Fig. 2). However, rhIL-2 triggered a minor, but dose-dependant, increase in CD8 Foxp3+ T lymphocyte prevalence in AB.LN lymphocytes associated with a lower frequency of CD8 T cells (Foxp3−) (Fig. 2).
Fig. 2.
High-dose rhIL-2 significantly expands CD8 Foxp3+ T cells among skin-draining lymph nodes of tumor-free mice. a Cumulative analysis of CD8 Foxp3+ T cell frequency in lymphocytes isolated from spleen, PBMCs, and AB.LNs from control (untreated), drug vehicle (PBS + 0.1% (w/v) BSA), low-dose rhIL-2 (5,000 U) and high-dose rhIL-2 (50,000 U)-treated C57BL/6 mice. Data are expressed as mean percentage CD8 Foxp3+ T lymphocytes relative to total lymphocyte population ± SE. *P < 0.05 versus control (untreated) for site of lymphocyte origin. b Cumulative analysis of CD8 T lymphocytes (Foxp3−) frequency among lymphocytes isolated from spleen, PBMCs, and AB.LNs from control, drug vehicle, low-dose rhIL-2 (5,000 U) and high-dose rhIL-2 (50,000 U)-treated C57BL/6 mice. Data are expressed as mean percentage CD8 T cells relative to total lymphocyte population ± SEM. *P < 0.05 versus control (untreated) for site of lymphocyte origin
CD8 Foxp3+ T cell distribution is not altered in the presence of subcutaneous tumors
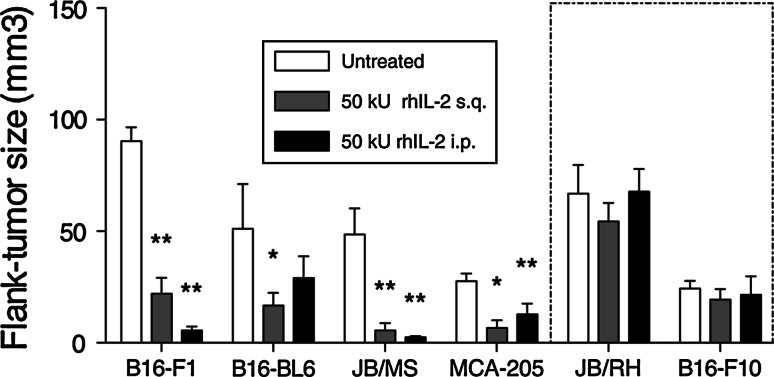
Preferential CD8 Foxp3 T cell localization to AB.LNs, along with significant expansion following rhIL-2 treatment, led us to consider whether this cell subset could act as a putative marker to predict tumor responsiveness to rhIL-2. To address this, 5 murine melanoma cell lines sharing an H-2b haplotype were tested for IL-2 responsiveness (B16-F1, B16-BL6, B16-F10, JB/MS, and JB/RH) in conjunction with the MCA-induced fibroblastic sarcoma MCA-205 [16–18]. B6 Foxp3-GFP mice were inoculated with melanoma or MCA-205 cells (s.q.) and treated 7 days later with high-dose rhIL-2 (50,000 Units, either i.p. or s.q. twice daily for 5 days). The response to rhIL-2 was quantified by measuring tumor size 2 weeks post-tumor inoculation. Using this approach, B16-F10 and JB/RH tumor growth was not significantly affected by rhIL-2 (Fig. 3). Conversely, MCA205 and B16-BL6 tumor volumes were reduced by a factor of 4.13 ± 2.09 and 3.06 ± 1.05, respectively, following s.q. rhIL-2 injection. Of note, while i.p. treatment led to similar trends in tumor volume reduction for MCA205 and B16-BL6 cell lines, these changes in tumor volumes were not statistically significant (Fig. 3). Finally, B16-F1 and JB/MS tumors showed a dramatic response to rhIL-2 regardless of the route of rhIL-2 administration (Fig. 3).
Fig. 3.
JB/RH and B16-F10 melanoma growth is not affected by high-dose rhIL-2 treatment. Tumor volume of B16-F1, B16-BL6, JB/MS, JB/RH, B16-F10 subcutaneous melanoma, and MCA-205 subcutaneous fibrosacroma-bearing mice 2 weeks after cell inoculation and 1 week after high-dose rhIL-2 (50,000 U) treatment. Data are expressed as mean tumor volume ± SEM. n = 3 independent experiments, *P < 0.05 versus untreated tumor size, **P < 0.01 versus untreated tumor size. rhIL-2 non-responsive tumors (JB/RH and B16-F10) boxed
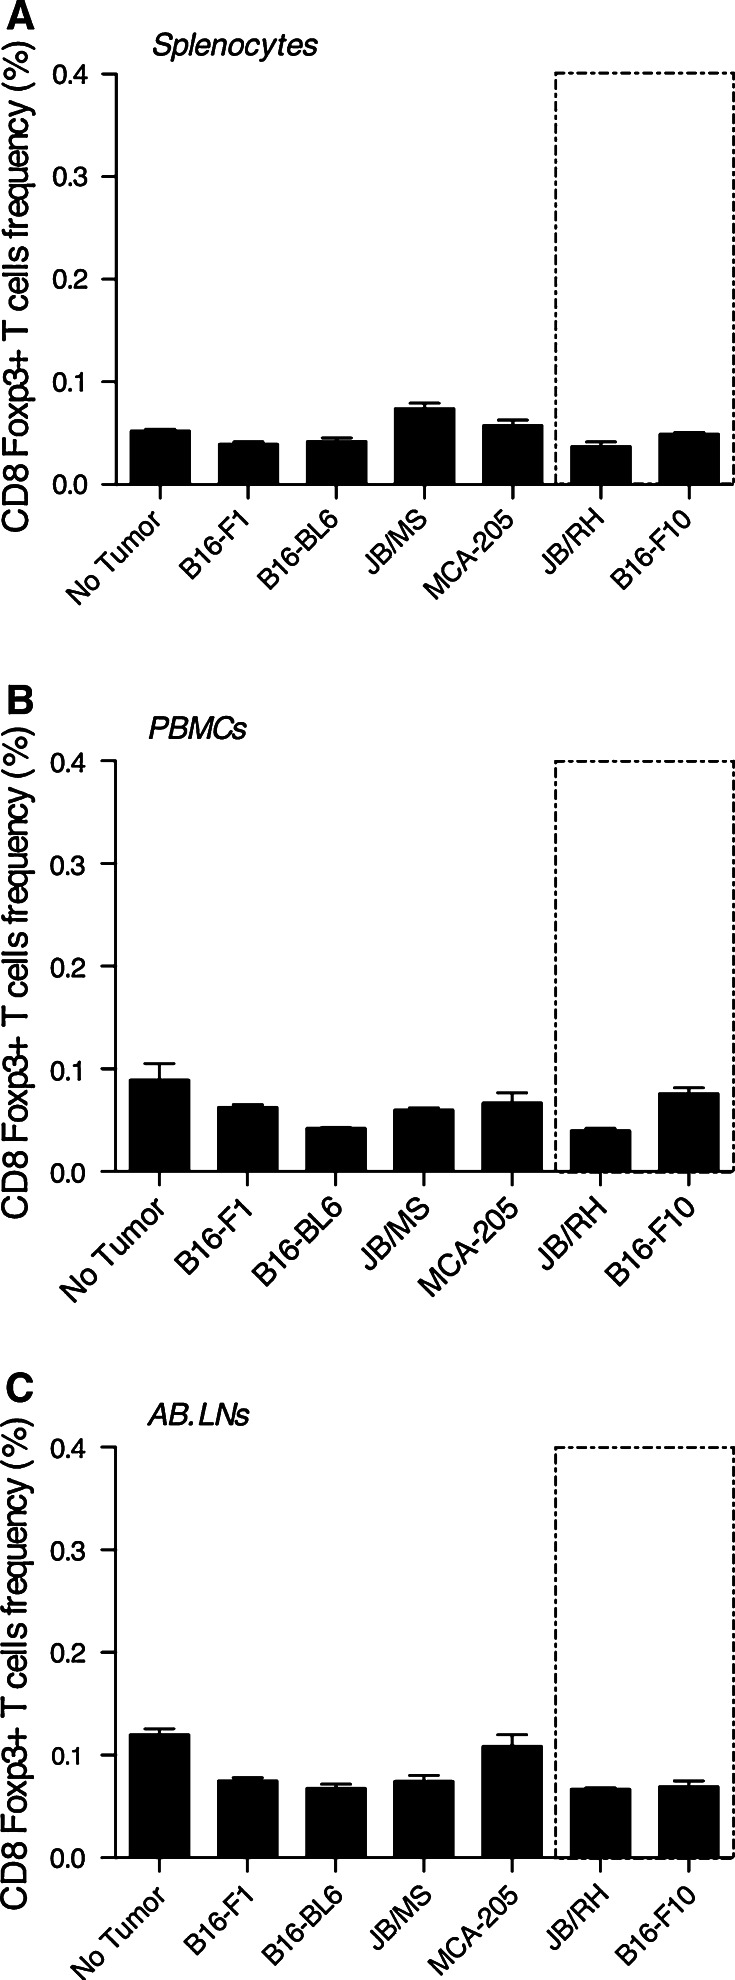
Murine melanoma and MCA-205 fibroblastic sarcoma were injected subcutaneously, and CD8 Foxp3+ T cell frequency among splenocytes, PBMCs, and AB.LNs lymphocytes (CD5+) measured 2 weeks post-tumor challenge. Regardless of spontaneous versus chemically induced, immunogenicity, origin (melanoma or fibrosarcoma), or tumor sensitivity to rhIL-2, no significant differences in Foxp3-expressing CD8 T cell prevalence or distribution between tumor-free and subcutaneous tumor-bearing mice were observed (Fig. 4).
Fig. 4.
CD8 Foxp3+ T cells are preferentially located within AB.LNs independently of tumor growth. Cumulative analysis of CD8 Foxp3+ T lymphocytes frequency in lymphocytes isolated from (a) spleen, (b) peripheral blood mononuclear cells (PBMCs), and (c) axillary-brachial lymph nodes (AB.LNs) from control (no tumor), subcutaneous melanoma (B16-F1, B16BL-6, JB/MS, JB/RH, B16-F10), and subcutaneous fibrosacroma (MCA-205)-bearing C57BL/6 mice. Data are expressed as mean percentage CD8 Foxp3+ T cells relative to total lymphocyte population ± SEM
rhIL-2 triggers systemic CD8 Foxp3+ T cell expansion exclusively in tumor models unresponsive to rhIL-2 therapy
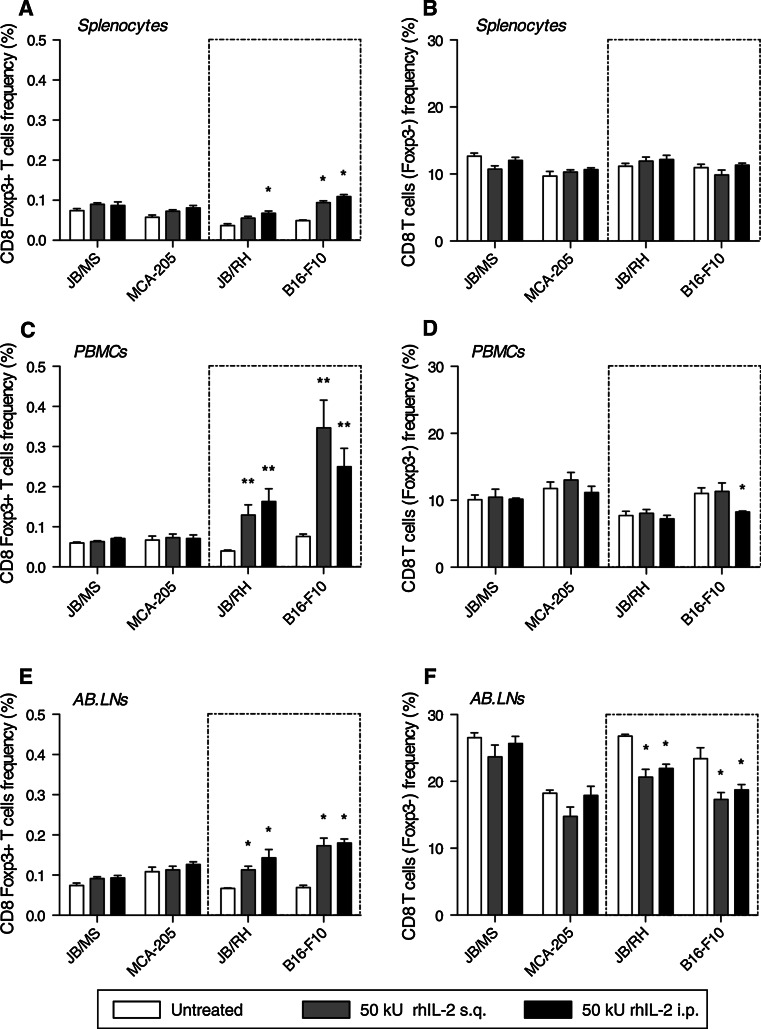
To address whether CD8 Foxp3+ T lymphocytes can represent an early marker of rhIL-2 responsiveness, the immune status of melanoma or MCA-205 tumor-bearing mice was compared. B6 Foxp3-GFP mice were inoculated subcutaneously with melanoma or MCA-205 cells and one week later treated with 50,000 Units rhIL-2 for 5 days as previously described. Two weeks post-tumor challenge, we analyzed the prevalence of CD8 T cell subsets (Foxp3±) both within the periphery (splenocytes and PBMCs) and locally (AB.LNs). Using this approach, JB/MS and MCA-205 tumor-bearing mice showed no significant changes in prevalence in either of the CD8 T cell subsets (Fig. 5). In parallel, similar observations were made with the two other rhIL-2 “responder” models: B16-F1 and B16-BL6 (Figure S1, Supplemental material). In contrast, in B16-F10 and JB/RH tumor-bearing mice, Foxp3-expressing CD8 T cells expanded in each of the three immune compartments analyzed following rhIL-2 treatment (Fig. 5). Depending on the route of rhIL-2 injection, the range of CD8 Foxp3+ T cell expansion was 1.5–2.5 fold among splenocytes (Fig. 5a), although compared with the total population, relative prevalence remained comparatively low (≈0.1%) in this immune compartment. Strikingly, circulating CD8 Foxp3+ T cells expanded three to five-fold in response to rhIL-2 compared with basal (untreated) levels, ultimately accounting for as much as 0.2 and 0.45% of total lymphocytes in JB/RH and B16-F10 tumor-bearing mice, respectively (Fig. 5c). Finally among AB.LNs, CD8 Foxp3+ T cell expansion ranged from two to three-fold, accounting for up to 0.2% of total lymphocytes in this compartment (Fig. 5e). This trend was associated with a ≈20% decrease in the prevalence of the CD8 Foxp3− counterpart (Fig. 5f).
Fig. 5.
rhIL-2 therapy triggers systemic and local expansion of CD8 Foxp3+ T cells exclusively in melanoma models unresponsive to the treatment. Cumulative analysis of CD8 Foxp3+ T cells (a, c, e; e.g., left panel) and their Foxp3− counterpart (b, d, f; e.g., right panel) frequencies among lymphocytes isolated from spleen, peripheral blood mononuclear cells (PBMCs), and axillary-brachial lymph nodes (AB.LNs) from JB/MS, MCA-205, JB/RH, and B16-F10 tumor-bearing C57BL/6 mice treated with high-dose rhIL-2 (50,000 U) s.q. or i.p. Data are expressed as mean percentage CD8 Foxp3+ T cells (or Foxp3−) relative to total lymphocyte population ± SEM. n = 6 independent experiments, *P < 0.05 versus no treatment, **P < 0.01 versus no treatment
The distinct CD8 Foxp3+ T cell phenotype is conserved upon rhIL-2 treatment
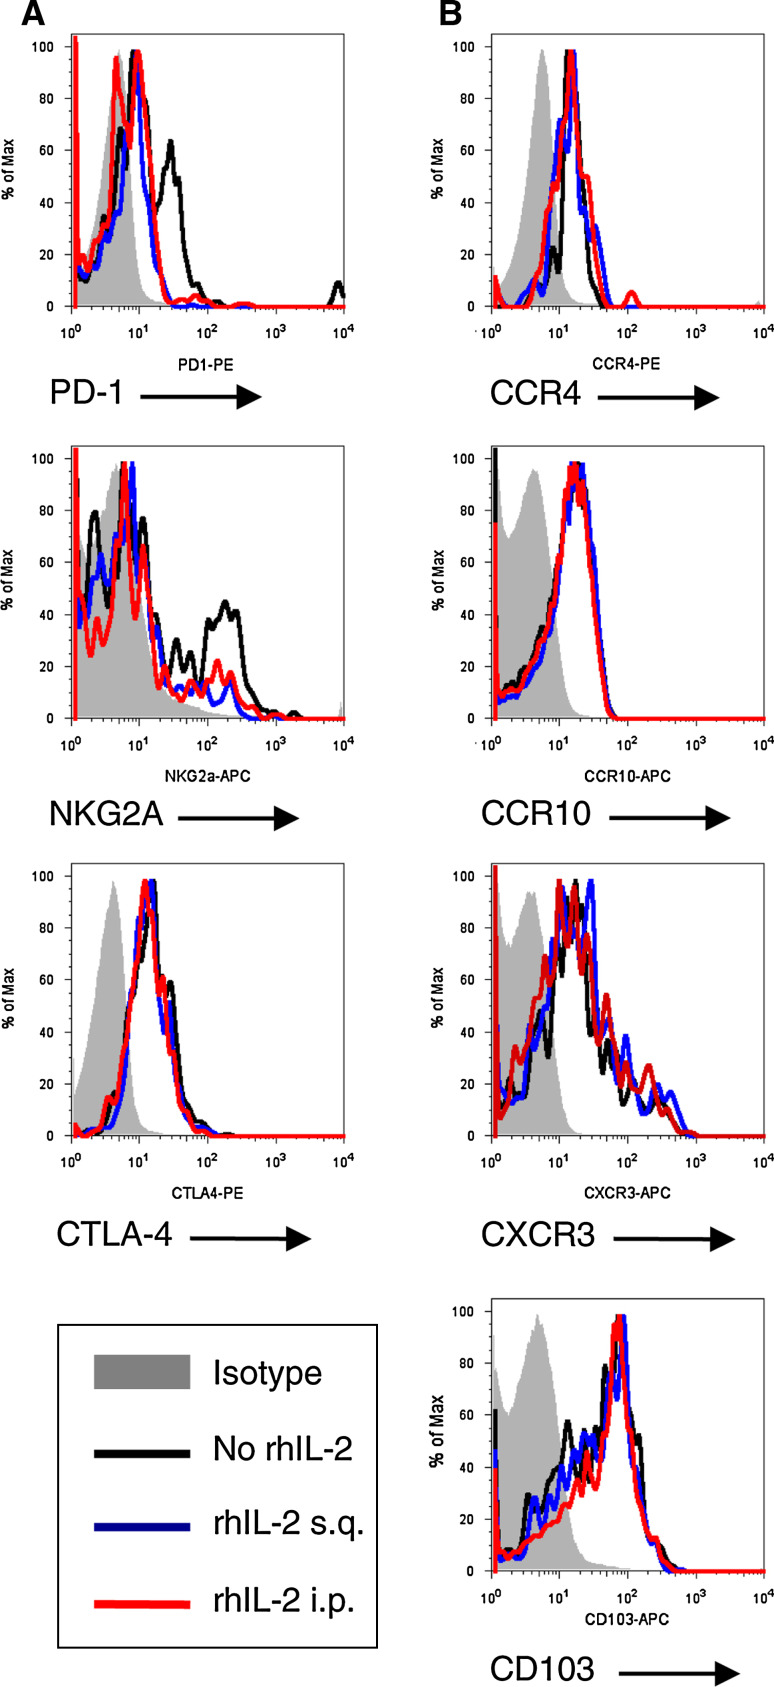
Finally, we sought to address whether heterogeneous Foxp3-expressing CD8 T cell distribution, in homeostatic and tumor-bearing animals, exhibit inherent ability to preferentially traffic to the skin. Circulating CD8 Foxp3+ T lymphocytes from melanoma (JB/MS, JB/RH, B16-F10) and MCA-205 fibrosarcoma tumor-bearing mice (B6 Foxp3-GFP) were analyzed for skin-homing marker expression. CD8 Foxp3+ T cells expressed CCR4 and CCR10 (CCL28 agonists), CXCR3 (CXCL9 agonist), and integrin CD103 (E-cadherin agonist) (Fig. 6a and data not shown). Furthermore, rhIL-2 treatment did not significantly alter chemokine-receptor/integrin expression patterns of CD8 Foxp3+ T cells (Fig. 6a and data not shown).
Fig. 6.
CD8 Foxp3+ T lymphocytes constitutively express immunosuppressive markers, skin-homing chemokine receptors, and integrin. a Representative flow cytometry analysis demonstrating CD8 + Foxp3+ T lymphocytes constitutively express immunosuppressive markers. Lymphocytes were isolated from spleen, peripheral blood mononuclear cells (PBMCs), and axillary-brachial lymph nodes (AB.LNs) from B16-F10 tumor-bearing C57BL/6 mice treated with high-dose rhIL-2 (50,000 U) s.q. or i.p. Cells were stained for CD8, Foxp3 and PD-1, NKG2A, CTLA-4 expression. b Representative flow cytometry analysis demonstrating CD8 + Foxp3+ T lymphocyte constitutive expression of skin-homing chemokine receptors and integrin. Lymphocytes were isolated from spleen, PBMCs, and AB.LNs from B16-F10 tumor-bearing C57BL/6 mice treated with high-dose rhIL-2 (50,000 U) s.q. or i.p. Cells were stained for CCR4, CCR10 CXCR3, or CD103 expression
To address whether CD8 Foxp3+ T cells conserve their immunosuppressive phenotype following rhIL-2 therapy in our model, immunosuppressive markers (CTLA-4, NKG2A, PD-1) were analyzed in single cell suspensions from PBMCs isolated from B6 Foxp3-GFP mice bearing JB/MS, JB/RH, B16-F10, or MCA-205 tumors. Using this approach, we demonstrated CD8 Foxp3 T lymphocytes exhibit conserved immunosuppressive receptor expression in response to rhIL-2 (Fig. 6b and data not shown).
Discussion
In this study, we describe the phenotype and the distribution of Foxp3-expressing CD8 T cells in immunocompetent mice. CD8 Foxp3+ T cells were found in homeostatic animals with preferential localization in the AB.LNs. Compared with healthy donors, blood samples from melanoma patients have a significantly higher percentage of homeostatic T cells such as T suppressor (Ts) (CD8+ CD28−) [19] and T regulatory cells (Treg) (CD4+ CD25high Foxp3+) [12]. Despite a low representation among total murine lymphocytes (<1%), in all 6 models of subcutaneous tumor growth employed (B16-F1, B16-BL6, B16-F10, JB/MS, JB/RH, and MCA-205), distribution and prevalence of CD8 Foxp3+ T cells are similar to that of the healthy animals, suggesting this cell subset may not be related to conventional Treg or Ts cell subsets. While Foxp3 expression by CD4 T cells has been associated with an immunoregulatory phenotype [12], a growing body of evidence indicates that Th cells initiate Foxp3 expression upon activation [20]. While our data demonstrated an activated phenotype for CD8 Foxp3 + cells (CD25+ and CD44+), this cell subset also harbored a constitutive expression of immunosuppressive markers (CTLA-4+, NKG2A+/var and PD-1lo/var). This finding correlates with the data reported by Mayer et al. employing a DEREG × Rag1−/− × OTI mouse model in which the natural occurrence of Foxp3-expressing CD8 T cells increases ≈ten-fold compared with wild type [21]. Furthermore, naturally occurring and TGF-β/RA/OVA257-264-induced CD8 Foxp3+ T cells are reported to express classical ‘Treg’ markers including CD25, CTLA-4, GITR, and CD103 [21]. Taken together, the unique phenotype of CD8 Foxp3+ T cells and their natural occurrence concomitantly with CD8 T cells (Foxp3−) in homeostatic animals suggests Foxp3 expression by CD8 T cells in our models is the hallmark of an independent cell subset.
Clinical studies demonstrate that rhIL-2 triggers circulating CD8 Foxp3+ T cell expansion in melanoma patients [10]. Our study shows that Foxp3-expressing CD8 T cells constitutively express the IL-2 receptor α-subunit (CD25) that has been associated with memory CD8 T cell phenotype [22]. In vivo treatment with rhIL-2, in the absence of exogenous antigen stimulation, led to significant dose-dependent CD8 Foxp3+ T cell expansion combined with increased CD44 expression (data not shown), ruling out the memory function of CD8 Foxp3+ T cells. Further characterization of CD8 Foxp3+ T cell interactions and effects after exposure to rhIL-2 in the subcutaneous melanoma tumor model is currently under investigation.
The origin of CD8 Foxp3+ T cells in our model, as well as specific function, remains to be identified. Despite a natural occurrence, frequency of CD8 Foxp3+ T cells among total lymphocytes was not modified in skin tumor-bearing mice compared with control animals or in rhIL-2 responding (B16-F1, B16-BL6, JB/MS, and MCA-205) versus nonresponding tumor (JB/RH and B16-F10) models. However, in the setting of rhIL-2 treatment, a dramatic systemic increase in CD8 Foxp3+ T cell prevalence occurred, but only in JB/RH and B16-F10 tumor-bearing mice. The correlation observed between non-responsiveness and expansion of CD8 Foxp3+ T cells in our observations might be explained by immunomodulatory mechanisms originating from the tumor. In a similar manner, melanoma growth in patients has been associated with the accumulation of tolerogenic APCs in draining lymph nodes [23]. Similarly, B16-F10 melanoma contributes to the generation of tolerogenic dendritic cells through IDO-dependent mechanisms in a mouse model [24]. While mature dendritic cells actively repress Foxp3 induction in CD8 + T cells in part via CD80/86 costimulation [21], tolerogenic APCs are reported to induce Foxp3 expression by CD8 T cells ex vivo [25].
From a broader perspective, our study indicates that while CD8 Foxp3+ T cell frequency analysis cannot discriminate responding and non-responding tumor types, their expansion correlates with a lack of response to rhIL-2 treatment in vivo as early as one week after commencing rhIL-2 treatment of established subcutaneous tumors. Given the severity and frequency of the side effects experienced by patients undergoing treatment with high-dose rhIl-2, evaluation of early Foxp3-expressing CD8 T cell expansion may serve as a valuable “intermediate point” biomarker to predict responsiveness for patients undergoing rhIL2 therapy. Furthermore, a better understanding of the role and/or origin of Foxp3-expressing CD8 T cells may also provide greater insight into the design and implementation of immunotherapy strategies.
Electronic supplementary material
Below is the link to the electronic supplementary material.
Acknowledgments
This work was supported in part by a grant from The Carolinas Healthcare Foundation (DMF). JB/MS and JB/RH were donated by Dr. Esteban Celis (H. Lee Moffitt Cancer Center, Tampa FL). The MCA-205 cell line was a generous gift from Dr. Alfred Chang (University of Michigan, Ann Arbor, MI). Highly purified rhIL-2 was a gift from Chiron Corporation (Emeryville, CA). We thank Perla Nunes for technical assistance with flow cytometry.
References
- 1.Jemal A, Siegel R, Xu J, Ward E. Cancer statistics, 2010. CA Cancer J Clin. 2010;60:277–300. doi: 10.3322/caac.20073. [DOI] [PubMed] [Google Scholar]
- 2.Yang AS, Chapman PB. The history and future of chemotherapy for melanoma. Hematol Oncol Clin North Am. 2009;23:583–597. doi: 10.1016/j.hoc.2009.03.006. [DOI] [PMC free article] [PubMed] [Google Scholar]
- 3.Atkins MB, Lotze MT, Dutcher JP, Fisher RI, Weiss G, Margolin K, Abrams J, et al. High-dose recombinant interleukin 2 therapy for patients with metastatic melanoma: analysis of 270 patients treated between 1985 and 1993. J Clin Oncol. 1999;17:2105–2116. doi: 10.1200/JCO.1999.17.7.2105. [DOI] [PubMed] [Google Scholar]
- 4.Riker AI, Radfar S, Liu S, Wang Y, Khong HT. Immunotherapy of melanoma: a critical review of current concepts and future strategies. Expert Opin Biol Ther. 2007;7:345–358. doi: 10.1517/14712598.7.3.345. [DOI] [PubMed] [Google Scholar]
- 5.Sparano JA, Fisher RI, Sunderland M, Margolin K, Ernest ML, Sznol M, Atkins MB, et al. Randomized phase III trial of treatment with high-dose interleukin-2 either alone or in combination with interferon alfa-2a in patients with advanced melanoma. J Clin Oncol. 1993;11:1969–1977. doi: 10.1200/JCO.1993.11.10.1969. [DOI] [PubMed] [Google Scholar]
- 6.Taylor RC, Patel A, Panageas KS, Busam KJ, Brady MS. Tumor-infiltrating lymphocytes predict sentinel lymph node positivity in patients with cutaneous melanoma. J Clin Oncol. 2007;25:869–875. doi: 10.1200/JCO.2006.08.9755. [DOI] [PubMed] [Google Scholar]
- 7.Oble DA, Loewe R, Yu P, Mihm MC., Jr Focus on TILs: prognostic significance of tumor infiltrating lymphocytes in human melanoma. Cancer Immun. 2009;9:3. [PMC free article] [PubMed] [Google Scholar]
- 8.Malek TR. The biology of interleukin-2. Annu Rev Immunol. 2008;26:453–479. doi: 10.1146/annurev.immunol.26.021607.090357. [DOI] [PubMed] [Google Scholar]
- 9.Waldmann TA, Dubois S, Tagaya Y. Contrasting roles of IL-2 and IL-15 in the life and death of lymphocytes: implications for immunotherapy. Immunity. 2001;14:105–110. [PubMed] [Google Scholar]
- 10.Ahmadzadeh M, Antony PA, Rosenberg SA. IL-2 and IL-15 each mediate de novo induction of FOXP3 expression in human tumor antigen-specific CD8 T cells. J Immunother. 2007;30:294–302. doi: 10.1097/CJI.0b013e3180336787. [DOI] [PMC free article] [PubMed] [Google Scholar]
- 11.Gavin MA, Torgerson TR, Houston E, DeRoos P, Ho WY, Stray-Pedersen A, Ocheltree EL, et al. Single-cell analysis of normal and FOXP3-mutant human T cells: FOXP3 expression without regulatory T cell development. Proc Natl Acad Sci USA. 2006;103:6659–6664. doi: 10.1073/pnas.0509484103. [DOI] [PMC free article] [PubMed] [Google Scholar]
- 12.Fontenot JD, Gavin MA, Rudensky AY. Foxp3 programs the development and function of CD4 + CD25+ regulatory T cells. Nat Immunol. 2003;4:330–336. doi: 10.1038/ni904. [DOI] [PubMed] [Google Scholar]
- 13.Wildin RS, Smyk-Pearson S, Filipovich AH. Clinical and molecular features of the immuno dysregulation, polyendocrinopathy, enteropathy, X linked (IPEX) syndrome. J Med Genet. 2002;39:537–545. doi: 10.1136/jmg.39.8.537. [DOI] [PMC free article] [PubMed] [Google Scholar]
- 14.Torgerson TR, Ochs HD. Immune dysregulation, polyendocrinopathy, enteropathy, X-linked: forehead box protein 3 mutations and lack of regulatory T cells. J Allergy Clin Immunol. 2007;120:744–750. doi: 10.1016/j.jaci.2007.08.044. [DOI] [PubMed] [Google Scholar]
- 15.Fidler IJ. Selection of successive tumour lines for metastasis. Nat New Biol. 1973;242:148–149. doi: 10.1038/newbio242148a0. [DOI] [PubMed] [Google Scholar]
- 16.Nakayama J, Urabe K, Tsuchida T, Urabe A, Terao H, Taniguchi S, Hori Y. Differential cell- and immuno-biological properties of murine B16-F1 and F10 melanomas: oncogene c-fos expression, sensitivity to LAK cells and/or IL-2, and components of gangliosides. J Dermatol. 1995;22:549–559. doi: 10.1111/j.1346-8138.1995.tb03873.x. [DOI] [PubMed] [Google Scholar]
- 17.Berkelhammer J, Luethans TN, Hook RR, Jr, Oxenhandler RW. Phenotypic instability of mouse melanomas after propagation in vivo and in vitro. Cancer Res. 1986;46:2923–2928. [PubMed] [Google Scholar]
- 18.Rosenberg SA, Schwarz SL, Spiess PJ. Combination immunotherapy for cancer: synergistic antitumor interactions of interleukin-2, alfa interferon, and tumor-infiltrating lymphocytes. J Natl Cancer Inst. 1988;80:1393–1397. doi: 10.1093/jnci/80.17.1393. [DOI] [PubMed] [Google Scholar]
- 19.Cortesini R, LeMaoult J, Ciubotariu R, Cortesini NS. CD8 + CD28- T suppressor cells and the induction of antigen-specific, antigen-presenting cell-mediated suppression of Th reactivity. Immunol Rev. 2001;182:201–206. doi: 10.1034/j.1600-065X.2001.1820116.x. [DOI] [PubMed] [Google Scholar]
- 20.Sauer S, Bruno L, Hertweck A, Finlay D, Leleu M, Spivakov M, Knight ZA, et al. T cell receptor signaling controls Foxp3 expression via PI3K, Akt, and mTOR. Proc Natl Acad Sci USA. 2008;105:7797–7802. doi: 10.1073/pnas.0800928105. [DOI] [PMC free article] [PubMed] [Google Scholar]
- 21.Mayer CT, Floess S, Baru AM, Lahl K, Huehn J, Sparwasser T. CD8 + Foxp3+ T cells share developmental and phenotypic features with classical CD4 + Foxp3 + regulatory T cells but lack potent suppressive activity. Eur J Immunol. 2011;41:716–725. doi: 10.1002/eji.201040913. [DOI] [PubMed] [Google Scholar]
- 22.Dutton RW, Bradley LM, Swain SL. T cell memory. Annu Rev Immunol. 1998;16:201–223. doi: 10.1146/annurev.immunol.16.1.201. [DOI] [PubMed] [Google Scholar]
- 23.Suciu-Foca N, Berloco P, Cortesini R. Tolerogenic dendritic cells in cancer, transplantation, and autoimmune diseases. Hum Immunol. 2009;70:277–280. doi: 10.1016/j.humimm.2009.03.003. [DOI] [PubMed] [Google Scholar]
- 24.Munn DH, Sharma MD, Hou D, Baban B, Lee JR, Antonia SJ, Messina JL, et al. Expression of indoleamine 2,3-dioxygenase by plasmacytoid dendritic cells in tumor-draining lymph nodes. J Clin Invest. 2004;114:280–290. doi: 10.1172/JCI21583. [DOI] [PMC free article] [PubMed] [Google Scholar]
- 25.Faunce DE, Terajewicz A, Stein-Streilein J. Cutting edge: in vitro-generated tolerogenic APC induce CD8 + T regulatory cells that can suppress ongoing experimental autoimmune encephalomyelitis. J Immunol. 2004;172:1991–1995. doi: 10.4049/jimmunol.172.4.1991. [DOI] [PubMed] [Google Scholar]
Associated Data
This section collects any data citations, data availability statements, or supplementary materials included in this article.


