

Abstract
RNA transfection is a standard method to load dendritic cells (DC) with antigen for therapeutic cancer vaccination. While electroporation yields high transfection efficiency and satisfying expression levels, lipofection results in only few cells expressing high amounts of antigen. We compared antigen loading of human monocyte-derived DC by MelanA RNA electroporation and lipofection. No differences in phenotype or migrational capacity were detected, but lipofected DC induced stronger cytokine secretion by antigen-specific T cells and were superior in priming and boosting of MelanA-specific CD8+ T cells. Interestingly, T cells stimulated with the differently transfected DC did not differ in their functional avidity. To determine whether the amount of antigen per cell is indeed responsible for the superiority of the lipofected DC, we increased the amount of MelanA RNA fivefold and mixed those DC with mock-electroporated ones to mimic the antigen distribution of lipofected cells. This significantly improved the stimulatory capacity, indicating that indeed the amount of antigen per cell seems to be the responsible feature for the observed superiority of lipofected DCs. These data suggest that a few DC that express high amounts of antigen are more immunogenic than many DC expressing lower amounts, although this needs to be tested in a two-armed immunogenicity trial.
Electronic supplementary material
The online version of this article (doi:10.1007/s00262-013-1481-z) contains supplementary material, which is available to authorized users.
Keywords: Lipofection , Electroporation, Antigen presentation, Dendritic cells, T cells
Introduction
The primary purpose of therapeutic tumor immunization, i.e., anticancer vaccination, is to overcome the weak and ineffective immune response against the tumor and to induce a robust and long-lasting tumor-specific T-cell response. DC, as nature’s own adjuvant, are the most commonly targeted APC in this field (reviewed in [1]). Apart from in vivo-targeting strategies, DC can be generated from monocytes in sufficient quantities in cell culture and can be loaded with antigen in vitro, before being reapplied into the patient [2]. An elegant way to gain direct access to the cell’s antigen processing and MHC presentation machinery is the expression of Ag as full-length protein within the DC. This allows the generation and presentation of all biologically relevant peptides that can be derived from the protein of interest. To facilitate the presentation of T-cell epitopes, mRNA transfection is now a widely used and valuable strategy [3–6].
Two methods exist that result in relevant transfection efficiencies into DC. Most researchers use electroporation [4, 7–11], but some reports about lipofection with the reagent Transmessenger™ exist as well [12–14]. Both methods result in a different distribution of the mRNA-encoded protein in the transfected cells. While electroporation results in transfection efficiencies of more than 90 % [4, 15], transfection efficiencies of only ~5–50 % are reported for lipofection with Transmessenger [12–14, 16]. Furthermore, murine DC transfected with Transmessenger have displayed higher immunogenicity than electroporated ones in the murine system with a viral antigen in vivo [12]. Considering the quantity of antigen, loaded into DC, several studies have shown that there is a discrepancy between the amount of antigen expressed by the DC or processed for MHC class I presentation and the stimulatory capacity of the DC in vivo; undetectable to low levels of antigen can stimulate effective cytotoxic T lymphocyte (CTL) responses, and increasing the amount of antigen expressed by the DC does not seem to improve their immunostimulatory capacity, at least as measured in short-term in vitro stimulation assays [17–19]. However, in other studies using peptides with an increased MHC-binding capacity (i.e., a higher peptide-MHC complex density and/or a longer peptide presentation), a superior T-cell stimulation capacity was found [20, 21]. This might be due to the fact that most cancer antigens are self-antigens and that tolerance to these antigens needs to be broken [by a high antigen presentation on antigen-presenting cells (APC)] to induce an effective immune response [22]. Moreover, it is argued that a high density of peptide-MHC complexes on the APC surface translates into enhanced T-cell receptor (TCR) signaling, which in turn increases the propensity of the high-avidity T cells to undergo activation-induced cell death (AICD; reviewed in [17]). So another mouse model with HLA-A2 transgenic mice and a human tyrosinase-derived peptide revealed that higher antigen densities on the same number of DC increased the quantity of the primary response, without affecting the avidity, but led to a reduced avidity upon recall [23]. Nevertheless, it has not yet been systematically addressed which role the magnitude of the peptide-MHC complex density on human DC plays during priming and/or boosting of an immune response.
In this study, our aim was to find an optimal antigen presentation density on DC for the priming and boosting of T cells directed against tumor antigens in an autologous human in vitro system. We examined two hypotheses: (1) more antigen presented on the APC surface is leading to a stronger antigen-specific T-cell expansion, and (2) more antigen presented on the APC surface is leading to a deletion of the high-avidity T cells. The first hypothesis was verified while the second was falsified.
Materials and methods
Cells and reagents
Monocyte-derived DC and T cells were prepared from blood or leukapheresis products of healthy donors following informed consent and approval by the institutional review board as described before [4, 24]. CD8+ T cells were isolated from the non-adherent fraction using anti-CD8 MACS beads (Miltenyi, Bergisch Gladbach, Germany), according to the manufacturer’s instructions. The isolated CD8+ T cells were subsequently cultured in T-cell medium consisting of RPMI 1640 (Lonza, Verviers, Belgium), 10 % human serum (Lonza), 2 mM l-glutamine, 20 mg/l gentamycin, 10 mM HEPES (PAA), 1 mM sodium pyruvate (PAA), and 1 % MEM non-essential aa (100x, PAA). Whenever relevant, HLA-A0201+ donor material was used. If required, cells were cryoconserved and thawed when needed as described before [24].
Production of in vitro-transcribed RNA
For in vitro transcriptions, we used the in vitro transcription plasmids pGEM4Z64A-EGFP and pGEM4Z64A-MelanA, encoding the enhanced green fluorescence protein (GFP) and the wild-type MelanA antigen (kindly provided by Dr. Tcherepanova) [25], as well as pGEM4Z64A-JZ-TCRα and pGEM4Z64A-JZ-TCRβ encoding the α- and the β-chain of the TCR, respectively, specific for the MelanA-derived HLA-A2-resticted EAAGIGILTV epitope [26]. All plasmids were linearized with SpeI (NEB, Frankfurt a.M., Germany). In vitro transcription was performed using mMESSAGE mMACHINE T7 ULTRA kits (Life technologies GmbH, Darmstadt, Germany) according to the manufacturer’s instructions.
Transfection and peptide pulsing of DC
For electroporation, DC were washed once in pure RPMI1640 and once in OptiMEM without phenol red (Invitrogen, Karlsruhe, Germany), and then resuspended in OptiMEM at a concentration of no more than 6 × 10⁷ DC/ml. mRNA was placed in a 4-mm electroporation cuvette to a final concentration of 50 μg/ml, and 100 to 600 μl of cell suspension was added. In some experiments (as indicated), 250 μg/ml mRNA was used. DC were shocked with a square wave pulse of 500 V for either 0.5 ms [4] or 1 ms [15] as indicated. Then, the cells were transferred to DC medium with GM-CSF and IL-4 and were rested for 4 h.
Lipofection was carried out using the non-lipid cationic reagent Transmessenger™ transfection kit (Qiagen, Hilden, Germany) following an adapted protocol from Liao et al. [13]. Seventy-five microliter transfection buffer was mixed with 3 μl of enhancer, and 1.5 μg RNA was mixed and pre-incubated for 5 min at room temperature. Then, 9 μl of Transmessenger™ transfection reagent was added, the mix was vortexed 10 s, and incubated for further 10 min. The mix was added to 106 DC that had been washed twice with PBS and resuspended in 375 μl Aim-V (Invitrogen). The preparation was incubated for 45 min at 37 °C and 5 % CO2. DC were then washed twice with RPMI1640, resuspended in DC Medium with GM-CSF and IL-4, and rested for 4 h.
For peptide pulsing, DC were incubated with 10 μg/ml of the MelanA-derived peptide EAAGIGILTV (GenScript, Piscataway, NJ, USA) in DC medium for 1 h.
Cytokine secretion assays with TCR-electroporated CD8+ T cells
Isolated CD8+ T cells were incubated overnight in T-cell medium supplemented with 10 ng/ml IL-7 (Peprotech), washed with RPMI1640 and OptiMEM, and then resuspended in OptiMEM at a concentration of no more than 15 × 106 T cells/ml. mRNA was placed in a 4-mm electroporation cuvette to a final concentration of 150 μg/ml for the α- and 150 μg/ml for the β-chain, and 100–600 μl of cell suspension was added. T cells were electroporated with a square wave pulse of 500 V for 5 ms. Then, the cells were transferred to T-cell medium supplemented with 10 ng/ml IL-7 and rested for 4 h. Then, 50,000 T cells were co-incubated with 50,000 DC that had been transfected as described above. Co-incubation was performed for 16–18 h in 100 μl of T-cell medium. The supernatants were analyzed for cytokines using a TH1/TH2 cytometric bead array (BD) according to the manufacturer’s protocol.
Flow cytometric analysis
The expression of DC surface markers was analyzed with the following antibodies and their respective isotype controls: IgG1-FITC, IgG1-PE, IgG2a-FITC, αCD25-PE, αCD40-PE, αCD70-PE, αCD80-PE, αCD83-PE, αCD83-FITC, αCD86-PE, αHLA I-FITC, αHLA DR-FITC, αOX40L-PE (all from BD), IgG3-PE (eBiosciences, Frankfurt, Germany), and αCCR7-FITC (R&D Systems). Stainings were performed at 4 °C in FACS buffer, consisting of DPBS (Lonza) supplemented with 1 % FCS (PAA Labortechnik) and 0.02 % sodium azide (Merck). Intracellular staining for MelanA was performed after permeabilization of the cells with Cytofix/Cytoperm solutions (BD) according to the manufacturer’s instructions with αMelanA clone A103 (Agilent Technologies, Böblingen, Germany) and goat anti-mouse PE secondary antibody (BD). Antibody-stained and EGFP-expressing DC were analyzed using a FACScan cytofluorometer equipped with CellQuest software (BD Biosciences). To obtain specific MFIs, corresponding background values were subtracted.
Transwell migration assay
Transwell migration assays were performed using transwell inserts (Corning GmbH, Kaiserslautern, Germany) with a pore size of 5 μm, and 100 ng/ml CCL19 (Peprotech) as described previously [4].
Priming and boosting of CD8+ T cells
Antigen-loaded DC were used to stimulate autologous CD8+ T cells at a ratio of 1:10. Fresh T-cell medium was added when necessary, and on day 2 and 4, 1,000 IE/ml IL-2 (Novartis, Nuremberg, Germany) and 10 ng/ml IL-7 were supplemented. On day 7, the CD8+ T cells were re-stimulated with new DC for another 7 days. Up to 2 re-stimulations were performed, and for each weekly stimulation, the fraction of MelanA/HLA-A2-specific CD8+ T cells was determined at day 6 or 7 by staining with a HLA-A2-MelanA/iTAg MHC class I-tetramer (Beckmann Coulter, Krefeld, Germany) and counterstaining with αCD8-PC7 (Beckmann Coulter). Stainings were analyzed using a FC500 cytofluorometer (Beckman Coulter).
ELISPOT-based avidity assays
The functional avidity of the MelanA-specific T cells was determined in an IFNγ-ELISPOT-based titration assay. Anti-IFNγ-coated transparent 96-well ELISPOT plates (Mabtech, Hamburg, Germany) were used according to manufacturer’s instructions. T2-cells were UV irradiated with 5 mJ/cm2 and plated on the ELISPOT plates at a density of 50,000 cells per well in ELI medium consisting of RPMI1640 with 5 % heat-inactivated human serum, 2 mM l-glutamine, 20 mg/l gentamycin, and 10 mM HEPES. The MelanA-derived peptide EAAGIGILTV was added to the indicated final concentrations from 5 μg/ml to 1 ng/ml in dilution steps of one order of magnitude. Then, the expanded T cells (in ELI medium) were added. Equal numbers of MelanA-specific T cells, as estimated by HLA-A2-MelanA-tetramer staining, were added in each experiment, ranging from 200 to 500 per well. Plates were incubated for 18–20 h at 37 °C, 5 % CO2, 95 % humidity. Then, IFNγ spots were stained with the included biotinylated antibody according to the manufacturer’s instructions. Biotin was stained with a Vectastain Elite ABC Kit (Vector Laboratories, Burlingame, CA) according to the manufacturer’s instructions. Alternatively, after removal of the cells, the plates were incubated with 0.3 % H2O2 for 15 min to reduce background, and IFNγ spots were stained with a HRP-conjugated αIFNγ antibody (Mabtech). HRP activity was detected with a substrate solution containing 3-Amino-9-Ethylcarbazole (Sigma-Aldrich). To allow for a combined display of the data of all donors, each data set was normalized to its individual maximum.
Statistical analysis
Statistical analysis was performed using the Graph Pad Prism software. p values were either calculated by paired student’s t test or by the Mann–Whitney U test (***p ≤ 0.001; **p ≤ 0.01; *p ≤ 0.05) depending on whether the measured values followed the Gaussian distribution (tested by Kolmogorov–Smirnov) or not.
Results
Electroporation and lipofection of mRNA result in a different distribution of the mRNA-encoded protein in the transfected cells
Both the mRNA electroporation and the Transmessenger-based lipofection yielded very different efficiencies in the past [12–14, 16, 27]. Therefore, we used both methods to transfect human monocyte-derived mature DC with mRNA encoding either GFP or the tumor antigen MelanA in several independent experiments and determined the resulting antigen expression by flow cytometry. Electroporation with a square wave pulse of 125 V/mm for 0.5 ms [4] resulted in homogenous expression of both GFP and MelanA in almost all cells (Fig. 1a). In contrast, lipofection resulted in very inhomogeneous expression rates with only a fraction of the cells expressing measurable amounts of the encoded proteins, but at comparably high levels (Fig. 1a). Similar results were obtained when a modified electroporation protocol (square wave pulse of 125 V/mm for 1 ms [15]) was used (supplementary figure 1).
Fig. 1.
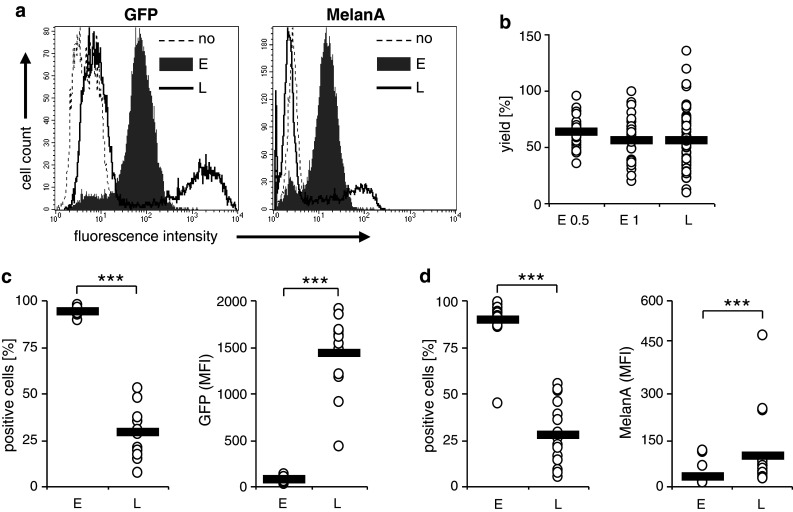
Transfection efficiency of electroporation and lipofection. Cytokine cocktail-matured DC were transfected with either GFP RNA or MelanA RNA by electroporation with a square wave pulse of 125 V/mm for 0.5 ms [E; gray histograms (a); or E 0.5 (b)], with a square wave pulse of 125 V/mm for 1 ms [E 1 (b)], or lipofection with Transmessenger reagent (L; black-rimmed histograms). MelanA and GFP expressions were determined 4 h after transfection by flow cytometry. Histograms representing average donors from 13 (GFP) or 19 (MelanA) experiments are shown (a). The DC yield (in % of input cells) of the different transfection protocols is depicted of all donors (open circles); the black bars indicate the averages (b). The percentages of GFP-positive (c) or MelanA-positive (d) cells and their respective mean fluorescence intensities (MFI) of all donors (open circles) are depicted, and the black bars indicate the averages. (***p < 0.001)
There was a minor difference in DC yield between electroporation with 0.5 ms and with 1 ms, the latter being slightly lower (Fig. 1b), which was, however, not significant (p = 0.15). Furthermore, there was a minor difference in DC yield between electroporation with 0.5 ms and lipofection, which was again not significant (p = 0.175). Additionally, there was virtually no difference in DC yield between electroporation with 1 ms and lipofection (p = 0.98).
Upon repeating the experiment several times with GFP mRNA, we observed an average transfection efficiency of 94.1 and 28.9 % for electroporation and lipofection, respectively (Fig. 1c, left panel). In contrast, the average MFIs were 79.4 and 1,428 for electroporation and lipofection, respectively (Fig. 1c, right panel). In average, the GFP-positive lipofected DC showed a 19.7 times brighter signal than the electroporated ones. Transfection of MelanA RNA yielded very similar results (Fig. 1d). The transfection efficiency was on average 89.3 % for electroporation and 27.8 % for lipofection (Fig. 1d left panel). The MelanA-related MFI was in average 29.3 after electroporation and 98.0 after lipofection. The ratio between MelanA-positive lipofected and electroporated DC was 3.47. Additionally, we observed a strong variation in transfection efficiency upon lipofection, varying from 7.2 to 52.7 % for GFP (Fig. 1c, left panel) and from 5.5 to 55.4 % for MelanA (Fig. 1d, left panel), while electroporation displayed a high reproducibility. In conclusion, lipofection and electroporation result in very similar DC yields but very different antigen distributions: electroporation resulted in a very homogenous distribution and intermediate expression levels, while lipofection caused a very uneven distribution where approximately one-third of the DC expressed low to very high quantities of the antigen, while the other two-thirds expressed MelanA below the detection limit or were not transfected at all.
Both electroporation and lipofection have little influence on the phenotype and migratory capacity of DC
To investigate whether the different transfection procedures induce maturation or other differences in the phenotype of the DC, we examined the surface expression of different maturation markers and co-stimulatory molecules 24 h after transfection with MelanA RNA. As a control, non-transfected DC were used. We observed no significant differences in expression of CD25, CD40, CD80, CD83, CD86, CCR7, and HLA class I and II (Fig. 2a). Since it may be possible that lipofection only changes the phenotype of the successfully transfected DC, we used GFP RNA and compared the GFP-negative and GFP-positive lipofected DC with electroporated and not transfected DC (Fig. 2b) by two-color flow cytometry. We observed no significant differences in the expression of CD70, CD83, CD86, and OX40L (Fig. 2b). Interestingly, there was a significant reduction in CD25 only in the GFP-positive lipofected DC (Fig. 2b). In addition, both methods did not influence the CCR7-mediated migratory capacity of the DC measured in transwell migration assays (Fig. 2c). This indicates that both methods have little or no influence on the DC phenotype.
Fig. 2.
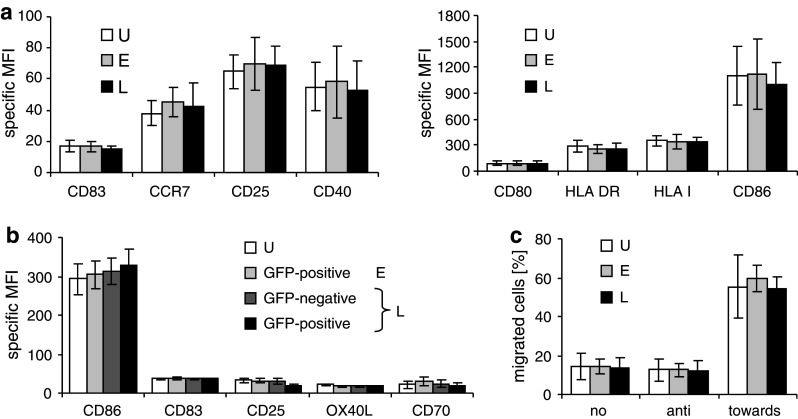
Electroporation and lipofection have little influence on the expression of maturation markers on mature DC. Cytokine cocktail-matured DC were transfected with RNA by electroporation (E; light gray bars) or lipofection (L; black and dark gray bars), or were left untreated (U; white bars). a Twenty-four hours after transfection with MelanA RNA, the surface expression of the indicated maturation markers was determined by flow cytometry. The average of three independent experiments with SEM is shown. b Twenty-four hours after transfection with GFP mRNA, the surface expression of the indicated maturation markers was determined on the GFP-positive electroporated DC (light gray bars) and on both the GFP-negative (dark gray bars) and the GFP-positive (black bars) fraction of the lipofected cells. The average of 6 independent experiments with SEM is shown. c Four hours after transfection, the DC were examined for their capability to migrate towards the chemokine CCL19 in a transwell migration assay. As controls, no chemokine was added (no) or the DC migration away from the cytokine was examined (anti). The percentage of cells that migrated within a 2-h period is depicted. An average of 5 independent experiments with SEM is shown
Lipofected DC induce a higher cytokine production by antigen-specific T cells
Next, we examined whether the differently transfected DC would induce different cytokine production profiles in co-culture with antigen-specific T cells. To this end, we reprogrammed autologous CD8+ T cells by TCR-RNA electroporation. This method generates antigen-specific T cells with a distribution of phenotypes similar to that of peripheral blood T cells of healthy individuals and that do not need to be pre-activated prior to transfection [24]. A MelanA-specific TCR of intermediate affinity was chosen to reprogram bulk CD8+ T cells, and these were co-incubated for 14–18 h with mature MelanA-RNA-electroporated or MelanA-RNA-lipofected DC, and cytokine secretion was determined. Under these conditions, both the electroporated and the lipofected DC induced significantly more IL-2 than DC that were not MelanA transfected (Fig. 3a, left panel). Most importantly, the lipofected DC induced 34 times as much IL-2 as the electroporated ones (1.92 ng/ml vs. 56.5 pg/ml) (Fig. 3a, left panel), indicating a stronger T-cell stimulation capacity of the former. Similar data were obtained for IFN-γ production, although here the induction of cytokine production by MelanA-RNA-electroporated DC was not significantly different from the negative control (Fig. 3a, right panel). It is of note that also IL-10 production by the CD8+ T cells was increased when using lipofected DC in stimulations (Fig. 3a). Moreover, we obtained very similar results when we used the modified electroporation protocol described above (supplementary figure 2a). Since there was little influence of both methods on the DC phenotype and even though we used antigen-specific T cells of a constant quality, we still saw a clear difference in cytokine production profiles; this is a strong indication that indeed the differences in T-cell stimulation capacity are caused by differences in antigen presentation.
Fig. 3.

Lipofected DC stimulate CD8+ T cells more efficiently than electroporated DC. Cytokine cocktail-matured DC were transfected with MelanA RNA by electroporation with a square wave pulse of 125 V/mm for 0.5 ms (E) or lipofection with Transmessenger reagent (L). a Autologous CD8+ T cells were electroporated with RNA encoding a MelanA-specific TCR. Four hours after transfection, the CD8+ T cells and DC were co-cultured at a 1:1 ratio. After 14–18 h, the concentrations of IL-2, IFNγ, and IL-10 in the supernatants were determined. Mock-electroporated and GFP-electroporated DC served as negative controls (N). Values from 9 independent experiments are depicted; the black bars indicate the averages. b and c Four hours after transfection, the DC were used to prime and expand non-electroporated autologous CD8+ T cells. The DC/T-cell ratio was 1:10. GFP-transfected DC, either not loaded or loaded with the MelanA-derived peptide EAAGIGILTV, served as controls. After 6–7 days, a fraction of the cells was taken and stained with MelanA/HLA-A2 tetramers to determine the percentage antigen-specific T cells. A part of the T cells was re-stimulated under similar conditions. The average of 6 independent experiments with SEM is depicted to illustrate statistically significant differences (b). Individual values (open circles) and averages (black bars) from 6, 4, and 3 donors are shown for the first, second, and third stimulation, respectively (c). (ns: p > 0.05, *p ≤ 0.05, **p < 0.01, ***p < 0.001)
Lipofected DC expand autologous antigen-specific CD8+ T cells better than electroporated DC
Since in therapeutic vaccination, the priming and expansion of naive tumor-specific T cells is an important factor, we employed DC, transfected with both methods, in an autologous in vitro stimulation assay. CD8+ T cells were stimulated for 1 week with DC that had been electroporated or lipofected with MelanA-encoding RNA, or as control with GFP-encoding RNA. Then, the MelanA-specific T cells were quantified by MHC tetramer staining (Fig. 3b). As with the induction of cytokine production, the lipofected DC that contained much smaller numbers of antigen-presenting cells, but with a higher antigen expression on a per-cell basis, were significantly better than electroporated DC in the priming and expansion of autologous naïve CD8+ T cells. DC either lipofected or electroporated with GFP RNA, which were exogenously loaded with peptide, in contrast, displayed no difference in stimulation capacity (Fig. 3b). The negative controls, i.e., GFP-RNA-transfected DC, which were not loaded with peptide did not induce expansion of antigen-specific T cells (Fig. 3b). In addition, the CD8+ T cells were re-stimulated with similar DC (Fig. 3c). This led to a further expansion of MelanA-specific T cells by lipofected DC, but not by electroporated or peptide-pulsed ones (Fig. 3c). After a second re-stimulation, we observed that the numbers of MelanA-specific T cells declined in all conditions (Fig. 3c, right panel). Furthermore, we obtained very similar results when we used the alternative electroporation protocol (supplementary figure 2b and c). From this, we conclude that few cells expressing high levels of antigen are better for T-cell priming and boosting than many cells expressing intermediate amounts. Two explanations are possible for the observed differences in the percentages of MelanA-specific T cells after stimulation: the lipofected DC (1) induced a more efficient expansion of antigen-specific T cells or (2) expanded a larger pool of naive T cells. If the latter was true, it could be that T cells of lower avidity are expanded, due to the higher antigen density on the surface of some of the lipofected DC. In addition, high antigen density poses the threat of deletion of the high-avidity T cells by activation-induced cell death (AICD).
T cells expanded by differently transfected DC display similar functional avidities
As mentioned above, high antigen densities always pose the threat of deletion of high-avidity T cells and expansion of those with low avidity. Especially in tumor vaccination strategies, where the induced T cells must function and recognize tumor cells under suboptimal conditions, any bias toward low avidity would be detrimental. Hence, we quantified the functional avidity of the expanded T cells, by performing ELISPOT-based peptide titration assays. Based on MelanA/HLA-A2 tetramer stainings, equal numbers of MelanA-specific T cells were co-cultured with T2 cells loaded with titrated concentrations of the immunodominant MelanA-derived peptide. Data were normalized to individual maximums to allow for better comparison, and the relative number of T cells producing IFNγ in response to each peptide concentration was determined (Fig. 4). Again, both electroporation protocols (1-ms pulse: Fig. 4, 0.5-ms pulse: supplementary Fig. 3) were tested. To our surprise, we observed little difference in the distribution of the functional avidities of the expanded T cells, after priming (Fig. 4a) and virtually none after re-stimulation (Fig. 4b). Upon use of 0.5-ms pulse for electroporation, even a slight inferiority of the T cells that had been stimulated with electroporated DC might be suspected. Furthermore, the titration curves of the controls, i.e., CD8+ T cells stimulated with GFP-transfected DC loaded with MelanA peptide, were also similar (Fig. 4a and b, and supplementary Fig. 3). This indicates that in our test system, neither depletion of high-avidity T cells nor disproportional expansion of low-avidity T cells takes place.
Fig. 4.

Electroporated or lipofected DC expanded CD8+ T cells of similar avidity. Cytokine cocktail-matured DC were transfected with MelanA RNA (MelA; closed symbols) or GFP RNA (GFP; open symbols) by electroporation with a square wave pulse of 125 V/mm for 1 ms (E, diamonds) or lipofection with Transmessenger reagent (L; circles). The GFP-RNA-transfected DC were loaded with the MelanA peptide EAAGIGILTV. Four hours after transfection, autologous CD8+ T cells and DC were co-cultured at a 10:1 ratio. After 7 days, a fraction of the cells was taken and tested for functional avidity in an IFNγ ELISPOT assay (a). The remaining T cells were stimulated a second time with DC, treated as described above. After another 7 days, a second ELISPOT was performed (b). Before the ELISPOT assays were performed, the percentage of MelanA-specific T cells was determined by tetramer staining and equal numbers of antigen-specific T cells were taken from each stimulation condition. These T cells were co-cultivated for 18 h with 50,000 T2 cells loaded with different concentrations of MelanA wild-type peptide (as indicated). Shown are mean values with SEM from 6 and 4 independent experiments for the first and second stimulation, respectively. All values were normalized to the individual maximum of each donor
The stimulation capacity of lipofected DC can be mimicked with electroporated DC
The final question we examined was whether the transfection method by itself did modify the way in which the transfected antigen is presented, or whether the intracellular expression level is solely responsible for the differences in T-cell stimulation capacity. To this end, we raised the MelanA RNA concentration used for electroporation from 50 μg/ml (Fig. 5a; dark gray histogram) to 250 μg/ml (Fig. 5a; light gray histogram) to increase the expression of MelanA. The expression of the MelanA was determined by flow cytometry (Fig. 5a). These DC were then mixed with mock-electroporated DC to image the antigen distribution in lipofected DC. By this means, we generated DC by electroporation with an antigen density and distribution that better resembled that of the lipofected ones, although the high expression levels of lipofection could not be reached (Fig. 5a; black line). These mixed cells are named “lipofection mimic” DC hereafter. These cells were then used to prime and expand autologous CD8+ T cells for 1 week (Fig. 5b). As detected by tetramer staining, the lipofection mimic DC were able to expand antigen-specific T cells significantly better than normal electroporated DC and seemed to be even better that undiluted DC electroporated with 250 μg/ml, although the difference was not significant. Both the 250 μg/ml electroporated and the lipofection mimic cells were still not as potent as lipofected DC, but again the differences were not statistically significant (Fig. 5b). In short-term stimulations, lipofection mimic DC and undiluted 250 μg/ml electroporated DC stimulated CD8+ T cells electroporated with RNA encoding a MelanA-specific TCR to produce IL-2 and IFNγ clearly better than those electroporated under standard conditions, but still significantly less effective than lipofected ones (Fig. 5c). From this, we conclude that the differences in intracellular expression result in the different T-cell stimulation capacities and that in a heterogeneous population, even an excess of cell expressing no antigen has no negative influence on the stimulation capacity.
Fig. 5.

The stimulation capacity of electroporated DC can be improved by mimicking the antigen expression of lipofected DC. Cytokine cocktail-matured DC were transfected with MelanA RNA by lipofection (L; black-rimmed histogram) or electroporation. To raise the expression of MelanA in the electroporated DC, the concentration of mRNA was increased from 50 μg/ml (dark gray histogram to 250 μg/ml (light gray histogram). As negative control, mock-electroporated DC were used (dashed histogram). a MelanA expression was determined 4 h after transfection by flow cytometry. Histograms from one representative experiment out of 6 are shown. b According to the flow cytometry results, mixtures of mock-electroporated DC and DC electroporated with 250 μg/ml RNA were prepared to mimic the lipofected DC considering the percentage MelanA-positive and MelanA-negative cells (mimic). These DC were co-cultured with autologous CD8+ T cells at a 1:10 ratio. For comparison, non-electroporated (0), DC electroporated with 50 μg/ml RNA (50) and with 250 μg/ml (250), and lipofected DC (L) were used for stimulation. After 7 days, the T cells were stained with MelanA/HLA-A2 tetramers to determine the percentage antigen-specific T cells. Individual values (open circles) and averages (black bars) from 6 donors are shown. c In addition, the different DC populations were co-cultured with CD8+ T cells which had been electroporated with RNA encoding a MelanA-specific TCR. After 14–18 h, the concentrations of IL-2 and IFNγ in the supernatants were determined. Mean values with SEM from 6 independent experiments are shown. (*p ≤ 0.05)
Concerning our two hypotheses, we now conclude that (1) more antigen presented on the APC surface is indeed leading to a better antigen-specific T-cell expansion, and (2) more antigen presented on the APC surface does not lead to a deletion of the high-avidity T cells.
Discussion
In anticancer DC vaccination strategies much is done to increase presentation of the tumor antigen on the protein level (reviewed by Boudreau et al. [28]), but the mode of transfection and the immunologic consequences of antigen distribution are rarely addressed. The fear of deleting high-avidity T cells, on the one hand, and the need to break self-tolerance and to reach the immunogenic threshold, on the other hand, are held against each other.
In this research project, we compared two methods to transfect DC with mRNA as a mean of antigen loading for immunotherapy of cancer: electroporation and lipofection with the reagent Transmessenger. This reagent is especially designed for mRNA transfection and results in satisfying transfection rates [13]. We chose the model antigen MelanA which is over-expressed in the majority of malignant melanomas and restricted in its expression in healthy tissue to cells of melanocytic origin [29]. As a control, we used GFP-encoding RNA, on the one hand, to easily determine transfection efficiency and, on the other hand, as control for antigen-specific stimulations.
We observed a drastic difference in the distribution of the mRNA-encoded proteins in the transfected cells. Electroporation resulted in a homogenous moderate expression in approximately 90 % of the cells as observed before [4]. In contrast, the distribution after lipofection was very heterogeneous and resulted in transfection rates between 5 and 50 %. The successfully transfected cells, however, expressed up to 10 times more antigen than the electroporated ones on a per cell basis. This might be explained by the RNA-complexing nature of the transfection reagent, which could lead to a condensation of the mRNA and, in turn, the uptake of larger numbers of mRNA molecules by single DC. The electrical pulse of the electroporation, in contrast, acts on the mRNA molecules in solution, which are evenly distributed in the cuvette. This should result, in theory, in approximately the same amount of mRNA transferred into every cell.
It could be possible that the mRNA–lipid complexes that are formed during lipofection interact with some known or unknown danger receptor expressed on or in the DC. Landi et al. [30] reported that the expression of the bona fide DC maturation marker CD83 was increased on immature DC after lipofection. When we used cytokine-matured DC, we observed no influence of the transfection on the expression of several relevant maturation and activation markers (Fig. 2a) and on the migratory capacity (Fig. 2c). We also excluded that only the successfully transfected DC showed an alternate phenotype by 2-color FACS (Fig. 2b). In previous publications, we and others could already show that electroporation had no influence on these features [4, 15, 31], which was confirmed here again.
Strikingly, lipofected DC displayed a clearly higher capacity than electroporated ones to activate antigen-specific TCR-transfected T cells (Fig. 3a) and also to prime and expand naïve CD8+ T-cells antigen-specifically (Fig. 3b, c). This was only observed for the MelanA-mRNA-transfected DC but not for those that were transfected with GFP mRNA and then pulsed with the corresponding MelanA-derived peptide. The lack of any differences in the examined co-stimulatory surface molecules and the fact that peptide-pulsed controls stimulated T cells equally indicate that the better stimulation capacity of the lipofected DC was only due to the different antigen distribution. Of note is also that the total amount of MelanA was rather similar, since lipofection resulted in approximately 30 % of the DC expressing three times the amount of antigen in comparison with electroporated DC.
A previous comparison that showed the superiority of lipofection with Transmessenger over electroporation in the murine system used viral antigen [14]. However, the use of high antigen densities could result in deletion of T cells with high-affinity TCR, due to activation-induced cell death, and could in addition expand low-avidity T cells, which would be unable to recognize the physiological amounts of antigen on tumor cells, and would therefore be useless in tumor immunotherapy. This is of higher relevance for tumor antigens than for pathogen-derived ones or for xenoantigens, because most tumor antigens are self-antigens and as such are subject to self-tolerance mechanisms which limit the specific naïve precursors in number and in avidity. To examine these concerns, we used an ELISPOT-based method with targets that were loaded with titrated concentrations of peptide to compare the avidities of the CD8+ T cells we had expanded with electroporated or lipofected DC. In spite of the above-mentioned considerations, we observed neither a stronger selective deletion of high-avidity T cells nor a higher expansion of those with low avidity when lipofected DC had been used to expand T cells in comparison with electroporated ones (Fig. 4). It would be detrimental for the immune system if the presence of high antigen densities on some DC would lead to a depletion of high-avidity T cells. That would render us very vulnerable to, e.g., viral infections because viral antigens are often drastically over-expressed in infected cells. Nevertheless, virus-specific T cells of high avidity are regularly found in humans.
To finally exclude that the way of transfection alters the immunogenicity of the exogenous antigen in any way apart from the antigen distribution, we modified the electroporation in a way that we achieved expression densities more similar to the lipofection, although the highest expression levels of the lipofected cells could not be reached (Fig. 5a). These electroporated DC were then mixed with mock-electroporated ones to produce a DC population that displays an antigen distribution similar to that of the lipofected ones. When they were tested for their T-cell priming and expansion capacity, they showed a clearly improved stimulatory capacity, although not reaching the capacity of lipofected ones, probably due to the fact that the antigen expression levels of the latter could not be reached (Fig. 5b). This indicates that the primarily relevant parameter is indeed the distribution of the antigen that results from the different transfection methods.
Transfection of plasmid DNA into DC either by lipofection with different reagents or electroporation has been compared by several groups (e.g., [32–34]). This mostly resulted in low-transfection efficiencies and/or low expression rates of the transgene. The Transmessenger reagent is especially developed for the transfection of RNA and not DNA. Therefore, we focused in this work on the transfection of RNA comparing lipofection and electroporation. Furthermore, when thinking of a clinical translation of transfected DC, it is much easier from a regulatory point of view to use RNA-transfected DC, since DNA transfection is often scaled under gene therapy, where RNA transfection is not.
One would assume that the transfection with Transmessenger mimics the antigen distribution for the natural in vivo situation better than the standard electroporation: during a local infection, most DC in the draining LN are still Ag negative, but some that come from the site of infection where they have directly encountered the pathogen are highly positive for the antigen. In contrast, an antigen that is expressed in every cell in intermediate quantities would rather represent the situation of an auto-antigen and as such not be very immunogenic.
Viewed from a different angle, in purpose of a successive clinical application in cancer immunotherapy, lipofection, although better with respect to stimulation capacity, is problematic, due to its limited reproducibility. The fact that the transfection efficiency ranged from <5 to ~50 % makes this method difficult to implement in a standardized GMP conform production process. Even so, the direct comparison of both methods teaches a valuable lesson for cancer immunotherapy: few cells expressing high quantities of an antigen are better than many dendritic cells expressing intermediate amounts of antigen. This has several implications for future clinical protocols: it appears to be better to produce fewer DC with higher antigen densities. When antigens are combined, it would be better to make pools of DC in which each single population presents only one antigen, but at high density, than to produce one larger batch in which all DC present all antigens at low or intermediate density. Finally, the danger of deleting high-avidity T cells with DC expressing the antigen at high densities appears to be not as high as generally believed. However, only clinical trials can finally tell whether the observations in cell culture can be transferred into the living human organism.
Electronic supplementary material
Below is the link to the electronic supplementary material.
Acknowledgments
We thank Tanja Moritz, Stefanie Baumann, Ina Müller, Waltraud Leisgang, Sonja Trump, and Carmen Trütschel for excellent technical assistance, the medical staff for acquisition of donor material, and Eckhart Kämpgen for his support. The project was financed by the ELAN-Fonds of the Friedrich-Alexander-University Erlangen-Nuremberg (09.02.17.1) and the DFG-German Research Foundation (SFB643, project C1).
Conflict of interest
All authors state that they have no conflict of interest to declare.
References
- 1.Palucka K, Banchereau J. Cancer immunotherapy via dendritic cells. Nat Rev Cancer. 2012;12:265–277. doi: 10.1038/nrc3258. [DOI] [PMC free article] [PubMed] [Google Scholar]
- 2.Lesterhuis WJ, Aarntzen EH, de Vries IJ, Schuurhuis DH, Figdor CG, Adema GJ, Punt CJ. Dendritic cell vaccines in melanoma: from promise to proof? Crit Rev Oncol Hematol. 2008;66:118–134. doi: 10.1016/j.critrevonc.2007.12.007. [DOI] [PubMed] [Google Scholar]
- 3.Van Tendeloo VF, Ponsaerts P, Berneman ZN. mRNA-based gene transfer as a tool for gene and cell therapy. Curr Opin Mol Ther. 2007;9:423–431. [PubMed] [Google Scholar]
- 4.Schaft N, Dorrie J, Thumann P, Beck VE, Muller I, Schultz ES, Kampgen E, Dieckmann D, Schuler G. Generation of an optimized polyvalent monocyte-derived dendritic cell vaccine by transfecting defined RNAs after rather than before maturation. J Immunol. 2005;174:3087–3097. doi: 10.4049/jimmunol.174.5.3087. [DOI] [PubMed] [Google Scholar]
- 5.Frankenberger B, Schendel DJ. Third generation dendritic cell vaccines for tumor immunotherapy. Eur J Cell Biol. 2012;91:53–58. doi: 10.1016/j.ejcb.2011.01.012. [DOI] [PubMed] [Google Scholar]
- 6.Wilgenhof S, Van Nuffel AM, Corthals J, Heirman C, Tuyaerts S, Benteyn D, De Coninck A, Van RI, Verfaillie G, Vandeloo J, Bonehill A, Thielemans K, Neyns B. Therapeutic vaccination with an autologous mRNA electroporated dendritic cell vaccine in patients with advanced melanoma. J Immunother. 2011;34:448–456. doi: 10.1097/CJI.0b013e31821dcb31. [DOI] [PubMed] [Google Scholar]
- 7.Van Tendeloo VF, Ponsaerts P, Lardon F, Nijs G, Lenjou M, Van Broeckhoven C, Van Bockstaele DR, Berneman ZN. Highly efficient gene delivery by mRNA electroporation in human hematopoietic cells: superiority to lipofection and passive pulsing of mRNA and to electroporation of plasmid cDNA for tumor antigen loading of dendritic cells. Blood. 2001;98:49–56. doi: 10.1182/blood.V98.1.49. [DOI] [PubMed] [Google Scholar]
- 8.Erdmann M, Dorrie J, Schaft N, Strasser E, Hendelmeier M, Kampgen E, Schuler G, Schuler-Thurner B. Effective clinical-scale production of dendritic cell vaccines by monocyte elutriation directly in medium, subsequent culture in bags and final antigen loading using peptides or RNA transfection. J Immunother. 2007;30:663–674. doi: 10.1097/CJI.0b013e3180ca7cd6. [DOI] [PubMed] [Google Scholar]
- 9.Michiels A, Tuyaerts S, Bonehill A, Corthals J, Breckpot K, Heirman C, Van Meirvenne S, Dullaers M, Allard S, Brasseur F, Van Der BP, Thielemans K. Electroporation of immature and mature dendritic cells: implications for dendritic cell-based vaccines. Gene Ther. 2005;12:772–782. doi: 10.1038/sj.gt.3302471. [DOI] [PubMed] [Google Scholar]
- 10.Michiels A, Tuyaerts S, Bonehill A, Heirman C, Corthals J, Thielemans K. Delivery of tumor-antigen-encoding mRNA into dendritic cells for vaccination. Methods Mol Biol. 2008;423:155–163. doi: 10.1007/978-1-59745-194-9_10. [DOI] [PubMed] [Google Scholar]
- 11.Schuurhuis DH, Fu N, Ossendorp F, Melief CJ. Ins and outs of dendritic cells. Int Arch Allergy Immunol. 2006;140:53–72. doi: 10.1159/000092002. [DOI] [PubMed] [Google Scholar]
- 12.Okano K, Fukui M, Suehiro Y, Hamanaka Y, Imai K, Hinoda Y. Evaluation of an mRNA lipofection procedure for human dendritic cells and induction of cytotoxic T lymphocytes against enhanced green fluorescence protein. Tumour Biol. 2003;24:317–324. doi: 10.1159/000076464. [DOI] [PubMed] [Google Scholar]
- 13.Liao X, Li Y, Bonini C, Nair S, Gilboa E, Greenberg PD, Yee C. Transfection of RNA encoding tumor antigens following maturation of dendritic cells leads to prolonged presentation of antigen and the generation of high-affinity tumor-reactive cytotoxic T lymphocytes. Mol Ther. 2004;9:757–764. doi: 10.1016/j.ymthe.2004.02.011. [DOI] [PubMed] [Google Scholar]
- 14.Yu H, Babiuk LA, van Drunen Littel-van den Hurk S. Immunity and protection by adoptive transfer of dendritic cells transfected with hepatitis C NS3/4A mRNA. Vaccine. 2007;25:1701–1711. doi: 10.1016/j.vaccine.2006.11.046. [DOI] [PubMed] [Google Scholar]
- 15.Dorrie J, Schaft N, Muller I, Wellner V, Schunder T, Hanig J, Oostingh GJ, Schon MP, Robert C, Kampgen E, Schuler G. Introduction of functional chimeric E/L-selectin by RNA electroporation to target dendritic cells from blood to lymph nodes. Cancer Immunol Immunother. 2008;57:467–477. doi: 10.1007/s00262-007-0385-1. [DOI] [PMC free article] [PubMed] [Google Scholar]
- 16.Melhem NM, Gleason SM, Liu XD, Barratt-Boyes SM. High-level antigen expression and sustained antigen presentation in dendritic cells nucleofected with wild-type viral mRNA but not DNA. Clin Vaccine Immunol. 2008;15:1337–1344. doi: 10.1128/CVI.00154-08. [DOI] [PMC free article] [PubMed] [Google Scholar]
- 17.Gilboa E. DC-based cancer vaccines. J Clin Invest. 2007;117:1195–1203. doi: 10.1172/JCI31205. [DOI] [PMC free article] [PubMed] [Google Scholar]
- 18.Nair SK, Boczkowski D, Morse M, Cumming RI, Lyerly HK, Gilboa E. Induction of primary carcinoembryonic antigen (CEA)-specific cytotoxic T lymphocytes in vitro using human dendritic cells transfected with RNA. Nat Biotechnol. 1998;16:364–369. doi: 10.1038/nbt0498-364. [DOI] [PubMed] [Google Scholar]
- 19.Grunebach F, Muller MR, Nencioni A, Brossart P. Delivery of tumor-derived RNA for the induction of cytotoxic T-lymphocytes. Gene Ther. 2003;10:367–374. doi: 10.1038/sj.gt.3301901. [DOI] [PubMed] [Google Scholar]
- 20.Valmori D, Fonteneau JF, Lizana CM, Gervois N, Lienard D, Rimoldi D, Jongeneel V, Jotereau F, Cerottini JC, Romero P. Enhanced generation of specific tumor-reactive CTL in vitro by selected Melan-A/MART-1 immunodominant peptide analogues. J Immunol. 1998;160:1750–1758. [PubMed] [Google Scholar]
- 21.Schreurs MW, Eggert AA, de Boer AJ, Vissers JL, van Hall T, Offringa R, Figdor CG, Adema GJ. Dendritic cells break tolerance and induce protective immunity against a melanocyte differentiation antigen in an autologous melanoma model. Cancer Res. 2000;60:6995–7001. [PubMed] [Google Scholar]
- 22.Wilde S, Sommermeyer D, Frankenberger B, Schiemann M, Milosevic S, Spranger S, Pohla H, Uckert W, Busch DH, Schendel DJ. Dendritic cells pulsed with RNA encoding allogeneic MHC and antigen induce T cells with superior antitumor activity and higher TCR functional avidity. Blood. 2009;114:2131–2139. doi: 10.1182/blood-2009-03-209387. [DOI] [PubMed] [Google Scholar]
- 23.Bullock TN, Mullins DW, Engelhard VH. Antigen density presented by dendritic cells in vivo differentially affects the number and avidity of primary, memory, and recall CD8+ T cells. J Immunol. 2003;170:1822–1829. doi: 10.4049/jimmunol.170.4.1822. [DOI] [PubMed] [Google Scholar]
- 24.Schaft N, Dorrie J, Muller I, Beck V, Baumann S, Schunder T, Kampgen E, Schuler G. A new way to generate cytolytic tumor-specific T cells: electroporation of RNA coding for a T cell receptor into T lymphocytes. Cancer Immunol Immunother. 2006;55:1132–1141. doi: 10.1007/s00262-005-0098-2. [DOI] [PMC free article] [PubMed] [Google Scholar]
- 25.Heiser A, Dahm P, Yancey DR, Maurice MA, Boczkowski D, Nair SK, Gilboa E, Vieweg J. Human dendritic cells transfected with RNA encoding prostate-specific antigen stimulate prostate-specific CTL responses in vitro. J Immunol. 2000;164:5508–5514. doi: 10.4049/jimmunol.164.10.5508. [DOI] [PubMed] [Google Scholar]
- 26.Birkholz K, Hofmann C, Hoyer S, Schulz B, Harrer T, Kampgen E, Schuler G, Dorrie J, Schaft N. A fast and robust method to clone and functionally validate T-cell receptors. J Immunol Methods. 2009;346:45–54. doi: 10.1016/j.jim.2009.05.001. [DOI] [PubMed] [Google Scholar]
- 27.Melhem NM, Liu XD, Boczkowski D, Gilboa E, Barratt-Boyes SM. Robust CD4+ and CD8+ T cell responses to SIV using mRNA-transfected DC expressing autologous viral Ag. Eur J Immunol. 2007;37:2164–2173. doi: 10.1002/eji.200636782. [DOI] [PubMed] [Google Scholar]
- 28.Boudreau JE, Bonehill A, Thielemans K, Wan Y. Engineering dendritic cells to enhance cancer immunotherapy. Mol Ther. 2011;19:841–853. doi: 10.1038/mt.2011.57. [DOI] [PMC free article] [PubMed] [Google Scholar]
- 29.Kawakami Y, Eliyahu S, Delgado CH, Robbins PF, Rivoltini L, Topalian SL, Miki T, Rosenberg SA. Cloning of the gene coding for a shared human melanoma antigen recognized by autologous T cells infiltrating into tumor. Proc Natl Acad Sci USA. 1994;91:3515–3519. doi: 10.1073/pnas.91.9.3515. [DOI] [PMC free article] [PubMed] [Google Scholar]
- 30.Landi A, Babiuk LA, van Drunen Littel-van den Hurk S. High transfection efficiency, gene expression, and viability of monocyte-derived human dendritic cells after nonviral gene transfer. J Leukoc Biol. 2007;82:849–860. doi: 10.1189/jlb.0906561. [DOI] [PubMed] [Google Scholar]
- 31.Bonehill A, Heirman C, Tuyaerts S, Michiels A, Breckpot K, Brasseur F, Zhang Y, Van Der BP, Thielemans K. Messenger RNA-electroporated dendritic cells presenting MAGE-A3 simultaneously in HLA class I and class II molecules. J Immunol. 2004;172:6649–6657. doi: 10.4049/jimmunol.172.11.6649. [DOI] [PubMed] [Google Scholar]
- 32.Strobel I, Berchtold S, Gotze A, Schulze U, Schuler G, Steinkasserer A. Human dendritic cells transfected with either RNA or DNA encoding influenza matrix protein M1 differ in their ability to stimulate cytotoxic T lymphocytes. Gene Ther. 2000;7(23):2028–2035. doi: 10.1038/sj.gt.3301326. [DOI] [PubMed] [Google Scholar]
- 33.Van Tendeloo VF, Snoeck HW, Lardon F, Vanham GL, Nijs G, Lenjou M, et al. Nonviral transfection of distinct types of human dendritic cells: high-efficiency gene transfer by electroporation into hematopoietic progenitor- but not monocyte-derived dendritic cells. Gene Ther. 1998;5(5):700–707. doi: 10.1038/sj.gt.3300626. [DOI] [PubMed] [Google Scholar]
- 34.Van Tendeloo VF, Ponsaerts P, Lardon F, Nijs G, Lenjou M, Van Broeckhoven C, et al. Highly efficient gene delivery by mRNA electroporation in human hematopoietic cells: superiority to lipofection and passive pulsing of mRNA and to electroporation of plasmid cDNA for tumor antigen loading of dendritic cells. Blood. 2001;98(1):49–56. doi: 10.1182/blood.V98.1.49. [DOI] [PubMed] [Google Scholar]
Associated Data
This section collects any data citations, data availability statements, or supplementary materials included in this article.