Abstract
Aldehyde dehydrogenase 2 (ALDH2) plays a critical role in safeguarding cells against acetaldehyde toxicity and is closely linked to human metabolism. Nevertheless, the involvement of ALDH2 in cancer remains enigmatic. This investigation seeks to comprehensively assess ALDH2’s significance in pan-cancer. We conducted an all-encompassing analysis of pan-cancer utilizing multiple databases, including TCGA, linkedomicshs, UALCAN, and Kaplan–Meier plotter. We employed diverse algorithms such as EPIC, MCPCOUNTER, TIDTIMER, xCell, MCP-counter, CIBERSORT, quanTIseq, and EPIC to examine the connection between ALDH2 expression and immune cell infiltration. Single-cell sequencing analysis furnished insights into ALDH2’s functional status in pan-cancer. Immunohistochemical staining was performed to validate ALDH2 expression in cancer tissues. In a comprehensive assessment, we observed that tumor tissues demonstrated diminished ALDH2 expression levels compared to normal tissues across 16 different cancer types. ALDH2 expression exhibited a significant positive correlation with the infiltration of immune cells, including CD4 + T cells, CD8 + T cells, neutrophils, B cells, and macrophages, in various tumor types. Moreover, this study explored the association between ALDH2 and patient survival, examined the methylation patterns of ALDH2 in normal and primary tumor tissues, and delved into genetic variations and mutations of ALDH2 in tumors. The findings suggest that ALDH2 could serve as a valuable prognostic biomarker in pan-cancer, closely linked to the tumor’s immune microenvironment.
Keywords: ALDH2, immune infiltration, pan-cancer, prognosis
1. Introduction
The paramount task in comprehending the intricate tumorigenesis process involves the identification and characterization of pan-cancer genes. Various publicly funded cancer genomics databases and repositories, such as The Cancer Genome Atlas (TCGA), offer comprehensive functional genomics datasets linked to various cancer types. These resources facilitate in-depth pan-cancer analyses.[1] Among the genes of interest, one noteworthy candidate is aldehyde dehydrogenase 2 (ALDH2), a member of the aldehyde dehydrogenase family.[2] ALDH2 is renowned for its participation in the oxidation-reduction reactions involving ethanol and endogenous aldehydes, emanating from lipid oxidation processes.[3] The malfunction of ALDH2 has strong associations with various diseases, including diabetes, cardiovascular disorders, osteoporosis, and a range of cancers.[4–7] Reduced ALDH2 expression leads to the accumulation of aldehyde by products, including acetaldehyde, 4-hydroxy-2-nonenal (4-HNE), and malondialdehyde (MDA), which have been correlated with an increased incidence of cancer.[8] Multiple investigations underscore the considerable impact of ALDH2 on tumor prognosis and therapeutic approaches. For instance, the East Asian-specific ALDH2*2 missense mutation is recognized as a genetic risk factor for upper aerodigestive tract cancers, contributing to heightened cancer susceptibility, accelerated disease progression, and a less favorable prognosis.[9] Existing research also suggests that ALDH2 may play a role in tumor proliferation by metabolizing specific endogenous substrates, such as 4-HNE.[10] Hence, it is imperative to attain a comprehensive comprehension of the molecular characteristics and clinical significance of ALDH2 in human cancers. An exploration of the atypical expression and genomic alterations in ALDH2 holds promise for uncovering valuable insights into its role in cancer prognosis and treatment.
In this study, we performed a comprehensive pan-cancer analysis by comparing ALDH2 expression profiles across various cancer types, utilizing data sourced from the TCGA database. Beyond expression analysis, we considered multiple factors, including survival status, genetic alterations, protein expression, and DNA methylation, to gain a holistic understanding of ALDH2’s involvement in cancer. This extensive analysis uncovered potential molecular mechanisms related to ALDH2 in the development and clinical prognosis of numerous human cancers. Furthermore, we delved into potential molecular mechanisms and biological functions of ALDH2 in the pathogenesis of diverse cancers, examining aspects such as immune cell infiltration and single-cell sequencing. To validate our bioinformatics findings, we conducted immunohistochemical staining (IHC) to confirm ALDH2 expression in various cancer samples. Our primary objective in this research was to conduct a methodical and comprehensive investigation into the molecular alterations, prognosis, and therapeutic potential of ALDH2 across 33 distinct cancer types. Previous studies have indicated the prevalence of both ALDH2 expression and genetic alterations in various cancers. Therefore, we embarked on an exploration of the relationship between ALDH2 and cancer, as well as its clinical significance.
By evaluating the correlation between ALDH2 and cancer, along with its clinical relevance, we identified ALDH2 as a potential biomarker for immune therapy assessment and prognosis analyses. The significance of our research lies in its potential applications in translational medicine. Our findings provide valuable insights into the role of ALDH2 in cancer and have the potential to pave the way for the development of targeted therapies and personalized treatment approaches.
2. Methods
2.1. Gene expression analysis
We obtained RNAseq data (level 3) and clinical information for 33 distinct tumor types from The Cancer Genome Atlas (TCGA) database, accessible at https://portal.gdc.com. Statistical analysis was conducted using R software version 4.0.3. The Mann–Whitney U test was employed to identify variations between two groups, with statistical significance defined at a P value threshold of < .05.To investigate the differences in ALDH2 expression across various cancer types compared to normal tissues, we utilized data from the Genotype-Tissue Expression (GTEx) database, version 8, available at https://gtexportal.org/home/datasets. The statistical analysis was executed using R software version 4.0.3, and all expression data underwent log2 transformation for standardization.[11] For an integrative approach, we referred to the Open Targets platform, accessible at https://www.targetvalidation.org/. This platform integrates genetics, chemistry, and genomics data to identify genes associated with diseases, facilitating systematic drug targeting and prioritization.[12]
2.2. Protein expression analysis
We conducted a study of methylation levels and protein expression levels of ALDH2 in various cancers and their corresponding adjacent tissues using the UALCAN database, which can be accessed at http://ualcan.path.uab.edu/analysis.html.[13] The significance of differences was assessed using t-tests, and a P-value below 0.05 was deemed statistically significant. Furthermore, we utilized GSCALite, available at http://bioinfo.life.hust.edu.cn/web/GSCALite/, to explore the relationship between ALDH2 expression levels and its promoter methylation levels.[14]
2.3. For the survival prognosis analysis
We utilized RNAseq data (level 3) for 33 distinct tumor types, along with their corresponding clinical information, which was obtained from The Cancer Genome Atlas database at https://portal.gdc.com. We performed univariate Cox regression analysis and visualized the results using the “forestplot” R package to present p-values, hazard ratios (HR), and 95% confidence intervals (CI). The statistical analysis was conducted using R software version 4.0.3.To evaluate the relationship between various factors and prognosis, which encompasses overall survival (OS), progression-free survival (PFS), disease-specific survival (DSS), and disease-free survival (DFS),[15] we employed the Mann–Whitney U test to identify differences between two data groups, with statistical significance defined as a P value below .05. For the analysis of survival curves, we conducted Kaplan–Meier (KM) survival curve analysis using the “survival” and “Survminer” packages in R. Additionally, we utilized the Kaplan–Meier Plotter, accessible at https://kmplot.com/analysis/. This online tool allowed us to assess the impact of 54,000 genes on survival rates across 21 cancer types.[16]
2.4. Gene enrichment analysis
We performed a functional module analysis based on LinkedOmics, available at http://www.linkedomics.org/login.php. This analysis focused on differently expressed genes associated with the ALDH2 gene in LIHC (liver hepatocellular carcinoma).[17]
2.5. Immune infiltration analysis
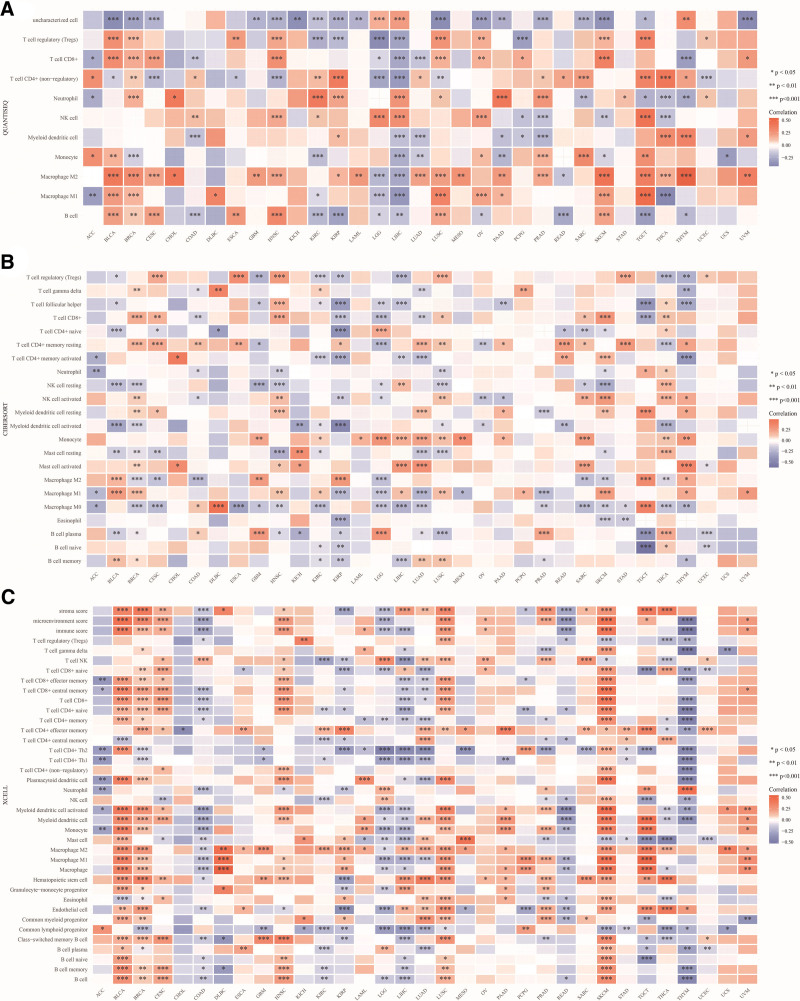
We utilized RNAseq data (level 3) for 33 different tumor types, along with their corresponding clinical information from the TCGA database at https://portal.gdc.com. To carry out reliable assessments related to immune factors, we employed the immunedeconv R package, which integrates six state-of-the-art algorithms, including TIMER, xCell, MCP-counter, CIBERSORT, EPIC, and quanTIseq.[18] Statistical analysis was conducted using R software version 4.0.3. We used the Mann–Whitney U test to determine differences between two sets of data, considering a P value less than .05 as statistically significant. In the heatmap visualization, the x-axis represents different cancer types, the y-axis represents various immune cell types, and different colors indicate the correlation coefficients (*P < .05, **P < .01, ***P < .001, ****P < .0001). This analysis offers insights into the relationship between ALDH2 and immune cell infiltration across different cancer types.
2.6. Analysis of genetic variations
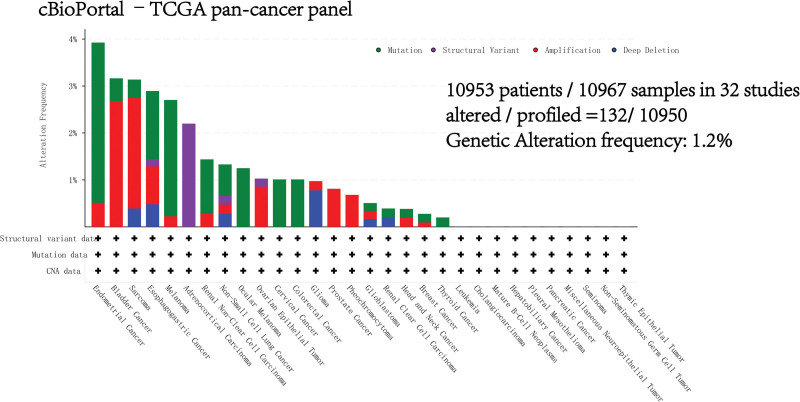
To investigate genetic variations, we employed the cBioPortal tool available at https://www.cbioportal.org/. This tool enabled us to gather information regarding the occurrence, categorization, and spatial distribution of modifications in protein structures, alterations in copy numbers (CNAs), as well as shifts in the three-dimensional structure within the entire TCGA tumor dataset.[19]
2.7. Analyzing ALDH2 correlation in 14 functional states across diverse cancer types
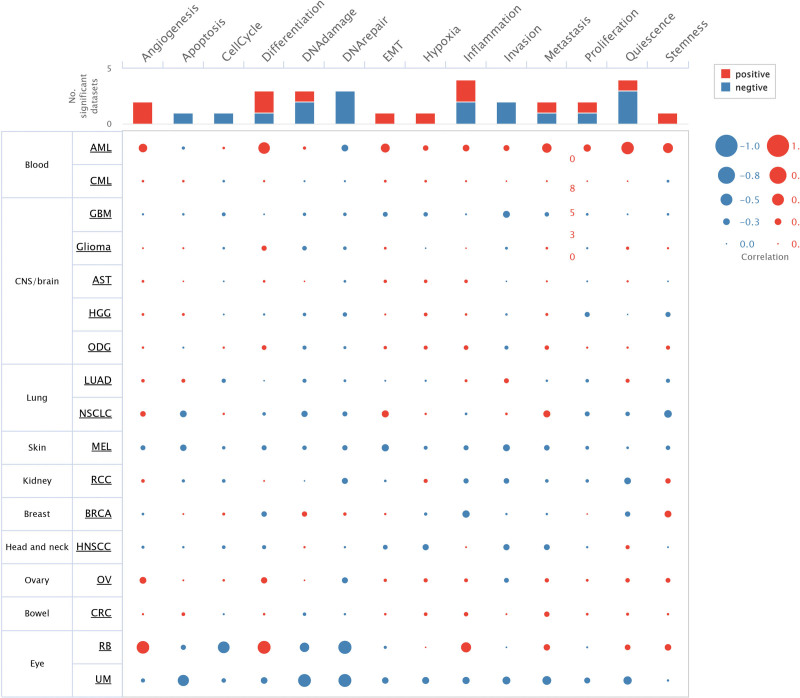
To investigate the association between ALDH2 expression and functional states across various single-cell datasets, we utilized the CancerSEA Portal, as originally outlined by Yuan et al in 2019. Our selection criteria for significance included a correlation strength exceeding 0.3 and a P value below .05.[20]
2.8. Analysis of drug sensitivity and pathway activity
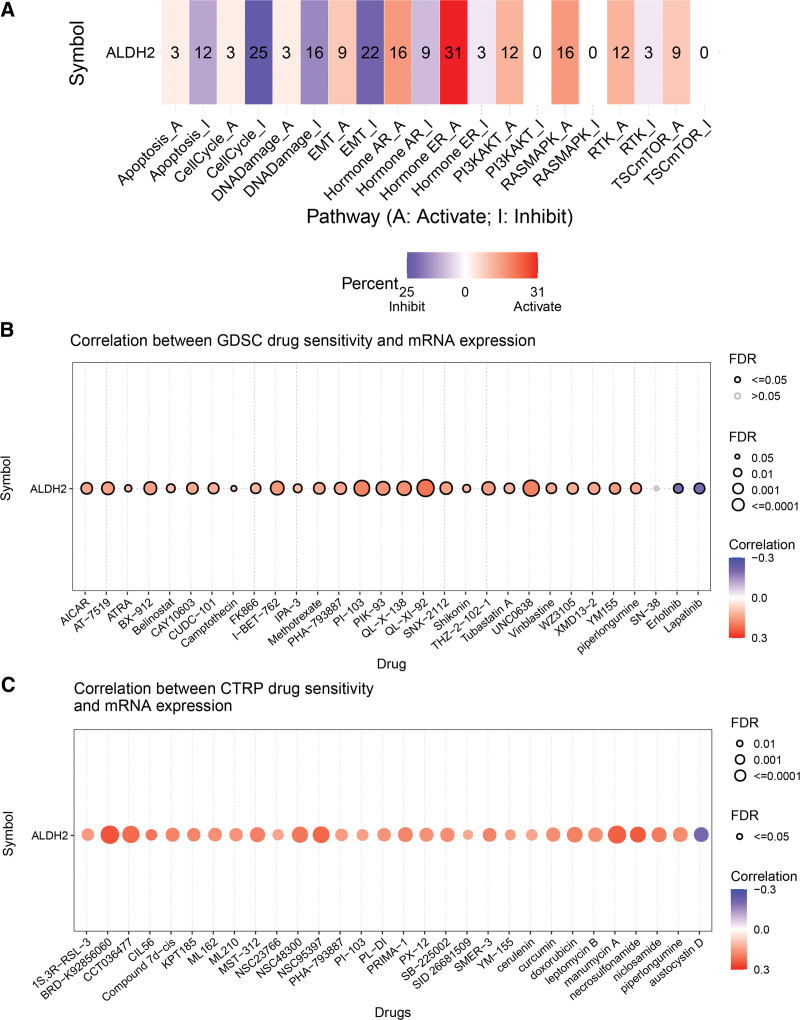
In our research, we harnessed the power of GSCALite, accessible at http://bioinfo.life.hust.edu.cn/web/GSCALite/. This tool facilitated the integration of data from the GDSC and CTRP cancer cell line databases, encompassing both drug sensitivity and gene expression profiles. We assessed the relationship between ALDH2 gene expression in the genome and the sensitivity of small molecules/drugs (IC50) through Spearman correlation analysis. Furthermore, we examined variations in ALDH2 gene expression among functional groups categorized by pathway activity scores, including both activation and inhibition.[14]
2.9. Immunohistochemistry (IHC)
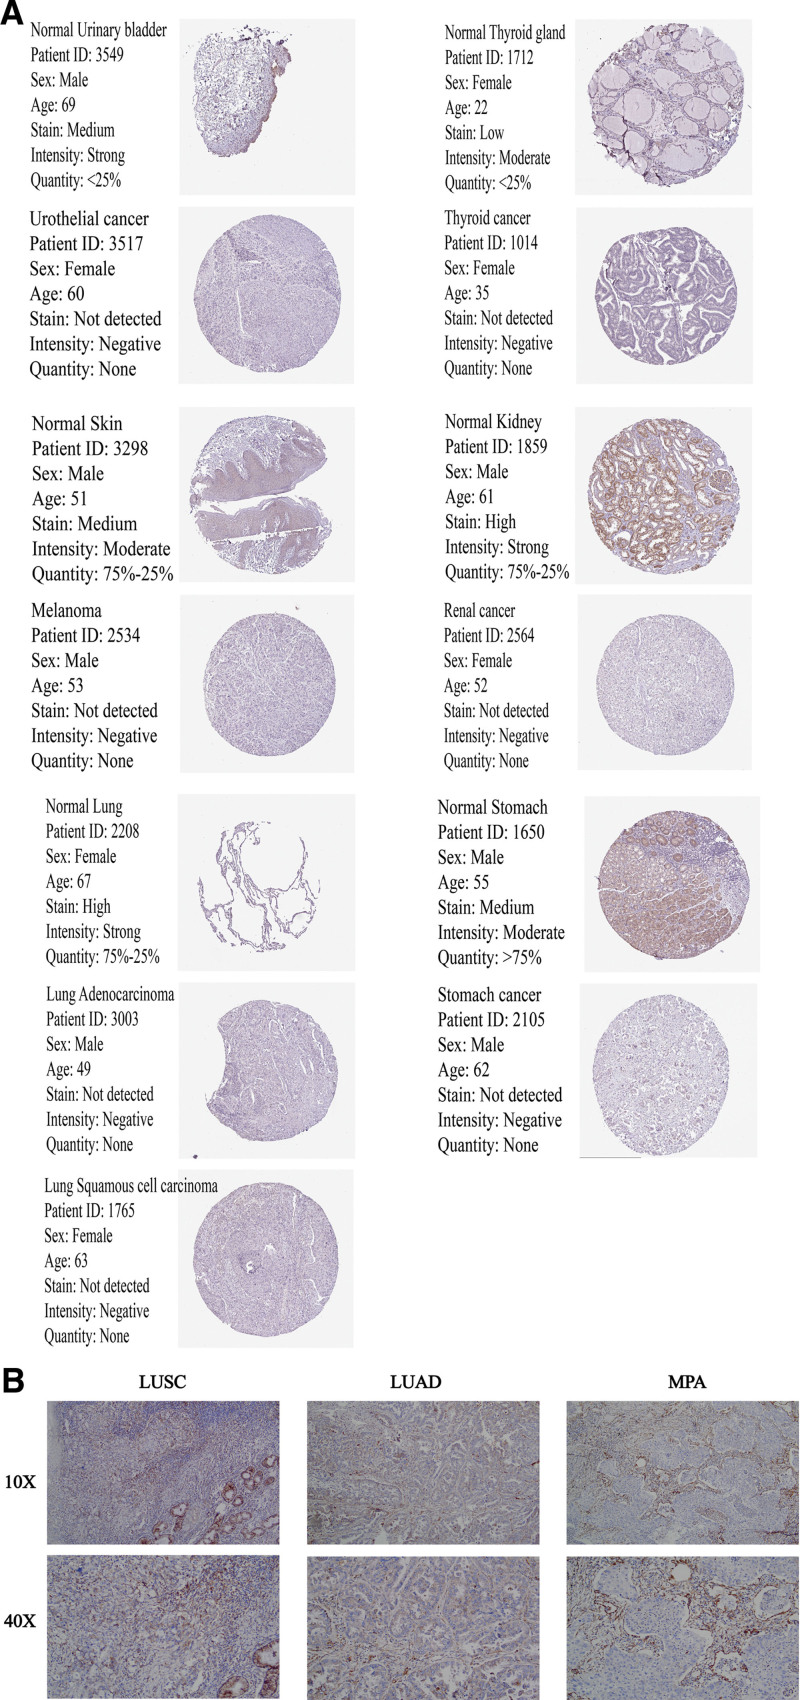
To assess the differential expression of ALDH2 at the protein level, we retrieved IHC (immunohistochemistry) images depicting ALDH2 protein expression in normal tissues and 11 distinct tumor types, including THCA, LUAD, Lung Squamous Cell Carcinoma (LUSC), STAD, Kidney Renal Clear Cell Carcinoma (KIRC), Bladder Urothelial Carcinoma (BLCA), and Skin Cutaneous Melanoma (SKCM), from the Human Protein Atlas (HPA) at http://www.proteinatlas.org.[21] To further provide clinical evidence regarding the prognostic and immune roles of ALDH2 in human cancer through bioinformatics methods, and taking into account notable findings in lung cancer based on prior TCGA database analysis, we secured ethical approval for sample collection for immunohistochemistry. Lung cancer was chosen as the representative TCGA cancer for validation experiments. We collected tumor tissue paraffin sections, and these were subsequently subjected to appropriate immunohistochemical procedures. This study was approved by the Medical Ethics Committee of the Bengbu Medical College [(2022) No. 121] and was conducted in accordance with the Declaration of Helsinki. A mouse monoclonal anti-human ALDH2 antibody (1:400, batch number: bsm-51466M, from Beijing Boaosen Biotechnology Co., Ltd.) was used in these experiments.
2.10. Statistical analysis
Our statistical analysis was conducted using R software version 4.0.3. To compare the expression levels of ALDH2 between normal and tumor tissues, we applied the Wilcoxon rank-sum test. For evaluating survival outcomes, we utilized Kaplan–Meier curves and performed univariate Cox regression analysis. Correlations were assessed using the Spearman correlation coefficient. We considered P values less than .05 to be statistically significant.
3. Results
3.1. ALDH2 mRNA expression levels in various cancer tissues
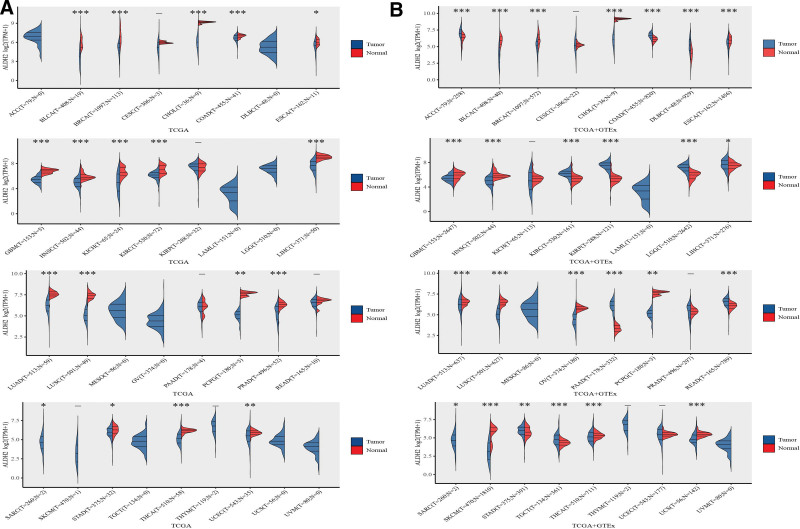
In our analysis of ALDH2 mRNA expression levels in all 33 cancer types from the TCGA database, we observed a significant decrease in ALDH2 expression in tumor tissues compared to corresponding adjacent normal tissues in the majority of cancer types. This difference reached statistical significance (P < .05) in the following cancer types: Bladder Urothelial Carcinoma (BLCA), Breast Invasive Carcinoma (BRCA), Cholangiocarcinoma (CHOL), Colon Adenocarcinoma (COAD), Glioblastoma Multiforme (GBM), Head and Neck Squamous Cell Carcinoma (HNSC), Kidney Chromophobe (KICH), KIRC, Liver Hepatocellular Carcinoma (LIHC), Lung Adenocarcinoma (LUAD), LUSC, Pheochromocytoma and Paraganglioma (PCPG), Prostate Adenocarcinoma (PRAD), Sarcoma (SARC), Thyroid Carcinoma (THCA), and Uterine Corpus Endometrial Carcinoma (UCEC).Conversely, we found no significant difference in ALDH2 expression in Esophageal Carcinoma (ESCA), Cervical and Endocervical Cancers (CESC), Kidney Renal Papillary Cell Carcinoma (KIRP), Pancreatic Adenocarcinoma (PAAD), Rectum Adenocarcinoma (READ), Stomach Adenocarcinoma (STAD), SKCM, and Thymoma (THYM) (Fig. 1A).
Figure 1.
Expression of the ALDH2 gene. (A) Expression distribution of ALDH2 in tumor tissues and normal tissues based on TCGA database. (B) Expression distribution of ALDH2 in tumor tissues and normal tissues based on TCGA + GTEx database. *P < .05, **P < .01, ***P < .001, asterisks denote significance level (*P).
By integrating data from TCGA and GTEx, we identified variations in ALDH2 transcript levels across different cancer types. Notably, ALDH2 expression showed an increase in COAD, Diffuse Large B-Cell Lymphoma (DLBC), KIRP, Lower Grade Glioma (LGG), and PAAD compared to their respective normal tissues. In contrast, ALDH2 expression decreased in Adrenocortical Carcinoma (ACC), Bladder Urothelial Carcinoma (BLCA), BRCA, Cervical Squamous Cell Carcinoma (CISC), Liver Hepatocellular Carcinoma (LIHC), CHOL, Esophageal Carcinoma (ESCA), Glioblastoma Multiforme (GBM), HNSC, KICH, Kidney Renal Clear Cell Carcinoma (KIRC), LUAD, LUSC, Stomach Adenocarcinoma (STAD), Ovarian Serous Cystadenocarcinoma (OV), PCPG, Prostate Adenocarcinoma (PRAD), SARC, Skin Cutaneous Melanoma (SKCM), Thyroid Carcinoma (THCA), Uterine Corpus Endometrial Carcinoma (UCEC), and Uterine Carcinosarcoma (USC) (Fig. 1B).
To further investigate the potential role of ALDH2 in tumor progression, we examined its expression trends across various pathological stages in all TCGA cancer types. Our findings revealed that ALDH2 expression increased with tumor progression in LUSC, Esophageal Carcinoma (ESCA), HNSC, Uterine Carcinosarcoma (USC), CHOL, Thyroid Carcinoma (THCA), Uterine Corpus Endometrial Carcinoma (UCEC), Bladder Urothelial Carcinoma (BLCA), LUAD, BRCA, Skin Cutaneous Melanoma (SKCM), and Ovarian Serous Cystadenocarcinoma (OV), suggesting a potentially significant role for ALDH2 in the progression of these cancers (Figure S1, Supplemental Digital Content, http://links.lww.com/MD/M159).
Furthermore, network analysis of disease interactions revealed that ALDH2 has multiple functional associations with various diseases, including cardiovascular diseases, gastrointestinal diseases, respiratory or pulmonary diseases, immune system diseases, musculoskeletal or connective tissue diseases, mental disorders, neurological disorders, cancers or benign tumors, skin diseases, endocrine and urinary system diseases, infectious diseases, and post-infectious complications (Figure S2, Supplemental Digital Content, http://links.lww.com/MD/M160).
3.2. ALDH2 protein expression and methylation in various tumors
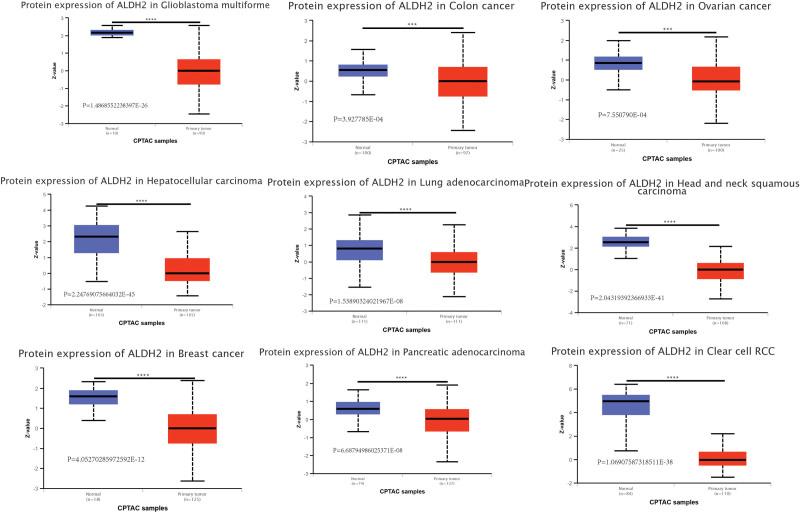
Considering the pivotal role of ALDH2 protein in biological functions, we conducted a detailed investigation into the variations in ALDH2 protein levels between tumor and normal tissues. Our findings revealed a significant downregulation of total ALDH2 protein in several cancer types compared to normal tissues. These cancers included Clear Cell Renal Cell Carcinoma, Lung Adenocarcinoma, Head and Neck Squamous Cell Carcinoma, Pancreatic Adenocarcinoma, Pleomorphic Astrocytoma, Hepatocellular Carcinoma, Breast Cancer, Ovarian Cancer, and Colon Cancer (Fig. 2).
Figure 2.
Expression levels of ALDH2 protein in different tumors. Based on the CPTAC dataset, we analyzed the expression levels of total ALDH2 protein between normal tissues and primary tumors in the selected tumors. (A) GBM. (B) COAD. (C) OV. (D) LIHC. (E) LUAD. (F) HNSC. (G) BRCA. (H) PAAD. (I) KIRC.
In addition to protein levels, we also assessed the differences in ALDH2 methylation levels between cancer and normal tissues. Our analysis demonstrated significantly decreased DNA methylation levels in ALDH2 for Bladder Urothelial Carcinoma (BLCA), HNSC, Uterine Corpus Endometrial Carcinoma (UCEC), BRCA, Kidney Renal Clear Cell Carcinoma (KIRC), Testicular Germ Cell Tumors (TGCT), Prostate Adenocarcinoma (PRAD), PAAD, CESC, LUSC, Esophageal Carcinoma (ESCA), LUAD, PCPG, Thyroid Carcinoma (THCA), and Rectum Adenocarcinoma (READ) when compared to normal tissues (Figure S3, Supplemental Digital Content, http://links.lww.com/MD/M161).
Furthermore, we conducted Spearman correlation coefficient calculations using GSCALite, which unveiled a prevailing negative correlation between ALDH2 gene expression and DNA methylation levels. Only a limited number of instances exhibited a positive correlation (Figure S4, Supplemental Digital Content, http://links.lww.com/MD/M162).
3.3. ALDH2 prognostic survival analysis across multiple cancers
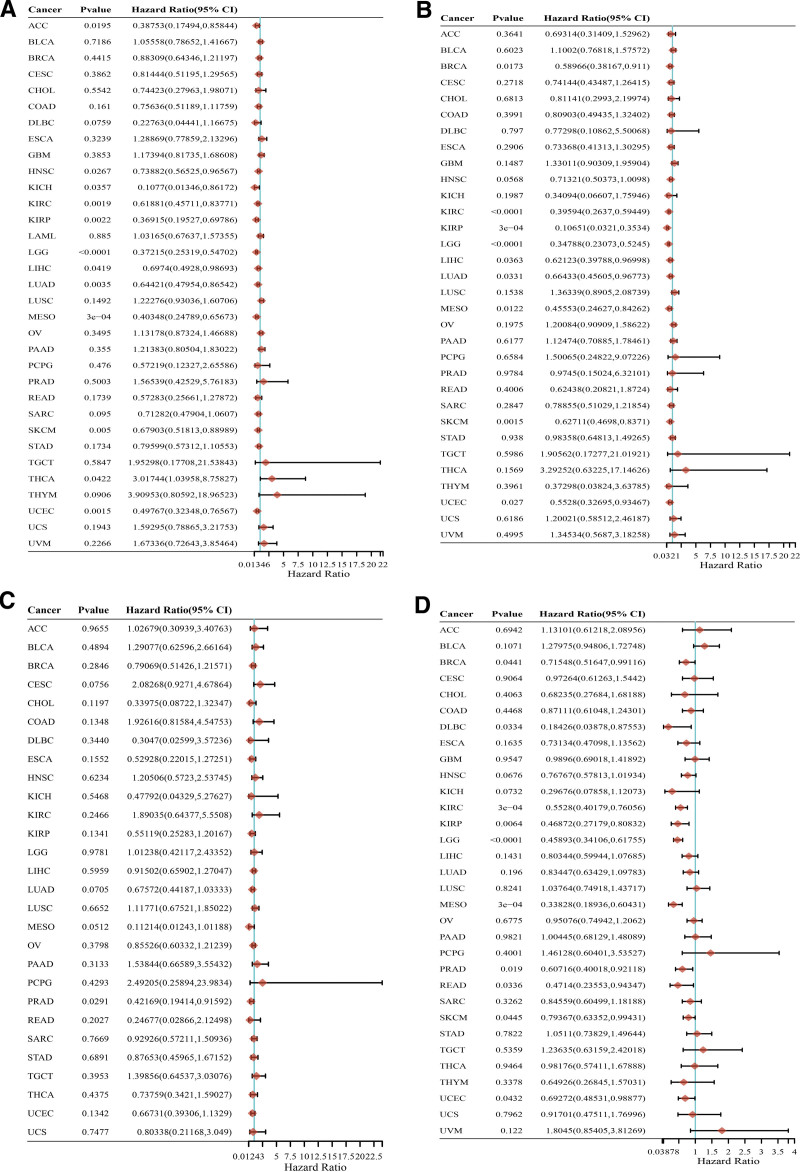
We conducted an extensive assessment of the relationship between ALDH2 expression and patient prognosis in a pan-cancer dataset. Our analysis encompassed survival indicators such as Overall Survival (OS), Disease-Specific Survival (DSS), Progression-Free Survival (PFS), and Disease-Free Survival (DFS). Utilizing Cox regression analysis across 33 types of cancer, we observed a significant correlation between ALDH2 expression and OS in 13 specific cancer types. These included ACC, HNSC, KICH, Kidney Renal Clear Cell Carcinoma (KIRC), Kidney Renal Oncocytoma (KIRO), LGG, Liver Hepatocellular Carcinoma (LIHC), LUAD, LUSC, Mesothelioma (MESO), Skin Cutaneous Melanoma (SKCM), Thyroid Carcinoma (THCA), THYM, and Uterine Corpus Endometrial Carcinoma (UCEC) (Fig. 3A). Notably, in most of these cases, except for THCA, LUSC, and THYM, the Hazard Ratio (HR) was less than 1, indicating a potential protective influence.
Figure 3.
Relationship between ALDH2 expression and cancer patient survival. (A–D) Forest plot of ALDH2 hazard ratios in 33 types of tumors.
“In-depth investigation into the correlation between ALDH2 expression and cancer prognosis, particularly Overall Survival (OS), was carried out using Kaplan–Meier survival curves. Remarkably, ALDH2 expression exhibited a significant association with a total of 11 cancer types, namely endometrial cancer, renal clear cell carcinoma, hepatocellular carcinoma, cervical squamous cell carcinoma, breast cancer, lung squamous cell carcinoma, bladder cancer, thyroid cancer, sarcoma, lung adenocarcinoma, and head and neck squamous cell carcinoma. Among these, ALDH2 had an adverse impact in three cancer types, specifically, lung squamous cell carcinoma (OS: HR = 1.52 (1.13–2.05), log-rank P = .006), bladder cancer (OS: HR = 1.62 (1.1–2.39), log-rank P = .014), and thyroid cancer (OS: HR = 2.9 (1.08–7.81), log-rank P = .028).
Simultaneously, ALDH2 exhibited a protective effect in eight other cancer types, including endometrial cancer (OS: HR = 0.46 (0.3–0.7), log-rank P = .00021), renal clear cell carcinoma (OS: HR = 0.64 (0.47–0.87), log-rank P = .0035), hepatocellular carcinoma (OS: HR = 0.42 (0.29–0.6), log-rank P = 1.3e-06), cervical squamous cell carcinoma (OS: HR = 0.54 (0.34–0.88), log-rank P = .012), breast cancer (OS: HR = 0.64 (0.45–0.91), log-rank P = .013), sarcoma (OS: HR = 0.57 (0.38–0.85), log-rank P = .0055), lung adenocarcinoma (OS: HR = 0.62 (0.46–0.83), log-rank P = .0013), and head and neck squamous cell carcinoma (OS: HR = 0.65 (0.49–0.85), log-rank P = .0013) (Figure S5B, Supplemental Digital Content, http://links.lww.com/MD/M163). Additionally, Kaplan–Meier analysis of pTNM staging indicated that the overall survival rate of patients with Bladder Cancer (BLCA), Uterine Corpus Endometrial Carcinoma (UCES), LUSC, Thyroid Carcinoma (THCA), Breast Invasive Carcinoma (BRCA), HNSC, Skin Cutaneous Melanoma (SKCM), LUAD, Esophageal Carcinoma (ESCA), and CHOL decreased as the tumor stage progressed (Figure S5A, Supplemental Digital Content, http://links.lww.com/MD/M163). In the context of Disease-Specific Survival (DSS), ALDH2 expression was found to influence DSS in nine cancer types, including BRCA, Kidney Renal Clear Cell Carcinoma (KIRC), KIRP, LGG, Liver Hepatocellular Carcinoma (LIHC), LUAD, MESO, Skin Cutaneous Melanoma (SKCM), and Uterine Corpus Endometrial Carcinoma (UCEC) (Fig. 3B). We also assessed the relationship between ALDH2 expression and Disease-Free Survival (DFS). ALDH2 expression was found to impact DFS in Prostate Adenocarcinoma (PRAD) (Fig. 3C). Moreover, regarding Progression-Free Survival (PFS), ALDH2 expression was found to be influential in Breast Invasive Carcinoma (BRCA), Kidney Renal Clear Cell Carcinoma (KIRC), KIRP, Lower Grade B-Cell Lymphoma (DLBC), LUAD, LGG, MESO, Rectum Adenocarcinoma (READ), Skin Cutaneous Melanoma (SKCM), and Uterine Corpus Endometrial Carcinoma (UCEC) (Fig. 3D).
3.4. The co-expression network of ALDH2 and its role in liver hepatocellular carcinoma (LIHC)
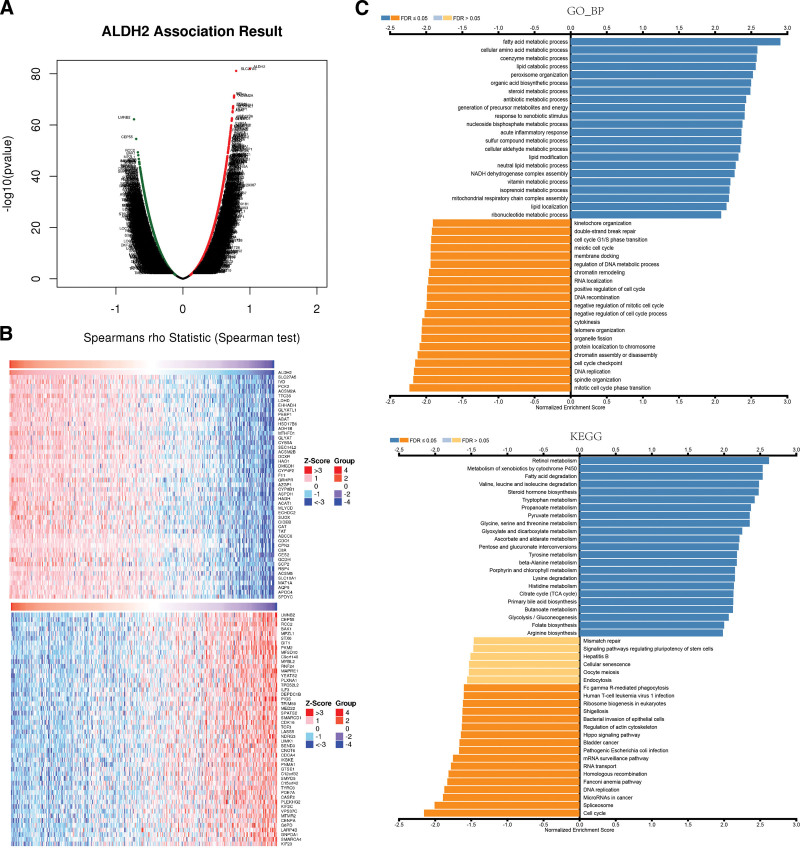
To uncover the biological significance of ALDH2 in LIHC, we conducted a co-expression network analysis within the LIHC cohort. As illustrated in Figure 4A, we identified 3407 genes (depicted as dark red dots) that exhibited significant positive correlations with ALDH2, while 7823 genes (depicted as dark green dots) displayed significant negative correlations with ALDH2, with a false discovery rate (FDR) less than 0.01. The heatmap in Figure 4B showcases the top 50 genes positively correlated with ALDH2 expression and the top 50 genes negatively correlated with ALDH2 expression. Remarkably, ALDH2 expression demonstrated strong positive correlations with SLC27A5 (FDR, r = 0.794, P = 7.46E-82), IVD (r = 0.764, P = 2.99972E-72), and PCK2 (r = 0.762, P = 9.08073E-72).
Figure 4.
Co-expressed genes with ALDH2 in HCC. (A) Co-expression of ALDH2 with all genes in HCC. (B) Co-transcription of the top 50 positively correlated genes and the top 50 negatively correlated genes with ALDH2 in HCC. (C) Gene Ontology Biological Process (GO_BP) and KEGG pathway analysis (GSEA) of ALDH2-associated genes in HCC.
We further investigated the impact of the expression of these top 50 positively and negatively correlated genes on overall survival in LIHC. Among the top 50 positively correlated genes, it is highly likely that they are associated with higher risk in LIHC, as they all displayed high Hazard Ratios (HR) (P < .05). Conversely, among the top 50 negatively correlated genes, except for PLEKHG2, it is most likely that they are associated with lower risk in LIHC, as these genes exhibited lower HR values (P < .05) (Table 1). These findings suggest that ALDH2 may be implicated in the upregulation of LIHC risk factors and the downregulation of LIHC protective factors, thereby promoting the onset and progression of LIHC.
Table 1.
Overall survival analysis of the top 50 genes positively and negatively correlated with ALDH2 in HCC.
| Pos Genes | HR | logrank P | Neg Genes | HR | logrank P |
|---|---|---|---|---|---|
| aldehyde dehydrogenase 2 family member | 0.42 (0.29–0.6) | .00 | BCL2 antagonist/killer 1 | 1.88 (1.26–2.8) | .00 |
| solute carrier family 27 member 5 | 0.52 (0.36–0.74) | .00 | BEN domain containing 3 | 1.94 (1.34–2.82) | .00 |
| isovaleryl-CoA dehydrogenase | 0.47 (0.32–0.68) | .00 | RAD9-HUS1-RAD1 interacting nuclear orphan 1 | 1.81 (1.28–2.57) | .00 |
| phosphoenolpyruvate carboxykinase 2, mitochondrial | 0.54 (0.38– 0.77) | .00 | TOPBP1 interacting checkpoint and replication regulator | 1.95 (1.38–2.77) | .00 |
| acyl-CoA synthetase medium chain family member 2A | 0.5 (0.35–0.71) | .00 | suppressor APC domain containing 2 | 2.17 (1.52–3.09) | .00 |
| tetratricopeptide repeat domain 36 | 0.48 (0.32– 0.7) | .00 | caspase 2 | 1.89 (1.32–2.7) | .00 |
| lactate dehydrogenase D | 0.55 (0.38–0.8) | .00 | cell division cycle associated 4 | 2.07 (1.31–3.28) | .00 |
| enoyl-CoA hydratase and 3-hydroxyacyl CoA dehydrogenase | 0.61 (0.42 –0.87) | .01 | cyclin dependent kinase 16 | 2.16 (1.53–3.06) | .00 |
| glycine-N-acyltransferase like 1 | 0.47 (0.32–0.7) | .00 | centromere protein A | 2.33 (1.65–3.29) | .00 |
| phosphatidylethanolamine binding protein 1 | 0.55 (0.38– 0.79) | .00 | centrosomal protein 55 | 2.62 (1.83–3.75) | .00 |
| 4-aminobutyrate aminotransferase | 0.49 (0.34–0.69) | .00 | CCR4-NOT transcription complex subunit 6 | 2.2 (1.52–3.17) | .00 |
| hydroxysteroid 17-beta dehydrogenase 6 | 0.48 (0.34–0.69) | .00 | DEP domain containing 1B | 2.14 (1.4–3.28) | .00 |
| alcohol dehydrogenase 1B (class I), beta polypeptide | 0.57 (0.4–0.81) | .00 | glucose-6-phosphate dehydrogenase | 2.52 (1.77–3.59) | .00 |
| methylenetetrahydrofolate dehydrogenase, cyclohydrolase and formyltetrahydrofolate synthetase 1 | 0.63 (0.45–0.89) | .01 | GIT ArfGAP 1 | 1.98 (1.38–2.84) | .00 |
| glycine-N-acyltransferase like 1 | 0.58 (0.39–0.86) | .01 | glucosamine-6-phosphate deaminase 1 | 2.19 (1.54–3.13) | .00 |
| cytochrome b5 type A | 0.55 (0.38–0.8) | .00 | G2 and S-phase expressed 1 | 2 (1.41–2.85) | .00 |
| SEC14 like lipid binding 2 | 0.5 (0.35–0.71) | .00 | inhibitor of nuclear factor kappa B kinase subunit epsilon | 1.78 (1.16–2.72) | .01 |
| acyl-CoA synthetase medium chain family member 2B | 0.51 (0.35–0.74) | .00 | interleukin enhancer binding factor 3 | 1.55 (1.07–2.24) | .02 |
| dicarbonyl and L-xylulose reductase | 0.58 (0.4– 0.84) | .00 | kinesin family member 23 | 1.92 (1.36–2.71) | .00 |
| hydroxyacid oxidase 1 | 0.48 (0.32–0.73) | .00 | kinesin family member 2C | 2.4 (1.66–3.46) | .00 |
| dimethylglycine dehydrogenase | 0.47 (0.33–0.67) | .00 | La ribonucleoprotein 4B | 1.84 (1.25–2.71) | .00 |
| cytochrome P450 family 4 subfamily F member 2 | 0.56 (0.38–0.82) | .00 | ceramide synthase 5 | 1.81 (1.2–2.72) | .00 |
| coagulation factor XI | 0.45 (0.31–0.65) | .00 | LIM domain kinase 1 | 1.9 (1.34–2.69) | .00 |
| glyoxylate and hydroxypyruvate reductase | 0.55 (0.38–0.78) | .00 | lamin B2 | 1.77 (1.23–2.56) | .00 |
| alpha-2-glycoprotein 1, zinc-binding | 0.61 (0.43–0.86) | .00 | microtubule associated protein RP/EB family member 1 | 1.6 (1.12–2.29) | .01 |
| cytochrome P450 family 8 subfamily B member 1 | 0.6 (0.42–0.85) | .00 | mediator complex subunit 22 | 2.15 (1.51–3.07) | .00 |
| aspartate dehydrogenase domain containing | 0.47 (0.31–0.73) | .00 | major facilitator superfamily domain containing 10 | 1.63 (1.16–2.3) | .00 |
| hydroxyacylglutathione hydrolase | 0.45 (0.32–0.63) | .00 | myelin protein zero like 1 | 2.03 (1.37–2.99) | .00 |
| acetyl-CoA acetyltransferase 1 | 0.41 (0.29–0.59) | .00 | myotubularin related protein 2 | 2.39 (1.69–3.38) | .00 |
| malonyl-CoA decarboxylase | 0.66 (0.45–0.95) | .03 | MYB proto-oncogene like 2 | 2.29 (1.62–3.24) | .00 |
| enoyl-CoA hydratase domain containing 2 | 0.52 (0.37–0.74) | .00 | NDRG family member 3 | 1.83 (1.28–2.6) | .00 |
| sulfite oxidase | 0.45 (0.31–0.64) | .00 | phosphodiesterase 7A | 1.53 (1.08–2.16) | .02 |
| cell death inducing DFFA like effector b | 0.56 (0.39–0.79) | .00 | phosphatidylinositol glycan anchor biosynthesis class S | 1.71 (1.21–2.41) | .00 |
| catalase | 0.44 (0.3–0.65) | .00 | pyruvate kinase M2 | 2.07 (1.45–2.95) | .00 |
| tyrosine aminotransferase | 0.49 (0.35–0.7) | .00 | pleckstrin homology and RhoGEF domain containing G2 | 1.33 (0.94–1.88) | .11 |
| ATP binding cassette subfamily C member 6 | 0.45 (0.31–0.65) | .00 | plexin A1 | 1.98 (1.4–2.8) | .00 |
| cysteine dioxygenase type 1 | 0.51 (0.36–0.72) | .00 | PNMA family member 1 | 1.93 (1.36–2.72) | .00 |
| carboxypeptidase N subunit 2 | 0.53 (0.38–0.76) | .00 | regulator of chromosome condensation 2 | 2.22 (1.54–3.19) | .00 |
| complement C8 alpha chain | 0.59 (0.42–0.83) | .00 | ring finger protein 24 | 2 (1.42–2.84) | .00 |
| carboxylesterase 2 | 0.7 (0.48–1.02) | .06 | SWI/SNF related, matrix associated, actin dependent regulator of chromatin, subfamily a, member 4 | 1.63 (1.13–2.35) | .01 |
| glutaryl-CoA dehydrogenase | 0.48 (0.34–0.67) | .00 | SWI/SNF related, matrix associated, actin dependent regulator of chromatin, subfamily d, member 1 | 2.22 (1.53–3.22) | .00 |
| sterol carrier protein 2 | 0.51 (0.36–0.73) | .00 | SMYD family member 5 | 2.01 (1.41–2.86) | .00 |
| retinol binding protein 4 | 0.35 (0.25–0.5) | .00 | spermatogenesis associated serine rich 2 | 2.39 (1.68–3.39) | .00 |
| retinol binding protein 4 | 0.65 (0.46–0.91) | .01 | syntaxin 6 | 1.91 (1.34–2.73) | .00 |
| solute carrier family 10 member 1 | 0.46 (0.32–0.66) | .00 | transcription factor 3 | 1.56 (1.1–2.21) | .01 |
| methionine adenosyltransferase 1A | 0.59 (0.42–0.83) | .00 | TPD52 like 2 | 1.98 (1.4–2.8) | .00 |
| aquaporin 9 | 0.52 (0.36–0.75) | .00 | tripartite motif containing 59 | 1.64 (1.15–2.33) | .01 |
| apolipoprotein C4 | 0.52 (0.36–0.75) | .00 | TYRO3 protein tyrosine kinase | 1.88 (1.28–2.76) | .00 |
| speedy/RINGO cell cycle regulator family member C | 0.52 (0.36–0.75) | .00 | VPS37C subunit of ESCRT-I | 1.61 (1.14–2.28) | .01 |
| selenium binding protein 1 | 0.6 (0.42–0.85) | .00 | YEATS domain containing 2 | 2.23 (1.56–3.21) | .00 |
Gene Set Enrichment Analysis (GSEA) using Gene Ontology (GO) term annotations unveiled that the co-expressed genes with ALDH2 are primarily involved in processes such as fatty acid metabolism, coenzyme metabolism, cellular amino acid metabolism, lipid catabolic processes, and steroid metabolism (Fig. 4C). Conversely, activities associated with double-strand break repair, cell cycle G1/S phase transition, RNA localization, and DNA metabolic processes are suppressed. Kyoto Encyclopedia of Genes and Genomes (KEGG) pathway analysis indicated that the co-expressed genes are mainly enriched in pathways such as retinol metabolism, cytochrome P450-mediated metabolism of exogenous compounds, fatty acid degradation, and degradation of valine, leucine, and isoleucine (Fig. 4C). These results suggest that ALDH2 exerts broad effects on the metabolism of LIHC cells.
3.5. Immunoinfiltration analysis results
For robust immune-related correlation assessments, we harnessed the power of immunedeconv, an R software package that amalgamates six cutting-edge algorithms, including TIMER, xCell, MCP-counter, CIBERSORT, EPIC, and quanTIseq. Our goal was to explore the correlation between ALDH2 and various levels of immune cell infiltration. The results unveiled a significant association between ALDH2 and CD4 + T cells, CD8 + T cells, B cells, neutrophils, and macrophages across pan-cancer patients (Fig. 5).
Figure 5.
Correlation between ALDH2 expression levels and tumor-associated infiltration of CD4 + T cells, CD8 + T cells, B cells, macrophages, neutrophils, and endothelial cells. (A–C) Heatmaps of Spearman correlation analysis between CD4 + T cell, CD8 + T cell, B cell, macrophage, neutrophil, and endothelial cell immune infiltration scores and ALDH2 gene expression using TIMER, MCP-counter, and EPIC algorithms in multiple tumor tissues. The x-axis represents different tumor tissues, the y-axis represents different immune infiltration scores, and different colors represent correlation coefficients. Negative values indicate negative correlation, while positive values indicate positive correlation. The stronger the correlation, the darker the color. *P < .05, **P < .01, ***P < .001, asterisks denote significance level (*P). The significance between the two groups of samples was determined by the Wilcoxon test.
In specific cancer types such as Glioblastoma (GBM), PAAD, and Skin Cutaneous Melanoma (SKCM), ALDH2 exhibited a notable positive correlation with CD4 + T cells. Conversely, in Bladder Urothelial Carcinoma (BLCA), Breast Invasive Carcinoma (BRCA), Cervical Squamous Cell Carcinoma (CESC), Head and Neck Squamous Cell Carcinoma (HNSC), PCPG, and SKCM, ALDH2 demonstrated a significant positive correlation with CD8 + T cells. However, in Liver Hepatocellular Carcinoma (LIHC), Stomach Adenocarcinoma (STAD), Testicular Germ Cell Tumors (TGCT), and THYM, ALDH2 exhibited a significant negative correlation with CD8 + T cells.
In COAD and Thyroid Carcinoma (THC), ALDH2 displayed a significant negative correlation with neutrophils. Conversely, in BLCA, BRCA, CESC, GBM, HNSC, KICH, Ovarian Serous Cystadenocarcinoma (OV), and SKCM, ALDH2 showed a significant positive correlation with B cells, while in COAD, KIRP, LIHC, Rectum Adenocarcinoma (READ), STAD, and THYM, ALDH2 exhibited a significant negative correlation with B cells.
In Bladder Urothelial Carcinoma (BLCA), Breast Invasive Carcinoma (BRCA), Diffuse Large B-Cell Lymphoma (DLBC), HNSC, KIRP, Acute Myeloid Leukemia (LAML), LUSC, Ovarian Serous Cystadenocarcinoma (OV), PAAD, PCPG, Skin Cutaneous Melanoma (SKCM), Testicular Germ Cell Tumors (TGCT), Thymoma (THYM), and Uveal Melanoma (UVM), ALDH2 displays a significant positive correlation with macrophages. In contrast, in COAD and Rectum Adenocarcinoma (READ), ALDH2 demonstrates a significant negative correlation with macrophages.
Moreover, in Bladder Urothelial Carcinoma (BLCA), Breast Invasive Carcinoma (BRCA), COAD, Diffuse Large B-Cell Lymphoma (DLBC), Glioblastoma (GBM), HNSC, KIRP, LAML, LGG, LUAD, LUSC, MESO, PAAD, PCPG, Skin Cutaneous Melanoma (SKCM), Testicular Germ Cell Tumors (TGCT), Thymoma (THYM), and UVM, ALDH2 demonstrates a significant correlation with M1 or M2 macrophages (Figure S6, Supplemental Digital Content, http://links.lww.com/MD/M164).
3.6. Genetic alterations of ALDH2 across multiple cancers
The genetic alterations of ALDH2 in various cancers were examined using the cBioPortal TCGA Pan-Cancer Atlas database. Notably, the highest alteration frequency of ALDH2, approximately 3.41%, was observed in patients with endometrial cancer (Figure S7, Supplemental Digital Content, http://links.lww.com/MD/M165). Among the different cancer types within the TCGA Pan-Cancer cohort, mutations are the most common DNA alterations, with a prominent presence in endometrial cancer, melanoma, esophageal and gastric cancer, and uveal melanoma (Fig. 6). It’s noteworthy that these mutations in ALDH2 within malignant tumors are distributed across all exons of the ALDH2 gene, without any specific hotspot mutation sites identified (Figure S7, Supplemental Digital Content, http://links.lww.com/MD/M165). The most frequent mutation, K289Rfs122/Efs45 (Figure S8, Supplemental Digital Content, http://links.lww.com/MD/M166), is situated in the Aldedh domain region of ALDH2 and is predicted to be a frameshift mutation.
Figure 6.
Genetic variations of ALDH2. Investigation of genetic variations of ALDH2 in tumors using cBioPortal – TCGA Pan-Cancer group study.
3.7. Functional states of ALDH2 in different cancer types
To gain deeper insights into the correlation and potential mechanisms of ALDH2 expression in various cancer types, we delved into the functional states of ALDH2 using the CancerSEA database. Single-cell-level analyses were conducted in 17 cancer types, including Acute Myeloid Leukemia (AML), Breast Cancer (BRCA), Retinoblastoma (RB), Renal Cell Carcinoma (RCC), Ovarian Cancer (OV), Oligodendroglioma (ODG), Colorectal Cancer (CRC), Glioma, Adrenocortical Carcinoma (AST), Head and Neck Squamous Cell Carcinoma (HNSCC), Uveal Melanoma (UM), Glioblastoma (GBM), Chronic Myeloid Leukemia (CML), LUAD, Melanoma (MEL), High-Grade Glioma (HGG), and Non-Small Cell Lung Cancer (NSCLC).
In AML, ALDH2 exhibits positive correlations with angiogenesis (cor = 0.339, P < .001), differentiation (cor = 0.484, P < .001), Epithelial-Mesenchymal Transition (EMT) (cor = 0.358, P < .001), metastasis (cor = 0.382, P < .001), quiescence (cor = 0.529, P < .001), and stemness (cor = 0.408, P < .001).
In RB, ALDH2 demonstrates positive correlations with angiogenesis (cor = 0.535, P < .001), inflammation (cor = 0.413, P < .001), and differentiation (cor = 0.55, P < .001). Conversely, it exhibits negative correlations with the cell cycle (cor = −0.493, P < .001), DNA damage (cor = −0.383, P < .001), and DNA repair (cor = −0.561, P < .001).
In UM, ALDH2 displays negative correlations with apoptosis (cor = −0.467, P < .001), DNA repair (cor = −0.55, P < .001), DNA damage (cor = −0.545, P < .001), invasion (cor = −0.306, P < .001), metastasis (cor = −0.351, P < .001), and quiescence (cor = −0.327, P < .001) (Fig. 7).
Figure 7.
Correlation between ALDH2 expression and 14 tumor functional states in pan-cancer tissues. Investigation of the correlation between ALDH2 expression and 14 cancer functional states using single-cell sequencing data from the CancerSEA database.
3.8. Analysis of drug sensitivity and pathway enrichment involving ALDH2
In our analysis of drug sensitivity and pathway enrichment involving the ALDH2 gene across 33 tumors, we made the following observations:
The ALDH2 gene is primarily associated with key pathways such as epithelial-mesenchymal transition (EMT), TSC/mTOR, RTK, RAS/MAPK, PI3K/AKT, hormone ER, hormone AR, DNA damage response, cell cycle, and apoptosis pathways (Fig. 8A).
Figure 8.
Drug sensitivity analysis and pathway enrichment analysis of ALDH2. (A) Pathway enrichment analysis of ALDH2. (B) Correlation between drug sensitivity in GDSC dataset and ALDH2 expression. (C) Correlation between drug sensitivity in CTRP dataset and ALDH2 expression.
In terms of drug sensitivity, high expression of ALDH2 is associated with resistance to 29 drugs in CTRP and 27 drugs in GDSC. Conversely, low expression of ALDH2 is associated with resistance to 1 drug in CTRP and 2 drugs in GDSC (Fig. 8B and C). These findings provide valuable insights into how ALDH2 expression may impact drug responses across various cancers.
The validation of ALDH2 expression in diverse clinical specimens involved the analysis of immunohistochemistry (IHC) staining in various cancer types. Here are the key findings:
Analysis of IHC staining in THCA, LUAD, LUSC, STAD, KIRC, BLCA, and SKCM using the Human Protein Atlas (HPA) database showed a decreased expression of ALDH2 at the protein level in cancer tissues compared to normal tissues. This aligns with the expression pattern of ALDH2 gene data obtained from the TCGA database (Fig. 9A).
Figure 9.
ALDH2 immunohistochemistry. (A) Immunohistochemical images of ALDH2 in normal tissue (top) and tumor tissue (bottom).(a) BLCA. (b) THCA. (c) SKCM. (d) KIRC. (e) LUAD, LUSC. (f) STAD. (B) Expression of ALDH2 in non-small cell lung cancer. (a) Squamous cell carcinoma of the lung. (b) Adenocarcinoma of the lung. (c) Mucinous adenocarcinoma of the lung.
Further validation of the bioinformatics-derived expression results included an evaluation of ALDH2 expression in tumor and adjacent tissues of various lung cancers, such as lung adenocarcinoma, lung squamous cell carcinoma, and lung mucinous adenocarcinoma, using IHC. The IHC results were consistent with the previous findings (Fig. 9B). This supports the observed downregulation of ALDH2 in cancer tissues compared to normal tissues.
These validations provide robust evidence of the differential expression of ALDH2 in cancer and normal tissues across various cancer types.
4. Discussion
In this investigation, we integrated diverse datasets from TCGA and GTEx databases, revealing consistent downregulation of ALDH2 in neoplastic tissues across multiple cancer types, such as bladder, breast, glioblastoma, head and neck squamous cell carcinoma, kidney chromophobe, renal clear cell carcinoma, cholangiocarcinoma, liver hepatocellular carcinoma, lung adenocarcinoma, lung squamous cell carcinoma, pheochromocytoma, paraganglioma, prostate cancer, and sarcoma (Fig. 1). This finding strongly implies the pivotal role of ALDH2 as a significant biological element in the context of various cancers.
We also assessed ALDH2’s prognostic significance within the TCGA cancer cohort, performing univariate Cox regression survival analysis using the R software with “forestplot” package. ALDH2 emerged as a favorable prognostic factor for OS and DSS in KIRC, LGG, MESO, SKCM, and UCEC. Conversely, it was associated with an adverse prognosis in THCA (Fig. 3). This dual role of ALDH2, acting as an adverse prognostic biomarker for THCA and THYM while serving as a tumor suppressor in ACC, HNSC, KICH, KIRC, KIRO, LGG, LIHC, LUAD, MESO, SKCM, and UCEC, suggests its potential utility.
Additional survival analysis using the Kaplan–Meier Plotter revealed that increased ALDH2 expression was linked to poorer OS prognosis in LUSC, BLCA, and THCA.
To validate our findings, we conducted clinical patient-based experiments, specifically examining ALDH2 expression, revealing downregulation in non-small cell tumor tissues compared to adjacent normal tissues (Fig. 9). These findings strongly support ALDH2 as a versatile prognostic biomarker in various cancer types.
Indeed, it’s widely recognized that proteins play a pivotal role in executing diverse biological functions in the human body. In our pursuit to comprehensively understand the role of the ALDH2 protein in the context of different cancer types, we observed a noteworthy pattern. When compared to their corresponding adjacent normal tissues, ALDH2 protein exhibited a significant downregulation in clear cell renal cell carcinoma, lung adenocarcinoma, head and neck squamous cell carcinoma, pancreatic cancer, pleomorphic glioblastoma, hepatocellular carcinoma, breast cancer, ovarian cancer, and colon cancer tissues. Conversely, no significant differences were observed in the expression levels of ALDH2 in other tumor types.
To further validate ALDH2’s consistently low expression in tumor tissues, we analyzed immunohistochemistry data from the Human Protein Atlas (HPA) database and performed immunohistochemical staining on non-small cell lung cancer. These experiments aligned with ALDH2 expression patterns from TCGA data, emphasizing the consistency and reliability of our findings regarding ALDH2 downregulation in cancer tissues.
DNA methylation regulates gene expression and maintains gene silencing in normal cells. Dysregulation of DNA methylation is linked to diseases, including cancer.[22] Our research reveals consistent ALDH2 promoter methylation downregulation in various cancers, primarily negatively correlated with ALDH2 gene expression, with few exceptions showing positive correlation.
Tumor-associated macrophages (TAMs) in the tumor microenvironment (TME) have clinical implications and are associated with poor outcomes in many cancer types.[23,24] Macrophages can adopt M1 and M2 polarization states.[25]
T lymphocytes are crucial for anti-tumor immune responses, secreting cytokines like IL-2, IL-4, IL-5, IL-17, IL-21, IL-22, and IFN-γ into the TME.[26] Regulatory T (Treg) cells, a subtype of CD4 + T cells with immunosuppressive functions, can serve as biomarkers for colorectal cancer progression and treatment response.[27] Recent research has also highlighted the role of B cells and B cell-related pathways in the TME and immune responses, offering new avenues for cancer treatment strategies.[28,29]
In our study, we employed Pearson’s correlation coefficient to assess the relationship between ALDH2 gene expression and immune cell infiltration scores across various tumors. We observed significant positive correlations between ALDH2 and immune cell infiltration in the tumor microenvironment, particularly with macrophages, T cells, and B cells in most cancer types. Furthermore, our drug sensitivity analysis revealed that high ALDH2 expression is associated with drug resistance for specific drugs in the CTRP and GDSC datasets, emphasizing ALDH2’s complex and significant role in the tumor microenvironment.
The correlation between ALDH2 expression and tumor-associated macrophage (TAM) infiltration varied across different tumor types. In cancers like BLCA, BRCA, DLBC, HNSC, PCPG, SKCM, LUSC, TGCT, and UVM, ALDH2 expression positively correlated with M1 macrophage infiltration. Conversely, in LGG, ALDH2 expression showed a significant negative correlation with M1 macrophage infiltration. ALDH2 expression in BLCA, GBM, KIRP, LAML, LUAD, LUSC, MESO, PAAD, TGCT, and THYM significantly correlated positively with M2 macrophage infiltration. However, in COAD and LGG, ALDH2 expression displayed a significant negative correlation with M2 macrophage infiltration. These findings highlight the intricate relationship between ALDH2 and immune cell infiltration, which varies across different cancer types.
We used the LinkedOmics database to explore the co-expression network of ALDH2, with a focus on liver hepatocellular carcinoma (LIHC) to illustrate its potential role. Our analysis identified genes significantly correlated with ALDH2 expression in LIHC, many of which exhibited abnormal expression patterns in LIHC and were associated with overall survival. This suggests that ALDH2 may be involved in regulatory networks with these co-expressed genes, potentially contributing to LIHC development. Our study, using Gene Set Enrichment Analysis (GSEA), revealed that this regulatory network primarily participates in retinol metabolism and fatty acid degradation. Vitamin A (retinol) is a micronutrient that plays a pivotal role in various cell types, influencing cell differentiation and cellular metabolism.[30] Notably, our findings suggest that ALDH2 may potentially impact cellular differentiation through its influence on vitamin A metabolism. Our findings suggest that ALDH2 may impact cellular differentiation through its influence on vitamin A metabolism. These results align with recent research linking ALDH2 to hepatocellular carcinoma (HCC) and indicating that inhibiting ALDH2 downstream of the mTOR signaling pathway can promote tumor invasion in humans.[31]
To gain deeper insights into tumor progression mechanisms, we conducted a comprehensive single-cell level analysis of ALDH2 expression across various cancers. Our results uncovered a significant correlation between ALDH2 expression and critical processes such as angiogenesis, DNA damage, DNA repair, and inflammation.[32] Notably, previous studies have suggested that ALDH2 might influence angiogenesis by interacting with the oxidative stress byproduct, 4-hydroxy-2-nonenal (4HNE).[33] These findings illuminate the multifaceted roles of ALDH2 in tumor progression and its potential implications in various biological processes.
While our study is comprehensive and meticulous, it is important to acknowledge specific limitations. Despite our extensive analysis of ALDH2 using various databases and rigorous cross-validation with R software v4.0.3, several constraints should be considered. First, differences in microarray and sequencing data from various databases may introduce variances, potentially leading to systematic biases due to a lack of granularity and specificity. Second, experimental validation is essential to corroborate our findings on the potential functions of ALDH2, which would bolster the credibility of our results. Third, while we have inferred a close correlation between ALDH2 expression, immune cell infiltration, and cancer prognosis, direct evidence is needed to understand how ALDH2 influences prognosis through its role in immune infiltration. The mechanisms underlying ALDH2’s involvement in immune regulation remain unknown, warranting further research to elucidate these pathways.
5. Conclusion
In summary, our comprehensive study investigates the intricate connections between ALDH2 expression and critical clinical parameters, including tumor stage and clinical prognosis. We also delve into the relationship between ALDH2 expression and DNA methylation, as well as its potential involvement in immune cell infiltration within tumors. This multi-dimensional analysis provides valuable insights into the potential importance of ALDH2 in the initiation and progression of various cancer types.
Acknowledgments
We express gratitude to the public databases, websites, and softwares used in the paper.
Author contributions
Conceptualization: Ligao Wu.
Funding acquisition: Ligao Wu.
Investigation: Xiaorong Shen, Ziyi Yan, Yuanlii Huang, Qing Zhu, Guanghui Zhang, Hongfei Ci, Qiong Wu.
Project administration: Ligao Wu.
Resources: Ligao Wu.
Software: Xiaorong Shen, Ziyi Yan, Yuanlii Huang, Qing Zhu, Guanghui Zhang, Hongfei Ci, Qiong Wu.
Supervision: Ligao Wu.
Validation: Xiaorong Shen, Guanghui Zhang, Ligao Wu.
Visualization: Ziyi Yan, Yuanlii Huang, Qing Zhu, Hongfei Ci, Qiong Wu.
Writing – original draft: Xiaorong Shen.
Writing – review & editing: Ligao Wu.
Supplementary Material
Abbreviations:
- ACC
- Adrenocortical Cancer
- ALDH2
- aldehyde dehydrogenase 2 family member
- BLCA
- Bladder Urothelial Carcinoma
- BRCA
- Breast Invasive Carcinoma
- CESC
- Cervical and Endocervical Cancers
- CHOL
- Cholangiocarcinoma
- COAD
- Colorectal Adenocarcinoma
- DLBC
- Diffuse Large B-cell Lymphoma
- ESCA
- Esophageal Carcinoma
- GBM
- Glioblastoma
- HNSC
- Head and Neck Squamous Cell Carcinoma
- KICH
- Kidney Chromophobe
- KIRC
- Kidney Clear Cell Carcinoma
- KIRP
- Kidney Papillary Cell Carcinoma
- LAML
- Acute Myeloid Leukemia
- LGG
- Lower Grade Glioma
- LIHC
- liver hepatocellular carcinoma
- LUAD
- Lung Adenocarcinoma
- LUNG
- Lung Cancer
- LUSC
- Lung Squamous Cell Carcinoma
- MESO
- Mesothelioma
- OV
- Ovarian Serous Cystadenocarcinoma
- PAAD
- Pancreatic Adenocarcinoma
- PCPG
- Pheochromocytoma and Paraganglioma
- PRAD
- Prostate Adenocarcinoma
- READ
- Rectum Adenocarcinoma
- SARC
- Sarcoma
- SKCM
- Skin Cutaneous Melanoma
- STAD
- Stomach Adenocarcinoma
- TGCT
- Testicular Germ Cell Tumors
- THCA
- Thyroid Carcinoma
- THYM
- Thymoma
- UCEC
- Uterine Corpus Endometrial Carcinoma
- UVM
- Uveal Melanoma
This work was supported by grants from the Key Project of Natural Science Research in Anhui Universities (KJ2021A078).
This study was approved by the Medical Ethics Committee of the Bengbu Medical College [(2022) No. 121] and was conducted in accordance with the Declaration of Helsinki.
The authors have no conflicts of interest to disclose.
The datasets generated during and/or analyzed during the current study are publicly available.
Supplemental Digital Content is available for this article.
How to cite this article: Shen X, Yan Z, Huang Y, Zhu Q, Zhang G, Ci H, Wu Q, Wu L. ALDH2 as an immunological and prognostic biomarker: Insights from pan-cancer analysis. Medicine 2024;103:16(e37820).
Contributor Information
Xiaorong Shen, Email: 1348403638@qq.com.
Ziyi Yan, Email: 1282410648@qq.com.
Yuanli Huang, Email: 18895678651@163.com.
Qing Zhu, Email: 49143373@qq.com.
Guanghui Zhang, Email: 389142927@qq.com.
Hongfei Ci, Email: cifeihong@163.com.
Qiong Wu, Email: wlgahbb@126.com.
References
- [1].Zhang X, Lai H, Zhang F, et al. Visualization and analysis in the field of pan-cancer studies and its application in breast cancer treatment. Front Med (Lausanne). 2021;8:635035. [DOI] [PMC free article] [PubMed] [Google Scholar]
- [2].Wang LS, Wu ZX. ALDH2 and cancer therapy. Adv Exp Med Biol. 2019;1193:221–8. [DOI] [PubMed] [Google Scholar]
- [3].Heymann HM, Gardner AM, Gross ER. Aldehyde-induced DNA and protein adducts as biomarker tools for alcohol use disorder. Trends Mol Med. 2018;24:144–55. [DOI] [PMC free article] [PubMed] [Google Scholar]
- [4].Munukutla S, Pan G, Palaniyandi SS. Aldehyde Dehydrogenase (ALDH) 2 in diabetic heart diseases. Adv Exp Med Biol. 2019;1193:155–74. [DOI] [PubMed] [Google Scholar]
- [5].Mittal M, Bhagwati S, Siddiqi MI, et al. A critical assessment of the potential of pharmacological modulation of aldehyde dehydrogenases to treat the diseases of bone loss. Eur J Pharmacol. 2020;886:173541. [DOI] [PubMed] [Google Scholar]
- [6].Wang W, Wang C, Xu H, et al. Aldehyde dehydrogenase, liver disease and cancer. Int J Biol Sci. 2020;16:921–34. [DOI] [PMC free article] [PubMed] [Google Scholar]
- [7].Liu K, Song G, Zhu X, et al. Association between ALDH2 Glu487Lys polymorphism and the risk of esophageal cancer. Medicine (Baltimore). 2017;96:e6111. [DOI] [PMC free article] [PubMed] [Google Scholar]
- [8].Zhong H, Yin H. Role of lipid peroxidation derived 4-hydroxynonenal (4-HNE) in cancer: focusing on mitochondria. Redox Biol. 2015;4:193–9. [DOI] [PMC free article] [PubMed] [Google Scholar]
- [9].Jelic MD, Mandic AD, Maricic SM, et al. Oxidative stress and its role in cancer. J Cancer Res Ther. 2021;17:22–8. [DOI] [PubMed] [Google Scholar]
- [10].Martin-Perez M, Urdiroz-Urricelqui U, Bigas C, et al. The role of lipids in cancer progression and metastasis. Cell Metab. 2022;34:1675–99. [DOI] [PubMed] [Google Scholar]
- [11].Zhu W, Feng D, Shi X, et al. The potential role of mitochondrial acetaldehyde dehydrogenase 2 in urological cancers from the perspective of ferroptosis and cellular senescence. Front Cell Dev Biol. 2022;10:850145. [DOI] [PMC free article] [PubMed] [Google Scholar]
- [12].Ochoa D, Hercules A, Carmona M, et al. The next-generation open targets platform: reimagined, redesigned, rebuilt. Nucleic Acids Res. 2023;51:D1353–9. [DOI] [PMC free article] [PubMed] [Google Scholar]
- [13].Zhang Q, Huang R, Hu H, et al. Integrative analysis of hypoxia-associated signature in pan-cancer. iScience. 2020;23:101460. [DOI] [PMC free article] [PubMed] [Google Scholar]
- [14].Liu CJ, Hu FF, Xie GY, et al. GSCA: an integrated platform for gene set cancer analysis at genomic, pharmacogenomic and immunogenomic levels. Brief Bioinform. 2023;24. [DOI] [PubMed] [Google Scholar]
- [15].Ding W, Feng G, Hu Y, et al. Co-occurrence and mutual exclusivity analysis of DNA methylation reveals distinct subtypes in multiple cancers. Front Cell Dev Biol. 2020;8:20. [DOI] [PMC free article] [PubMed] [Google Scholar]
- [16].Gyorffy B. Discovery and ranking of the most robust prognostic biomarkers in serous ovarian cancer. Geroscience. 2023;45:1889–98. [DOI] [PMC free article] [PubMed] [Google Scholar]
- [17].Vasaikar SV, Straub P, Wang J, et al. LinkedOmics: analyzing multi-omics data within and across 32 cancer types. Nucleic Acids Res. 2018;46:D956–63. [DOI] [PMC free article] [PubMed] [Google Scholar]
- [18].Izzi V, Davis MN, Naba A. Pan-cancer analysis of the genomic alterations and mutations of the matrisome. Cancers (Basel). 2020;12:2046. [DOI] [PMC free article] [PubMed] [Google Scholar]
- [19].Gao J, Aksoy BA, Dogrusoz U, et al. Integrative analysis of complex cancer genomics and clinical profiles using the cBioPortal. Sci Signal. 2013;6:pl1. [DOI] [PMC free article] [PubMed] [Google Scholar]
- [20].Yuan H, Yan M, Zhang G, et al. CancerSEA: a cancer single-cell state atlas. Nucleic Acids Res. 2019;47:D900–8. [DOI] [PMC free article] [PubMed] [Google Scholar]
- [21].Karlsson M, Zhang C, Méar L, et al. A single-cell type transcriptomics map of human tissues. Sci Adv. 2021;7. [DOI] [PMC free article] [PubMed] [Google Scholar]
- [22].Ponten F, Jirstrom K, Uhlen M. The human protein atlas – a tool for pathology. J Pathol. 2008;216:387–93. [DOI] [PubMed] [Google Scholar]
- [23].Na HK, Lee JY. Molecular basis of alcohol-related gastric and colon cancer. Int J Mol Sci. 2017;18:1116. [DOI] [PMC free article] [PubMed] [Google Scholar]
- [24].Bai R, Li Y, Jian L, Yang Y, Zhao L, Wei M. The hypoxia-driven crosstalk between tumor and tumor-associated macrophages: mechanisms and clinical treatment strategies. Mol Cancer. 2022;21:177. [DOI] [PMC free article] [PubMed] [Google Scholar]
- [25].Cheng N, Bai X, Shu Y, et al. Targeting tumor-associated macrophages as an antitumor strategy. Biochem Pharmacol. 2021;183:114354. [DOI] [PubMed] [Google Scholar]
- [26].Chen Y, Song Y, Du W, et al. Tumor-associated macrophages: an accomplice in solid tumor progression. J Biomed Sci. 2019;26:78. [DOI] [PMC free article] [PubMed] [Google Scholar]
- [27].Garris CS, Luke JJ. Dendritic cells, the T-cell-inflamed tumor microenvironment, and immunotherapy treatment response. Clin Cancer Res. 2020;26:3901–7. [DOI] [PMC free article] [PubMed] [Google Scholar]
- [28].Palicelli A, Croci S, Bisagni A, et al. What do we have to know about PD-L1 expression in prostate cancer? A systematic literature review (Part 6): correlation of PD-L1 expression with the status of mismatch repair system, BRCA, PTEN, and other genes. Biomedicines. 2022;10:236. [DOI] [PMC free article] [PubMed] [Google Scholar]
- [29].Al-Mterin MA, Murshed K, Elkord E. Correlations between circulating and tumor-infiltrating CD4(+) T cell subsets with immune checkpoints in colorectal cancer. Vaccines (Basel). 2022;10:538. [DOI] [PMC free article] [PubMed] [Google Scholar]
- [30].Tokunaga R, Naseem M, Lo JH, et al. B cell and B cell-related pathways for novel cancer treatments. Cancer Treat Rev. 2019;73:10–9. [DOI] [PMC free article] [PubMed] [Google Scholar]
- [31].Zahid KR, Yao S, Khan ARR, Raza U, Gou D. mTOR/HDAC1 crosstalk mediated suppression of ADH1A and ALDH2 links alcohol metabolism to hepatocellular carcinoma onset and progression in silico. Front Oncol. 2019;9:1000. [DOI] [PMC free article] [PubMed] [Google Scholar]
- [32].Roy B, Pan G, Giri S, Thandavarayan RA, Palaniyandi SS. Aldehyde dehydrogenase 2 augments adiponectin signaling in coronary angiogenesis in HFpEF associated with diabetes. FASEB J. 2022;36:e22440. [DOI] [PubMed] [Google Scholar]
- [33].Li K, Guo W, Li Z, et al. ALDH2 repression promotes lung tumor progression via accumulated acetaldehyde and DNA damage. Neoplasia. 2019;21:602–14. [DOI] [PMC free article] [PubMed] [Google Scholar]
Associated Data
This section collects any data citations, data availability statements, or supplementary materials included in this article.


