

Abstract
Purpose
To examine the migration responses of monocyte/macrophages (MO/MA) expressing complementary receptors to chemokines produced in the tumor environment of epithelial ovarian cancer (EOC).
Methods
We examined the expression of the chemokine receptors, CCR1, CCR5, and CXCR4, on EOC associated ascitic and blood MO/MA; their response to complementary chemokines in a MO/MA migration assay and the F-actin content in an actin polymerization assay. A validated cDNA microarray assay was then utilized to examine alterations in pathway genes that can be identified with cell migration.
Results
Ascitic and EOC blood MO/MA express CCR1, CCR5 and CXCR4, but differently. Cell surface expression levels for CCR1 and CCR5 were higher in ascites than that of normal blood in contrast to CXCR4 levels in ascitic MO/MA which were lower. EOC associated ascitic or blood MO/MA failed to migrate in response to the CC ligand RANTES and to the CXCR4 reactive chemokine, SDF1 (CXCL12). Ascitic and most EOC blood MO/MA also behaved differently from normal blood MO in the polymerization/depolymerization assay. A cDNA gene analysis of purified ascitic MO/MA demonstrated that a number of genes involved with chemokine production, focal adhesion, actin cytoskeletal function and leukocyte transendothelial migration were down-regulated in the ascitic MO/MA when compared to normal blood MO. Moreover, PBMC cDNA from EOC patients’ blood also showed gene profiles similar to that of ascitic MO/MA.
Conclusions
Defective migration and polymerization/depolymerization activity of MO/MA from EOC patients and a significant down-regulation of critical pathway genes suggest that other mechanisms might be involved in the accumulation of systemically derived MO at the tumor site of EOC patients.
Electronic supplementary material
The online version of this article (doi:10.1007/s00262-007-0401-5) contains supplementary material, which is available to authorized users.
Keywords: Peripheral Blood Mononuclear Cell, Epithelial Ovarian Carcinoma, Mean Fluorescence Intensity, Normal Donor, Trabectedin
Introduction
Current treatments for epithelial ovarian carcinoma (EOC) result in 5-year survival rates of only 25–30% for patients with stage III or IV disease [1]. This poor outcome contrasts with a 10-year survival rate of 80–90% for early stage EOC where peritoneal and serosal tumor involvement is usually absent. Peritoneal tumor involvement clearly contributes to morbidity and mortality in EOC. The peritoneum protects the integrity of intra-abdominal organs and is also structured to facilitate access of inflammatory cells to sites of infection or injury in the peritoneal cavity [2]. We have previously shown that the submesothelial stroma of the peritoneum of EOC patients has an extensive infiltrate of inflammatory cells [2].
There is increasing support for the role of MO/MA in the progression of EOC [3–8]. Elevated blood levels of macrophage colony-stimulating factor-1 (MCSF1), a MA-differentiating cytokine produced by MA and other cells, have been correlated with disease progression or poor survival in patients with EOC [7–10]; elevated blood levels of the chemokine CXCL8 (IL8) have also been linked to reduced survival of EOC patients [11]. Recent focus on the opposing anti-tumor and pro-tumor properties of tumor-associated macrophages in EOC has led to the conclusion that these cells are “polarized” in the presence of tumor favoring a pro-tumor phenotype [5, 6, 12, 13].
In a previous report, we demonstrated that the non tumor involved peritoneum of EOC patients with stage III or IV disease expressed an inflammatory gene profile that, in comparison to the benign peritoneum, included more than 30 genes related to MA differentiation and activation. Included amongst these genes were CCR1, VCAM1 and CXCL8 (IL8) [14]. Moreover, MO/MA in both the peritoneum and ascites of EOC patients expressed CCR1+, CXCL8+, and the adhesion molecule VCAM1 at the protein level, suggesting phenotypic and possible functional similarity of MO/MA in these two locations [2].
It might be considered intuitive that chemokines and their receptors have important roles in leukocyte migration and activation [15–18]. Biochemical analyses of ascites from patients with EOC have revealed both CC and CXC chemokines [19]. Chemokines that were detected at elevated levels in EOC patients include CCL18 (PARC), CXCL8 (IL8), CCL2 (MCP1), and CCL3 (MIP1α). Transcripts for CCL4 (MIP1β), CCL5 (RANTES), and CCL7 (MCP3) have also been described on EOC cells [20]. CXCL8 (IL8) is either constitutively produced or induced in both non-hematogenous and hematogenous cells and is also present at elevated levels in the serum of EOC patients [11]. Chemokine receptors are G-protein coupled seven-transmembrane receptors, expressed at the surfaces of various hematogenous cells, including T cells and MO/MA. Certain chemokine receptors can bind to several ligands; for example, CCL3, CCL4, CCL5, and CCL7 can each bind to CCR1. The inflammatory chemokine receptors, CCR1 and CCR5, also share the ligands CCL3 and CCL5 [19].
Here we show that MO/MA derived from blood or ascites of EOC patients exhibit a defective migration response to certain chemokines that are common to the tumor environment of EOC and that can react with either CCR1 or CXCR4. In addition, ascitic or blood MO/MA exhibited impaired polymerization-depolymerization properties. These findings are discussed in the context of altered expression of the pathway genes involved with focal adherence, the actin cytoskeleton, and leukocyte transendothelial migration in ascitic and blood MO/MA.
Methods
Ascitic and peripheral blood MO/MA isolation from EOC patients
All EOC patients signed an informed consent approved by the MDACC IRB. Isolation processes for peripheral blood and ascitic MO/MA from EOC patients were described previously [13, 21]. These included flow sorting for isolating MO or MO/MA from ascites [13]. The following modifications were utilized for isolating cells for migration and polymerization experiments. A sequential procedure was used that included a Ficoll-Hypaque density cushion followed by a MO isolation kit and a MACS separator (both from Miltenyi Biotec, Auburn, CA) according to the manufacturer’s instructions. Different leukocyte and epithelial tumor cell populations can be isolated by this method, which is preferable to adherence because it has minimal effect on cell properties. Cells were labeled with a hapten-antibody cocktail (containing monoclonal hapten-conjugated CD3, CD7, CD19, CD45RA, CD56 and anti-IgE antibodies) and MACS Anti-Hapten Microbeads, washed with buffer (PBS with 0.5% human albumin and 1 mM EDTA), then run through a column placed in a MACS magnetic separator. The unattached MO are collected and the magnetically labeled T cells, B cells, NK cells, DC, and basophils remain attached to the column. When large numbers of tumor cells are present, anti-HEA (EpCAM) microbeads are added to remove these cells for FACS subset analysis and migration experiments. Negatively selected MO/MA cells were obtained that were usually greater than 90% CD14+ and had low numbers of other cell types. Purified normal buffy coat blood and ascitic MO/MA or whole ascites were frozen in 95% FBS and 5% DMSO and stored in liquid nitrogen. Column purified MO and MO/MA were utilized in surface expression and actin polymerization and depolymerization experiments. Column purified ascitic MO/MA were also utilized in the microarray experiment.
Normal donor monocytes (CD14+ cells) isolation for microarray analysis
Specimens were obtained from five normal donors at the Department of Transfusion Medicine, National Institutes of Health (NIH) for microarray analysis as follows. All donors signed an informed consent approved by the NIH. Peripheral blood mononuclear cells (PBMC) were initially collected by leukapheresis in the Department of Transfusion Medicine (DTM) Research Clinic using the Cobe Spectra leukapheresis system (Gambro BCT, Lakewood, CO) except one donor using CS3000 plus blood cell separator (Baxter Healthcare Corp., Fenwal Division, Deerfield, IL) was used. After leukapheresis, the products were further elutriated by continuous counter-flow elutriation using the Elutra® (Gambro BCT, Lakewood, CO) with automatic mode according to the manufacturer’s recommendations. Among the five elutriation fractions produced by automatic mode, the monocyte fractions were obtained with the rotor-off and with CD14+ cells purity of 84.2% ± 7.6 (79 – 96%) confirmed by FACS analysis.
Cell surface expression of chemokine receptors on ascitic and blood MO/MA
Cell surface expression of the inflammatory chemokine receptors, CCR1, CCR5 and CXCR4 was determined on column purified MO or MO/MA from anonymized normal buffy coat blood samples obtained from the blood bank and EOC patients’ blood and ascites by established methods [13, 21]. Briefly, cells were suspended in PBS + 2% FBS + 0.02% NaN3 and then divided into several tubes. All cells (except those for isotype controls) were labeled with FITC-conjugated CD14 (Becton Dickinson, Cat. # 347493) and one of the following labeled primary antibodies: PE-Conjugated CCR1 (R&D Systems, FAB145P), CCR5 (CD195) (BD Biosciences Pharmingen, Cat. # 555993), or CXCR4 (CD184) (BD Biosciences Pharmingen, Cat. # 555974). Cells were then incubated for 30 min at room temperature. After one wash with the FACS buffer, the cells were fixed with 1% Paraformaldehyde and then read on a FACScan (Becton Dickinson). Data was analyzed using BD CellQuest Pro Version 5.2 software. P values were determined from ANOVA models. The Tukey procedure was used to adjust for multiple comparisons [22].
MO/MA Migration assays
The migration ability of MO/MA purified from peripheral blood samples from buffy coat specimens of normal donors and patients with EOC, and MO/MA from ascites was determined and compared as follows. A transwell migration assay was utilized to test MO chemotaxis in response to two ligands, one reactive with CCR1/RANTES (CCL5) and the other with CXCR4 (SDF1).
The transwell migration assays were performed with the ChemoTx System (Neuro Probe, Gaithersburg, MD), in which each well of a 96-well plate contains 29 μl of RPMI with 10% fetal bovine serum plus chemokines and is covered with an 8 mm2 filter with 8-μm pores after initial experimentation. Cells (2 × 10⁵ in 50 μl of RPMI with 10% fetal bovine serum) were added to the upper side of the filter and the plates were incubated in humidified air at 37°C incubator for 2 h. Cells migrating to the lower chamber were then resuspended and counted with a FACScan (Becton Dickinson). For the antibody-blocking experiments, cells were incubated for 15 min with various concentrations of mAb to CCR1 (R&D Systems) before being added on top of the filter. Filters were examined in situ by inverted microscopy. Attached cells in the vicinity of the pores were infrequently detected.
Actin polymerization assays
To measure F-actin content, purified cells were treated with RANTES or SDF-1 (100 ng/mL) for 0, 15, 30, 60, 120, 300 or 600 s or left untreated and then simultaneously fixed and stained with FITC-conjugated phalloidin (Molecular Probes, Eugene, OR) as described previously [23]. The mean fluorescence intensity (MFI) of the phalloidin-FITC signal was determined by flow cytometry. The relative F-actin content (%F-actin) of each sample was determined by normalizing the sample MFI to the value for the untreated control.
Gene expression alterations in MO/MA PBMC from EOC patients and from normal donors
Flow sorted CD14+ ascitic MO/MA cells, total ascitic cells, PBMC from EOC patients, and normal donor CD14+ cells were utilized for gene expression analysis. Total RNA isolation, RNA amplification and array hybridization were performed as described previously [13, 14, 24, 25]. Custom microarrays were printed at the Immunogenetics Section, DTM, CC, NIH with a configuration of 32 × 24 × 23 and contained 17,500 elements. For a complete list of genes included in the Hs-CCDTM-17.5k-1px printing is available at our web site http://nciarray.nci.nih.gov/gal files/index.shtml.
Scanned array images were first analyzed by GenePiX pro 4.0 program and then uploaded to mAdb database (http://nciarray.nci.nih.gov/). Data were normalized using lowess smoother method, and spots with intensity lower than 300 or flagged were excluded from analysis using BRB array tool (http://linus.nci.nih.gov/∼brb/download.htm). Class comparison were performed between two CD14+ cell samples from EOC ascitic (MO/MA) and five CD14+ purified cell samples from normal donor peripheral blood (MO) with P value cut off <0.005 and ratio change >2 symetrically around zero.
Additional array data were obtained from unseparated ascitic cells of three EOC patients, PBMC of eight EOC patients and from the purified MO/MA of two EOC patients. This experiment was performed for data visualization to demonstrate differential expression of genes identified in EOC MO/MA compared to normal donor MO. Statistical analysis was not done on these samples due to the inclusion of mixed cell populations.
Results
Chemokine receptor expression on isolated CD14+ cells
We first examined the chemokine receptor expression on purified CD14+ cells isolated from the blood of three normal donors and ascites from seven patients and blood from four patients with EOC. Blood and ascites samples were matched from three of the four patients. The eight EOC patients who provided blood or ascites had stage III or IV disease with papillary serous components and all were chemotherapy naïve.
Mean fluorescence intensity (MFI) values for CCR1, CCR5 and CXCR4 on purified CD14+ cells are shown in Table 1. For these experiments, we obtained purified CD14+ MO/MA from ascites by negative selection with immunomagnetic isolation kits. CCR1, CCR5, and CXCR4 were expressed on blood and ascites MO/MA isolated from EOC patients. Mean MFI levels for CCR1 on EOC blood and ascitic MO/MA were two times above that of normal MO/MA (P = 0.04). Mean CCR5 MFI values were not significantly different for normal donor blood, ascitic MO/MA, and EOC blood MO. Mean CXCR4 MFI values were three times higher than blood of normal and of EOC patients (P = 0.005) compared to ascitic MO/MA. Representative histograms show expression of CCR1, CCR5 and CXCR4 on purified CD14+ MO/MA obtained from ascites and a normal donor is shown (Fig. 1). We next examined the migration patterns of purified MO isolated from blood or ascites of patients with EOC and compared their responses to normal donor blood MO. These cells were tested for chemotaxis in response to the chemokine RANTES (the ligand for both CCR1 and CCR5 in a transwell migration assay. The chemokines used in these assays are commonly found in EOC patients. To determine whether this inability to migrate was specific to the pathways for CCR1 and CCR5, we also tested the migration of these cells in response to SDF-1 (the ligand for CXCR4). Purified MO from the normal donors migrated in a dose-dependent manner, but MO from ascites did not (Fig. 2), even though these cells expressed CCR1, CCR5, and CXCR4. The migration of monocytes to RANTES (CCL5) is blocked by anti-CCR1 antibody. Pre-incubating cells with CCR1 antibody can interfere with the migration of monocytes to RANTES (CCL5) (data not shown), suggesting that migration is mediated through CCR1, although CCR5 is expressed on these cells and share the same ligands.
Table 1.
The mean fluorescence intensity (MFI) for chemokine receptors CCR1, CCR5 and CXCR4 expressed on purified CD14+ cells in blood and ascites of patients and buffy coats (BC1-3) of normal donors
| ID | Sample type | CCR1 | CCR5 | CXCR4 |
|---|---|---|---|---|
| BC1 | Blood | 36.7 | 25.6 | 185.0 |
| BC2 | Blood | 38.6 | 30.5 | 120.3 |
| BC3 | Blood | 34.6 | 22.1 | 156.4 |
| Mean ± SD | 36.6 ± 2 | 26.1 ± 4.2 | 153.9 ± 32.4 | |
| 276 | Ascites | 89.9 | 45.1 | 128.9 |
| 278 | Ascites | 63.8 | 65.9 | 34.9 |
| 287 | Ascites | 68.9 | 42.68 | 41.9 |
| 290 | Ascites | 74.9 | 57.5 | 47.3 |
| 300 | Ascites | 97.6 | 78.4 | 57.8 |
| 301 | Ascites | 63.1 | 2.8 | 10.8 |
| 302 | Ascites | 86.2 | 74.1 | 53.6 |
| Mean ± SD | 77.8 ± 13.6 | 52.4 ± 25.7 | 53.6 ± 36.6 | |
| 297 | Blood | 104.8 | 35.6 | 190.0 |
| 300 | Blood | 81.7 | 40.7 | 129.1 |
| 301 | Blood | 24.3 | 20.5 | 97.7 |
| 302 | Blood | 85.1 | 39.2 | 269.4 |
| Mean ± SD | 74.0 ± 34.6 | 34.0 ± 9.3 | 171.6 ± 75.7 | |
| P values | 0.04 | 0.15 | 0.005 |
BC anonymized buffy coat donors
Fig. 1.

Expression of chemokine receptor proteins on MO/MA. Representative histograms showing chemokine receptor expression on ascites (left panel) from patient 290 and normal donor (right panel). Dotted line isotype control; solid line chemokine receptor of interest
Fig. 2.

Transwell migration of ascitic MO/MA and normal donors. Purified monocytes from patients and normal donors were added to the upper chamber, while RANTES or SDF-1 were added to the lower chamber at the indicated concentrations. Migration is shown as cell count/μl in the lower chamber after subtraction of background migration to control medium. Data shown are the mean of three independent experiments
Figure 3 shows that paired blood and ascites samples from EOC patients overall exhibited impaired migration behavior. Overall, zero of eight independent ascites MO/MA migrated and one of four EOC blood MO showed some migration. By contrast, four of four normal donor MO migrated.
Fig. 3.

Transwell migration of ascitic MO/MA and blood MO from EOC patients. Purified MO/MA from the ascites (left panel) and blood MO (right panel) of the same EOC patients were added to the upper chamber, while RANTES or SDF-1 were added to the lower chamber at the indicated concentrations. Migration is shown as cell count/ul in the lower chamber after subtraction of background migration to control medium. The data are the mean of three independent experiments
Reasoning that the kinetics of actin organization may be different in MO from normal donors versus those from EOC blood or ascites, we next tested the ability of RANTES and SDF-1 to reorganize the actin cytoskeleton in those cells. Both chemokines induced F-actin polymerization in normal MO at 100 ng/ml, the dose producing an optimal response in the migration experiment (Fig. 4). Four independent polymerization–depolymerization experiments were conducted with MO/MA isolated from ascites of EOC patients. These experiments were difficult to quantitate because of lack of uniformity in the actin polymerization and relaxation phases to either RANTES or to SDF1. However, visual examination of the chemokine stimulated polymerization results in Fig. 4 shows that ascites MO/MA in comparison to normal donor 2 and 3, exhibited a lower response or delayed peak time to SDF-1 in four of four patients and to RANTES in two of four patients. Ascites MO/MA also exhibited a delayed relaxation time to SDF-1 in three or four patients and to RANTES in one of four patients.
Fig. 4.
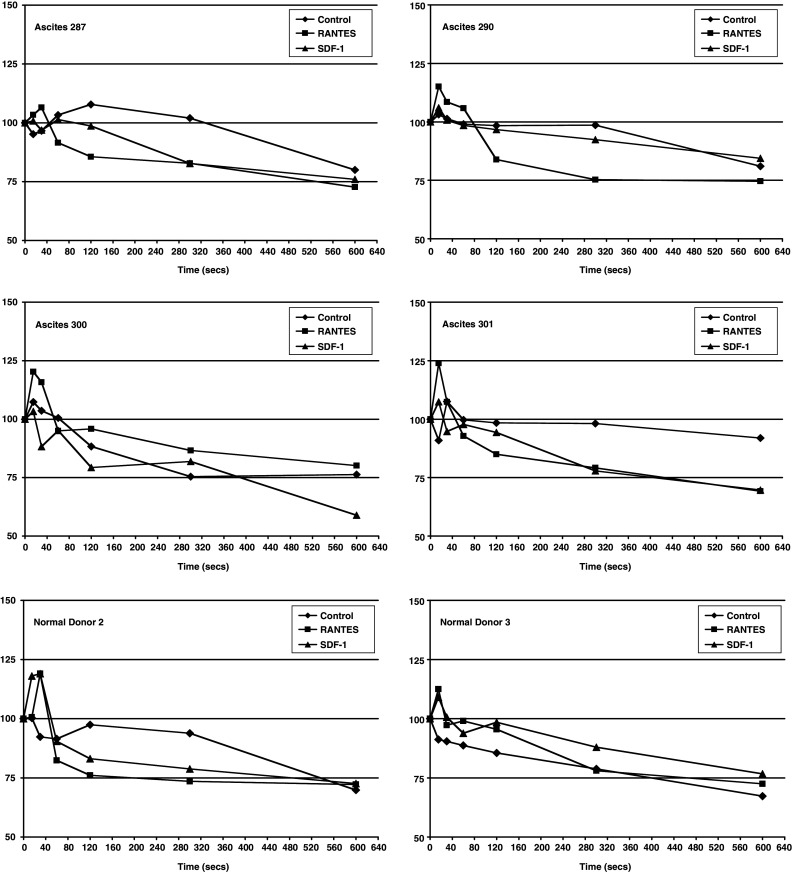
Actin polymerization of ascitic MO/MA and normal donor MO. Purified cells were labeled with anti-CD14-PE. Chemokine RANTES or SDF-1 (100 ng/ml) was added to the cells with stain/fix solution at various timepoints. Cells were then incubated at 37°C for 10 min and resuspended in 1% paraformaldehyde. Flow cytometry was used to determine mean fluorescence intensity (MFI) of Phalloidin-FITC in CD14-PE positive population. Ascites # 301 shows a visual pattern similar to the two normal donors. By contrast, other samples, best shown in 290, demonstrate lower polymerization peaks to either chemokine or a delay in the relaxation (depolymerization phase). Y axis, relative F-actin content
In order to explore the observations further, we analyzed gene expression changes by comparing results from CD14+ cells obtained from EOC patient ascites (n = 2) and CD14+ cells from normal donors (n = 5). Unpaired two sample t test using BRB array tool identified 1,500 genes differentially expressed between those phenotypes with significance (P < 0.005) and ratio fold change >2 symmetrically. Among them, genes associated with cell migration function or pathways were selected as illustrated in Fig. 5. Differentially expressed chemokines and their receptors which could facilitate MO/MA maturation and migration are summarized in Fig. 5 as well. To further determine whether the gene expression alterations observed in MO/MA isolated from ascites and MO in normal PBMC could possibly be due to a tumor related signature, we examined the expression of these genes in 14 additional array data sets, including three generated from unseparated ascitic cells and 8 from PBMC of EOC patients. This result revealed a similar gene expression signature based on genes identified from purified CD14+ cells notwithstanding that neither the whole ascites cell population nor PBMC from EOC patients were experimentally enriched for CD14+ cell. These results add support to our observation that MO/MA obtained from untreated EOC patients exhibit a dysfunctional state, both systemically and locally as compared to normal subjects (Fig. 6). Since genes were centered using all experiments which compensate and diminish the differences between purified and unpurified samples, the heatmap (Fig. 6) looks different from the direct comparison (Fig. 5) and yet, the differentially expressed genes from EOC patients are in the same direction independently of sample purity, suggesting a malignancy specific signature for the ascitic MO/MA and PBMC from EOC patients.
Fig. 5.

Differential gene expression analysis between EOC MO/MA and normal donor MO. Two sample t test using BRB array tool identified 1,500 genes differentially expressed between those phenotypes with significance (P < 0.005) and ratio fold change >2 symmetrically. Among them, genes associated with cell migration function or pathways were selectively illustrated. Differentially expressed chemokines and their receptors were color coded. Red indicates up-regulation in EOC MO/MA; green represents down-regulation in EOC MO/MA; and black represents no change
Fig. 6.

Validation of differentially expressed genes between EOC MO/MA and donor MO. Differentially expressed genes identified in Fig. 5 were used for visualization with addition of three unpurified ascites samples and eight PBMC samples from EOC patients. Genes were centered based on EOC and donor phenotype
Discussion
There is general agreement that MO/MA isolated from malignant ascites or solid tumors of EOC patients are major contributors to the tumor microenvironment of EOC. A number of studies, including our own, have employed ascitic MO/MA to examine immunity and inflammation in the EOC tumor environment.
We have shown here that in comparison to normal blood MO, ascitic MO and blood MO of EOC patients exhibited a defect in their migration responses to chemokine ligands, which are typically found at elevated levels in the ascites and solid tumor environment of EOC. Notwithstanding the increased MFI levels of CCR2, CCR5, and CXCR4 detected on ascitic MO/MA, in comparison to that of normal donors, migration response of ascitic RANTES was impaired. Similar results were observed with most EOC blood MO samples. Moreover, median MFI for CXCR4 on normal and EOC blood MOA were similar, although the migration responses to SDF1 were impaired in the EOC patient MO samples. Our current results at first appear to be counterintuitive. Considering that the actin assembly might be affected, we also studied the F-actin polymerization–depolymerization and found that both ascitic and blood MO/MA exhibited defective patterns that were often different from that of normal MO/MA.
We have previously employed differential gene expression utilizing a validated cDNA microarray platform to examine the pathway alterations in EOC [14]. Here differential gene expression profiles of ascitic MO/MA from EOC patients were compared with results of normal donors (Fig. 5) and to transcript patterns on PBMC isolated from the blood of EOC patients (Fig. 6). As shown in Fig. 5, a number of genes related to chemokine receptors and chemokine ligands as well as to cell migration were significantly altered in cDNAs from column purified CD14+ ascitic MO/MA as compared to purified normal blood MO. Amongst the chemokine ligands, CXCL8, CXCL1, CXCL4, CCL2, CCL3, CCL7 were upregulated, whereas CCL11, CCL23, CXCL2, CXCL7, CXCL10, and CXCL12 were downregulated. At the receptor level, CCR1, CCR2, CCR3, CXCR3, CXCR4 were neither increased nor decreased statistically. Consistent with our in vitro migration results, a number of other genes associated with cell migration and adherence were found to be down-regulated (Fig. 5, Supplemental Table 1). Among these, catenin beta 1, a molecule for cell adhesion and motility, has been reported significantly decreased in stage 3 and 4 ovarian cancer compared with stage 1 and 2 tumors [26]. Interestingly, SDF1 (CXCL12), ligand for CXCR4, a strong mediator of chemotaxis and leukocyte transendothelial migration, was significantly down-regulated in CD14+ MO/MA from EOC patients compared to that of normal donors, although increased expression of this protein has been detected in EOC, most likely produced by tumor cells [27]. MO/MA migration defects might involve multiple genes including the possibility of gene deletion or mutation. Since multiple pathways are involved in focal adherence and migration, alterations of genes involved with these pathways could critically influence these functions and contribute to accumulation of MO/MA in the tumor environment, providing support for tumor progression and immune escape processes [13, 28]. Down-regulated genes also appear to involve both ascitic MO/MA and PBMC of EOC patients, suggesting a broad systemic effect (Fig. 6).
The processes of attachment, transendothelial migration and subsequent motility involve complex gene interactions and multiple pathways. Normal MO in culture demonstrates protrusions called lamellipodia or exhibit spikes, comprised of actin and myosin-2. Recent papers have shed more light on the actin-myosin system [29, 30]. The actin apparatus may communicate with the microtubule system which is involved with cell functions including phagocytosis. The protrusion, attachment and motility of the cells is governed by complex physiochemical processes involving polymerization of F-actin to monomeric G-actin at the forward part of the lamellipodia. The polymerization process then moves backwards toward the base of the lamellipodium. The attachment of the actin bundles to the cytoskeleton produces a protruding force aided by involvement with integrins and also contributed to by myosin-2 at the base of the lamellipodia SC, which serves as the motor. The contraction phase is followed by a disassembly of the actin filaments, consequent on depletion of actin stabilizing ADF/cofilin making available free actin for polymerization. LMK1 is an important gene for regulating ADF/cofilin.
A number of gene pathways involved are initiated by cytokine or growth-factor stimulation and ECM-integrin interaction at the cell surface. In transendothelial migration, the integrin-CAM, chemokine-receptor interactions lead to activation of the ROCK and the PI3K genes which are involved in phosphorylating numerous proteins and guanine nucleotide exchange factors for Rho GTPases. Genes, including ROCK, actinin, PAK, MLCP and MLCK contribute to focal adhesion actin polymerization and the actomyosin contraction assembly. Other genes involved in actin polymerization in leukopodia include Arp2/3, NAP125, and ABI2 as well as TMSB4. Actinin is important since it contributes to the binding of actin to the membrane. It is therefore apparent that disruption of almost any of these pathways might lead to disturbances in adhesion, lamellopodia formation and motility and phagocytosis.
Our cDNA profiling results show that a number of genes involved with focal adhesion or leukocyte transendothelial migration or the actin cytoskeleton function were down-regulated in ascitic MO/MA (Supplemental Table 1). These include: the cytoskeletal protein vinculin—anchors F-actin to cytoskeleton; extracellular matrix protein lamalin alpha4 (LAMA4); phosphoinosotide 3 kinase (PI3K)—phosphorylates many pathway proteins; beta catenin—anchors actin to cytoskeleton; myeloid lymphoid translocated to 4 (MLLT4), catalytic gamma polypeptide, protein kinase C, protein kinase C gamma—phosphorylates a wide array of proteins in signaling pathways, including those involved with calcium signaling, thrombospondin 4, TXK tyrosine kinase, VEGF and other genes related to adhesion. In contrast, others involved with macrophage pro-tumor activities, such as invasion, e.g. MMP2 and MMP9, were up-regulated (Supplemental Table 2). We had previously noted that the morphology of ascitic and EOC blood MO/MA were smaller and rounder as compared to normal blood monocytes [13] and that these cells were deficient in ADCC and phagocytosis. In contrast, normal MO in culture demonstrate lamellopodia and filopodia spikes.
The following might possibly explain how large numbers of MO/MA could accumulate in the peritoneum and ascites of EOC patients. MO/MA might first attach to the endothelial cells of the vast peritoneal capillary network, and after passing into the stroma, accumulate in proximity to the mesothelial surface of the peritoneum. We have previously observed a dense accumulation in the submesothelial stroma of EOC patients [2]. Given their large numbers and the single layer of cells separating them from the peritoneal cavity, there is no clear barrier to the movement of these cells.
The surface area of the peritoneum and serosa of the intestines covers a vast area. The extensive capillary network of the peritoneum is clearly observed at abdominal surgery and microscopically confined in patients with advanced EOC [2, 28]. We previously documented increased expression of genes encoding endothelial adhesion molecules, such as VCAM1 and E-CAMs, in the peritoneum of EOC patients [14]. Such changes were also apparent at the transcript level in purified MO/MA examined in the current study. Activation of these genes might contribute to attachment of MO/MA to endothelial cells in the peritoneal stroma. Enhanced production of IL8 (CXCL8) by tumor cells or leukocytes, such as MO/MA and certain T cells [2], might also contribute to capillary permeability and might also interfere with the functions of the tight junctions of endothelial cells or the mesothelial cells lining the peritoneal cavity. CXCL8 is upregulated in ascitic MO/MA [2] and in the peritoneum of EOC (Fig. 5). In addition, products of eicosanoid and arachidonic acid pathway, such as prostaglandins, prostacyclins, thromboxanes, and leukotrienes, may contribute to increased capillary permeability. We have recently shown that eicosanoid products are increased in the peritoneum and tumor of EOC patients [28]. Thus a number of factors, aside from chemokine induced migration, might contribute to large accumulations of MO/MA in the tumor environment of EOC. Moreover, a defect in migration behavior might interfere with the egress of MO/MA from the peritoneal cavity.
A prevailing view is that tumor “polarized” MO/MA contribute to a pro-tumor environment and accumulate at the tumor site, probably utilizing a number of different mechanisms. It is therefore possible that changing the dynamics of this population might be a difficult challenge, although anticancer agents such as trabectedin may both target tumor cells and reduce the numbers and functions of systemic MO [31]. Another approach is a strategy designed to enhance anti-tumor properties of effector cells, such as ADCC or phagocytosis. Impaired ADCC or phagocytosis might potentially be reversed or enhanced by exploiting novel antibody constructs that facilitate binding to low affinity non-inhibitory Fc receptors [32].
Electronic supplementary material
Below is the link to the electronic supplementary material.
References
- 1.Piccart M, Bertelsen K, Stuart G, Cassidy J, Mangioni C, Simonsen E, James K, Kaye S, Vergote I, Blom R, Grimshaw R, Atkinson R, Swenerton K, Trope C, Nardi M, Kaern J, Tumolo S, Timmers P, Roy J-A, Lhoas F, Lidvall B, Bacon M, Birt A, Andersen J, Zee B, Paul J, Pecorelli S, Baron B, McGuire W. Long-term follow-up confirms a survival advantage of the paclitaxel-cisplatin regimen over the cyclophosphamide-cisplatin combination in advanced ovarian cancer. Int J Gynecol Cancer. 2003;13(Suppl 2):144–148. doi: 10.1111/j.1525-1438.2003.13357.x. [DOI] [PubMed] [Google Scholar]
- 2.Wang X, Deavers M, Patenia R, Bassett RL, Mueller P, Ma Q, Wang E, Freedman RS. Monocyte/macrophage and T-cell infiltrates in peritoneum of patients with ovarian cancer or benign pelvic disease. J Trans Med. 2006;4:30. doi: 10.1186/1479-5876-4-30. [DOI] [PMC free article] [PubMed] [Google Scholar]
- 3.Mantovani A, Sozzani S, Locati M, Allavena P, Sica A. Macrophage polarization: tumor-associated macrophages as a paradigm for polarized M2 mononuclear phagocytes. Trends Immunol. 2002;23(11):549–555. doi: 10.1016/S1471-4906(02)02302-5. [DOI] [PubMed] [Google Scholar]
- 4.Balkwill F, Ward B, Moodie E. Therapeutic potential of tumor necrosis factor-α and r-interferon in experimental human ovarian cancer. Cancer Res. 1987;47:4755–4758. [PubMed] [Google Scholar]
- 5.Colombo MP, Mantovani A. Targeting myelomonocytic cells to revert inflammation-dependent cancer promotion. Cancer Res. 2005;65(20):9113–9116. doi: 10.1158/0008-5472.CAN-05-2714. [DOI] [PubMed] [Google Scholar]
- 6.Balkwill FR, Mantovani A. Inflammation and cancer: back to Virchow? Lancet. 2001;357:539–545. doi: 10.1016/S0140-6736(00)04046-0. [DOI] [PubMed] [Google Scholar]
- 7.Chambers S, Kacinski B, Ivins C, Carcangiu M. Overexpression of epithelial macrophage colony-stimulating factor (CSF-1) and CSF-1 receptor: a poor prognostic factor in epithelial ovarian cancer, contrasted with a protective effect of stromal CSF-1. Clin Cancer Res. 1997;3:999–1007. [PubMed] [Google Scholar]
- 8.Kacinski B. CSF-1 and its receptor in ovarian, endometrial and breast cancer. Ann Med. 1995;27:79–85. doi: 10.3109/07853899509031941. [DOI] [PubMed] [Google Scholar]
- 9.Xu FJ, Ramakrishnan S, Daly L, Soper JT, Berchuck A, Clarke-Pearson D, Bast RCJ. Increased serum levels of macrophage colony-stimulating factor in ovarian cancer. Am J Obstet Gynecol. 1991;165:1356–1362. doi: 10.1016/0002-9378(91)90368-2. [DOI] [PubMed] [Google Scholar]
- 10.Price F, Chambers S, Chambers J, Carcangiu M, Schwartz P, Kohorn E, Stanley E, Kacinski B. Colony-stimulating factor-1 in primary ascites in ovarian cancer is a significant predictor of survival. Am J Obstet Gynecol. 1993;168:520–527. doi: 10.1016/0002-9378(93)90485-2. [DOI] [PubMed] [Google Scholar]
- 11.Kassim SK, El-Salahy EM, Fayed ST, Helal SA, Helal T, Azzam E-D, Khalifa A. Vascular endothelial growth factor and interleukin-8 are associated with poor prognosis in epithelial ovarian cancer patients. Clin Biochem. 2004;37(5):363–369. doi: 10.1016/j.clinbiochem.2004.01.014. [DOI] [PubMed] [Google Scholar]
- 12.Loercher AE, Nash MA, Kavanagh JJ, Platsoucas CD, Freedman RS. Identification of an IL-10 producing HLA-DR-negative monocyte subset in the malignant ascites of patients with ovarian carcinoma that inhibits cytokine protein expression and proliferation of autologous T cells. J Immunol. 1999;163:6251–6260. [PubMed] [Google Scholar]
- 13.Gordon IO, Freedman RS. Defective antitumor function of monocyte-derived macrophages from epithelial ovarian cancer patients. Clin Cancer Res. 2006;12(5):1515–1524. doi: 10.1158/1078-0432.CCR-05-2254. [DOI] [PubMed] [Google Scholar]
- 14.Wang E, Ngalame Y, Panelli MC, Nguyen-Jackson H, Deavers M, Mueller P, Hu W, Savary C, Kobayashi R, Freedman RS, Marincola FM. Peritoneal and sub-peritoneal stroma may facilitate regional spread of ovarian cancer. Clin Cancer Res. 2005;11(1):113–122. doi: 10.1158/1078-0432.CCR-04-2548. [DOI] [PubMed] [Google Scholar]
- 15.Melchers F, Rolink A, Schaniel C. The role of chemokines in regulating cell migration during humoral immune responses. Cell. 1999;99:351–354. doi: 10.1016/S0092-8674(00)81521-4. [DOI] [PubMed] [Google Scholar]
- 16.Zlotnik A, Yoshie O. Chemokines: a new classification system and their role in immunity. Immunity. 2000;12:121–127. doi: 10.1016/S1074-7613(00)80165-X. [DOI] [PubMed] [Google Scholar]
- 17.Mackay C. Chemokines: immunology’s high impact factors. Nat Immunol. 2001;2:95–101. doi: 10.1038/84298. [DOI] [PubMed] [Google Scholar]
- 18.Ma Q, Jones D, Springer T. The chemokine receptor CXCR4 is required for the retention of B lineage and granulocytic precursors within the bone marrow microenvironment. Immunity. 1999;10(4):463–471. doi: 10.1016/S1074-7613(00)80046-1. [DOI] [PubMed] [Google Scholar]
- 19.Schutyser E, Struyf S, Proost P, Opdenakker G, Laureys G, Verhasselt B, Peperstraete L, Van de Putte I, Saccani A, Allavena P, Mantovani A, Van Damme J. Identification of biologically active chemokine isoforms from ascitic fluid and elevated levels of CCL18/pulmonary and activation-regulated chemokine in ovarian carcinoma. J Biol Chem. 2002;277(27):24584–24593. doi: 10.1074/jbc.M112275200. [DOI] [PubMed] [Google Scholar]
- 20.Negus RP, Stamp GW, Relf MG, Burke F, Malik ST, Bernasconi S, Allavena P, Sozzani S, Mantovani A, Balkwill FR. The detection and localization of monocyte chemoattractant protein-1 (MCP-1) in human ovarian cancer. J Clin Invest. 1995;95(5):2391–2396. doi: 10.1172/JCI117933. [DOI] [PMC free article] [PubMed] [Google Scholar]
- 21.Freedman RS, Tomasovic B, Templin S, Atkinson EN, Kudelka A, Edwards CL, Platsoucas CD. Large-scale expansion in interleukin-2 of tumor-infiltrating lymphocytes from patients with ovarian carcinoma for adoptive immunotherapy. J Immunol Meth. 1994;167:145–160. doi: 10.1016/0022-1759(94)90084-1. [DOI] [PubMed] [Google Scholar]
- 22.Tukey JW (1951) Reminder sheets for “Discussion of paper on multiple comparisons by Henry Scheffe.” In: The collected works of John W Tukey VIII: multiple comparisons: 1948–1983ed. Chapman Hall, London pp 469–475
- 23.Kim CH, Broxmeyer HE. In vitro behavior of hematopoietic progenitor cells under the influence of chemoattractants: stromal cell-derived factor-1, steel factor, and the bone marrow environment. Blood. 1998;91(1):100–110. [PubMed] [Google Scholar]
- 24.Wang E. RNA amplification for successful gene profiling analysis. J Trans Med. 2005;3:28. doi: 10.1186/1479-5876-3-28. [DOI] [PMC free article] [PubMed] [Google Scholar]
- 25.Wang E, Miller L, Ohnmacht GA, Liu E, Marincola FM. High fidelity mRNA amplification for gene profiling. Nat Biotechnol. 2000;18:457–459. doi: 10.1038/74546. [DOI] [PubMed] [Google Scholar]
- 26.Imai T, Horiuchi A, Shiozawa T, Osada R, Kikuchi N, Ohira S, Oka K, Konishi I. Elevated expression of E-cadherin and alpha-, beta-, and gamma-catenins in metastatic lesions compared with primary epithelial ovarian carcinomas. Hum Pathol. 2004;35(12):1469–1476. doi: 10.1016/j.humpath.2004.09.014. [DOI] [PubMed] [Google Scholar]
- 27.Scotton CJ, Milliken D, Wilson J, Raju S, Balkwill FR. Analysis of CC chemokine and chemokine receptor expression in solid ovarian tumours. Br J Cancer. 2001;85(6):891–897. doi: 10.1054/bjoc.2001.2020. [DOI] [PMC free article] [PubMed] [Google Scholar]
- 28.Freedman RS, Wang E, Voiculescu S, Patenia R, Bassett RL, Deavers M, Marincola FM, Yang P, Newman RA. Comparative analysis of peritoneum and tumor eicosanoids and pathways in advanced ovarian cancer. Clin Cancer Res. 2007;13(19):5736–5744. doi: 10.1158/1078-0432.CCR-07-0583. [DOI] [PubMed] [Google Scholar]
- 29.Giannone G, Dubin-Thaler BJ, Rossier O, Cai Y, Chaga O, Jiang G, Beaver W, Dobereiner HG, Freund Y, Borisy G, Sheetz MP. Lamellipodial actin mechanically links myosin activity with adhesion-site formation. Cell. 2007;128(3):561–575. doi: 10.1016/j.cell.2006.12.039. [DOI] [PMC free article] [PubMed] [Google Scholar]
- 30.Schaub S, Meister JJ, Verkhovsky AB. Analysis of actin filament network organization in lamellipodia by comparing experimental and simulated images. J Cell Sci. 2007;120(Pt 8):1491–1500. doi: 10.1242/jcs.03379. [DOI] [PubMed] [Google Scholar]
- 31.Sessa C, De Braud F, Perotti A, Bauer J, Curigliano G, Noberasco C, Zanaboni F, Gianni L, Marsoni S, Jimeno J, D’Incalci M, Dall’o E, Colombo N. Trabectedin for women with ovarian carcinoma after treatment with platinum and taxanes fails. J Clin Oncol. 2005;23(9):1867–1874. doi: 10.1200/JCO.2005.09.032. [DOI] [PubMed] [Google Scholar]
- 32.Nimmerjahn F, Ravetch JV. Divergent immunoglobulin G subclass activity through selective Fc receptor binding. Science. 2005;310:1510–1512. doi: 10.1126/science.1118948. [DOI] [PubMed] [Google Scholar]
Associated Data
This section collects any data citations, data availability statements, or supplementary materials included in this article.