Abstract
Background
We have treated three patients with carboxy-anhydrase-IX (CAIX) positive metastatic renal cell cancer (RCC) by adoptive transfer of autologous T-cells that had been gene-transduced to express a single-chain antibody-G250 chimeric receptor [scFv(G250)], and encountered liver toxicity necessitating adaptation of the treatment protocol. Here, we investigate whether or not the in vivo activity of the infused scFv(G250)+ T cells is reflected by changes of selected immune parameters measured in peripheral blood.
Methods
ScFv(G250)-chimeric receptor-mediated functions of peripheral blood mononuclear cells (PBMC) obtained from three patients during and after treatment were compared to the same functions of scFv(G250)+ T lymphocytes prior to infusion, and were correlated with plasma cytokine levels.
Results
Prior to infusion, scFv(G250)+ T lymphocytes showed in vitro high levels of scFv(G250)-chimeric receptor-mediated functions such as killing of CAIX+ RCC cell lines and cytokine production upon exposure to these cells. High levels of IFN-γ were produced, whilst production of TNF-α, interleukin-4 (IL-4), IL-5 and IL-10 was variable and to lower levels, and that of IL-2 virtually absent. PBMC taken from patients during therapy showed lower levels of in vitro scFv(G250)-receptor-mediated functions as compared to pre-infusion, whilst IFN-γ was the only detectable cytokine upon in vitro PBMC exposure to CAIX. During treatment, plasma levels of IFN-γ increased only in the patient with the most prominent liver toxicity. IL-5 plasma levels increased transiently during treatment in all patients, which may have been triggered by the co-administration of IL-2.
Conclusion
ScFv(G250)-receptor-mediated functions of the scFv(G250)+ T lymphocytes are, by and large, preserved in vivo upon administration, and may be reflected by fluctuations in plasma IFN-γ levels.
Keywords: Immunogene therapy, Human T lymphocytes, Single chain chimeric receptor, Renal cell cancer, Clinical study
Introduction
Adoptive transfer of autologous T lymphocytes that have been gene-transduced to express antigen-specific receptors is a potentially attractive therapy to provide tumor-specific immunity to cancer patients [1–4]. We have studied safety and proof of this concept in patients with metastatic renal cell cancer (RCC) [5–7]. To this end we have constructed a single-chain antibody-type (scFv) receptor based on murine monoclonal antibody (mAb) G250 [8]. This mAb recognizes an epitope on carboxy-anhydrase-IX (CAIX) that is over-expressed by RCC cells [9]. Following retroviral introduction of the scFv(G250) transgene into primary human T-cells, the scFv(G250) receptor is expressed on the surface of these cells, which enables them to recognize CAIX and subsequently to exert antigen-specific effector functions in terms of cytokine production and killing of CAIX+ RCC cell lines [5, 10].
In a phase I study we have treated three patients with metastatic RCC with autologous scFv(G250)+ T cells and subcutaneous (s.c.) injections of low dose interleukin-2 (IL-2). Unexpectedly, liver toxicity was encountered, after which the study was temporarily put on hold [7]. Examination of liver tissue from patient 1 revealed a discrete cholangitis with T-cell infiltration around the bile ducts and CAIX expression on the bile duct epithelium. The observed liver toxicity, reflected by liver enzyme disturbances, was most likely to be due to specific interactions of the scFv(G250)+ infused T cells with CAIX+ epithelial cells lining the bile ducts.
We hypothesized that the liver toxicity reflects a specific immune reaction by the infused scFv(G250)+ T cells and expected that this reaction would be reflected in changes of immune parameters measured in peripheral blood during and after therapy. Therefore, we compared functions of the scFv(G250)+ T cells prior to and post infusion—the latter using peripheral blood mononuclear cells (PBMC) taken from the patients after infusion. We tested scFv(G250)-chimeric receptor-mediated functions, such as killing of CAIX+ RCC cell lines and cytokine production upon exposure to CAIX, and determined plasma cytokine levels.
Materials and methods
Treatment schedule
The inclusion and exclusion criteria for patients participating in this study have been reported previously [7]. The main eligibility criteria were that patients had disseminated clear cell RCC not amenable for surgery, and that the primary tumor had been removed by nephrectomy and expressed CAIX.
Autologous T lymphocytes were transduced with the scFv(G250)-chimeric receptor using retroviral transduction [11, 12]. The treatment schedule consisted of i.v. infusions of autologous scFv(G250)-transduced T-cells at escalating doses of 2 × 10⁷ cells at day 1; 2 × 10⁸ cells at day 2; 2 × 10⁹ cells at days 3–5 (treatment cycle 1) and 2 × 10⁹ cells at days 17–19 (treatment cycle 2), combined with s.c. human recombinant interleukin-2 (rIL-2, Chiron, Amsterdam), 5 × 10⁵ IU/m2 twice daily administered at days 1–10 and days 17–26. The treatment protocol had been approved by the governmental and institutional medical ethical review boards. Written informed consent was obtained from all patients.
Collection of peripheral blood mononuclear cells and plasma
Peripheral venous blood samples were drawn prior to, during and after treatment. During therapy blood was obtained prior to the first IL-2 injection unless indicated otherwise. PBMC were isolated from sodium heparin-anti-coagulated blood by Ficoll density gradient centrifugation and were cryopreserved in liquid nitrogen. Plasma was harvested from EDTA-anti-coagulated blood by centrifugation for 10 min at 1,000×g and stored at −70°C.
Flow cytometric analysis of transduced T-cell infusions and patient blood samples
The expression of the scFv(G250) receptor on transduced T-cell cultures was studied by indirect immunofluorescence using G250 anti-idiotype mAb NuH82 [10, 13]. The absolute numbers of scFv(G250)+ T-cells in the blood of patients prior to and following infusions of transduced T-cells were assessed as described [14].
Assessment of scFv(G250)-chimeric receptor-mediated functions in transduced T-cell infusions and patient blood samples
Cultures of scFv(G250)-gene modified T cells to be used for adoptive immunogene therapy, as well as patient PBMC obtained prior to and after infusion of gene-modified T cells, were monitored for scFv(G250)-chimeric receptor-mediated functions, i.e. specific cytotoxic activity and cytokine production, using the CAIX+ RCC cell line SKRC17- MW1 (clone 4) [10, 11]. A scFv(G250)-chimeric receptor-expressing T-cell clone (Clone 46) was used as positive control in these assays.
Cytotoxic activity was measured in a standard 4 h 51Cr-release assay, at 2,500 target cells per well and effector cell/target cell ratios (E/T) of 80, 40, 20, 10, 5, 2.5, 1.25 and 0.63:1. The activated kill (AK)-activity of the cultured T cells and patient PBMC was blocked by adding a 30-fold excess of non-51Cr-labelled (“cold”) AK-sensitive target cells (i.e. K562) to the test. The specificity of the scFv(G250)-mediated effector functions was verified by blocking CAIX on the target cells by adding G250 mAb (at a saturating final concentration of 25 μg/ml) to the target cells 15 min before addition of the effector cells [10, 11].
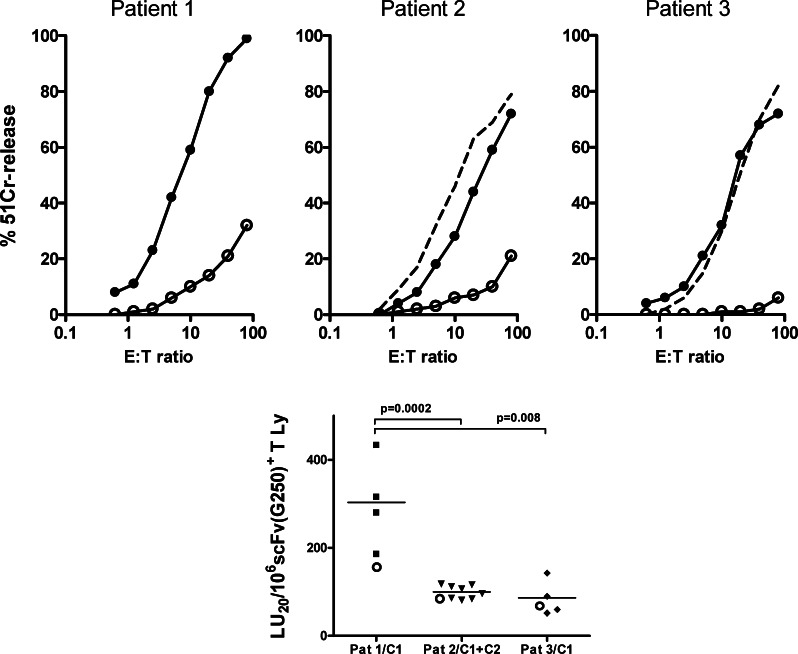
The specific cytolytic activity, i.e. specific 51Cr-release (see Fig. 1, upper panels), was expressed as LU20 per 106 T lymphocytes, in which one lytic unit (LU20) is defined as the number of effector cells required to lyse 20% of 2,500 target cells in a standard 4 h 51Cr-release test [15]. The net CAIX-specific cytolysis is defined as the level of cytolysis on CAIX+ RCC cells in the presence of cold K562 targets minus the level of cytolysis on the CAIX+ RCC cells in the presence of cold K562 targets and blocking G250 mAb.
Fig. 1.
Carboxy-anhydrase-IX-specific cytolysis by scFv(G250)-gene modified T cell cultures used for adoptive immunogene therapy. The upper panels show representative experiments from each individual patient. The results are expressed as % 51Cr-release (4 h assay) at eight effector-to-target (E:T) cell ratios. Target cell were derived from the CAIX+ RCC cell line SKRC17-MW1 clone 4, alone (dotted line, for patient #2 and #3 only), in presence of a 30-fold excess of ‘cold’ K562 cells (closed circles), and in presence of a 30-fold excess of “cold” K562 cells and 25 μg/ml (final concentration) G250mAb (open circles). The net CAIX-specific cytolysis was defined as the level of cytolysis on CAIX+ RCC cells (in the presence of cold K562 targets) minus the level of cytolysis on CAIX+ RCC cells (in the presence of cold K562 targets and blocking G250 mAb). From these data, CAIX-specific lytic units (LU20) were calculated according to Pross et al. [15]. The lower panel shows the LU20-values per 106 scFv(G250)+ T cells for the individual T-cell infusions and the mean value (horizontal line) per patient. The open circles in the lower panel indicate the positive test control results. Differences between patients were assessed by Student’s t-test (two-sided); P values ≤ 0.05 are indicated. Pat indicates patient, C indicates treatment cycle
For comparison of level of CAIX-specific activities between the T cell infusions of the individual patients the specific cytolytic activity and cytokine production were expressed per 106 scFv(G250)+ T cells. In addition, to correct for assay variation these activities were related to the positive test control.
Assessment of cytokine levels
The concentrations of IFN-γ, TNF-α, IL-2, IL-4, IL-5 and IL-10 in plasma samples and culture supernatants (see above) were determined by cytokine bead arrays (BD Biosciences, San Jose, CA, USA), according to suppliers’ specifications, and expressed in pg/ml. The detection limits of the assay were 2.6 pg/ml for IL-2 and IL-4, 2.5 pg/ml for IL-5, 2.8 pg/ml for IL-10 and TNF-α and 7.1 pg/ml for IFN-γ. Cytokine production by scFv(G250)-gene modified T cells was expressed as ng cytokine produced by 106 T cells per 24 h.
Assessment of transgene copy number by quantitative real-time PCR
Genomic DNA was isolated from aliquots of the transduced T-cell infusions and from blood taken prior to, during and after therapy using the QIAamp® DNA mini kit (Qiagen, Hilden, Germany). The quantitative real-time PCR was performed as described [14], and data is presented as number of scFv(G250) DNA copies per μl of blood.
Results
Liver toxicity following scFv(G250)+ T cell infusions
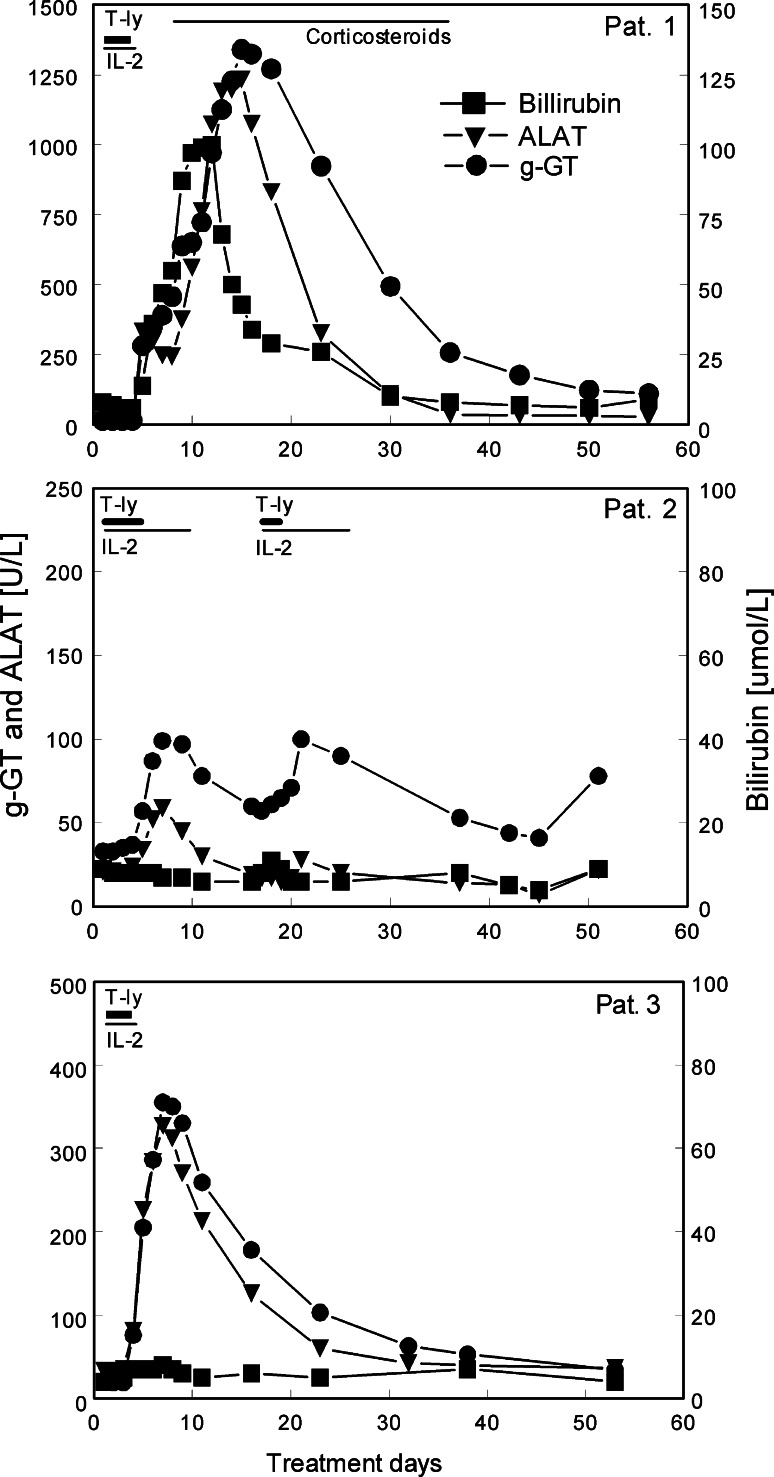
The three patients initially tolerated the infusions of the gene-modified T-cells well. However, following four to five infusions liver enzyme disturbances developed, reaching CTC grade 4 in patient 1, grade 2 in patient 2 and grade 3 in patient 3 (Fig. 2). The severe liver toxicity in patient 1 also included elevated levels of bilirubin. The severity of the liver toxicity was less during the second treatment cycle than during the first in patient 2. These toxicities required cessation of treatment in patients 1 and 3, corticosteroid treatment for patient 1 and reduction of the maximal T-cell dose to 2 × 10⁸ total T-cells per infusion in patients 2 and 3.
Fig. 2.
Kinetics of liver enzyme disturbances in the three patients before, during and following treatment with scFv(G250)+ T-cells. Treatment intervals are indicated by horizontal bars; T-ly, daily infusions of retargeted T lymphocytes; IL-2, 0.5 × 10⁶ IU rIL-2 s.c. every 12 h; Corticosteroids, i.v. solumedrol (days 8–10) and oral prednisolon (days 11–36). Treatment was stopped at day 5 after the 4th T-cell infusion in patient 1 and patient 3. Patient 2 received eight T-cell infusions as per protocol. For each patient, different linear scales were used for the y-axes in order to improve legibility of the panels
Characteristics of transduced T-cells immediately prior to infusion
The ex vivo generation of gene-modified T-cells was highly successful [11, 12]. The proportions of scFv(G250)+ T cells among the infused T cells were 53% for patient 1, 52% and 76 % for patient 2 (treatment cycle 1 and 2, respectively), and 63% for patient 3. Due to the reduced numbers of infused T-cells and early cessation of treatment in patients 1 and 3, the total number of infused scFv(G250)+ T-cells varied widely between patients, namely 2.13 × 10⁹ cells for patient 1, 0.85 × 10⁹ cells for patient 2 and 0.38 × 10⁹ cells for patient 3 [7].
In vitro screening of gene-modified T-cells prior to infusion demonstrated high levels of scFv(G250)-mediated cytolysis of a CAIX+ RCC cell line (Fig. 1, upper panels). The CAIX-specific cytolytic activity of the scFv(G250)+ T-cells of patient 1 [i.e. median value 372 (range 186–433) LU20 per 106 scFv(G250)+ T cells] was significantly higher than those of patient 2 [i.e. 93 (81–116) LU20 per 106 cells] and patient 3 [i.e. 88 (51–143) LU20 per 106 cells]. This pattern was also observed when test results were corrected for between-test variation (Fig. 1, lower panel). As a result, the total scFv(G250)-mediated cytolytic capacities of the T-cell infusions varied widely between patients, i.e. 792,204 LU20 for patient 1, 78,774 LU20 for patient 2 and 33,274 LU20 for patient 3 [7].
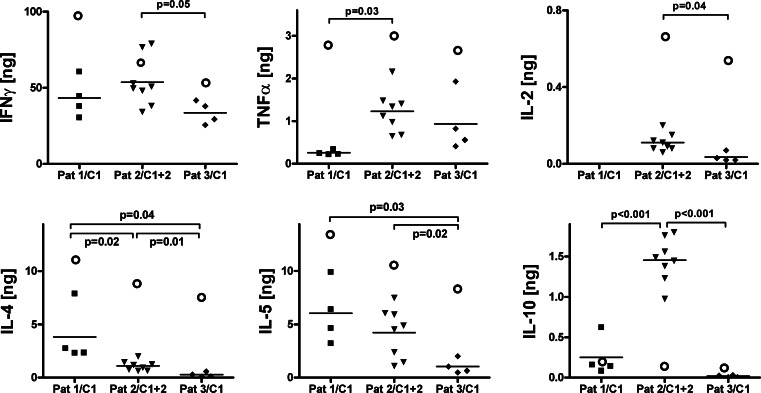
Upon stimulation with CAIX+ RCC cells, the scFv(G250)+ T-cells of individual patients showed a characteristic cytokine production pattern (Table 1 and Fig. 3). All T-cell cultures produced predominantly IFN-γ [ranging between the patients from 36.9 to 55.9 ng IFNγ per 106 scFv(G250)+ T cells during 24 h], and to lower levels, IL-5 (ranging from 1.2 to 5.4 ng) and IL-4 (ranging from 0.3 to 2.9 ng). Only low levels of TNF-α, IL-2 and IL-10 were produced, although scFv(G250)+ T cells of patient 2 produced relatively high amounts of IL-10. These patterns were also observed when test results were corrected for between-test variation (not shown). In the absence of CAIX-triggered stimulation, scFv(G250)+ T-cells showed no detectable levels of spontaneous cytokine production (data not shown).
Table 1.
Carboxy-anhydrase-IX-specific cytokine production capacity of infused scFv(G250)+ T cells
| Cytokine | Patient 1 | Patient 2 | Patient 3 |
|---|---|---|---|
| IFN-γ | 42.0 | 55.9 | 36.9 |
| TNF-α | 0.3 | 1.4 | 1.1 |
| IL-2 | nt | 0.1 | 0.0 |
| IL-4 | 2.9 | 1.3 | 0.3 |
| IL-5 | 5.4 | 4.9 | 1.2 |
| IL-10 | 0.1 | 1.5 | 0.0 |
Cytokine production capacity: ng per 106 scFv(G250)+ transduced T cells per 24 h
Total number of infused scFv(G250)-transduced T cells: patient 1: 2.13 × 10⁹, patient 2: 8.45 × 10⁸, patient 3: 3.79 × 10⁸
nt not tested
Fig. 3.
Carboxy-anhydrase-IX-specific cytokine production (IFN-γ, TNF-α, Il-2, IL4, IL-5 and IL-10) by scFv(G250)-gene modified T-cells in the individual T cell infusions, expressed as the net amount [ng] of cytokine produced by 106 scFv(G250)+ T cells during 24 h of co-cultivation with the CAIX+ RCC cell line SKRC1-MW1 clone 4. For each cytokine, different linear scales were used for the y-axes in order to improve legibility of the panels. See further legend to Fig. 1
As a consequence of the widely different numbers of infused scFv(G250)+ T cells between patients, the calculated capacity of scFv(G250)-mediated IFN-γ production of the infused gene-modified T-cells ranged between 89.5 μg of IFN-γ per 24 h for patient 1, 47.2 μg for patient 2 and 14.0 μg for patient 3.
Monitoring of peripheral blood samples
The treatment episodes were associated with transient lymphopenia in all three patients, probably due to the co-administered rIL-2. Circulating T-cell numbers decreased immediately upon start of therapy to reach a nadir at approximately 50% of baseline values on day 4, to normalize again when treatment was stopped (not shown).
Circulating scFv(G250)+ T-cells and scFv(G250) DNA copies
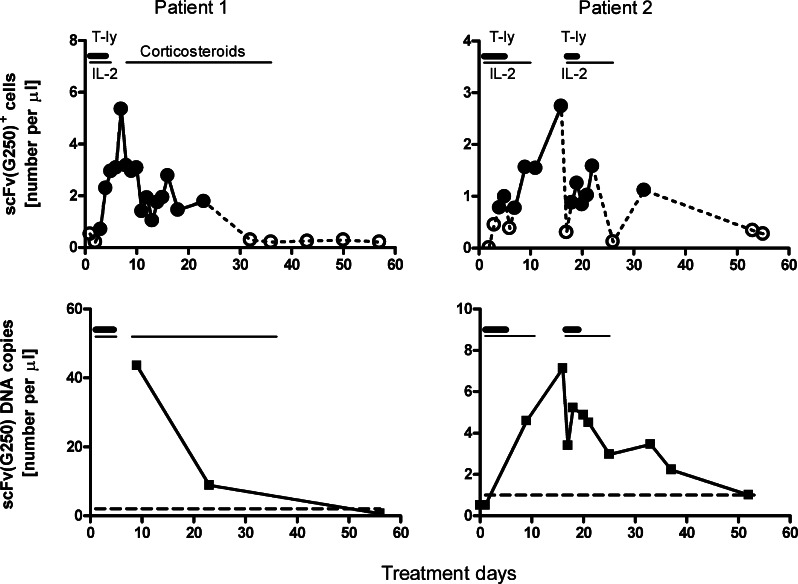
ScFv(G250)+ T-cells became transiently detectable in the circulation of all three patients from day 3 of therapy onwards, and reached maximum levels between days 6 and 16 (Fig. 4, upper panels, and [14]). Their peak levels during the first therapeutic cycle were higher in patient 1 [5.3 scFv(G250)+ T cells/μl] than in patient 2 (2.6 and 1.6 cells/μl in treatment cycle 1 and 2, respectively) and patient 3 (0.8 cells per μl), which were proportional to the numbers of scFv(G250)+ T-cells administered (see above). In parallel scFv(G250)-encoding DNA became transiently detectable in the circulation of all three patients. Here, only limited numbers of samples of patients 1 and 2 (first treatment cycle) were available for testing (Fig. 4, lower panels, and [14]). Again, the number of circulating scFv(G250) DNA copies was clearly higher in patient 1 (i.e. 44 copies/μl on day 10) than in patients 2 (7.1 copies/μl on day 17) and 3 (5.3 copies/μl on day 8).
Fig. 4.
Kinetics of circulating scFv(G250)+ T-cell counts (upper panels) and scFv(G250) DNA copy numbers (lower panels) in blood samples obtained before, during and following treatment with scFv(G250)+ T cells in patient 1 and 2. Results of patient 3 have been published elsewhere (see Ref. [14]). In the upper panels, closed circles connected by uninterrupted lines indicate data points with proportions of scFv(G250)+ cells above the detection limit of 6 in 10,000 CD3+ T cells (see Ref. [14]). In the lower panels, the dashed lines indicate the detection limit as defined by the 95th percentile of ten blood samples of healthy donors, i.e. 1 scFv(G250) DNA copy per μl. The mean number of scFv(G250) DNA copies per scFv(G250)+ T cell in the T cell infusions were 2.3 for patient 1, and 4.5 and 6.8 for treatment cycles 1 and 2, respectively, of patient 2. Horizontal bars indicate treatment intervals, see further legend to Fig. 2
ScFv(G250)-chimeric receptor-mediated functions in patient blood samples
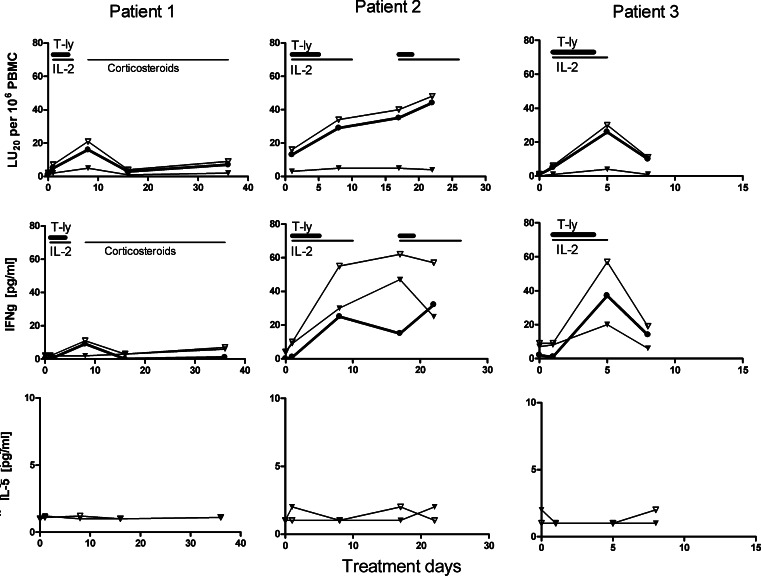
Peripheral blood mononuclear cells obtained prior to and at 1–4 days following the last T-cell infusion were assayed for in vitro scFv(G250)-mediated cytotoxicity and cytokine (IFN-γ, TNF-α, IL-2, IL-4, IL-5 and IL-10) production upon co-culture with a CAIX+ RCC cell line. In all three patients, CAIX-specific activities, i.e. cytolysis of CAIX+ RCC cells (Fig. 5, upper row of panels) and IFN-γ production (2nd row of panels) were detected. Virtually no scFv(G250)-receptor-mediated production of TNF-α, IL-2, IL-4, IL-5 and IL-10 was detectable (lower row of panels and data not shown). The ex vivo CAIX-specific activities of PBMC (i.e.cytolysis and IFN-γ production) obtained during or immediately after administration of rIL-2 were higher than those of PBMC obtained several days after termination of rIL-2 treatment in patients 1 and 3 (upper and middle rows of panels). In contrast, patient 2 still showed significant levels of these activities at the start of cycle 2 (i.e. 1 week after cessation of IL-2 administration), which were paralleled by high levels of circulating scFv(G250)+ T cells and DNA copies (see before) and exceptionally high IFN-γ plasma concentrations (see below),
Fig. 5.
Kinetics of scFv(G250)-mediated cytotoxicity (upper row) and CAIX-specific cytokine production [IFN-γ (2nd row) and IL-5 (3rd row)] by PBMC obtained before and after therapy. PBMC were incubated with CAIX+ RCC cells (open triangles), and CAIX+ RCC cells in the presence of G250 blocking mAb (closed triangles). Specific cytolysis is expressed as LU20/106 PBMC and cytokine production in pg/ml. The net scFv(G250)-mediated cytolysis (closed circles) is defined as the level of cytolysis of CAIX+ RCC cells minus the cytolysis of CAIX+ RCC cells in the presence of G250 mAb. The net scFv(G250)-mediated cytokine production (closed circles) is defined as the amount of cytokine produced in presence of CAIX+ RCC cells minus the amount of IFN-γ produced in presence of CAIX+ RCC cells and G250 mAb. See also the legends to Fig. 2
Blood cytokine levels
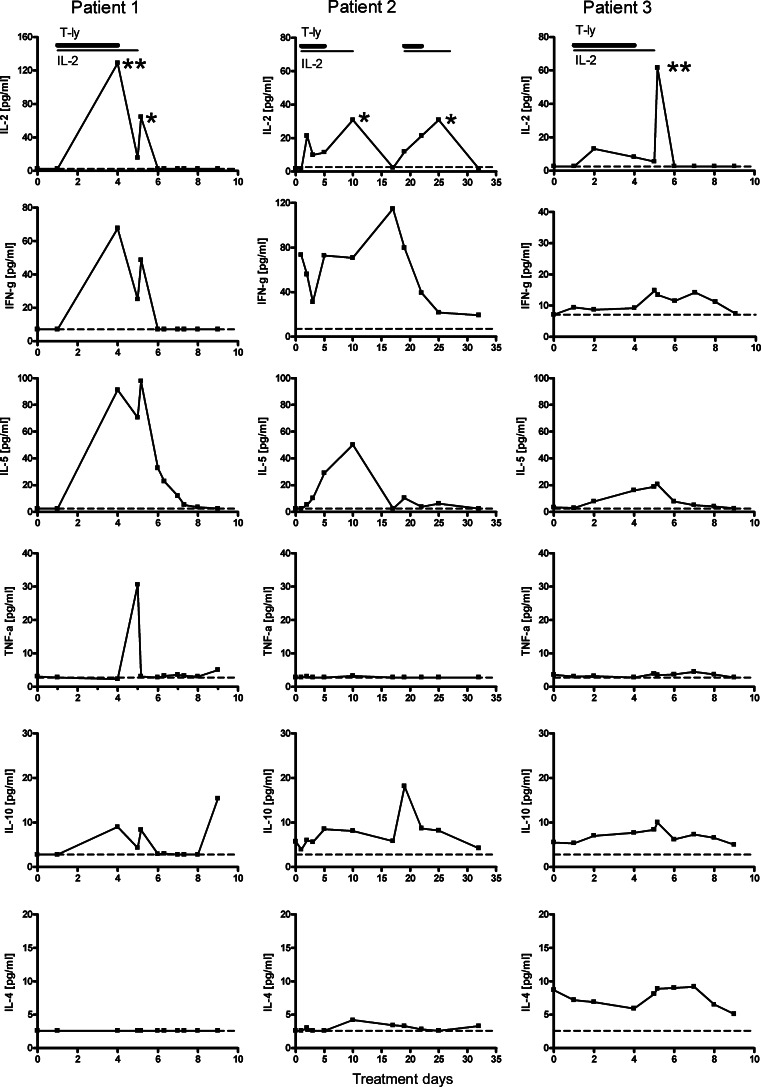
Interleukin-2 became detectable during therapy; levels were typically between 5 and 20 pg/ml in blood samples drawn 12 h after s.c. injection of rIL-2 (Fig. 6, upper row). Relatively high IL-2 plasma concentrations were observed in blood samples taken shortly after rIL-2 injections (marked with asterisks in Fig. 6). The fluctuations in plasma IFN-γ levels varied greatly between patients and as a function of time (2nd row of panels): in patient 1, IFN-γ levels increased during therapy to 76 pg/ml at day 4, to decline after day 5 when treatment was stopped. Remarkably, patient 2 had constitutively high IFN-γ plasma concentrations prior to start of therapy (73 pg/ml), which transiently declined to 31 pg/ml during the first therapeutic cycle. Prior to the second cycle, IFN-γ levels had increased again to 115 pg/ml, but gradually declined during therapy to levels ∼20 pg/ml on day 32. The IFN-γ levels of patient 3 remained relatively stable and fluctuated between 7 and 14 pg/ml during the observation period. The γIL-5 plasma levels became detectable in all three patients during therapy, to reach maximum levels following the last rIL-2 administration in treatment cycle 1, i.e. 97 pg/ml at day 5 in patient 1, 50 pg/ml at day 10 in patient 2, and 21 pg/ml at day 6 in patient 3 (3rd row of panels). IL-10 became detectable at low levels (i.e. <10 pg/ml) in all three patients (5th row of panels); this cytokine peaked at day 9 in patient 1 and at day 19 in patient 2. In the latter patient, this pattern coincided with only a minor IL-5 response during the second treatment cycle.
Fig. 6.
Kinetics of plasma cytokine levels in blood samples of individual patients obtained before, during and following immuno-gene therapy. During the period of rIL-2 administration, blood samples were drawn just before s.c. rIL-2 injection, excepted for samples marked with asterisks (** = 2 h, and * = 4 h after rIL-2 administration); dashed line, detection limit. See further the legend to Fig. 2
Virtually no TNF-α was detected prior to, during and after therapy except for one observation in patient 1 (4th row of panels). Finally, virtually no IL-4 responses were seen in patients 1 and 2 (lower row of panels); patient 3 stood out by detectable IL-4 levels prior to therapy, which remained at similar levels during and after treatment.
Discussion
We sought in vivo evidence for scFv(G250) receptor-mediated T-cell functions as the infusion of scFv(G250)-retargeted T-cells clearly correlated in time with the induction of liver toxicity. This toxicity is likely to be the result of the specific immune reaction of the retargeted T-cells directed against CAIX expressed by epithelial cells lining the bile ducts [7]. Here, we show that PBMC taken from patients on therapy—during which scFv(G250)+ T cells were detectable by flow cytometry and PCR—displayed similar scFv(G250) receptor-mediated functions as did scFv(G250)+ T-cells prior to infusion, such as cytokine production after exposure to CAIX and killing of CAIX+ RCC cell lines.
We focused on fluctuations in plasma cytokine levels as markers for the in vivo activity of the scFv(G250)+ T cells. ScFv(G250)+ T lymphocytes prior to infusion produced high levels of IFN-γ and moderate levels of IL-5 upon CAIX stimulation, whereas PBMC taken from patients during therapy produced only moderate levels of IFN-γ and no IL-5 upon ex vivo exposure to CAIX. On the contrary, we observed significant plasma levels of IFN-γ and IL-5 during therapy. The fluctuations in plasma IFN-γ levels varied strongly between patients, with the highest increment in patient 1 with the most pronounced liver toxicity. We have no explanation for the aberrant kinetics of plasma IFN-γ levels in patient 2; an as yet unidentified (auto) immune activation, possibly combined with a ‘high IFN-γ genotype’ [16] given the elevated IFN-γ level prior to treatment, may have contributed to this pattern. The plasma IFN-γ levels in patient 2 normalized during the second course of treatment, which was paralleled by relatively high CAIX-specific production capacity of the inhibitory cytokine IL-10 and an increment of plasma IL-10 levels in this patient.
To determine whether the increments in plasma IFN-γ and IL-5 levels would reflect in vivo activity of the scFv(G250)+ T cells or be related to the IL-2 administrations only, we considered the following aspects.
Adoptive transfer of T cells has often been combined with administration of exogenous rIL-2 in order to promote survival of the transferred T cells, and to support and maintain T-cell activity in vivo [17–19]. Our observation that the highest levels of scFv(G250)-mediated in vitro activity of patient PBMC, in terms of both scFv(G250)-mediated cytotoxicity and cytokine production, were detected during the period of IL-2 administration, is in line with this paradigm.
Only few studies have addressed the effects of low-dose IL-2-based treatment protocols on plasma cytokine levels. Cragun et al [20] performed weekly assessments of serum cytokine levels in patients receiving daily injections of 3 × 10⁶ IU/m2/day for 6 weeks and showed a gradual increase of IL-5 from week 2 of treatment onwards, whilst levels of IFN-γ, IL-4 en GM-CSF did not change. Gene expression profiling of PBMC following 3 h of in vivo or in vitro exposure to IL-2 identified 155 genes, including IL-5 and IFN-γ, whose expression levels were increased >threefold over those in non-exposed samples [21, 22]. In addition, multiplex protein analysis of RCC patient serum showed that IFN-γ and IL-5 levels increased significantly within 3 h following administration of a single high dose of rhuIL-2 (0.72 × 10⁶ IU/kg). However, IFN-γ levels did not increase further upon repeated IL-2 administrations, in contrast to those of other cytokines such as TNF-α, IL-5 and IL-10 [23]. The discrepancy between the short term (i.e. within 4 h) [21, 22] and long term (i.e. 24 h) [20] effects of IL-2 administrations on IFN-γ and IL-5 plasma levels may be related to the different stabilities of IFN-γ and IL-5 mRNA in T-cells; their half-life is ∼2 and ∼4 h, respectively [24, 25]. Given our scheme of IL-2 administrations (i.e. once every 12 h), the relatively long half-life of IL-5 mRNA may explain the gradual increment of plasma IL-5 levels. The shorter half-life of IFN-γ mRNA would preclude such an effect on plasma IFN-γ levels.
On the basis of these combined studies, we propose that the observed increments in plasma IL-5 levels are a ‘direct’ effect of the IL-2 injections, and probably do not reflect in vivo activity of the infused scFv(G250)+ T cells. On the contrary, the observed increments in plasma IFN-γ levels cannot completely be attributed to the IL-2 injections—due to the short half-life of its mRNA—and therefore would reflect in vivo activity of scFv(G250)+ T cells. This mechanism would especially be apparent in patient 1, which received the highest number of scFv(G250)+ T cells, and developed the most severe liver toxicity.
Acknowledgements
The authors thank P. van Elzakker and B. van Krimpen for their technical assistance. This work has been supported by the Dutch Cancer Foundation (grant DDHK99-1865), the European Commission grant QLK3-1999-01262, and the Cancer Research Institute, New York, (clinical investigation grant ‘Immuno-gene therapy of metastatic RCC patients’).
References
- 1.Eshhar Z. Tumor-specific T-bodies: towards clinical application. Cancer Immunol Immunother. 1997;45:131–136. doi: 10.1007/s002620050415. [DOI] [PMC free article] [PubMed] [Google Scholar]
- 2.Clay TM, Custer MC, Sachs J, Hwu P, Rosenberg SA, Nishimura MI. Efficient transfer of a tumor antigen-reactive TCR to human peripheral blood lymphocytes confers anti-tumor reactivity. J Immunol. 1999;163:507–513. [PubMed] [Google Scholar]
- 3.Lamers CHJ, Sleijfer S, Willemsen RA, Debets R, Kruit WHJ, Gratama JW, et al. Adoptive immuno-gene therapy of cancer with single chain antibody [scFv(Ig)] gene modified T lymphocytes. J Biol Regul Homeost Agents. 2004;18:134–140. [PubMed] [Google Scholar]
- 4.Willemsen RA, Weijtens ME, Ronteltap C, Eshhar Z, Gratama JW, Chames P, et al. Grafting primary human T lymphocytes with cancer-specific chimeric single chain and two chain TCR. Gene Ther. 2000;7:1369–1377. doi: 10.1038/sj.gt.3301253. [DOI] [PubMed] [Google Scholar]
- 5.Weijtens ME, Willemsen RA, Valerio D, Stam K, Bolhuis RL. Single chain Ig/gamma gene-redirected human T lymphocytes produce cytokines, specifically lyse tumor cells, and recycle lytic capacity. J Immunol. 1996;157:836–843. [PubMed] [Google Scholar]
- 6.Bolhuis RL, Willemsen RA, Lamers CH, Stam K, Gratama JW, Weijtens ME. Preparation for a phase I/II study using autologous gene modified T lymphocytes for treatment of metastatic renal cancer patients. Adv Exp Med Biol. 1998;451:547–555. doi: 10.1007/978-1-4615-5357-1_85. [DOI] [PubMed] [Google Scholar]
- 7.Lamers CH, Sleijfer S, Vulto AG, Kruit WH, Kliffen M, Debets R, et al. Treatment of metastatic renal cell carcinoma with autologous T-lymphocytes genetically retargeted against carbonic anhydrase IX: first clinical experience. J Clin Oncol. 2006;24:e20–e22. doi: 10.1200/JCO.2006.05.9964. [DOI] [PubMed] [Google Scholar]
- 8.Oosterwijk E, Ruiter DJ, Hoedemaeker PJ, Pauwels EK, Jonas U, Zwartendijk J, et al. Monoclonal antibody G 250 recognizes a determinant present in renal-cell carcinoma and absent from normal kidney. Int J Cancer. 1986;38:489–494. doi: 10.1002/ijc.2910380406. [DOI] [PubMed] [Google Scholar]
- 9.Grabmaier K, Vissers JL, De Weijert MC, Oosterwijk-Wakka JC, Van Bokhoven A, Brakenhoff RH, et al. Molecular cloning and immunogenicity of renal cell carcinoma-associated antigen G250. Int J Cancer. 2000;85:865–870. doi: 10.1002/(SICI)1097-0215(20000315)85:6<865::AID-IJC21>3.0.CO;2-Q. [DOI] [PubMed] [Google Scholar]
- 10.Lamers CH, Willemsen RA, Luider BA, Debets R, Bolhuis RL. Protocol for gene transduction and expansion of human T lymphocytes for clinical immunogene therapy of cancer. Cancer Gene Ther. 2002;9:613–623. doi: 10.1038/sj.cgt.7700477. [DOI] [PubMed] [Google Scholar]
- 11.Lamers CH, Willemsen RA, van Elzakker P, van Krimpen BA, Gratama JW, Debets R. Phoenix-ampho outperforms PG13 as retroviral packaging cells to transduce human T cells with tumor-specific receptors: implications for clinical immunogene therapy of cancer. Cancer Gene Ther. 2006;13:503–509. doi: 10.1038/sj.cgt.7700916. [DOI] [PubMed] [Google Scholar]
- 12.Lamers C, van Elzakker P, Langeveld S, Sleijfer S, Gratama J. Process validation and clinical evaluation of a protocol to generate gene-modified T lymphocytes for imunogene therapy for metastatic renal cell carcinoma: GMP-controlled transduction and expansion of patient’s T lymphocytes using a carboxy anhydrase IX-specific scFv transgene. Cytotherapy. 2006;8:542–553. doi: 10.1080/14653240601056396. [DOI] [PubMed] [Google Scholar]
- 13.Uemura H, Okajima E, Debruyne FMJ, Oosterwijk E. Internal image antiidiotype antibodies related to renal-cell carcinoma-associated antigen G250. Int J Cancer. 1994;56:609–614. doi: 10.1002/ijc.2910560424. [DOI] [PubMed] [Google Scholar]
- 14.Lamers CH, Gratama JW, Pouw NM, Langeveld SC, Krimpen BA, Kraan J, et al. Parallel detection of transduced T lymphocytes after immunogene therapy of renal cell cancer by flow cytometry and real-time polymerase chain reaction: implications for loss of transgene expression. Hum Gene Ther. 2005;16:1452–1462. doi: 10.1089/hum.2005.16.1452. [DOI] [PubMed] [Google Scholar]
- 15.Pross HF, Baines MG, Rubin P, Shragge P, Patterson MS. Spontaneous human lymphocyte-mediated cytotoxicity against tumor target cells. IX. The quantitation of natural killer cell activity. J Clin Immunol. 1981;1:51–63. doi: 10.1007/BF00915477. [DOI] [PubMed] [Google Scholar]
- 16.Vandenbroeck K, Goris A. Cytokine gene polymorphisms in multifactorial diseases: gateways to novel targets for immunotherapy? Trends Pharmacol Sci. 2003;24:284–289. doi: 10.1016/S0165-6147(03)00131-7. [DOI] [PubMed] [Google Scholar]
- 17.Yee C, Thompson JA, Byrd D, Riddell SR, Roche P, Celis E, et al. Adoptive T cell therapy using antigen-specific CD8+ T cell clones for the treatment of patients with metastatic melanoma: in vivo persistence, migration, and antitumor effect of transferred T cells. Proc Natl Acad Sci USA. 2002;99:16168–16173. doi: 10.1073/pnas.242600099. [DOI] [PMC free article] [PubMed] [Google Scholar]
- 18.Dudley ME, Rosenberg SA. Adoptive-cell-transfer therapy for the treatment of patients with cancer. Nat Rev Cancer. 2003;3:666–675. doi: 10.1038/nrc1167. [DOI] [PMC free article] [PubMed] [Google Scholar]
- 19.Gattinoni L, Powell DJ, Jr, Rosenberg SA, Restifo NP. Adoptive immunotherapy for cancer: building on success. Nat Rev Immunol. 2006;6:383–393. doi: 10.1038/nri1842. [DOI] [PMC free article] [PubMed] [Google Scholar]
- 20.Cragun WC, Yamshchikov GV, Bissonette EA, Smolkin ME, Eastham S, Petroni GR, et al. Low-dose IL-2 induces cytokine cascade, eosinophilia, and a transient Th2 shift in melanoma patients. Cancer Immunol Immunother. 2005;54:1095–1105. doi: 10.1007/s00262-005-0701-6. [DOI] [PMC free article] [PubMed] [Google Scholar]
- 21.Jin P, Wang E, Provenzano M, Deola S, Selleri S, Ren J, et al. Molecular signatures induced by interleukin-2 on peripheral blood mononuclear cells and T cell subsets. J Transl Med. 2006;4:26–26. doi: 10.1186/1479-5876-4-26. [DOI] [PMC free article] [PubMed] [Google Scholar]
- 22.Panelli MC, Wang E, Phan G, Puhlmann M, Miller L, Ohnmacht GA, et al. Gene-expression profiling of the response of peripheral blood mononuclear cells and melanoma metastases to systemic IL-2 administration. Genome Biol. 2002;3:1–0035. doi: 10.1186/gb-2002-3-7-research0035. [DOI] [PMC free article] [PubMed] [Google Scholar]
- 23.Panelli MC, White R, Foster M, Martin B, Wang E, Smith K, et al (2004) Forecasting the cytokine storm following systemic interleukin (IL)-2 administration. J Transl Med 2:17. doi:10.1186/1479-5876-2-17 [DOI] [PMC free article] [PubMed]
- 24.Umland SP, Razac S, Shah H, Nahrebne DK, Egan RW, Billah MM. Interleukin-5 mRNA stability in human T cells is regulated differently than interleukin-2, interleukin-3, interleukin-4, granulocyte/macrophage colony-stimulating factor, and interferon-gamma. Am J Respir Cell Mol Biol. 1998;18:631–642. doi: 10.1165/ajrcmb.18.5.3046. [DOI] [PubMed] [Google Scholar]
- 25.Rolfe FG, Sewell WA. Analysis of human interleukin-5 gene transcription by a novel nuclear run on method based on the polymerase chain reaction. J Immunol Methods. 1997;202:143–151. doi: 10.1016/S0022-1759(96)00245-1. [DOI] [PubMed] [Google Scholar]


