Abstract
The thymus is the site where all T-cell precursors develop, mature, and subsequently leave as mature T-cells. Since the mechanisms that mediate and regulate thymic apoptosis are not fully understood, we utilized a syngenic GL261 murine glioma model to further elucidate the fate of T-cells in tumor bearing C57BL/6 mice. First, we found a dramatic reduction in the size of the thymus accompanied by a decrease in thymic cellularity in response to glioma growth in the brains of affected mice. There was a marked reduction of double positive subset and an increase in the frequency of CD4+ and CD8+ single positive T-cell subsets. Analysis of double negative thymocytes showed an increase in the accumulation of CD44+ cells. In contrast, there was a marked loss of CD44 and CD122 expression in CD4+ and CD8+ subsets. The growth of intracranial tumors was also associated with decreased levels of HO-1, a mediator of anti-apoptotic function, and increased levels of Notch-1 and its ligand, Jagged-1. To determine whether thymic atrophy could be due to the effect of Notch and its ligand expression by glioma in vivo, we performed a bone marrow transplant experiment. Our results suggest that Notch-1 and its ligand Jagged-1 can induce apoptosis of thymocytes, thereby influencing thymic development, immune system homeostasis, and function of the immune cells in a model of experimental glioma.
Keywords: Glioma, Thymus, Apoptosis, Heme oxygenase-1 (HO-1), Notch, Regulatory T-cell (CD4+CD25+Foxp3+)
Introduction
Thymic T-cell development is ordered by sequential steps involving cell proliferation and apoptosis. In the embryo, thymocyte precursors come first from the rudimentary liver and then from the bone marrow [1]. On entering the gland, they undergo proliferation and lineage commitment and selection, largely under the control of thymic epithelial cells [1]. Interactions between thymocytes and thymic stromal cells are known to be important in driving a complex program of T-cell maturation in the thymus, which ultimately results in the generation of self-tolerant CD4+ helper and CD8+ cytotoxic T-cells, which then emigrate from the thymus to establish the peripheral T-cell pool [2].
Notch signaling has been shown to play an important role in cell-fate determination, as well as in cell survival and proliferation [3, 4], developmental lineage choices [5–7], and decision processes underlying the functional bifurcation of CD4/CD8 T lymphocytes [8]. Nevertheless, the molecular mechanisms whereby Notch regulates these diverse functions have not been fully characterized. The Notch proteins, represented by four homologs in mammals (Notch1–Notch4), interact with a number of surface-bound or secreted ligands (Delta-like 1, Delta-like 3, Delta-like 4, Jagged-1 and Jagged-2) [9–11]. Notch signaling induces expression of a number of target genes within T-cell progenitors [12], including Hes1, pre-Tα [13], Nrarp [14, 15], and Deltex1 [16]. These genes can promote T-cell maturation by performing T-cell-specific functions, as is the case for pre-Tα. Alternatively, these genes can play a role in altering the dose or quality of Notch signals within thymocytes as they progress through specific maturation stages. Consistent with the notion that Notch signals are highly regulated within thymocytes, there is evidence that the expression of Notch-responsive genes varies dramatically in double-negative (DN), double-positive (DP), and single-positive (SP) thymocyte populations [12, 17].
A key finding in patients with malignant brain tumors (anaplastic astrocytoma and glioblastoma multiforme, GBM) is lymphopenia and functional unresponsiveness confined to the T-cell lineage [18]. Previous reports have also shown that glioma bearing mice die with severe thymic atrophy and accelerated maturation of T-cells [19]. Although the mechanism responsible for these observations is unclear, the expression of Notch and its ligands in human glioma [20] may play a role in this setting. In the present study we sought to elucidate the impact of glioma progression on T-cell homeostasis in the thymus using a GL261 syngenic murine glioma model to highlight the mechanism responsible of the death of T-cells. We also examined whether the observed thymic defects are caused by Notch and its ligand expression in vivo or by a systemic stress response.
Materials and methods
Mice
Six to eight-week-old C57BL/6 male mice were obtained from Taconic Laboratory (Hudson, NY, USA). FoxP3-GFP transgenic mice were a kind gift from Dr. Alexander Rudensky (University of Washington). Mice were housed and maintained under pathogen-free condition in accordance with a protocol approved by the Institutional Animal Care and Use Committee (IACUC) at the University of Chicago.
Intracranial tumor model
Mice (n = 6/group) were anesthetized with an intraperitoneal injection of 0.1 ml of a stock solution containing ketamine hydrochloride 25 mg/ml, xylazine 2.5 mg/ml, and 14.25% ethyl alcohol diluted 1:3 in 0.9% NaCl. For stereotactic intracranial injections of tumor cells, the surgical site was shaved and prepared with 70% ethyl alcohol and Prepodyne solution. After a midline incision, a 1 mm right parietal burr hole centered 2 mm posterior to the coronal suture and 2 mm lateral to the sagittal suture was made. Animals were then placed in a stereotactic frame and 1 × 10⁵ GL261 tumor cells were delivered by a 26-gauge needle to a depth of 3 mm over a period of 3 min. The total volume of injected cells was 5 μl. The needle was removed, the site was irrigated with sterile 0.9% NaCl, and the skin was sutured with 4.0 nylon.
Preparation of thymocyte suspension
The thymus was surgically removed and cell suspensions were prepared by crushing the thymus through a cell stainer and washing in staining buffer (3% FBS in PBS). The thymocyte number was counted under phase contrast microscopy and cell number adjusted to 1 × 10⁶ cells/ml.
Multi-color flow cytometric analysis
Tumor isolated lymphocytes (1 × 10⁶ cells) were resuspended in staining buffer (3% FBS in PBS). Tumor cell suspensions were prepared by homogenization of the tumor with a cell strainer and washing of the cells with staining buffer. Erythrocytes were lysed and cells were then stained with various antibodies. Monoclonal antibodies to CD3, CD4, CD8, CD44 and CD122 were from BD Biosciences. These monoclonal antibodies were directly coupled to fluorescein isothiocyanate, phycoerythrin or phycoerythrin-indotricarbocyanin. Antibodies were used at 5 μg/ml and staining was done in fluorescence-activated cell sorting (FACS) buffer on ice for 45 min. Surface marker expression on tumor infiltrating lymphocytes (TIL) cells was visualized with FACSCalibur (Becton Dickinson) and analyzed with FlowJo software (Becton Dickinson).
7-AAD staining
The 7-AAD apoptosis detection was used to measure the relative distribution of apoptotic cells. One million cells were washed three times and resuspended in phosphate-buffered saline (PBS). The cell pellet was resuspended in 200 μl of 1× binding buffer (BD Bioscience). The cell suspension was labeled with fluorescein isothiocyanate (FITC)-conjugated 7-AAD according to the manufacturer’s instructions. After 15 min incubation, the cells were washed once with 1× binding buffer and then 400 μl of 1× binding buffer was added per 1 × 10⁵ cells. 7-AAD uptakes were detected using the FACSCalibur™ (Becton Dickinson), and data were analyzed using FlowJo software.
RT-PCR
Total RNA was extracted from GL261 cell line using RNeasy kit (AMBION, Austin, TX, USA). cDNA was made using the superscript II-RT kit (Invitrogen, CA, USA) and amplified by polymerase chain reaction. The following primers were used to amplify Notch-1 (Forward: 5′-CTG TGT GGA TGA GGG AGA TAA-3′; Reverse: 5′-GGC ATA GAC AGC GGT AGA AA-3′), Jagged-1 (Forward: 5′-CCT CCA GCC TCC AGC CAG TG-3′; Reverse: 5′-TGT TTG TCC AGT TCG GGT GTT TTG-3′), Delta-1 (Forward: 5′-CCA CGG AAG CTT AGC GGT ACC ATG GGC CGT CGG AGC-3′, Reverse: 5′-GCC GCG TCG ACA TCT TAC ACC TCA CTC GCT ATA ACA-3′) and GAPDH (Forward: 5′-TGT CAA GCT CAT TTC CTG GTA TGA-3′, Reverse: 5′-CTT ACT CCT TGG AGG CCA TGT AG-3′). PCR reactions containing 1 μg of cDNA template, 0.5 μM each of the primers, were performed in a total volume of 25 μl under the following conditions: 15-min hot start at 95°C, 15-s denaturation at 95°C, 20-s annealing of primers at 54°C, and 15-s elongation at 72°C, for 40 cycles.
Murine bone marrow transplantation
Bone marrow cells were isolated from the femurs of 6 to 8 week-old donor mice (Ly5.1) with GL261 tumors and subsequently transplanted into lethally irradiated 4–6-week-old recipients B6SJL/J (Ly5.2; The Jackson Laboratory) [21]. Approximately, 6 × 10⁵ cells were injected into the retro-orbital venous plexus of irradiated mice. Recipient mice were sacrificed at the indicated times (3 and 5 weeks) post-transplantation for analysis. The thymus was dissected to isolate single lymphocyte cell suspensions for FACS analysis.
Statistical analysis
To analyze the significance of our experimental observations we used an unpaired, one-tailed-distribution Student’s t-test. We considered P values of less than 0.05 significant.
Results
Thymic atrophy is due to the decrease in CD4+CD8+ DP thymocytes
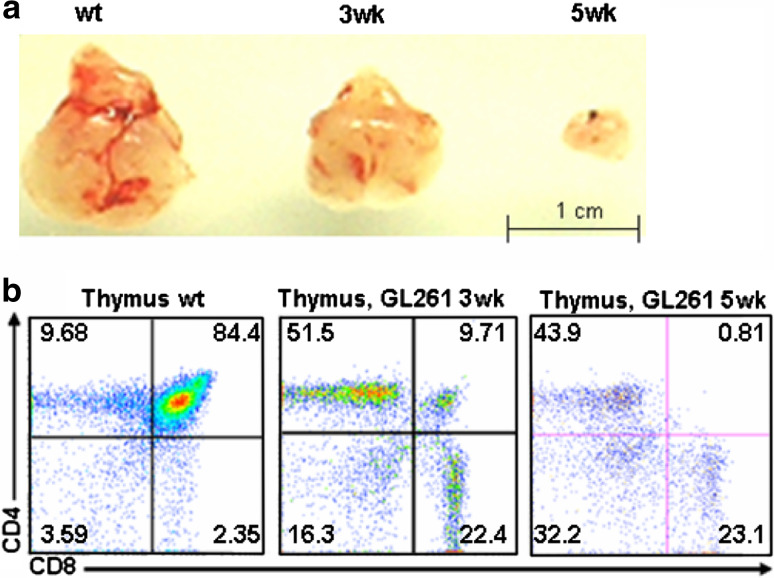
As shown in a representative picture in Fig. 1a, the thymus in glioma bearing mice is much smaller than that found in non-tumor bearing mice. Moreover, there appears to be a correlation between the size of the thymus and tumor growth and progression. To further understand the difference behind this observation, we examined T-cell development in the thymus of normal as well as tumor-bearing mice (at 3 and 5 weeks) by flow cytometric analysis (Fig. 1b). Whereas 84.4 ± 4.2% of cells in normal mice were CD4+CD8+, this percentage decreased to 9.71 ± 1.7% at 3 weeks and 0.81 ± 0.06% at 5 weeks in tumor bearing animals (P < 0.01).
Fig. 1.
Phenotypic analysis of the thymus: a macroscopic observation of the thymus size from glioma bearing mice at 3 and 5 weeks compared to littermate control; b single cell suspensions of thymocytes from wt, 3 and 5 week glioma bearing C57BL/6 mice were counted, stained with CD4 and CD8 monoclonal antibodies, and analyzed by flow cytometry. The mean fluorescence intensity ± SD of frequency of each subset of thymocyte is indicated in each quadrant
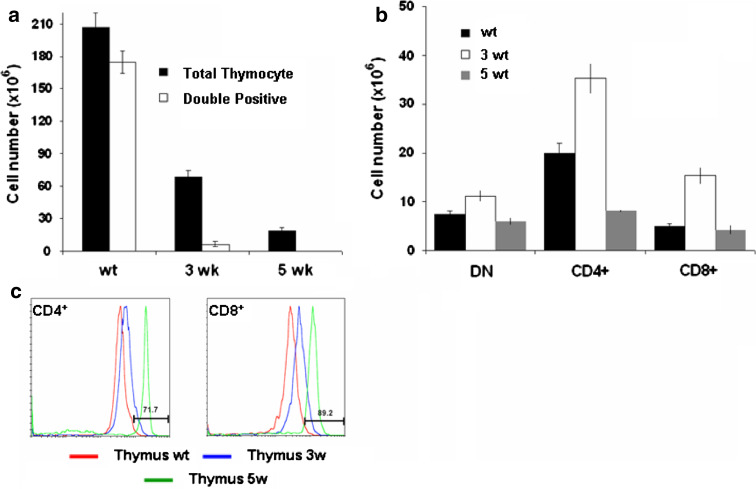
We observed a reproducible and significant reduction in thymic cellularity in glioma bearing mice compared to normal mice (207 ± 13 × 106 cells in normal mice versus 68.5 ± 6 × 10⁶ cells at 3 weeks and 18.5 ± 3.28 × 10⁶ cells at 5 weeks, P < 0.01 value) and a marked decrease in the double positive population (174.7 ± 4.25 × 10⁶ cells in normal mice versus 6.65 ± 2.17 × 10⁶ cells at 3 weeks and 0.15 ± 0.06 × 10⁶ cells at 5 weeks, P < 0.01 value) (Fig. 2a). In contrast, analysis of absolute number of thymocytes in each population revealed an increase in DN at 3 weeks compared to wt (11.16 ± 1.2 × 10⁶ cells at 3 weeks versus 7.43 ± 0.65 × 10⁶ cells in WT, P < 0.05 value) (Fig. 2b). The number of CD4+SP subsets was increased only in glioma bearing mice at 3 weeks and decreased dramatically at 5 weeks of progression compared to wt control (8.12 ± 0.3 × 10⁶ cells at 5 weeks, 35.3 ± 3.1 × 10⁶ cells at 3 weeks versus 20 ± 2.1 × 10⁶ cells in normal mice, P < 0.01 value). In CD8+SP, we observed an increase at 3 weeks and no change at 5 weeks (15.34 ± 1.74 × 10⁶ cells at 3 weeks, 4.27 ± 0.9 × 10⁶ cells at 5 weeks versus 4.86 ± 0.7 × 10⁶ cells in normal mice, P < 0.05 value) in glioma bearing mice compared to non-tumor bearing mice. Further examination of CD4+SP and CD8+SP subsets in glioma bearing mice revealed difference in the expression level of both markers compared to wild-type thymocytes. As shown in Fig. 2c, the CD4 and CD8 expression level was up-regulated to 71.7 ± 3.26 and 89.2 ± 4.5%, respectively, at 5 weeks compared to wt control (P < 0.01).
Fig. 2.
T-cell development in the thymus of glioma bearing mice: a absolute numbers of total thymocytes and double positive subset; b absolute number of thymocyte populations (DP, DN cell, SP-CD4+ or SP-CD8+). The number of thymocytes in each population was calculated by multiplying the percentage of each population by the total number of thymocytes; c Comparison of surface expression of CD4 and CD8 in SP thymocytes in glioma bearing mice compared wt littermate. Cells were stained with CD4 and CD8 for definition of the developmental stage. Values represent the mean fluorescence intensity ± SD
Accumulation of CD44-positive cells results in double negative thymocyte proliferation and inhibition of differentiation
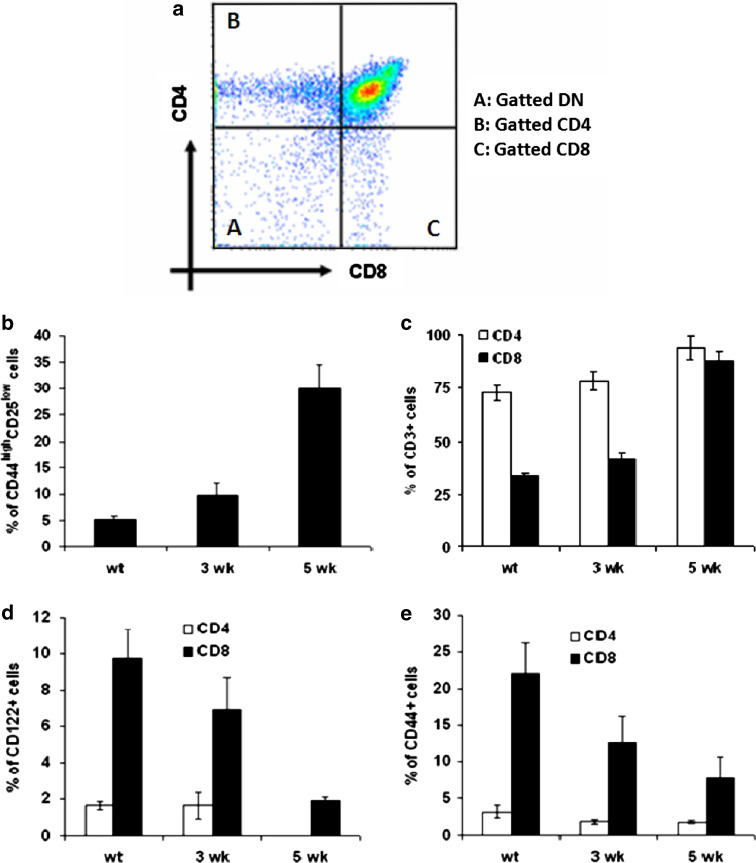
The homing and emigration of thymocytes is related to the pattern of CD44 expression [22]. Since our previous results showed an increase in CD4−CD8− DN population, we performed flow cytometric analysis of CD4−CD8− DN thymocyte subsets defined by the combined expression of CD25 and CD44 cell markers. Our results show an increase in the percentage and accumulation of DN (CD4−CD8−) subset at 5 weeks (30 ± 4.5%) compared to 3 weeks (9.74 ± 2.3%) and to wt control (5.1 ± 0.72%) (P < 0.05) (Fig. 3a). This altered development of the earliest T-cell precursors could account for the observed thymic atrophy. We have further evaluated the increase in the proportion of CD4+ and CD8+ thymocytes by characterizing the expression of maturation markers such as CD3, CD44, and CD122 (Fig. 3b–d). The expression level of CD3 was up-regulated in both T-cell subsets throughout the time of glioma progression. This increase was more important in CD8+ T-cells (88.2 ± 4% at 5 weeks; 41.3 ± 3.2% at 3 weeks and 33.3 ± 1.46% in wt control) than in CD4+ T-cells (94 ± 5.7% at 5 weeks; 78.4 ± 4.2% at 3 weeks and 72.6 ± 3.5% in wt control) (P < 0.01) (Fig. 3b). The SP thymocytes from glioma bearing mice, especially CD8+ cells, exhibited lower expression of CD122 (1.91 ± 0.2% at 5 weeks; 6.9 ± 1.8% at 3 weeks and 9.74 ± 1.6% in wt control) (P < 0.01) (Fig. 3c), also known as the IL-2Rβ subunit, which is another marker associated with a subset of activated or memory CD8+ cells [23]. CD44 expression was also decreased in CD8+ T-cells (7.73 ± 3% at 5 weeks; 12.6 ± 3.5% at 3 weeks and 22 ± 4.2% in wt control)(P < 0.01) (Fig. 3d). This loss in expression of both markers confirms the absence of activated cells in the thymus of glioma bearing mice and is the result of altered homeostasis of mature peripheral CD8+ and CD4+ T-cells.
Fig. 3.
Phenotype profiles of thymocytes harvested from glioma bearing mice at 3 and 5 weeks, and from wt control littermate: a flow cytometry plots depicting appropriate gating of DN thymocytes, SP CD4+and SP CD8+ T-cells. The DN cells stained with CD44 and CD25 and the frequency of CD44highCD25low were compared between wt, 3 and 5 week glioma bearing mice (b). Thymocytes stained for CD4 and CD8 and analyzed with flow cytometry. The histograms shown cells stained with c CD3, d CD122, and e CD44. The percentage of positive cells for each marker is given in each dot plot. Values represent the mean fluorescence intensity ± SD
Inhibition of CD25 and CD69 in the thymus of glioma bearing mice
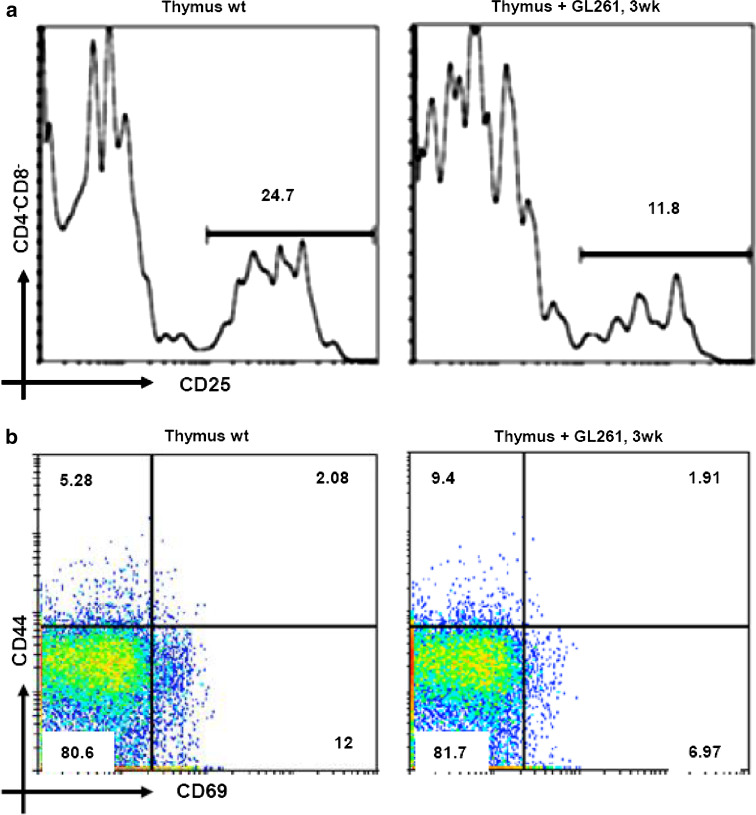
To investigate the development of DN compartment in glioma bearing mice, we first examined the expression of CD25. As shown in Fig. 4a, we observed an important decrease in CD25 expression at 3 weeks of glioma progression (11.8 ± 3.1% at 3 weeks vs. 24.7 ± 5.23% in WT) (P < 0.02). Next, we examined the expression of the early activation marker, CD69, which is transiently expressed in thymocytes that are undergoing positive selection [24]. Moreover, CD69 is normally downregulated on mature thymocytes before their exit from the thymus, and overexpression leads to the retention of mature thymocytes in the medulla [25]. As shown in Fig. 4b, the expression level of CD69 decreased from 12 ± 1.56% in wt control thymus to 6.97 ± 0.82% in the thymus of glioma bearing mice at 3 weeks (P < 0.05). We also observed an increase in CD44, a marker that is responsible for co-stimulation of apoptosis in the thymus, at 3 weeks (9.4 ± 1.54%) compared to wt (5.28 ± 0.76%) (Fig. 4b) (P < 0.01). The expression levels of these two markers was absent in thymocytes at 5 weeks due to the important cell death at this stage.
Fig. 4.
DN Thymocyte expression profiles: a analysis of CD25 expression by flow cytometry in total DN (CD4-CD8-). Flow cytometry analysis with CD69 vs. CD44 monoclonal antibodies in total thymocyte of glioma bearing mice (3 weeks) and wt littermate control (b). The expression levels of these two markers was absent in thymocytes at 5 weeks due to cell death at this stage. The percentage of positive cells for each marker is given in each dot plot. Values represent the mean fluorescence intensity ± SD
Glioma progression affects T-cell homeostasis via apoptosis by modulating heme-oxygenase 1
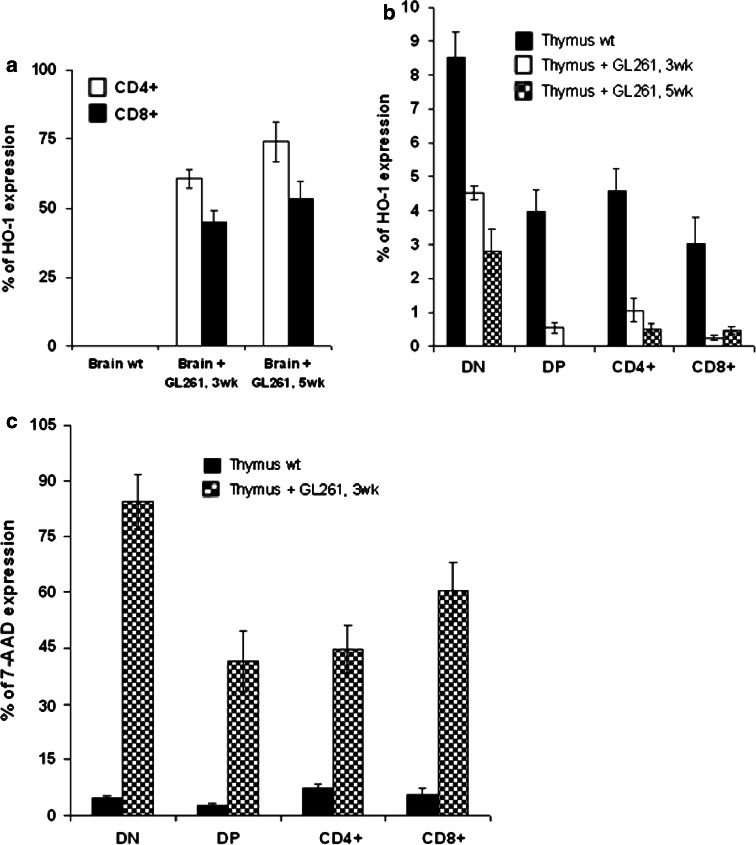
To further investigate the mechanism underlying glioma-induced thymic apoptosis, we examined the expression of heme oxygenase-1 (HO-1). Of note, we have recently reported that glioblastoma progression in humans correlates with the induction of HO-1 expression [26], which has an anti-apoptotic function and contributes to survival of cancer cells [27]. The expression of HO-1 was increased in CD4+ and CD8+ tumor infiltrating T-cells (CD4+HO-1+: 60.5 ± 3.4% at 3 weeks and 73.9 ± 7.32% at 5 weeks; CD8+HO-1+: 45 ± 4.2% at 3 weeks and 53.3 ± 6.21% at 5 weeks; P < 0.02) and was undetectable in the control brain (Fig. 5a). As shown in Fig. 5b, the expression level of HO-1 in the thymus decreased with the progression of the glioma compared to wild-type control. We observed a decrease in DN (8.52 ± 0.75% in wt control; 4.52 ± 0.2% at 3 weeks and 2.8 ± 0.65 at 5 weeks; P < 0.05), DP (3.98 ± 0.64 in wt control; 0.55 ± 0.15% at 3 weeks and 0% at 5 weeks; P < 0.05), CD4+ (4.59 ± 0.64% in wt control; 1.07 ± 0.35% at 3 weeks and 0.53 ± 0.13% at 5 weeks; P < 0.05) and CD8+ (3.03 ± 0.8% in wt control; 0.25 ± 0.07% at 3 weeks and 0.47 ± 0.1% at 5 weeks; P < 0.05) T-cells.
Fig. 5.
Apoptosis of T-cells of glioma bearing mice: a flow cytometry analysis of gated CD4+ and CD8+ cells infiltrating brain of glioma bearing mice (3 and 5 week) compared to littermate brain wt control, stained for CD4, CD8 and HO-1. The result was recapitulated in a histogram; b expression of HO-1 in gated thymocytes DN, DP, SP CD4+ and SP CD8+ analyzed with flow cytometry and represented in a histogram; c representative histogram of 7-AAD uptake detected by flow cytometry in different thymocytes subsets (DN, DP and SP) stained for CD4, CD8 and 7-AAD. Values represent the mean fluorescence intensity ± SD
Based on the anti-apoptotic status of HO-1 in the thymus, we next examined the survival of thymocytes in glioma bearing mice and wild-type developing thymocytes. Apoptosis was measured by staining cell suspension with 7-AAD in combination with the expression of CD4 and CD8 T-cell markers and analyzed by flow cytometry. We evaluated the proportions of apoptotic cells in the DN (4.65 ± 0.6% in wt control and 84.4 ± 7.4% at 3 weeks; P < 0.01), DP (2.74 ± 0.42% in wt control and 41.5 ± 8.2% at 3 weeks; P < 0.01) and SP (CD4+: 7.35 ± 1.39% in wt control and 44.6 ± 6.4% at 3 weeks; P < 0.01; CD8+: 5.68 ± 1.65% in wt control and 60.2 ± 8% at 3 weeks; P < 0.01) compartments. The results of this analysis revealed a higher percentage of apoptotic cells in the thymus of tumor bearing mice at 3 weeks than wild-type thymus (Fig. 5c).
Expression of Notch-1 and its ligand, Delta-like-1 and Jagged-1 by GL261 in vitro and in vivo
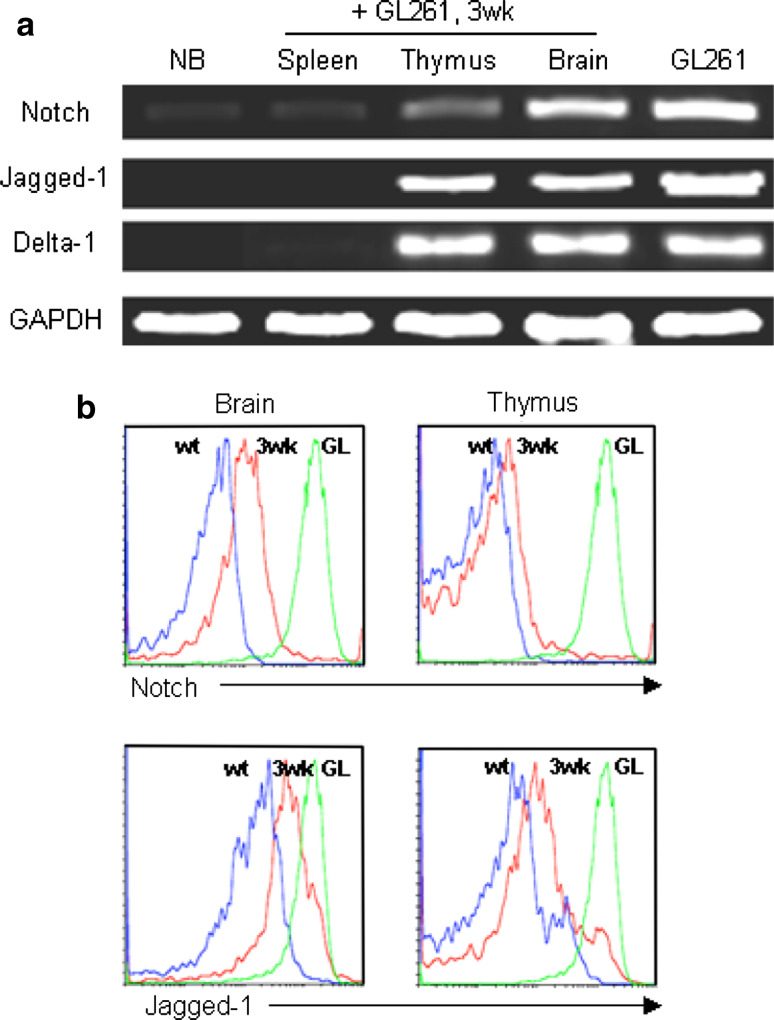
The expression levels of Notch-1 and its ligand Jagged-1 in GL261 murine glioma cell line were investigated by semi-quantitative polymerase chain reaction (RT-PCR). All ligands were expressed in GL261 and in the brain of glioma bearing mice. As shown in Fig. 6a, Jagged-1 increased proportionally to the tumor growth at 3 weeks of progression. The investigated members of the Notch gene family were Notch-1, Delta-like-1 and Jagged-1. All ligands were expressed in GL261 and in the brain of glioma bearing mice. The level of Notch mRNA expression was low in the thymus of GL261 mice compared to the expression level of Delta-like-1 and Jagged-1. The comparison of expression based on the band intensity also showed more expression of Jagged-1 than Delta-1. In the case of spleen, the band intensity of Notch was weaker compared to others and the expression of Delta-like-1 and Jagged-1 mRNA was not detectable. In vivo analysis of Notch-1 and its ligand Jagged-1 expression by flow cytometry confirmed these results in brain (Notch: 37 ± 4.2%; Jagged-1: 29 ± 2.53%) and thymus (Notch: 32 ± 2.64%; Jagged-1: 21 ± 4.72%) of glioma bearing mice at 3 weeks of progression compared to wild-type control (negative control) and GL261 cell line (positive control). A representative example is shown in Fig. 6b.
Fig. 6.
Notch and its ligand expression by glioma cell line: a RT-PCR analysis of Notch and its ligand (Jagged-1 and Delta-1) expression in brain, thymus and spleen of glioma bearing mice. Normal brain was used as negative control and GL261 (GL) glioma cell line, positive control; b in vivo analysis of Notch and its ligand Jagged-1 expression by flow cytometry in brain and thymus of glioma bearing mice and wt shown in histogram
Notch-1, Jagged-1 and the development of regulatory CD4+CD25+Foxp3+ cells
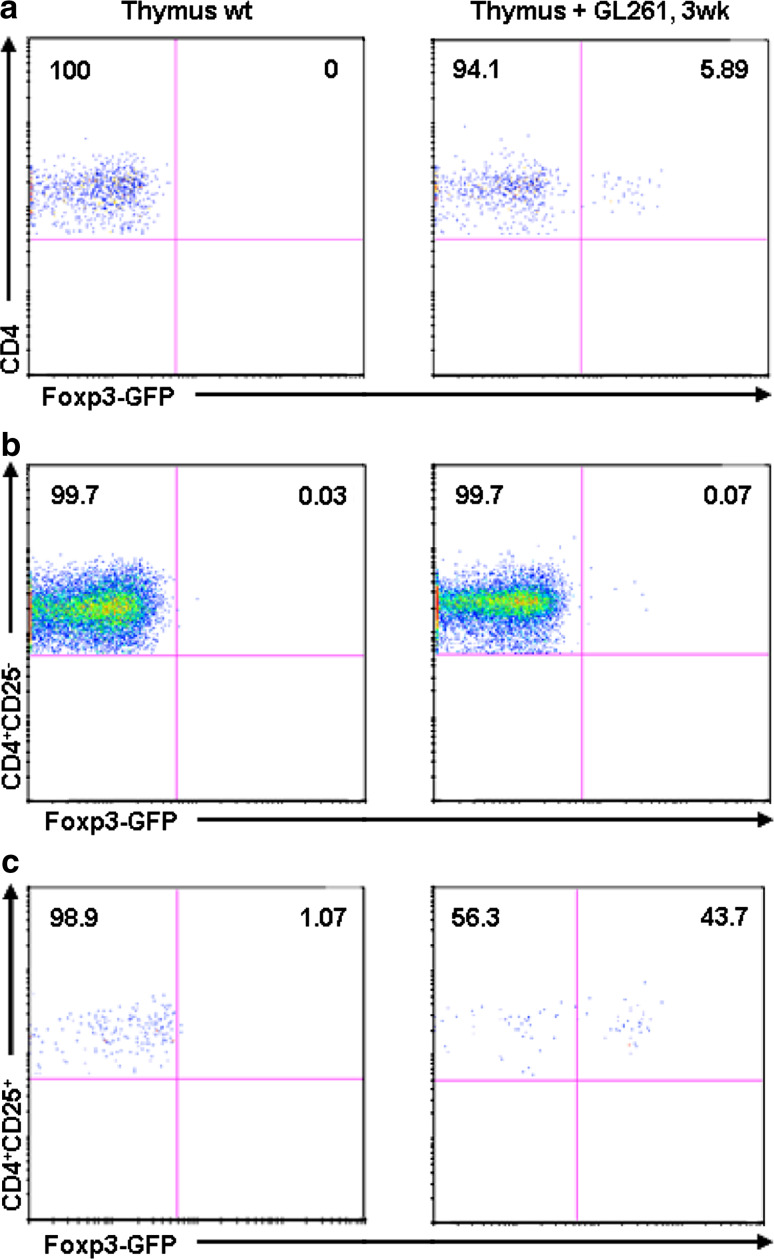
Jagged-1 has been documented in human thymic epithelium [28] which appears to play a key role in the generation of regulatory (Treg) T-cells [29]. The comparison of the homeostasis of Treg in the thymus between control and glioma bearing mice was done based on Foxp3 induction. To get exact evaluation of this induction, we have implanted the glioma cell line GL261 into Foxp3-GFP (C57BL/6) mice and analyzed the thymus at 3 weeks after implantation by flow cytometry. As shown in Fig. 7a, there is an absence of Foxp3-GFP expression in total CD4+ T-cells in control mice vs. 5.89 ± 0.73% (P < 0.01) in glioma bearing mice. The analysis of CD4+CD25− and CD4+CD25+ T-cell subsets confirm the expression of Foxp3-GFP in CD4+CD25+ in 43.7 ± 2.31% compared to 1.07 ± 0.48% in littermate control (P < 0.01) of total Treg cells.
Fig. 7.
Treg homeostasis in the thymus of glioma bearing mice: a dot plots generated by an FACS analysis after staining with monoclonal antibody anti-CD4 versus GFP expression in Foxp3-GFP (C57BL/6 background) mice compared to the wt littermate control of the same genotype; b, c show Foxp3-GFP expression in CD4+CD25− and CD4+CD25+. The mean fluorescence intensity for each marker is given in each dot plot. Values represent the mean fluorescence intensity ± SD
Notch signaling effect on T-cell development and differentiation of glioma bearing mice
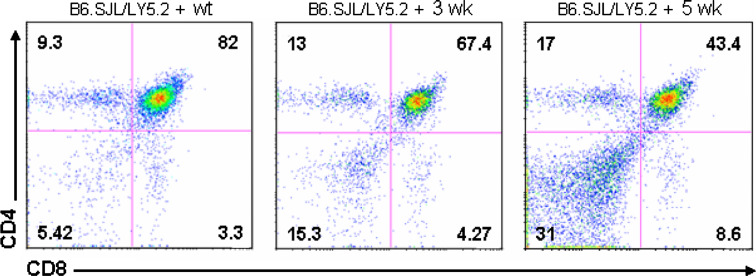
To determine whether thymic atrophy could be due to the effect of Notch and its ligand expression by glioma in vivo on the immature progenitors in earliest T-cells or the consequence of microenvironmental factors that favor the induction of Notch signaling in the thymus, we analyzed the development of glioma bearing mice bone marrow precursors (LY5.1) in the thymic microenvironment of B6.SJL (Rag2−/−, LY5.2) mice. A total of 5 × 10⁵ to 8 × 10⁵ cells bone marrow cells were intravenously (i.v.) injected into B6.SJL mice (Rag2−/−, LY5.2). At 3 weeks after transplantation, the vast majority of thymocytes were donor-derived. As shown in Fig. 8, the absolute number of SP-CD4 and SP-CD8 was increased in both groups of mice receiving glioma bearing mice bone marrow at 3 and 5 weeks. However, we found that depletion of DP subset correlated to the progression of glioma (43.4 ± 5.3% at 5 weeks, 67.4 ± 4.2% at 3 weeks, 82 ± 2.51% in normal mice, P < 0.05).
Fig. 8.
Bone marrow reconstitution. Bone marrow cells (Ly5.1+) from wild type or glioma bearing mice were transferred into irradiated B6.SJL (Ly5.2+). At three and five weeks after transplantation, isolated thymocytes were analyzed by flow cytometry for CD4 and CD8 expression. Values represent the mean fluorescence intensity ± SD
Discussion
An important manifestation of glioma progression is the alteration of thymocyte subset distribution. The thymus has been previously shown to be a sensitive target for glioma growth and the development of thymocyte can be impaired in this setting which results in altered tumor immune response. In the current study, we investigated the relationship between Notch expression and the important alteration in the development of T-cells in the thymus.
Our results indicate that glioma bearing mice show evidence of time-dependent thymic atrophy. The number of thymocytes is lower in the mice at 3 weeks after tumor implantation and this reduction is further evident at 5 weeks after tumor implantation. In addition, all glioma bearing mice (3 weeks and more) show a low proportion of DP thymocytes and altered proportions of the different subpopulations of DN cells defined by the expression of CD44 and CD25 cell markers [30]. The increase in the percentage of SP thymocytes in glioma bearing mice may results from an accelerated development of thymocytes and enhanced influx of T-cell progenitors from the bone marrow [31]. These changes are similar to those observed in mice exposed to xenobiotics [32] or aging [33]. While Notch signaling has been implicated in the decision processes underlying the functional bifurcation of CD4/CD8 T lymphocytes [34], the molecular mechanisms whereby Notch regulates these diverse functions have not been fully characterized.
Several observations strongly suggest that Notch activation may be induced by interaction with Notch ligands (Jagged-1 and -2; Delta-like1, 3, and 4) in different hematopoietic environments [35]. Jagged-1 has also been shown to be involved in the regulation of CD4:CD8 cell ratio during thymic development [36]. More recently, the Jagged-1 intracellular domain has been shown to up-regulate activator protein 1 (AP-1) activity, a signaling pathway known to be important in many cancers [37]. However, studies on the effects of over-expression of Notch in T-cells have been controversial. Our result indicate that over-expression of the Notch ligand Jagged-1 in glioma bearing mice induces regulatory T-cells CD4+CD25+Foxp3+ in the thymus and not in the periphery. Some indirect arguments suggest a role for Notch and its ligands in the development and maintenance of Treg cells [38]. Jagged-1 has been well documented in human thymic epithelium [2], which appears to play a key role in the generation of Treg cells [29]. Recently, Jagged-1 and Delta-1 have been described to induce a dose-dependent inhibition of early activation markers CD69 and CD25, as well as inhibition of proliferation after anti-CD3 stimulation of purified CD4+ T-cells [39].
The expression of HO-1 is high in various malignancies and it has an anti-apoptotic role in tumor growth [40, 41]. HO-1 was originally identified as an enzyme that catalyses oxidative degradation of heme to form biliverdin, carbon monoxide, and free ion. Its expression is induced by stress-inducing stimuli such as hypoxia, heavy metals, UV radiation, reactive nitric oxide and ROS [42]. There is recent evidence that HO-1 also has cytoprotective and anti-apoptotic functions against oxidative injury [41]. In this study, we show that HO-1 is one of the genes transcriptionally up-regulated in TIL of glioma and it is involved in this process.
The thymic phenotype of tumor bearing mice might be explained by a direct role of Notch and its ligand Jagged-1 on thymocyte precursor development. Our results of bone marrow transplantation into irradiated recipient mice suggest this possibility, as glioma bearing mice with bone marrow transplants show precursors which colonize the thymus with defect in T-cell distribution. Notably, bone marrow precursors used for these experiments were isolated from mice with different size of the thymus. These results indicate that Notch and its ligand Jagged-1 expression by GL261 glioma cell line in vivo is a gain-of-function and can significantly affect proliferation of DP and SP thymocytes.
In summary, we describe in this study the effect of glioma progression on T-cell homeostasis and thymic development, which result in atrophy of the thymus and in reduced thymic cellularity. We speculate that the developmental defect in DP is mediated by Notch and its ligand Jagged-1 expressed by glioma in vivo. Our data provide an additional model suggesting the function of Notch and/or its ligand Jagged-1 in the control of the CD4/CD8 checkpoint. This model indicates that HO-1 functions as an antiapoptotic defense for the TIL of glioma and could be a potential target for glioma immunotherapy.
Acknowledgments
We gratefully acknowledge the editorial assistance of Cleo Rolle, PhD. This study was supported by the Elsa U. Pardee Foundation as well as the Brain Research Foundation.
References
- 1.Ribatti D, Crivellato E, Vacca A. Miller’s seminal studies on the role of thymus in immunity. Clin Exp Immunol. 2006;144:371–375. doi: 10.1111/j.1365-2249.2006.03060.x. [DOI] [PMC free article] [PubMed] [Google Scholar]
- 2.Anderson G, Jenkinson EJ. Lymphostromal interactions in thymic development and function. Nat Rev Immunol. 2001;1:31–40. doi: 10.1038/35095500. [DOI] [PubMed] [Google Scholar]
- 3.Miele L, Osborne B. Arbiter of differentiation and death: Notch signaling meets apoptosis. J Cell Physiol. 1999;181:393–409. doi: 10.1002/(SICI)1097-4652(199912)181:3<393::AID-JCP3>3.0.CO;2-6. [DOI] [PubMed] [Google Scholar]
- 4.Artavanis-Tsakonas S, Rand MD, Lake RJ. Notch signaling: cell fate control and signal integration in development. Science. 1999;284:770–776. doi: 10.1126/science.284.5415.770. [DOI] [PubMed] [Google Scholar]
- 5.Martinez Arias A, Zecchini V, Brennan K. CSL-independent Notch signalling: a checkpoint in cell fate decisions during development? Curr Opin Genet Dev. 2002;12:524–533. doi: 10.1016/S0959-437X(02)00336-2. [DOI] [PubMed] [Google Scholar]
- 6.Bray S. Notch signalling in Drosophila: three ways to use a pathway. Semin Cell Dev Biol. 1998;9:591–597. doi: 10.1006/scdb.1998.0262. [DOI] [PubMed] [Google Scholar]
- 7.Rangarajan A, Talora C, Okuyama R, Nicolas M, Mammucari C, Oh H, Aster JC, Krishna S, Metzger D, Chambon P, Miele L, Aguet M, Radtke F, Dotto GP. Notch signaling is a direct determinant of keratinocyte growth arrest and entry into differentiation. Embo J. 2001;20:3427–3436. doi: 10.1093/emboj/20.13.3427. [DOI] [PMC free article] [PubMed] [Google Scholar]
- 8.Robey E, Chang D, Itano A, Cado D, Alexander H, Lans D, Weinmaster G, Salmon P. An activated form of Notch influences the choice between CD4 and CD8 T cell lineages. Cell. 1996;87:483–492. doi: 10.1016/S0092-8674(00)81368-9. [DOI] [PubMed] [Google Scholar]
- 9.Qi H, Rand MD, Wu X, Sestan N, Wang W, Rakic P, Xu T, Artavanis-Tsakonas S. Processing of the notch ligand delta by the metalloprotease Kuzbanian. Science. 1999;283:91–94. doi: 10.1126/science.283.5398.91. [DOI] [PubMed] [Google Scholar]
- 10.Li L, Milner LA, Deng Y, Iwata M, Banta A, Graf L, Marcovina S, Friedman C, Trask BJ, Hood L, Torok-Storb B. The human homolog of rat Jagged1 expressed by marrow stroma inhibits differentiation of 32D cells through interaction with Notch1. Immunity. 1998;8:43–55. doi: 10.1016/S1074-7613(00)80457-4. [DOI] [PubMed] [Google Scholar]
- 11.Six E, Ndiaye D, Laabi Y, Brou C, Gupta-Rossi N, Israel A, Logeat F. The Notch ligand Delta1 is sequentially cleaved by an ADAM protease and gamma-secretase. Proc Natl Acad Sci USA. 2003;100:7638–7643. doi: 10.1073/pnas.1230693100. [DOI] [PMC free article] [PubMed] [Google Scholar]
- 12.Deftos ML, Huang E, Ojala EW, Forbush KA, Bevan MJ. Notch1 signaling promotes the maturation of CD4 and CD8 SP thymocytes. Immunity. 2000;13:73–84. doi: 10.1016/S1074-7613(00)00009-1. [DOI] [PMC free article] [PubMed] [Google Scholar]
- 13.Reizis B, Leder P. Direct induction of T lymphocyte-specific gene expression by the mammalian Notch signaling pathway. Genes Dev. 2002;16:295–300. doi: 10.1101/gad.960702. [DOI] [PMC free article] [PubMed] [Google Scholar]
- 14.Krebs LT, Deftos ML, Bevan MJ, Gridley T. The Nrarp gene encodes an ankyrin-repeat protein that is transcriptionally regulated by the notch signaling pathway. Dev Biol. 2001;238:110–119. doi: 10.1006/dbio.2001.0408. [DOI] [PubMed] [Google Scholar]
- 15.Pirot P, van Grunsven LA, Marine JC, Huylebroeck D, Bellefroid EJ. Direct regulation of the Nrarp gene promoter by the Notch signaling pathway. Biochem Biophys Res Commun. 2004;322:526–534. doi: 10.1016/j.bbrc.2004.07.157. [DOI] [PubMed] [Google Scholar]
- 16.Weerkamp F, Luis TC, Naber BA, Koster EE, Jeannotte L, van Dongen JJ, Staal FJ. Identification of Notch target genes in uncommitted T-cell progenitors: No direct induction of a T-cell specific gene program. Leukemia. 2006;20:1967–1977. doi: 10.1038/sj.leu.2404396. [DOI] [PubMed] [Google Scholar]
- 17.Deftos ML, He YW, Ojala EW, Bevan MJ. Correlating notch signaling with thymocyte maturation. Immunity. 1998;9:777–786. doi: 10.1016/S1074-7613(00)80643-3. [DOI] [PMC free article] [PubMed] [Google Scholar]
- 18.Marford LA, Dix AR, Brooks WH, Roszman TL. Apoptotic elimination of peripheral T lymphocytes in patients with primary intracranial tumors. J Neurosurg. 1999;91:935–46. doi: 10.3171/jns.1999.91.6.0935. [DOI] [PubMed] [Google Scholar]
- 19.Prins RM, Graf MR, Merchant RE, Black KL, Wheeler CJ. Thymic function and output of recent thymic emigrant T cells during intracranial glioma progression. J Neurooncol. 2003;64:45–54. doi: 10.1007/BF02700019. [DOI] [PubMed] [Google Scholar]
- 20.Purow BW, Haque RM, Noel MW, Su Q, Burdick MJ, Lee J, Sundaresan T, Pastorino S, Park JK, Mikolaenko I, Maric D, Eberhart CG, Fine HA. Expression of Notch-1 and its ligands, Delta-like-1 and Jagged-1, is critical for glioma cell survival and proliferation. Cancer Res. 2005;65:2353–2363. doi: 10.1158/0008-5472.CAN-04-1890. [DOI] [PubMed] [Google Scholar]
- 21.El Andaloussi A, Graves S, Meng F, Mandal M, Mashayekhi M, Aifantis I. Hedgehog signaling controls thymocyte progenitor homeostasis and differentiation in the thymus. Nat Immunol. 2006;7:418–426. doi: 10.1038/ni1313. [DOI] [PubMed] [Google Scholar]
- 22.Schwarzler C, Oliferenko S, Gunthert U. Variant isoforms of CD44 are required in early thymocyte development. Eur J Immunol. 2001;31:2997–3005. doi: 10.1002/1521-4141(2001010)31:10<2997::AID-IMMU2997>3.0.CO;2-J. [DOI] [PubMed] [Google Scholar]
- 23.Judge AD, Zhang X, Fujii H, Surh CD, Sprent J. Interleukin 15 controls both proliferation and survival of a subset of memory-phenotype CD8(+) T cells. J Exp Med. 2002;196:935–946. doi: 10.1084/jem.20020772. [DOI] [PMC free article] [PubMed] [Google Scholar]
- 24.Sancho D, Gomez M, Sanchez-Madrid F. CD69 is an immunoregulatory molecule induced following activation. Trends Immunol. 2005;26:136–140. doi: 10.1016/j.it.2004.12.006. [DOI] [PubMed] [Google Scholar]
- 25.Feng C, Woodside KJ, Vance BA, El-Khoury D, Canelles M, Lee J, Gress R, Fowlkes BJ, Shores EW, Love PE. A potential role for CD69 in thymocyte emigration. Int Immunol. 2002;14:535–544. doi: 10.1093/intimm/dxf020. [DOI] [PubMed] [Google Scholar]
- 26.El Andaloussi A, Lesniak MS. CD4(+) CD25 (+) FoxP3 (+) T-cell infiltration and heme oxygenase–1 expression correlate with tumor grade in human gliomas. J Neurooncol. 2007;83:145–152. doi: 10.1007/s11060-006-9314-y. [DOI] [PubMed] [Google Scholar]
- 27.Mayerhofer M, Florian S, Krauth MT, Aichberger KJ, Bilban M, Marculescu R, Printz D, Fritsch G, Wagner O, Selzer E, Sperr WR, Valent P, Sillaber C. Identification of heme oxygenase-1 as a novel BCR/ABL-dependent survival factor in chronic myeloid leukemia. Cancer Res. 2004;64:3148–3154. doi: 10.1158/0008-5472.CAN-03-1200. [DOI] [PubMed] [Google Scholar]
- 28.Anderson G, Pongracz J, Parnell S, Jenkinson EJ. Notch ligand-bearing thymic epithelial cells initiate and sustain Notch signaling in thymocytes independently of T cell receptor signaling. Eur J Immunol. 2001;31:3349–3354. doi: 10.1002/1521-4141(200111)31:11<3349::AID-IMMU3349>3.0.CO;2-S. [DOI] [PubMed] [Google Scholar]
- 29.Sakaguchi S. Regulatory T cells: key controllers of immunologic self-tolerance. Cell. 2000;101:455–458. doi: 10.1016/S0092-8674(00)80856-9. [DOI] [PubMed] [Google Scholar]
- 30.Godfrey DI, Kennedy J, Suda T, Zlotnik A. A developmental pathway involving four phenotypically and functionally distinct subsets of CD3–CD4–CD8–triple-negative adult mouse thymocytes defined by CD44 and CD25 expression. J Immunol. 1993;150:4244–4252. [PubMed] [Google Scholar]
- 31.Drela N, Bien J, Kozlowska E. T-cell homeostasis in mice exposed to airborne xenobiotics. Immunology. 2005;114:476–483. doi: 10.1111/j.1365-2567.2005.02092.x. [DOI] [PMC free article] [PubMed] [Google Scholar]
- 32.Drela N. Xenobiotic-induced alterations in thymocyte development. Apmis. 2006;114:399–419. doi: 10.1111/j.1600-0463.2006.apm_343.x. [DOI] [PubMed] [Google Scholar]
- 33.Drela N, Zesko I. Gender-related early immune changes in mice exposed to airborne suspended matter. Immunopharmacol Immunotoxicol. 2003;25:101–121. doi: 10.1081/IPH-120018288. [DOI] [PubMed] [Google Scholar]
- 34.Ciofani M, Knowles GC, Wiest DL, von Boehmer H, Zuniga-Pflucker JC. Stage-specific and differential notch dependency at the alphabeta and gammadelta T lineage bifurcation. Immunity. 2006;25:105–116. doi: 10.1016/j.immuni.2006.05.010. [DOI] [PubMed] [Google Scholar]
- 35.Milner LA, Bigas A. Notch as a mediator of cell fate determination in hematopoiesis: evidence and speculation. Blood. 1999;93:2431–2448. [PubMed] [Google Scholar]
- 36.Jimenez E, Vicente A, Sacedon R, Munoz JJ, Weinmaster G, Zapata AG, Varas A. Distinct mechanisms contribute to generate and change the CD4:CD8 cell ratio during thymus development: a role for Notch ligand, Jagged 1. J Immunol. 2001;166:5898–5908. doi: 10.4049/jimmunol.166.10.5898. [DOI] [PubMed] [Google Scholar]
- 37.LaVoie MJ, Selkoe DJ. The Notch ligands, Jagged and Delta, are sequentially processed by alpha-secretase and presenilin/gamma-secretase and release signaling fragments. J Biol Chem. 2003;278:34427–34437. doi: 10.1074/jbc.M302659200. [DOI] [PubMed] [Google Scholar]
- 38.Ng WF, Duggan PJ, Ponchel F, Matarese G, Lombardi G, Edwards AD, Isaacs JD, Lechler RI. Human CD4(+) CD25(+) cells: a naturally occurring population of regulatory T cells. Blood. 2001;98:2736–2744. doi: 10.1182/blood.V98.9.2736. [DOI] [PubMed] [Google Scholar]
- 39.Jaleco AC, Neves H, Hooijberg E, Gameiro P, Clode N, Haury M, Henrique D, Parreira L. Differential effects of Notch ligands Delta-1 and Jagged-1 in human lymphoid differentiation. J Exp Med. 2001;194:991–1002. doi: 10.1084/jem.194.7.991. [DOI] [PMC free article] [PubMed] [Google Scholar]
- 40.Doi K, Akaike T, Fujii S, Tanaka S, Ikebe N, Beppu T, Shibahara S, Ogawa M, Maeda H. Induction of haem oxygenase-1 nitric oxide and ischaemia in experimental solid tumours and implications for tumour growth. Br J Cancer. 1999;80:1945–1954. doi: 10.1038/sj.bjc.6690624. [DOI] [PMC free article] [PubMed] [Google Scholar]
- 41.Tanaka S, Akaike T, Fang J, Beppu T, Ogawa M, Tamura F, Miyamoto Y, Maeda H. Antiapoptotic effect of haem oxygenase-1 induced by nitric oxide in experimental solid tumour. Br J Cancer. 2003;88:902–909. doi: 10.1038/sj.bjc.6600830. [DOI] [PMC free article] [PubMed] [Google Scholar]
- 42.Morse D, Choi AM. Heme oxygenase-1: the “emerging molecule” has arrived. Am J Respir Cell Mol Biol. 2002;27:8–16. doi: 10.1165/ajrcmb.27.1.4862. [DOI] [PubMed] [Google Scholar]


