Abstract
Transferrin receptor (TfR/CD71) deserves attention as a selective target for cancer therapy due to its higher expression in tumors versus normal tissues. Also, it has been shown the mouse-derived monoclonal antibody against TfR can significantly inhibit the proliferation of tumor cells. Through constructing the chimeric antibody against TfR, the antigenicity of antibody can be weakened, and most importantly, the antitumor effect of antibody can be strengthened by the introduction of the human Fc fragment. In previous studies, we successfully constructed the human-mouse chimeric antibody against TfR (D2C) and demonstrated that its Fab fragment could specially recognize the TfR on the surface of target cells. In this study, through labeling the chimeric antibody D2C with 125I, we calculated the affinity constant (Ka) of 9.34–9.62×10⁹ l/mol for this antibody according to the Scatchard drawing method. Moreover, in vivo studies in nude mice-bearing human liver cancer (SMMC-7721) xenografts have shown that the radioactivity distribution ratio of 131I-D2C on T/NT was 2–14:1 or 3–21:1 on the seventh day after intraperitoneal or intratumoral injection of 131I-labeled D2C (131I-D2C). These evidences indicated that the in vivo distribution of D2C display the characteristics of certain tumor-specificity localization. In vitro studies, D2C can induce the apoptosis of K562 through the mitochondria death pathway and arrest the cell at G1 phase, as determined by cell cycle analysis. Using the human tumor cells (K562, CEM, and SMMC-7721) expressing TfR as target cells, and normal human PBMC as effector cells, Fc fragment of D2C can perform both the antibody-dependent cell-mediated cytotoxicity and the complement-dependent cytotoxicity. Together, it was demonstrated that the D2C display a tumor-specificity distribution, and has a strong antitumor effect. Thus, it has the potential therapeutic significance.
Keywords: Transferrin receptor, Human-mouse chimeric antibody, Antitumor, In vivo tumor-specificity distribution
Introduction
Transferrin (Tf) serves as the iron source for hemoglobin synthesizing in immature red blood cells, after binding the transferrin receptor (TfR) [1] on the cell surface. Tf is internalized into an acidic compartment where iron dissociates and the remaining TfR–apo-Tf complex recycles back to the cell surface where apo-Tf dissociates and the receptor becomes capable of binding again ferri-Tf. Because of its pivotal role in iron uptake, the TfR is more abundantly expressed in rapidly dividing cells than quiescent cells [2–4], and high levels of TfR expression have been identified on many tumors [5–9]. In fact, studies have shown that the TfR is expressed more abundantly in malignant tissues than in normal tissues [10]. Anti-TfR antibody was supposed to inhibit cell growth and proliferation especially in malignant cancer cells by blocking the engagement of Tf with its receptor and interfering the intake of iron into cell. Laboratory investigation and clinical studies have implicated that the monoclonal antibody against TfR can inhibit the proliferation of tumor cells effectively [11], and also the targeted treatment of using monoclonal antibodies has shown to be potential in the early clinical stage [12].
However, murine antibodies as such are not ideal human therapeutics, due to the high probability of developing specific immunity or allergic reaction to therapeutic [13], thus limiting its further application in clinical studies. For these reasons, researchers tried to reconstruct antibodies for clinical use. In the last two decades, research and development of chimeric antibody has been improved greatly. For example FDA was recently approved some chimeric antibodies, such as Rituxan (Rituximab) and Herceptin (Trastuzumab) [14, 15] for clinical application. These antibodies were used to treat B-cell lymphoma and Her-2/neu metastatic mammary carcinoma, respectively. Rituximab was approved in the United States to treat low-grade or follicular, relapsed or refractory, CD20-positive B-cell non-Hodgkin’s lymphoma. New studies are performing to evaluate rituximab’s role in first-line therapy, maintenance therapy, and stem-cell transplantation procedures [16]. It was proposed that the antitumor mechanism: human-mouse chimeric antibody retained the special recognition to antigen which monoclonal antibodies possess, while reducing the immunogenicity to self that mouse-derived monoclonal antibody elicited. Additionally, the human-derived Fc fragment can enhance the antitumor effect of antibody through mediating the complement-dependent cytotoxicity (CDC) and antibody-dependent cell-mediated cytotoxicity (ADCC) [17]. The human-mouse chimeric antibody Rituximab has been shown to possess all the above features, confirmed by both in vitro and in vivo [17, 18] experiments. Likewise, for the further clinical application of human-mouse chimeric antibody against TfR (D2C) which have been successfully constructed and named as D2C in our previous work [19], serial studies on D2C need to be performed. Aim of this study is to investigate the affinity of D2C, its in vivo tumor-specificity distribution, and anticancer effect in vitro. For this purpose, using the radiolabeled D2C, we calculated the affinity constant (Ka); in combination with an artifical ‘tumor’ implanted s.c. in mice, this system was then extended into an in vivo targeting model, the efficacy of targeting was assessed by the serial imaging of live animals on a single photon emission computed tomography (SPECT) with quantitative image analysis and by postmortem tissue counting. Flow cytometry was used to analyze the apoptosis rate and cell cycle induced by Fab fragment of D2C, and CDC and ADCC were used to measure the antitumor effects by Fc fragment of D2C.
Materials and methods
Cell lines and culture conditions
CEM (human T cell lymphoma), K562 (Human chronicity erythroleukemia cell line), and SMMC-7721 (Human hepatocellular carcinoma cell) all highly express TfR. The hybridoma cell line 7579 secreting murine monoclonal antibody against TfR was stocked in our lab. The transfectoma cell line secreting human/murine chimeric antibody against TfR have been constructed and saved in our lab [19]. All of the cell lines grew in RPMI 1640 supplemented with 10% heat-inactivated FBS and cultured in 5% CO2 at 37°C, and 400 μg/ml G418 was added into cell culture medium of transfectoma.
Animal
Balb/c (nu/nu) nude mice were purchased from the Experimental Animal Center, Chinese Academy of Sciences. They are female nude mice, 19–23 g and 4–5-weeks old. All animal protocols were approved by the governmental Committee on use and care of laboratory animals.
Preparation of antibodies
The transfectoma D2C was intraperitoneally inoculated into Balb/c (nu/nu) nude mouse to induce the ascites for preparation of D2C. Hybridoma 7579 was inoculated into Balb/c mouse to induce the ascites for the preparation of mouse monoclonal antibody against TfR. The antibodies were purified from the ascites via DEAE-Sephadex A-50 chromatography and identified by SDS-PAGE.
Procedures of radionuclides and radiolabeling
Iodine-125 (9.17 GBq/ml or 248 mCi/ml, free from reductant) and iodine-131 (25.9 GBq/ml or 700 mCi/ml, free from reductant) were purchased as sodium iodide in 0.1 M NaOH from Nuclear Power Institute of China. Radio iodination was performed using the chloramine T method (125I: protein ratio, 1:10), as described previously [20]. Using 131I- and 125I-labeled, the specific activity of antibody protein D2C was 79.6 KBq/ml and 70.2 Bq/μg, respectively. The quality of each preparation was confirmed by size exclusion high-performance liquid chromatography. The amount of unbound radioiodine was less than 2% in each preparation. The immunoreactivity of each preparation, which was tested by a cell-binding assay, was more than 80% in all cases.
Measurement of antibody affinity constant
The Ka of D2C was determined by diluted antibody method with125I-labeled D2C. The antibody Ka was evaluated using expressions derived from the mass action law by Scatchard graphic method, as described previously [21].
In vivo tumor-specificity distribution of D2C
The aforementioned animals were intraperitoneally administered cyclophosphamide (200 mg/kg) to enhance the formation of tumors. A week later, they were inoculated with SMCC-7721 at a dose rate of 1×10⁷ cells/mouse to establish the animal model of tumor xenograft. When the tumors had achieved a size of 150–300 mm3, Lugol’s solution was placed in their drinking water to block thyroid accumulation of radioiodine, and in vivo tumor-specificity distribution studies were initiated.
Two groups of tumor-bearing mice were intraperitoneally injected with 250 μl 131I-D2C (group A) and free Na131I (group B), respectively; the other two groups of mice were intratumorally injected with 131I-D2C (group C) and free Na131I (group D). Before injection was performed, the cpm value of free Na131I was adjusted to be equivalent to labeling D2C. The SPECT imagines were performed on first, third, and seventh day. Cohorts of five mice were sacrificed on the seventh day after injection; their main organs and tumor tissues were collected and weighed. A gamma counter was used to measure the radioactivity (cpm/g), and then the radioactivity ratio of the tumors to non-tumors (T/NT) was calculated.
Measurement of cell growth and viability
Growth inhibition of K562 cells was determined by using the colorimetric 3-(4,5-dimethylthiazol-2-yl)-2,5-diphenyltetrazolium bromide (MTT) cell viability/proliferation assay as described previously [22, 23]. K562 were harvested during the logarithm growth period, were diluted to 1×10⁵/ml, Cells were added into 96-well plate (100 μl/well) and triplicated. Serial diluted D2C, mouse monoclonal antibody against TfR or control antibodies were, respectively, added to well and then incubated at 37°C for 48 h; Triple wells for each concentration. Subsequently, 10 μl of MTT reagent (Sigma; 10 mg/ml) was added and allowed to react for 1.5 h at 37°C before the addition of solubilization reagent [100 μl of 20% SDS in 50% dimethyl formamide and 50% H2O (pH 4.7)]. Substrate cleavage was monitored at 570 nm by using a SPECTRAmax 340 microplate reader and analyzed using SOFTmax PRO software (Molecular Devices, Sunnyvale, CA, USA).
The viability of K562 cells was assessed by morphology analysis using an inverted phase-contrast microscope (Leitz, Wetzlar, Germany) and trypan blue exclusion assays. 1×10⁵ cells were plated into 24-well plate, and D2C, mouse monoclonal antibody or control antibodis were added in order, triple wells for each concentration. The survival cells were counted with trypan blue staining method at day 1, 2, 3, 4, 5, 6, and 7 after cell culture, respectively and then growth curve was drawn.
DNA gel electrophoresis
Untreated and D2C-treated K562 cells (2×10⁶ cells) were harvested and washed with PBS. The cells were resuspended in 500 μl of lysis buffer (10 mM Tris, pH 7.8, 2 mM EDTA, 0.5% SDS) and incubated for 10 min at room temperature. The supernatant was collected and incubated with 2 μl of 20 mg/ml RNase A for 1 h at 37°C. After treatment with 2 μl of proteinase K (20 mg/ml) for 3 h at 56°C, genomic DNA was extracted with 1 volume of phenol/chloroform/isoamylalcohol (25:24:1, v/v, Sigma, MO, USA) solution, and DNA was precipitated by incubating with 0.1 volume of 3 M NaAc and 2.5 volume of cold 100% alcohol. DNA pellet was washed with 70% ethanol, dried under vacuum and subsequently dissolved in 25 μl of TE buffer (1 M Tris–Cl, 100 mM EDTA, pH 7.5). DNA samples were subjected to 1.5% agarose gel and the bands were visualized under ultraviolet illumination.
Analysis of apoptosis and cell cycle by FCM with annexin V-PI staining
Quantitation of cell apoptosis rate was determined by fluorescence-activated cell sorting (FACS) analysis. 1×10⁶ K562 cells grow in medium with D2C, control antibodies or free antibody for 24 h. For Annexin V-PI staining, cells centrifugalized and washed twice in cold PBS and resuspended in binding buffer (10 mM HEPES/NaOH pH 7.4, 140 mM NaCl, 2.5 mM CaCl2) at a concentration of 106 cells/ml. One hundred microliter of cells was transferred to a FACScan tube to which was added 10 μl of a 10 μg/ml fluorescein-conjugated Annexin V solution (IQ Corp, Groningen, Netherlands) and 10 μl of a 50 μg/ml PI solution. Annexin V is a phosphatidylserine-binding protein that detects phosphatidylserine on the surface of cells undergoing apoptosis, whereas PI associates with nuclear DNA, indicating necrotic cell death. Four hundred microliters of binding buffer was added to the cells and they were analyzed by flow cytometry within 1 h of staining. The data from 10,000 cells were collected and analyzed using the lysis II software. The signals of green fluorescence (FL1; Annexin V) and orange fluorescence (FL2; PI) were measured by logarithmic amplification.
Measurement of caspase-8 activation
Cells were cultured in the medium containing 25 μg/ml, 100 μg/ml D2C or 50 μg/ml non-specific IgG (isotypism control) for 48 h, and then 2×10⁶ cells were collected for each group after centrifuging at a speed of 400g for 5 min. And caspase-8 activity of each group was measured under the direction of operating manual of Caspase-8 Colorimetric Assay Kits (BD ApoAlert™ Caspase Colorimetric Assay Kits K2029-1). The absorbance at 405 nm was read using microplate reader (TECAN GENIOS, made in Austria), and caspase activity units of each sample were calculated according to slope of calibration curve.
Measurement of concentration of cytoplasmic cytochrome C
Cells were cultured in the medium containing 25 μg/ml, 100 μg/ml D2C or 50 μg/ml non-specific IgG (isotypism control) for 48 h, and then 5×10⁷ cells of K562 were collected to 15 ml centrifuge tube, and the concentration of cytoplasmic cytochrome C of each group was measured according to operating manual of Cytochrome C Release Apoptosis Assay Kit (Oncogene Ltd, USA).
Antibody-dependent cell-mediated cytotoxicity
K562, CEM and SMMC-7721 were used as target cells, which were harvested during the logarithm growth period, were diluted to 1×10⁶/ml with Hank’s solution (Ca2+). Peripheral blood mononuclear cells (PBMCs) isolated [24] by routine procedure were washed and suspended with 10% FCS-RPMI-1640, then adjusted to 5×10⁷/ml as an effector. Serial diluted D2C, control antibody or NP-40 were added to target cells to incubate at 4°C for 60 min. Following added effectors, cells were incubated overnight at 37°C. All conditions were performed in triplicate, and ADCC activity was tested by an LDH release assay. The optical density (OD) was measured by enzyme detector under 490 nm. The percentage of lysis was calculated by the formula:
 |
Here, ODexp is the OD value in sample, ODsp, the OD value in spontaneous release, and ODmax, the OD value of maximum release group.
Complement-dependent cytotoxicity
CEM and SMCC-7721 were diluted to the concentration of 1×10⁵/ml (target cells). Cells were triplicated and added into 96-well plate (100 μl/well) and cultured overnight. Serial diluted D2C or control antibodies were, respectively, added to well, then incubated at 37°C in a box for 1 h after 5 s of vibration; Added fresh rabbit’s complement (100 μl/ml), fully mixed for 5 s of vibration, and further incubated for 60 min. Heat-inactivated serum was used as a control to ensure the measurement of complement specific lysis. The survival cells in the wells were counted by trypan blue staining method. Antibody-mediated CDC was determined by subtracting the percentage of tumor cell lysis attributable to complement alone.
Statistical analysis
Statistical analysis of the experimental findings was made using a two-tailed Student’s t test. Results were regarded as significance if P values were <0.05.
Results
Affinity constant of D2C
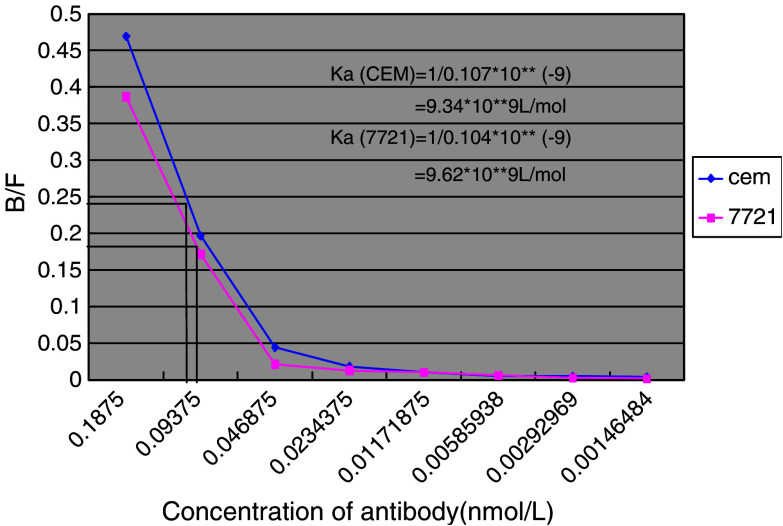
To evaluate D2C affinity and capability of binding to antigen, the Ka of D2C was determined by diluted antibody method with125I-labeled D2C. According to the Scatchard graphic method, binding rate between antigen and antibody (B/F) is represented on the y-axis, and different concentration of 125I-labeled D2C on the x-axis. When the binding rate of antigen to antibody decreased to 50%, the reciprocal of corresponding antibody concentration is the Ka of that antibody, as shown in Fig. 1. Using two different cell lines as described in Materials and methods, we calculated the Ka of D2C to be about 9.34–9.62×10⁹ l/mol. This indicated that the affinity of D2C was more than average, compared with Ka of monoclonal antibody (1×10⁵–1×10¹² l/mol).
Fig. 1.
The Scatchard plot of D2C affinity constant (Ka). CEM and 7721, using as cell antigen, were cultured under the conditions described in Materials and methods as well as 125I-labeled D2C. The binding rate between antigen and antibody (B/F) is represented on the y-axis, and x-axis displayed the D2C antibody concentration which was double-diluted, the changes of B/F corresponding to D2C concentration were made into the curves. When value of B/F decreased to 50%, Ka of antibody was equal to the reciprocal of corresponding antibody concentration, thus Ka of D2C is calculated to be about 9.34–9.62×10⁹ l/mol by this Scatchard plot
D2C displayed a feature of specific accumulation at tumor tissue
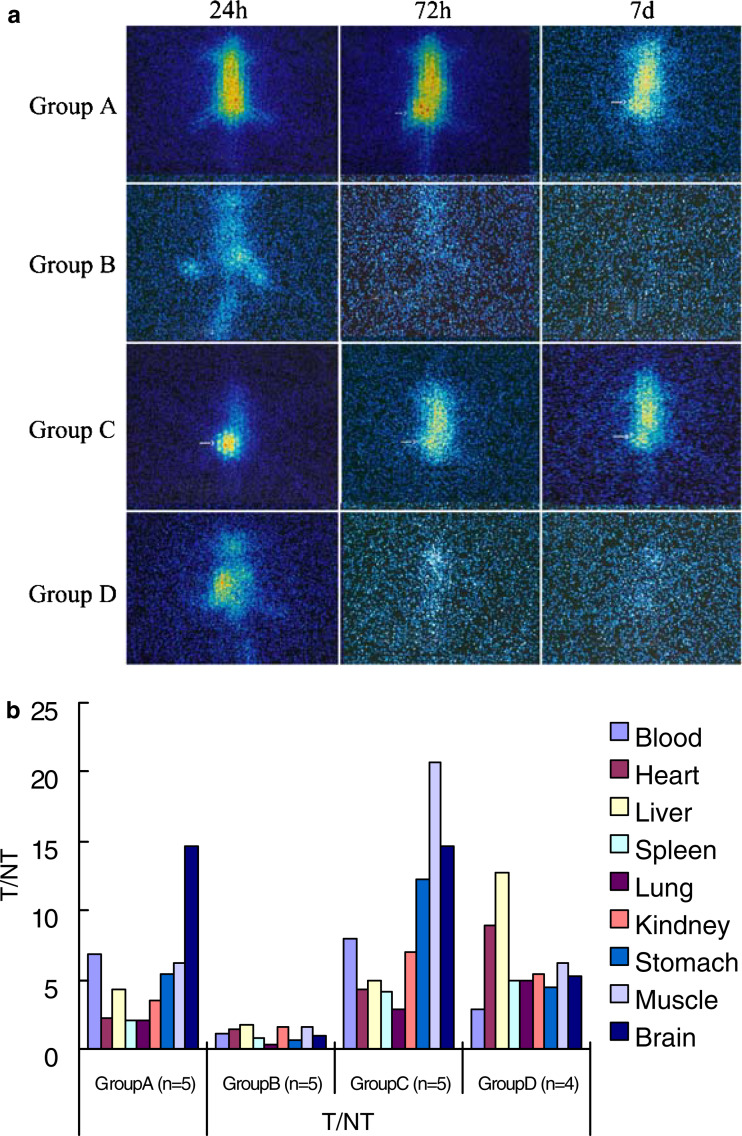
To determine whether antibody D2C could accumulate at tumor tissue, 131I-D2C was injected intraperitoneally into tumor-bearing nude mice. As represented in Fig. 2a, SPECT images showed that 131I-D2Cs were accumulated at tumor tissues 72 h after injection. The increased radioactivities were maintained until day 7 after administration. In contrast, injection of free 131I alone as control, the radioactivities were dramatically decreased 72 h after injection and reached the background level at day 7. While D2C was intratumorally injected, it was shown that the radioactivities at tumor tissues were much higher than that of other tissues 24 h after injection. In control group, the radioactivites were detected only at the site of injection, the tissues of lung as well as kidney. Moreover, the intensities of radiation were decreased significantly 24 h after injection.
Fig. 2.
Single photon emission computed tomography (SPECT) imagings of a single mouse per experiment group at representative time points. After establishing the animal model of tumor xenograft, two injection projects were performed, as described in “Materials and methods”. In the project of intraperitoneal injection, the tumor-bearing mice were injected with 250 μl 131I-D2C (group A) and free Na131I (group B), respectively, whereas the other two groups of mice were injected with 131I-D2C (group C) free Na131I (group D) for intratumoral injection project. Sequential images of a single mouse taken by SPECT for per experiment group at 24, 72 h and 7 days after injection were showed in (a). Initial radioactivity in the blood and main organs (heart, liver, and so on) tends to decrease over 72 h or 7 days in group B and D but retain in group A and C. Moreover, group C was observed that the radioactivities at tumor tissues were much higher than that of other tissues 24 h after injection. To further investigate the tissue distribution of D2C, all mice were sacrificed on the seventh day after injection; their main organs and tumor tissues were obtained and weighed. A gamma counter was used to measure the radioactivity (cpm/g), and then the radioactivity ratio of the tumors to non-tumors (T/NT) was calculated and was shown in (b), various coloration columns represent radioactivity ratio of tumor to various organs. T/NT value was over 2 in group A and group C (b); it demonstrated that D2C could specifically bind to tumor tissues, consistent with the mentioned SPECT images (a). With respect to the 131I-D2C distributions in various tissue and organs (cpm/g) of each tissue in four experiment groups at day 7 after injection was measured and shown in Table 1
To further evaluate the distribution of 131I-D2C at different organs and tissues, mice were sacrificed at day 7 after 131I-D2C was injected intraperitoneally. Various organs and tumor tissues were collected and weighed. Subsequently, the radiation intensity was determined by γ-liquid scintillation counter. The distribution index of 131I-D2C was calculated as cpm/g. As given in Table 1, no difference of the distribution in tumor tissues but significant difference in non-tumor tissues was observed between groups A and C. It indicated that the intratumoral injection of the antibody could decrease the non-specific combination with the other organs; T/NT value was over 2 in groups A and C (Fig. 2b), it demonstrated that D2C could specifically bind to tumor tissues.
Table 1.
Radioactivity (cpm/g) of each tissue or organ in tumor-bearing mice (Mean±1 SD) at day 7 after injection
| Organ | Group A (n=5) | Group B (n=5) | Group C (n=5) | Group D (n=4) | P value comparison A with C |
|---|---|---|---|---|---|
| Blood | 3.09±0.52 | 0.15±0.02 | 2.66±0.68 | 0.26±0.07 | 0.29 |
| Heart | 9.19±1.62** | 0.13±0.01 | 4.99±0.84** | 0.08±0.02 | 0.0009 |
| Liver | 4.84±0.95 | 0.10±0.01 | 4.31±0.49 | 0.06±0.01 | 0.2998 |
| Spleen | 10.43±1.24** | 0.21±0.06 | 5.19±1.38** | 0.15±0.03 | 0.0002 |
| Lung | 10.05±1.59* | 0.56±0.10 | 7.44±1.37* | 0.15±0.03 | 0.0239 |
| Kidney | 6.09±1.13** | 0.11±0.02 | 3.06±0.79** | 0.13±0.02 | 0.0012 |
| Stomach | 3.92±0.70** | 0.26±0.06 | 1.74±0.47** | 0.16±0.03 | 0.0004 |
| Muscle | 3.40±0.81** | 0.10±0.02 | 1.03±0.21** | 0.12±0.02 | 0.0002 |
| Brain | 1.44±0.30 | 0.19±0.04 | 1.45±0.18 | 0.14±0.03 | 0.9506 |
| Tumor | 21.02±4.44 | 0.17±0.03 | 21.28±2.72 | 0.73±0.15 | 0.9138 |
After finishing two administrations in animal model of tumor xenograft, it was performed an in vivo tumor-specificity distribution of D2C assay as described in “Materials and methods”. All mice were sacrificed on the seventh day after injection; their main organs and tumor tissues were collected and weighed. A gamma-counter was used to measure the radioactivity of them. Each data represents the average from 4 to 5 mice
*Comparison A with C, P<0.05
**Comparison A with C, P<0.01
Inhibition of cell growth by antibodies
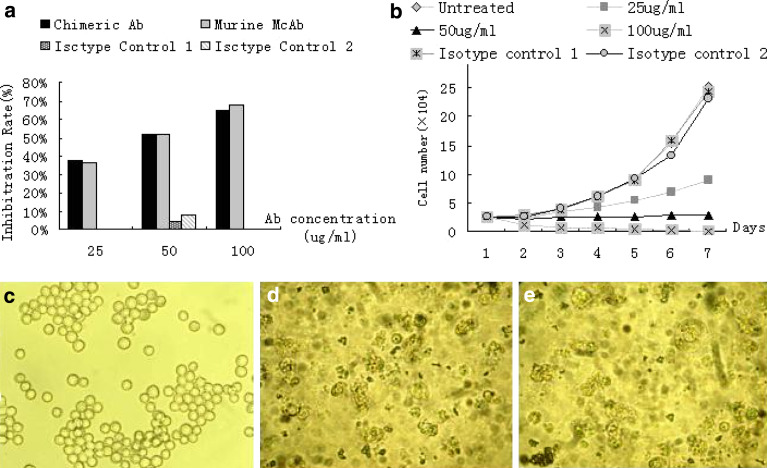
To analyze the inhibiting cell proliferation effect associated with TfR blocking, MTT assay was used to investigate the growth of K562 cells on treatment with D2C. As shown in Fig. 3a, 48 h after the co-culture with D2C of three different concentrations, it showed that the inhibition of K562 cell growth by D2C was dose-dependent, whereas no significant difference was found between the group of D2C and the group of monoclonal antibody against TfR with the same concentration (P>0.05). The unspecific growth-inhibitory effect of the mismatch control antibodies was comparatively low.
Fig. 3.
Effect of D2C treatment on the growth and viability of K562 cells. a Cells were incubated with an increasing concentration of D2C, monoclonal antibody against Transferrin receptor (TfR), or non-specific human IgG (50 μg/ml, isotypism control 1) or non-specific mouse IgG (50 μg/ml, isotypism control 2) control. Cell growth was determined in triplicate cultures 48 h after co-culture using the 3-(4,5-dimethylthiazol-2-yl)-2,5-diphenyltetrazolium bromide reagent as described in “Materials and methods”. Each value represents the mean±SD of three independent experiments. Absorbance values obtained with untreated cells maintaining under identical experimental conditions were taken as 100%. b Harvested during the logarithm growth period, 1×10⁵ cells of K562 were plated into 24-well plate and then incubated with D2C in the titration as described in above graph, non-specific human IgG (50 μg/ml, isotypism control 1) or non-specific mouse IgG (50 μg/ml, isotypism control 2). Total cell amount of each well was calculated by trypan blue staining through optical microscope (×100) each day for a week. Because the proximity results of three groups (untreated, isotypism control 1 and isotypism control 2) were presented in the parallel growth curves, they have overlapped and could not been differentiate. Photomicrographs of K562 cells after a 72 h coculture with (c) RPMI 1640, (d) D2C, or (e) monoclonal antibody against TfR. Cells treated with RPMI 1640 is specular globular, whereas most of the cells treated with D2C or monoclonal antibody against TfR is displayed many particles. (Original magnification, ×400)
To further determine whether D2C was capable of inhibiting cell proliferation as a result of TfR blocking, trypan blue exclusion assays and morphology analysis using an inverted phase-contrast microscope (Leitz, Wetzlar, Germany) were performed on K562 cells. Concentrations of D2C from 100 to 25 μg/ml were tested and shown to suppress the growth of K562 cells significantly in a dose-dependent fashion (Fig. 3b). When the D2C concentration increased to 100 μg/ml, the survivals K562 cell number decreased to 0 after a week. There was statistic difference in the survival cells number between the group of D2C with three different concentrations and the control group (P<0.05). It also revealed that the induced apoptosis of K562 cell displayed many particles through an inverted phase-contrast microscope, but K562 cell of control groups is specular globular.
Interference of K562 cell apoptosis and cell cycle caused by D2C
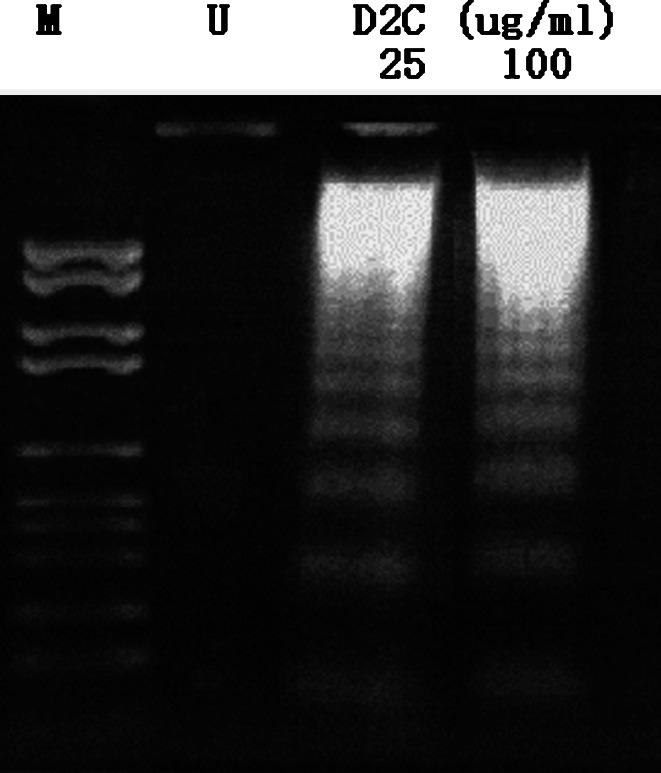
To determine the apoptotic mode of D2C in K562 cells, we examined whether D2C could induce internucleosomal degradation of DNA, a characteristic hallmark of apoptosis. K562 cells were treated with 25 or 100 μg/ml D2C for 3 days and the typical characteristics of cell death were verified by DNA fragmentation assay. As shown in Fig. 4, a ladder pattern of discontinuous DNA fragments was displayed at 25 or 100 μg/ml of D2C; however, no bands can be seen in control antibody group. This indicated that D2C could induce K562 cells apoptosis.
Fig. 4.
D2C-induced apoptosis of K562 indentified by DNA gel electrophoresis. We sought to whether D2C could induce human tumor cells apoptosis through binding TfR, K562 cells incubated with different concentrations (25 or 100 μg/ml) of D2C for 3 days. The apoptosis induced by D2C was measured as described in “Materials and methods”. DNA ladder bands were only observed in D2C-added groups in agarose gel electrophoresis. U untreated cells, M molecular marker
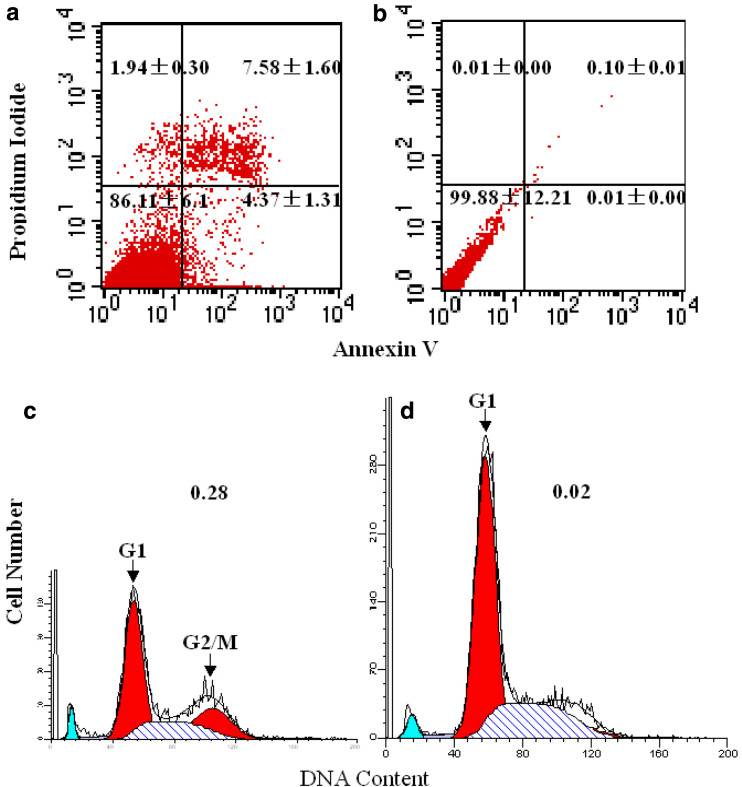
To further quantitatively assess the potential of D2C inducing K562 to apoptosis, apoptosis was determined by FCM with Annexin V-PI staining. K562 cells treated with 50 μg/ml D2C for 24 h were stained with a combination of Annexin V and PI (Fig. 5a). Flow cytometry analysis of affected cells demonstrated increased surface expression of phosphatidylserine, as evidenced by increased Annexin V binding, compared to control untreated cells (Fig. 5b). At the same time, these cells continued to exclude PI, which associates with the nuclear DNA of necrotic cells. Taken together, these data clearly indicate that D2C-treated K562 cells undergo increased levels of apoptosis.
Fig. 5.
Analysis of K562 cell apoptosis and cell cycle by FCM. Annexin V/PI staining of K562 cells 24 h after D2C-treated (a) compared with untreated control cells (b). Apoptotic cells in the lower right part have increased Annexin V fluorescence without loss of viability. The percentages of cells in each quadrant are indicated. K562 cells treated with 50 μg/ml D2C for 24 h were stained with PI for analysis of DNA content (d). The majority of control, untreated K562 cells (open peaks) had 2n DNA content (c), with a small peak at twice the fluorescence intensity representing dividing cells transiently in G2/M phase (4nDNA content). In comparison, D2C -treated k562 cells showed progressive accumulation of cells with 2n DNA content. Arrowheads indicate peaks of cells at the G1 and G2/M phases. The G2/M: G1 ratio is indicated in the upper right of each graph
In order to determine in which phase the cell cycle arrest occurs, we undertook flow cytometry analysis of the DNA content of K562 cells after PI staining. On the basis of cell cycle analysis, the D2C was shown to block the cell cycle at G1 phase (Fig. 5d), and statistical significance between D2C-treatd and control group (Fig. 5c).
The main pathway of antibody inducing apoptosis
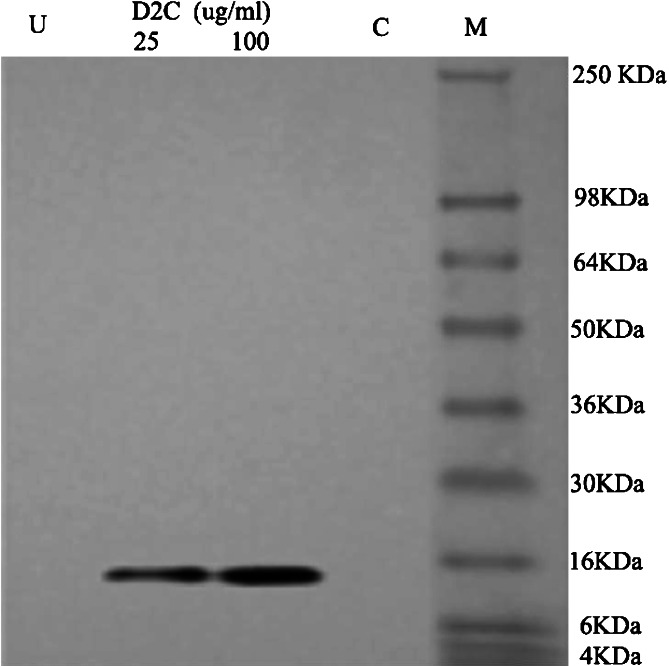
To further assess the main pathway of D2C inducing K562 cells to apoptosis, we detected caspses-8 activity and cytoplasmic cytochrome C concentration in K562 cells of apoptosis. After the treatment of K562 cells with 25, 50, and 100 μg/ml of D2C or mouse monoclonal antibody (50 μg/ml) for 48 h, the activity of caspase-8 was performed with Caspase-8 Colorimetric Assay Kits by microplate reader. The change of caspase-8 activity was in one-fold relative fluorescence units (×RFU), and no significant difference with untreated K562 cells (P>0.05), it suggested that K562 cell apoptosis induced by D2C is not through activating caspase-8. For K562 cells grown in medium containing 25 or 100 μg/ml of D2C for 48 h, the concentration of cytoplasmic cytochrome C was measured by Western-blot using Cytochrome C Release Apoptosis Assay Kit. It was shown that cytochrome C protein band was observed in the group of K562 cells treated with 25 or 100 μg/ml D2C, whereas no band was observed in both the untreated cell group and non-specific human IgG control group (Fig. 6). It indicated that K562 apoptosis induced by D2C is through the mitochondria death pathway which release cytochrome C to cytoplasm.
Fig. 6.
The content of cytochrome C in cytoplasm assayed by Western blot. K562 cells were treated with 25 and 100 μg/ml D2C or 50 μg/ml non-specific IgG (isotypism control) for 48 h and then the content of cytochrome C in cytoplasm was determined by Western blot by 12% polyacrylamide gel electrophoresis. U untreated cells, M molecular marker, C isotypism control
Antibody-dependent cell-mediated cytotoxicity
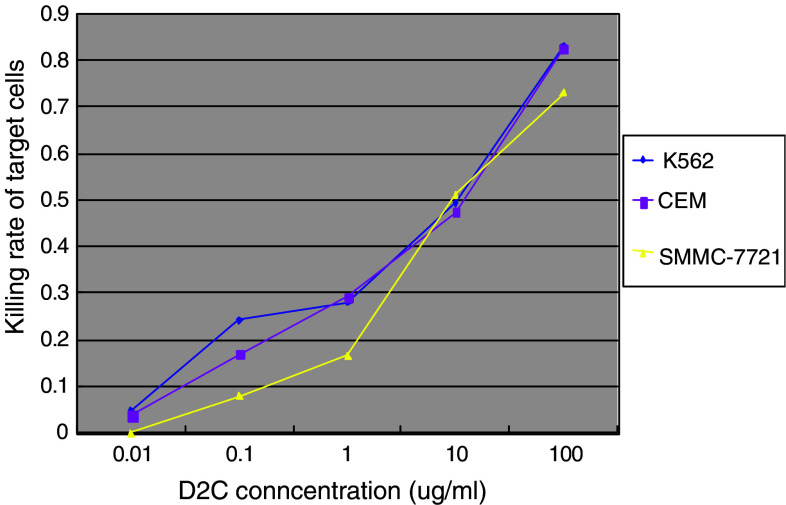
To determine ADCC mediated by D2C, we performed ADCC assays using PBMC isolated from healthy subjects as effector cells and cultured TfR-expressing tumor cells (CEM, SSMC-7721) as target cells. Results of ADCC obtained with 50:1 of effect cell/target cell are summarized in Fig. 7. The lytic activity mediated by D2C varied in different tumor cells, and the addition of D2C tite augmented tumor cell lysis mediated by D2C in various tumor cell lines. In contrast, cell lysis was not detectable after treatment with mouse mAb against TfR, non-specific human IgG and non-specific mouse IgG. Taken together, our results demonstrate that D2C could recognize TfR molecule and mediate the ADCC through the human IgG Fc fragment.
Fig. 7.
Antibody-dependent cell-mediated cytotoxicity (ADCC) on TfR-expressing tumor cells caused by D2C. Peripheral blood mononuclear cell isolated from peripheral blood of healthy subjects were used as effector cells against TfR-expressing tumor cells K562, CEM and SMMC-7721 in the presence of increasing concentrations of D2C overnight, and the detection of target cells killing rate was performed by LDH release assay as described in “Materials and methods”
Complement-dependent cytotoxicity
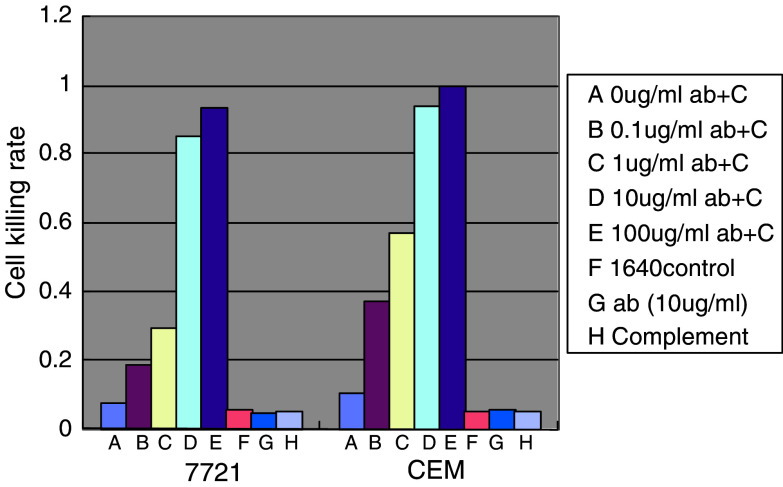
To determine whether the D2C is able to direct CDC, we performed CDC assays using sera from rabbit as the complement source and cultured TfR-expressing tumor cells (CEM, SSMC-7721) as a target. The results shown in Fig. 8 indicated that complement-dependent lysis was observed markedly in dose-dependent fashion when mediated only by D2C. In the blank control group (1640 medium), or the group with only antibody (10 μg/ml) or complement, the mortality rate of target cells were all less than 10%, and the cell morphology was almost normal, whereas obvious cell morphological and structural changes were observed in the cell treated with both antibody and complement.
Fig. 8.
Complement-dependent cytotoxicity (CDC) on TfR-expressing tumor cells caused by D2C. Fresh serum (100 μl/ml) from rabbit was used as the complement source against CEM and SSMC-7721 tumor cells in a 1-h survival cell count after a 1-h preincubation at 37°C of CEM and SSMC-7721 cells with increasing concentrations of D2C. The CDC assay was repeatedly performed three times. Ab represents D2C antibody; C represents complement
Discussion
In our previous studies, we constructed and expressed the D2C, and it was shown to have the same characteristics of antigen binding and same antigen binding site as its parent antibody [19]. In this study, through labeling D2C antibody with 125I, we calculated the Ka of this antibody to be 9.34–9.62×10⁹ l/mol by Scatchard graphic method, whereas 1×10⁵–1×10¹² l/mol for normal monoclonal antibody, which indicated that D2C antibody has a high affinity.
As is shown, in vivo antitumor effect of antibody partly attributes to its tumor-specialty distribution. Through radiolabeling chimeric antibody D2C according to classic Ch-T method, and utilizing SPECT technique, we also investigated whether D2C have the characteristics of in vivo tumor-special distribution in animal model of human liver cancer cell line (SMMC-7721) heterogeneous transplantation. It was showed that D2C could specially recognize TfR molecule expressing on the surface of SMMC-7721. The animal imaging and antibody distribution assay for intraperitoneal injection groups and intratumoral injection groups found, in the intratumoral injection groups, high concentration of labeled antibody distribution appeared in tumor tissue very early, whereas in intraperitoneal injection group this distinct antibody accumulation in tumor appeared 3 days after injection. Imagings at day 7 after injection showed the local antibody concentration in tumor has no significant difference between these two administration groups, but in other organs, the non-specific antibody distribution in intratumoral injection group was less than that in intraperitoneal administration group. This may attribute to the following: (1) the saturated combination of D2C with the antigen binding sites on the cell surface of tumor tissues may lead to a constant antibody concentration in a period of time; (2) because D2C has a weak capability of penetrating the tumor tissue, or some high tissue hydrostatic pressure exists inside tumor tissue, the increase of local antibody concentration may not facilitate its penetrating into tumor tissue. In brief, intratumoral injection cannot increase the antibody concentration in tumor tissue for a long term, but it can effectively decrease the non-specific binding of antibody to other organ tissues. This may suggest that the tumor local injection is a good way to reduce antibody adverse effect of non-specific killing other organ tissues during the treatment of solid tumor with pretherapeutic clear localization.
K562 is a human erythroleukemia cell line, and was expressing a high TfR on its cell surface. The murine Fab fragment of D2C can specially recognize TfR on K562. Our study showed that D2C could obviously inhibit the proliferation of K562 cell and induce its apoptosis, and this effect was dosage-, time-dependent when the final concentration of antibody was between 25 and 100 μg/ml.
Cell apoptosis was mainly mediated through the “mitochondria death pathway” caused by cellular DNA damage, and the “plasma-membrane dead receptor pathway”. For the “mitochondria death pathway”, cytochrome C inside release to cytoplasma as the result of mitochondria impairing, then it activates caspase-9 (mitochondria-activated caspase) and subsequent caspase to induce cell apoptosis; For the “plasma-membrane dead receptor pathway”, combination of the dead ligand in cytoplasma with the dead receptor on plasma membrane can activate caspase-8 (dead receptor-activated caspase) and subsequent caspase to induce apoptosis [25]. Our study showed that D2C-induced K562 apoptosis led to the increase of cytochrome C content in cytoplasm, but no change of active caspase-8, which indicated that D2C induced the apoptosis of K562 through the “mitochondria death pathway”. Analysis of cell cycle by flow cytometry showed that D2C might block the cell cycle of K562 at G1 phase. Based on this finding, it was supposed that D2C inducing K562 apoptosis may exhibit some evidences for its interfering with the transport of cytoplasmic iron ion: (1) Tf, the natural ligand of TfR, can carry iron ion when binding to TfR, so it may mediate the entrance of iron ion into cell. As we know, iron ion is required for cell growth and proliferation. D2C may induce the apoptosis of K562 by competitively binding TfR at the Tf binding site so as to block the iron ion-carrying Tf to bind with TfR, which may lead to the lack of iron for growing cell. Kovar et al. [26] has showed that induced the apoptosis of mouse B lymphocyte tumor 38C13 cell by three different methods that made tumor cell sideropenic, and one of them was using the mouse monoclonal antibody against TfR to treat 38C13 cell. (2) It was reported that, the iron chelator could lead to apoptosis of many types of tumor cell. Simonart et al. [27] showed that apoptosis of human Kaposi sarcoma cell induced by using desferrioxamine (DF), iron chelator, and the cell cycle was blocked at G1 phase. Our study showed that D2C could also block the cell cycle of K562 at G1, which indicated that D2C might have the same function as DF. (3) Maclean et al. [28] reported that the apoptosis caused by lack of iron was relative to mitochondria impair and cytochrome C release. In this study it also showed that D2C-induced K562 apoptosis led to the increase of cytochrome C content in cytoplasm, but no change of active caspase-8, which indicated that D2C induced the apoptosis of K562 mainly through the “mitochondria death pathway”, so, it have explained that D2C induced K562 to apoptosis was associated with D2C hindering iron transport and uptake.
The type and subtype of its constant region for D2C have been determined by the constructed expression vector, and like Rituximab, its heavy chain also belongs to human IgG1, and has a strong capability to activated complement [29]. When using human PBMC as effect cells, TfR-expressing human tumor cells K562, CEM and SMMC-7721 as target cells, with effect cells/target cells rate of 50:1, the ADCC of D2C was antibody concentration-dependent. In the presence of fresh complement, the killing effect of D2C to human tumor cells (CEM and SMMC-7721) was very notable. This indicated that Fc fragment of human IgG1 inserted into chimeric antibody might elicit the immunity response in human body so as to exert the antitumor effect, which was almost consistent with the research results on Rituximab.
To sum up, this investigation showed the constructed D2C has a high affinity to tumor but attenuated antigenicity to normal tissue, and its in vivo biodistribution displays tissue-specificity to tumor. D2C can obviously inhibit TfR-positive tumor cell proliferation due to its Fab fragment competitive binding to TfR and interference with iron transport and intake, and induce apoptosis of TfR-expressing tumor cell through the mitochondria death pathway. In vitro experiment, ADCC and CDC to tumor cells were performed in mediation of human Fc fragment inserted into D2C. These research results would lay the foundation of its further clinical trials; it also believed that chimeric antibody D2C is of great potential in application for tumor clinical treatment.
Acknowledgements
This project was supported by National Key and Basic Research Development Program (no. 2002CB513109). We thank Prof. Gong Feili for helpful discussions and critical reading of the manuscript and many cited colleagues for the reagents supplied, and Zhang Yue, Yang Jing and Shao Jingfang for assistance with cell culture and maintenance.
Abbreviations
- Ka
Affinity constant
- CDC
Complement-dependent cytotoxicity
- ADCC
Antibody-dependent cell-mediated cytotoxicity
- NHL
Non-Hodgkin’s lymphoma
- Tf
Transferrin
- TfR
Transferrin receptor
- FACS
Fluorescence-activated cell sorting
- SPECT
Single photon emission computed tomography
- D2C
Human-mouse chimeric antibody against TfR
- MTT
3-(4,5-Dimethylthiazol-2-yl)-2,5-diphenyltetrazolium bromide
- PBMC
Peripheral blood mononuclear cell
Footnotes
Ye Qing and Wang Shuo contributed equally to this work.
References
- 1.Cheng Y, Zak O, Aisen P, Harrison SC, Walz T. Structure of the human transferrin receptor-transferrin complex. Cell. 2004;116(4):565–576. doi: 10.1016/S0092-8674(04)00130-8. [DOI] [PubMed] [Google Scholar]
- 2.Larrick JW, Cresswell P. Modulation of cell surface iron transferrin receptors by cellular density and state of activation. J Supramol Struct. 1979;11(4):579–586. doi: 10.1002/jss.400110415. [DOI] [PubMed] [Google Scholar]
- 3.Sutherland R, Delia D, Schneider C, Newman R, Kemshead J, et al. Ubiquitous cell-surface glycoprotein on tumor cells is proliferation-associated receptor for transferrin. Proc Natl Acad Sci USA. 1981;78(7):4515–4519. doi: 10.1073/pnas.78.7.4515. [DOI] [PMC free article] [PubMed] [Google Scholar]
- 4.Trowbridge IS, Omary MB. Human cell surface glycoprotein related to cell proliferation is the receptor for transferrin. Proc Natl Acad Sci USA. 1981;78(5):3039–3043. doi: 10.1073/pnas.78.5.3039. [DOI] [PMC free article] [PubMed] [Google Scholar]
- 5.Lloyd JM, O'Dowd T, Driver M, Tee DE. Demonstration of an epitope of the transferrin receptor in human cervical epithelium—a potentially useful cell marker. J Clin Pathol. 1984;37(2):131–135. doi: 10.1136/jcp.37.2.131. [DOI] [PMC free article] [PubMed] [Google Scholar]
- 6.Raaf HN, Jacobsen DW, Savon S, Green R. Serum transferrin receptor level is not altered in invasive adenocarcinoma of the breast. Am J Clin Pathol. 1993;99(3):232–237. doi: 10.1093/ajcp/99.3.232. [DOI] [PubMed] [Google Scholar]
- 7.Recht LD, Griffin TW, Raso V, Salimi AR. Potent cytotoxicity of an antihuman transferrin receptor-ricin A-chain immunotoxin on human glioma cells in vitro. Cancer Res. 1990;50(20):6696–6700. [PubMed] [Google Scholar]
- 8.Prost AC, Menegaux F, Langlois P, Vidal JM, Koulibaly M, et al. Differential transferrin receptor density in human colorectal cancer: a potential probe for diagnosis and therapy. Int J Oncol. 1998;13(4):871–875. doi: 10.3892/ijo.13.4.871. [DOI] [PubMed] [Google Scholar]
- 9.Beguin Y, Lampertz S, De Groote D, Igot D, Malaise M, et al. Soluble CD23 and other receptors (CD4, CD8, CD25, CD71) in serum of patients with chronic lymphocytic leukemia. Leukemia. 1993;7(12):2019–2025. [PubMed] [Google Scholar]
- 10.Shindelman JE, Ortmeyer AE, Sussman HH. Demonstration of the transferrin receptor in human breast cancer tissue. Potential marker for identifying dividing cells. Int J Cancer. 1981;27(3):329–334. doi: 10.1002/ijc.2910270311. [DOI] [PubMed] [Google Scholar]
- 11.White S, Taetle R, Seligman PA, Rutherford M, Trowbridge IS. Combinations of anti-transferrin receptor monoclonal antibodies inhibit human tumor cell growth in vitro and in vivo: evidence for synergistic antiproliferative effects. Cancer Res. 1990;50(19):6295–6301. [PubMed] [Google Scholar]
- 12.Kreitman RJ, Pastan I. Recombinant toxins containing human granulocyte-macrophage colony-stimulating factor and either pseudomonas exotoxin or diphtheria toxin kill gastrointestinal cancer and leukemia cells. Blood. 1997;90(1):252–259. [PubMed] [Google Scholar]
- 13.Schroff RW, Foon KA, Beatty SM, Oldham RK, Morgan AC., Jr Human anti-murine immunoglobulin responses in patients receiving monoclonal antibody therapy. Cancer Res. 1985;45(2):879–885. [PubMed] [Google Scholar]
- 14.Grillo-Lopez AJ, White CA, Varns C, Shen D, Wei A, et al. Overview of the clinical development of rituximab: first monoclonal antibody approved for the treatment of lymphoma. Semin Oncol. 1999;26(5 Suppl 14):66. [PubMed] [Google Scholar]
- 15.Goldenberg MM. A recombinant DNA-derived humanized monoclonal antibody, a novel agent for the treatment of metastatic breast cancer. Clin Ther. 1999;21(2):309–318. doi: 10.1016/S0149-2918(00)88288-0. [DOI] [PubMed] [Google Scholar]
- 16.Rastetter W, Molina A, White CA. Rituximab: expanding role in therapy for lymphomas and autoimmune diseases. Annu Rev Med. 2004;55:477–503. doi: 10.1146/annurev.med.55.091902.104249. [DOI] [PubMed] [Google Scholar]
- 17.Reff ME, Carner K, Chambers KS, Chinn PC, Leonard JE, et al. Depletion of B cells in vivo by a chimeric mouse human monoclonal antibody to CD20. Blood. 1994;83(2):435–445. [PubMed] [Google Scholar]
- 18.Di Gaetano N, Cittera E, Nota R, Vecchi A, Grieco V, et al. Complement Activation Determines the Therapeutic Activity of Rituximab In Vivo. J Immunol. 2003;171:1581–1587. doi: 10.4049/jimmunol.171.3.1581. [DOI] [PubMed] [Google Scholar]
- 19.Wang S, Jiang L, Ye Q, Zhu H, Yang J, et al. Construction and expression of an anti-CD71 mouse/human chimeric antibody (D2C) Chin J Immunol. 2003;19(10):665–668. [Google Scholar]
- 20.Adams GP, McCartney JE, Tai MS, Oppermann H, Huston JS, et al. Highly specific in vivo tumor targeting by monovalent and divalent forms of 741F8 anti-c-erbB-2 single-chain Fv. Cancer Res. 1993;53(17):4026–4034. [PubMed] [Google Scholar]
- 21.Verhoff FH, Lisi PJ, Fischer CD, Teipel JW, Goldstein G, et al. Graphical determination of specific activity, binding constants, and antibody-site concentrations for radioimmunoassays, with application to thymopoietin. Clin Chem. 1980;26(6):718–723. [PubMed] [Google Scholar]
- 22.Ziegler A, Luedke GH, Fabbro D, Altmann KH, Stahel RA, et al. Induction of apoptosis in small-cell lung cancer cells by an antisense oligodeoxynucleotide targeting the Bcl-2 coding sequence. J Natl Cancer Inst. 1997;89(14):1027–1036. doi: 10.1093/jnci/89.14.1027. [DOI] [PubMed] [Google Scholar]
- 23.Zangemeister-Wittke U, Schenker T, Luedke GH, Stahel RA. Synergistic cytotoxicity of bcl-2 antisense oligodeoxynucleotides and etoposide, doxorubicin and cisplatin on small cell lung cancer cell lines. Br J Cancer. 1998;78(8):1035–1042. doi: 10.1038/bjc.1998.624. [DOI] [PMC free article] [PubMed] [Google Scholar]
- 24.Tang YM, Chen MH, Chen GH, Cai CJ, He XS, et al. Kinetics of phytohemaglutinin-induced IFN-gamma and TNF-alpha expression in peripheral blood mononuclear cells from patients with chronic hepatitis B after liver transplantation. World J Gastroenterol. 2005;11(29):4574–4578. doi: 10.3748/wjg.v11.i29.4574. [DOI] [PMC free article] [PubMed] [Google Scholar]
- 25.Panduri V, Weitzman SA, Chandel N, Kamp DW. The mitochondria-regulated death pathway mediates asbestos-induced alveolar epithelial cell apoptosis. J Am J Respir Cell Mol Biol. 2003;28(2):241–248. doi: 10.1165/rcmb.4903. [DOI] [PubMed] [Google Scholar]
- 26.Kovar J, Stunz LL, Stewart BC, Kriegerbeckova K, Ashman RF, et al. Direct evidence that iron deprivation induces apoptosis in murine lymphoma 38C13. J Pathobiol. 1997;65(2):61–68. doi: 10.1159/000164105. [DOI] [PubMed] [Google Scholar]
- 27.Simonart T, Degraef C, Andrei G, Mosselmans R, Hermans P, et al. Iron chelators inhibit the growth and induce the apoptosis of Kaposi's sarcoma cells and of their putative endothelial precursors. J Invest Dermatol. 2000;115(5):893–900. doi: 10.1046/j.1523-1747.2000.00119.x. [DOI] [PubMed] [Google Scholar]
- 28.Maclean K, Yang H, Cleveland JL. Serum suppresses myeloid progenitor apoptosis by regulating iron homeostasis. Cell Biochem. 2001;82(1):171–186. doi: 10.1002/jcb.1111. [DOI] [PubMed] [Google Scholar]
- 29.Teeling JL, French RR, Cragg MS, van den Brakel J, Pluyter M, et al. Characterization of new human CD20 monoclonal antibodies with potent cytolytic activity against non-Hodgkin lymphomas. J Blood. 2004;104(6):1793–1800. doi: 10.1182/blood-2004-01-0039. [DOI] [PubMed] [Google Scholar]


