

Abstract
It was previously shown that CEACAM1 on melanoma cells strongly predicts poor outcome. Here, we show a statistically significant increase of serum CEACAM1 in 64 active melanoma patients, as compared to 48 patients with no evidence of disease and 37 healthy donors. Among active patients, higher serum CEACAM1 correlated with LDH values and with decreased survival. Multivariate analysis with neutralization of LDH showed that increased serum CEACAM1 carries a hazard ratio of 2.40. In vitro, soluble CEACAM1 was derived from CEACAM1(+), but neither from CEACAM1(−) melanoma cells nor from CEACAM1(+) lymphocytes, and directly correlated with the number of CEACAM1(+) melanoma cells. Production of soluble CEACAM1 depended on intact de novo protein synthesis and secretion machineries, but not on metalloproteinase function. An unusually high percentage of CEACAM1(+) circulating NK and T lymphocytes was demonstrated in melanoma patients. CEACAM1 inhibited killing activity in functional assays. CEACAM1 expression could not be induced on lymphocytes by serum from patients with high CEACAM1 expression. Further, expression of other NK receptors was impaired, which collectively indicate on a general abnormality. In conclusion, the systemic dysregulation of CEACAM1 in melanoma patients further denotes the role of CEACAM1 in melanoma and may provide a basis for new tumor monitoring and prognostic platforms.
Keywords: Melanoma, CEACAM1, Biomarker, Inhibition, Lymphocytes, Serum
Introduction
The prevalence of malignant melanoma (MM) is continuously rising, effectively almost tripling over the last 30 years [1]. MM is the most common cancer among young individuals between the age of 20–30 years old, accounting for more than 11% of all malignancies at this age [2]. MM is sometimes characterized by an aggressive course with widespread metastasis and poor prognosis. Moreover, melanoma poses a serious clinical challenge to oncologists, as it has an extraordinary ability to remain dormant and relapse sometimes a decade or more after the removal of a small localized tumor [3]. Pathological risk stratification studies have determined the depth of primary tumor invasion as the most important prognostic factor using Breslow’s score [4–6]. However, using Breslow’s score allows initial stratification and categorization of patients but not continuous follow-up. Follow-up of MM patients includes mainly history taking and physical examination, supplemented by periodical imaging and routine blood tests [7, 8]. Currently, there are no simple objective available tests that enable accurate monitoring of melanoma patients in the outpatient setting. Serum levels of LDH, S100 and CRP, which provide some limited information [9, 10], are still experimental.
The human carcinoembryonic Ag (CEA) protein family encompasses several forms of proteins with different biochemical features. All CEA family genes have been classified into two major subfamilies: the CEA cell adhesion molecule (CEACAM) and the pregnancy-specific glycoprotein subgroups [11]. The CEACAM proteins, which are part of the larger Ig superfamily, include CEACAM1, -3, -4, -5, -6, -7, and -8. They share a common basic structure of sequentially ordered different Ig-like domain(s) with considerable degree of homology. CEACAM5 is GPI-linked to cell surface [11], but it also appears in a soluble form in the peripheral blood where it is more recognized as the tumor marker CEA used to monitor colorectal cancer patients [12, 13]. CEACAM1 is a transmembrane protein that can be detected on some immune cells as well as on epithelial cells [14]. In 2002, a striking association was observed between the presence of cell-bound CEACAM1 on primary cutaneous melanoma lesions and the development of metastatic disease with poor prognosis [15]. The prognostic strength of melanoma-associated CEACAM1 was similar or even superior to the widely accepted Breslow score [15]. Remarkably, a similar association was observed in lung adenocarcinoma specifically [16] but also generally in non-small cell lung cancers [17].
The role of CEACAM1 in melanoma has been, therefore, the target of various investigations. It was shown that CEACAM1 enhances invasiveness of melanoma cells in vitro [18]. We have previously identified a novel MHC class I-independent inhibitory mechanism that is mediated by the CEACAM1 homophilic interactions of natural killer cells [19, 20] and tumor infiltrating lymphocytes (TIL) [21]. Recently, we provided evidence for a sophisticated mechanism of melanoma cells that survive direct immune attack and respond by active up-regulation of CEACAM1 [22]. This active up-regulation is mediated by IFNγ release by the attacking lymphocytes [22]. These studies investigated direct effects of CEACAM1 on melanoma cells, which provide melanoma with enhanced invasiveness and immune evasion attributes [18–22], and support the clinical strong association with poor prognosis [15]. However, the potential systemic involvement of CEACAM1 in melanoma patients is still elusive. Systemic involvement can include, e.g., alterations in serum soluble CEACAM1 and in CEACAM1 expression profile on circulating lymphocytes. Interestingly, the presence of human soluble CEACAM1 protein has been observed in the serum of healthy donors [23–25] and was found elevated in the sera of patients with biliary diseases including obstructive jaundice [23–25], primary biliary cirrhosis [24], autoimmune hepatitis, and cholangiocarcinoma [24]. Furthermore, it has been recently shown that serum CEACAM1 level is increased in some pancreatic adenocarcinoma patients [26], presenting evidence for the potential role of soluble CEACAM1 as a tumor marker. There is still no gold standard assay for quantification of serum CEACAM1. Normally, circulating lymphocytes do not express CEACAM1 [27, 28], as it is up-regulated on lymphocytes mainly following activation [27, 28]. Here, we study the systemic involvement of CEACAM1 in melanoma patients, including serum CEACAM1 concentrations as well as CEACAM1 expression on circulating lymphocytes.
Materials and methods
Patients and controls
Patients with pathologically verified cutaneous MM in all AJCC stages of disease were included. There were no exclusion criteria. Patients were broadly categorized clinically into two groups: (a) patients with no evidence of disease (NED) at the time of blood sampling who were further subdivided into low risk of recurrence (AJCC stage I or II) and high risk of recurrence (AJCC stage III or IV); (b) patients with evidence of active disease (WED) at the time of blood sampling who were subcategorized according AJCC criteria. High-risk NED patients (AJCC stages III and IV) have received prior therapy that yielded disease regression. All normal controls were in excellent health at the time of the study. All melanoma patients and healthy volunteers gave written informed consent prior to their participation in this study. This study was approved by the Sheba Medical Center Institutional Review Board.
Specimen characteristics
Blood samples were obtained from healthy individuals and patients by veno-puncture and standard handling procedures. Eight milliliters of blood were collected in heparinized tubes (BD Biosciences) and then centrifuged in 700g for 15 min in room temperature to obtain plasma. All plasma samples were collected and divided into aliquots and frozen in −80°C until analysis. Peripheral blood lymphocytes were purified using a density gradient and deep frozen in liquid nitrogen. Anonymous samples (marked only with ID number) were linked only to clinical–pathological data. Samples were obtained from September 2005 through September 2006 and clinical data were analyzed at September 2007.
Assay methods—CEACAM1 sandwich ELISA
NC8 or Kat4c monoclonal antibodies diluted in 100 μl PBS to a concentration of 2 μg/ml were adsorbed to immunoplates (Nunc Maxisorp) overnight at 4°C. Plates were then washed with 200 μl wash solution (PBS/Tween 0.05%), blocked for 1 h in room temperature with 200 μl PBS/BSA 1% and washed again 3 times. 100 μl/well of standard proteins diluted in HBSS to the specified concentrations or of undiluted serum samples were applied and incubated for 2–3 h at room temperature. Recombinant CEACAM1-Ig or CEACAM5-Ig proteins were used as standards. After each step hereafter four washing rounds with wash solution were performed. Biotinylated polyclonal antibodies against CEACAM1, -5, -6, -8 were used as detection antibodies, and were added at a final concentration of 1 μg/ml diluted in PBS/Tween 0.05% + BSA 1%. 100 μl/well of detection antibody was incubated for 1 h at room temperature. Binding of HRP-conjugated streptavidin diluted in PBS/Tween 0.05% + BSA 1% at a concentration of 1 μg/ml was allowed for 30 min. Finally, the substrate TMB (Dako, Glustrup, Denmark) was added for the development of chemical reaction with optical readout that was stopped with 2 N sulfuric acid. Optic density was determined at wavelength of 405 nm. The assay was validated by two different experimenters. The intra-assay and inter-assay coefficient of variance were 5 and 10%, respectively. Experimenters were blinded during the study to the type of specimen (patients or controls).
Study design
Blood was obtained in the melanoma clinic with no case selection. None of the patients underwent surgery near the time of blood sampling. Study was retrospective: a single blood sample was obtained from all patients, frozen and analyzed at a later, technically convenient, point. Each sample was tested two independent times in triplicate repeats. Samples were obtained from September 2005 through September 2006 and clinical data were analyzed retrospectively at December 2007. Follow-up in this study began from time of blood sampling. The mean follow-up time was 12 months for all groups, except for stage IV-M1c WED patients, due to death of some of the patients shortly after blood sampling (Table 1). The clinical endpoints examined were disease free period (DFP) for NED patients and survival for WED patients.
Table 1.
Characteristics of melanoma patients included in the study
| Group | AJCC stage (at blood sample) | N | Age (years) (mean ± SD) | % male | F/U (months) (mean ± SD) | Status by the end of F/U |
|---|---|---|---|---|---|---|
| Healthy | N/A | 37 | 47 ± 7.9 | 63 | N/A | N/A |
| NED low risk | I | 14 | 51 ± 13.7 | 64 | 12.38 ± 2.56 | 14/14 NED |
| II | 14 | 59 ± 12.4 | 71 | 12.78 ± 4.38 | 14/14 NED | |
| Total | 28 | 55 ± 13.8 | 68 | 12.58 ± 3.59 | 28/28 NED | |
| NED high risk | IIIa | 3 | 45 ± 17.8 | 0 | 12.66 ± 2.33 | 3/3 NED |
| IIIb | 12 | 63 ± 12.8 | 75 | 11.58 ± 4.35 | 12/2 NED | |
| IIIc | 1 | 52 | 100 | 11 | 1/1 NED | |
| IV-M1a | 1 | 44 | 100 | 19 | 1/1 NED | |
| IV-M1b | 0 | N/A | N/A | N/A | N/A | |
| IV-M1c | 3 | 63 ± 14.7 | 67 | 12.66 ± 5.03 | 3/3 NED | |
| Total | 20 | 59 ± 15 | 65 | 12.25 ± 4.12 | 20/20 NED | |
| WED | IIIa | 0 | N/A | N/A | N/A | N/A |
| IIIb | 4 | 61 ± 17.1 | 75 | 11.21 ± 5.56 |
2/4 AWD 2/4 DOD |
|
| IIIc | 5 | 53 ± 14.1 | 75 | 12.31 ± 3.31 |
4/5 AWD 1/5 DOD |
|
| IV-M1a | 14 | 58 ± 10.4 | 80 | 12.22 ± 3.7 |
11/14 AWD 3/14 DOD |
|
| IV-M1b | 13 | 55 ± 11.2 | 64 | 10.1 ± 5.8 |
8/13 AWD 5/13 DOD |
|
| IV-M1c | 28 | 55 ± 10.7 | 69 | 7.2 ± 6.47 |
8/28 AWD 20/28 DOD |
|
| Total | 64 | 55.8 ± 16.6 | 67 | 9.1 ± 5.5 |
33/64 AWD 31/64 DOD |
Patients were categorized according to AJCC criteria. This table shows the number (N) of samples, the mean age with standard deviation (SD), gender distribution (% male) for each group, mean follow-up time (F/U) with SD, and the number of patients that displayed progression or recurrence of disease by the end of follow-up time (status)
N/A not applicable
Statistical analysis
Spearman’s test was used to analyze the correlation between soluble CEACAM1 and outcome in WED patients. Multivariate analysis of soluble CEACAM1 against LDH and clinical outcome was performed on 37 stage IV patients using Cox regression analysis. Mann–Whitney and Kruskal–Wallis tests were used for significance analysis of various serum proteins between two or three test groups, respectively. All statistical analyses were performed with SPSS.
Cells
The CEACAM-negative 721.221 (221) cells were used in this work [20], as well 221 cells transfected either with the CEACAM1 cDNA (221/CCM1) [20]. Primary melanoma cultures were developed from surgically resected tumors as previously described [22] and included 003mel, 005mel, 009mel, 014mel, and 019mel. Melanoma cell lines were 526mel and 624mel. Melanoma cells were maintained as previously described [21, 22]. CEACAM1-positive TIL such as JKF6, L2D8 [21, 22] were used as well.
Antibodies
Antibodies directed against CEACAM proteins included in this work were as follows: murine anti-human CEACAM1 monoclonal antibodies NC8 [29], murine anti-human CEACAM1, -5, -6, -8 monoclonal antibody Kat4c (Dako, Glustrup, Denmark), and purified rabbit polyclonal anti-human CEACAM1, -5, -6 antibodies (Dako, Glustrup, Denmark). The following conjugated monoclonal antibodies were used: anti-human CD3-FITC (IQ), anti-human CD56-PE/Cy5.5 (eBioscience), anti-human NKp46-APC (eBioscience), anti-human NKp30-APC (eBioscience), anti-human CD16-PE (eBioscience), anti-human NKG2D-APC (R&D Systems, Minneapolis, MN, USA), biotinylated NC8 and biotinylated rabbit polyclonal anti-human CEACAM1, -5, -6 antibodies. Secondary reagents included PE-conjugated F(ab′)2 fragments of goat anti-human-Fc IgG (Jackson Immunoresearch), FITC-conjugated F(ab′)2 fragments of goat anti-mouse-Fc IgG (ICN), and PE-conjugated streptavidin (Jackson Immunoresearch). Biotinylation of antibodies was performed with SS biotin (Chemicon) according to manufacturer’s instructions.
Generation of fusion proteins
The genetic constructs of the CD99-Ig, CEACAM1-Ig, and CEACAM5-Ig were generated as previously described [19, 30]. The CEACAM1(N)-Ig fusion protein was a kind gift of Dr Ofer Mandelboim (Hebrew University, Jerusalem, Israel). The production by COS-7 cells and purification on protein G column were previously described [20]. Proteins were routinely analyzed by SDS-PAGE for degradation.
Flow cytometry
Binding of antibodies to cells was tested in standard flow cytometry procedures as formerly reported [21, 22].
Cytokine ELISA
The soluble factors IFNγ, IL-2, SDF-1, and MICB were quantified in serum samples using commercial sandwich ELISA kits, according to the manufacturer’s instructions (R&D Systems).
Real-time PCR
Quantitative real-time PCR (qPCR) analysis was performed to quantify the expression of CEACAM1 with long or short cytoplasmic tail in primary melanoma cultures and melanoma cell lines. The sequence of the CEACAM1-short is almost identical to the CEACAM1-long (except for the absence of most of the cytoplasmic tail), which posed a problem for specific detection. The forward primer was common to both variants (5′-GAGTAGTGGCCCTGGTTGCTC-3′). The design of reverse primers was based on the presence of a unique very small exon in the CEACAM1-long variant. The reverse primer of CEACAM1-long was part of the unique exon and included an exon–exon junction (5′-CGCTGGTCGCTTGCCCT-3′). Due to the absence of this small exon in the CEACAM1-short, the flanking exons become adjacent. The reverse primer of CEACAM1-short spans on both these exons and includes the junction (5′-GGTCCTGAGCTGCCGGTC-3′). Primers (Sigma-Aldrich, Rehovot, Israel) were designed according to Primer-Express software guidelines (Applied Biosystems, Foster City, USA). The qRT-PCR reactions were run on ABI 7500 system utilizing SDS 1.2.3 Software (Applied Biosystems). All reactions were run in triplicates. Transcripts were detected using 2× SYBR Green Master Mix (Applied Biosystems) according to manufacturer’s instructions and were normalized to GAPDH. ΔCt represents the difference between the Ct values of the tested variant and GAPDH. Ratio of CEACAM1 variants was calculated using the formula X = 2−ΔΔCt. ΔΔCt is the difference between the ΔCt value of the long variant and the ΔCt value of the short variant.
Inhibition of metalloproteinase activity, protein synthesis, and intracellular transport
Inhibition of metalloproteinase activity was performed by culturing of 75,000 melanoma cells per well in six-well plate in the presence of 5 μM of the broad metalloproteinase inhibitor BB94 [31] for 3 days. Since BB94 is emulsified in DMSO, an identical volume of DMSO was added as control. An inhibitory activity of BB94 was confirmed by blocking the shedding of NKp46 from NK cells activated with PMA, as previously demonstrated (data not shown) [32]. Protein synthesis was inhibited in 250,000 melanoma cells cultured in 24-well dish in the presence of 0.1 μg/ml of cycloheximide (Sigma-Aldrich) for 24 h. Cells were seeded in triplicate wells. Intracellular transport was inhibited by adding Monensin (BD Biosciences) at a dilution of 1:1,000 for overnight period.
Cytotoxicity assays
Killing assays were performed as formerly reported [22]. CFSE (Sigma-Aldrich) pre-labeled target cells were co-incubated for 5 h with effector cells in indicated effector-to-target ratios. Percentage of specific lysis was quantified by PI-costaining (10 μg/ml) and determined as ((CFSE+PI+/CFSE+)with effector − (CFSE+PI+/CFSE+)background) × 100. Background PI staining was <15% in all experiments.
Results
Establishment of standardized ELISA for quantification of soluble CEACAM1
The NC8-based sandwich ELISA (see “Materials and methods”) was tested against various protein concentrations, ranging from 2 to 1,000 ng/ml, of CEACAM1 and CEACAM5. Only the CEACAM1 protein was recognized in a dose-dependent manner (Fig. 1a). The CEACAM5 was not detected in any of the tested doses (Fig. 1a). The sensitivity was below 15 ng/ml and the test was linear throughout the analyzed range (Fig. 1a). Both CEACAM1 and CEACAM5 standards were similarly identified in a dose-dependent manner by the Kat4c mAb detection antibody (Fig. 1b). No signal could be observed with any of the mAbs when the CD99-Ig protein was used as analyte (data not shown). A chimeric protein of CEACAM1-N domain fused to Ig (CEACAM1(N)-Ig) was directly identified by the NC8-based sandwich ELISA, to a comparable extent as the full CEACAM1 protein (Fig. 1c). These results imply that the NC8 mAb cannot distinguish between the various splice variants of CEACAM1, as it recognizes the extracellular N domain, which is common to all CEACAM1 forms (14). These results show that the NC8-based ELISA may serve as a platform for specific quantification of soluble CEACAM1.
Fig. 1.
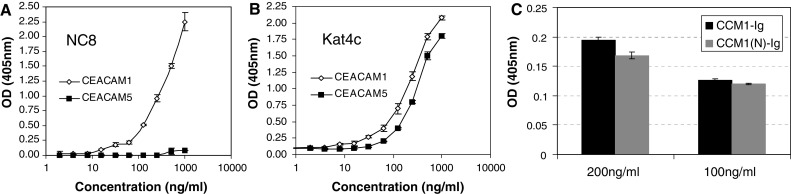
Establishment of soluble CEACAM1 quantification method. Quantification of increasing concentrations of CEACAM1 (open diamonds) or CEACAM5 (filled squares) standard proteins using NC8 mAb (a) or Kat4c mAb (b). Y-axis denotes the optical density at wavelength of 405 nm. This figure shows a representative experiment out of five performed. c Detection of recombinant N domain of CEACAM1 compared to the full protein. Y-axis denotes the optical density at wavelength of 405 nm. A representative experiment is shown
High-soluble CEACAM1 serum levels in melanoma patients
The serum concentration of soluble CEACAM1 was determined in 112 melanoma patients and 37 healthy donors (Table 1). The melanoma group was comprised of 48 patients with no clinical evidence of disease (NED) and of 64 patients with clinically evident disease (WED) at the time of blood sampling. All patients were staged according to the accepted AJCC staging criteria (34). NED patients were further categorized according to the risk for relapse; 28 patients had a localized disease (AJCC stage I or II) and thus a low relapse risk, and the other 20 patients had a local-regional or systemic disease (AJCC stage III or IV) and thus a high risk for relapse. The 64 WED patients were subcategorized according to AJCC staging criteria. Although the mean age of the healthy group was slightly lower than the mean age of the patients’ groups, the difference was not significant statistically. The gender distribution was similar among all groups.
Importantly, a higher serum CEACAM1 concentration was noted in WED patients (mean concentration of 144 ng/ml), in comparison to NED patients (mean concentration 94 ng/ml) and healthy volunteers (mean concentration 70 ng/ml) (Fig. 2a). The differences between all groups were statistically significant. Considering the slightly younger age of the healthy volunteers, theoretically this result might reflect an age-dependent increase in CEACAM1 levels. However, there was no direct correlation between age and soluble CEACAM1 concentrations among healthy donors (data not shown). In addition, the difference between the WED and the NED patients, which exhibited similar demographic characteristics, was significant (P value of 0.016). There were no differences in serum CEACAM1 between low-risk NED patients and high-risk NED patients or between stage III and stage IV patients (data not shown). Noteworthy, none of the NED patients progressed throughout follow-up time, while 31 of 64 WED patients died of disease (Table 1). It should be emphasized that the moderate difference in serum CEACAM1 demonstrated between healthy volunteers and NED patients was still significant (Fig. 2a).
Fig. 2.
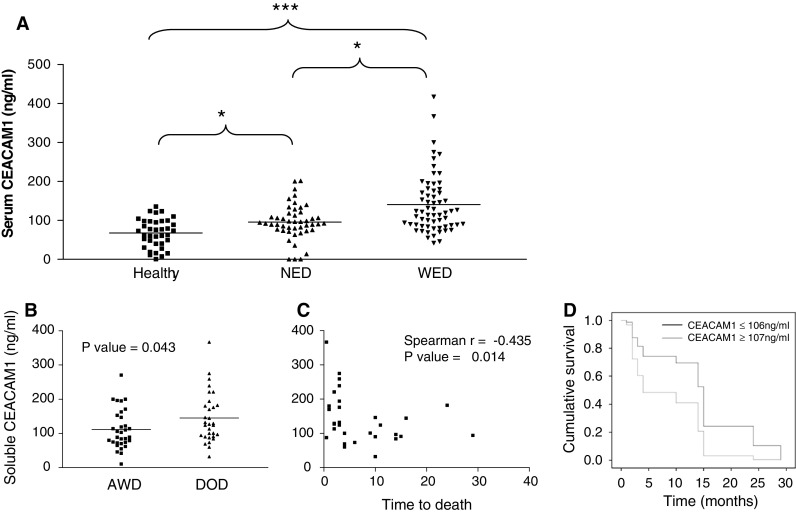
Serum CEACAM1 in melanoma patients. a Serum samples obtained either from healthy donors (N = 37), patients with no evidence of disease (NED) (N = 48), or with evidence of disease (WED) (N = 64) were analyzed for soluble CEACAM1 concentration. This figure shows the determined serum CEACAM1 concentration in each individual (black dot). Each serum sample has been independently analyzed twice in triplicates. Group comparison (lines) and statistical significance using non-parametric two-tailed t test (asterisks) are indicated in the figure. *P value <0.05 and ***P value <0.001. b The serum CEACAM1 of patients with evidence of disease categorized into two subgroups: patients who died of disease (DOD) during follow-up and patients who remained alive with disease (AWD). Horizontal lines indicate the median value of the group. P value in non-parametric two sided t test is indicated in each plot. This figure shows the mean results of two independent quantifications in triplicates of the same samples. c Serum CEACAM1 concentration is plotted against time-to-death in months for each patient who died of disease. Correlation was calculated with Spearman’s correlation (r index is indicated in the figure). d Kaplan–Meier plot demonstrating the effect of CEACAM1 on survival of WED patients after neutralization of LDH. P value of Cox regression was 0.06
We tested the potential clinical value of soluble CEACAM1 levels in melanoma patients. It is important to emphasize that according to study protocol only a single blood test was obtained from each patient, which has been correlated to further clinical follow-up. Since none of the NED patients progressed throughout the follow-up time (Table 1), it was impossible to draw conclusions on predictive value for relapse. Therefore, the clinical course of WED patients was analyzed. By the end of follow-up time, 31 WED patients died of disease (DOD), while the other 33 patients were alive with disease (AWD) (Table 1). Comparison of soluble CEACAM1 levels between these two groups demonstrated significantly higher serum CEACAM1 concentrations in patients who died of disease within follow-up period (Fig. 2b). Furthermore, among DOD patients, a strong inverse correlation was observed between the serum concentration of CEACAM1 and time-to-death (in months) from sampling time (Fig. 2c). It should be noted that blood samples were obtained from WED patients at an arbitrary time point, and not necessarily at entrance into stage IV. The mean time from entrance into stage IV to time of blood sampling was similar between DOD patients (14.8 months, range 0–4 years) and AWD patients (17.7 months, range 0–4 years) (P value = 0.42). Therefore, the prognostic difference is probably not just a mere reflection of the time point in which blood was harvested.
LDH is used as a serum biomarker in metastatic melanoma (9). We, therefore, tested the prognostic relevance of CEACAM1 in a multivariate analysis against LDH. LDH levels were concomitantly determined in 37 WED patients. In these patients, a significant positive correlation was observed between LDH and serum CEACAM1 levels (Spearman’s r = 0.382, P value < 0.05). Accordingly, each of these biomarkers independently negatively correlated with survival (Spearman’s r = −0.474 and −0.451 for LDH and CEACAM1, respectively. The P value was <0.01 for both markers). Cox regression multivariate analysis for CEACAM1 (LDH neutralized) revealed a strong trend towards hazard ratio of 2.40 (95% CI 0.963–6.186), but did not reach statistical significance (P value = 0.06). Similar analysis for LDH (CEACAM1 neutralized) revealed a strong trend towards a hazard ratio of 2.89 (95% CI 0.977–8.425) (P value = 0.055). Plotting of the effect of serum CEACAM1 on survival implies that even a single CEACAM1 measurement provides significant predictive value, which is especially significant in a range of 12 months (Fig. 2d).
Other immunomodulating factors in healthy donors and melanoma patients
Three other soluble immunomodulating factors including SDF-1, IFNγ, and IL-2 were concomitantly quantified among healthy, NED, and WED patients (Fig. 3). In addition, we quantified the amount of soluble MICB, which may be secreted from tumors and cause systemic down-regulation of the killing receptor NKG2D to evade elimination by immune cells [33]. It has been shown previously that MICB is expressed on melanoma cells in situ [34], but there is only scarce information on soluble MICB in the serum of melanoma patients. Quantification was performed with commercial ELISA kits and displayed similar scatter distribution and mean values (Fig. 3). There were no statistically significant differences between the three main groups (Fig. 3).
Fig. 3.

No difference in serum levels of four immunomodulating factors between healthy donors and melanoma patients. This figure shows scatter distribution of all samples. There are three main groups of samples, healthy donors (filled squares), no evidence of disease (NED) patients (filled upright triangles) and patients with evidence of disease (ED) (filled inverse triangles). Each individual shape represents a single sample from the same group. Each of the four panels represents the results for a given immunomodulating factor, as indicated in the figure. Y-axis denotes quantified concentration. Horizontal lines indicate the median value of the group. P values in Kruskal–Wallis test are indicated in each plot. This figure shows the mean results of two independent quantifications in triplicates of the same samples
Soluble CEACAM1 originates from melanoma cells in vitro
Soluble CEACAM1 was quantified in conditioned medium of melanoma cell lines with variable CEACAM1 levels, ranging from background levels (MFI of 3) to high expression levels (MFI of 400). Melanoma cells were seeded in a constant number of 105 cells per well in six-well plates and cultured for 3 days. Due to different proliferation rates, the concentration of soluble CEACAM1 was normalized according to the number of cells at the time of harvesting. No soluble CEACAM1 could be detected in the conditioned media of fibroblasts, CEACAM1-negative or -low melanoma cells (Fig. 4a). In contrast, various normalized concentrations of soluble CEACAM1 were observed among melanoma cells that strongly expressed CEACAM1, ranging from 2 to 14 ng/105 melanoma cells (Fig. 4a). There was no correlation between the strength of surface expression of CEACAM1 and the normalized concentration of soluble CEACAM1 (Fig. 4a). Analysis of soluble CEACAM1 in conditioned media during 3 days in untreated culture revealed a direct correlation with the number of melanoma cells in CEACAM1-positive 009mel (R 2 value of 0.98) and 019mel (R 2 value of 0.965) cells (Fig. 4b). No soluble CEACAM1 could be detected in the conditioned media of the CEACAM1-negative 003mel cells (Fig. 4b). Soluble CEACAM1 was not detected in the conditioned media of CEACAM1-positive lymphocytes, such as T cell clone JKF6 [21], T bulk cultures TIL14 or bulk NK culture NK-AZ (Fig. 4b), despite surface expression of CEACAM1 (Fig. 4c). Similar observations were documented with other CEACAM1-positive and -negative melanoma cells (data not shown).
Fig. 4.
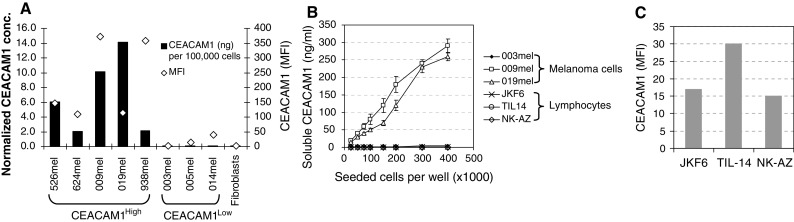
Soluble CEACAM1 originates in vitro from CEACAM1-positive melanoma cells. a One hundred thousand cells from each indicated type were seeded per well in six-well plates for 3 days. Soluble CEACAM1 was quantified in the conditioned medium, cells were harvested, counted and stained for CEACAM1 expression. Black bars represent amount of CEACAM1 normalized per 105 melanoma cells (primary Y-axis). Open diamonds represent MFI of CEACAM1 staining (secondary Y-axis). b Plotting the number of seeded melanoma cells or lymphocytes (X-axis) against quantified soluble CEACAM1 in the conditioned medium (Y-axis). This figure shows a representative experiment out of three performed. c CEACAM1 surface expression by lymphocyte cultures. Y-axis denotes the median fluorescence intensity (MFI). This figure shows representative staining values
The ratio between CEACAM1 with long cytoplasmic tail (CEACAM1-L) and CEACAM1 with short cytoplasmic tail (CEACAM1-S) was further analyzed by real-time PCR, as explained in “Materials and methods”. Transcripts of both splice variants were found only in minute amounts (ΔCt around 10 or more) in melanocytes, 003mel and 42mel, which were all CEACAM1 negative in flow cytometry (Table 2). Transcripts of both variants were identified in significant amounts in the CEACAM1-positive melanoma cells. In all cases, CEACAM1-L was more abundant, ranging from 2.12- to 16.06-fold over CEACAM1-S (Table 2). There was no correlation between soluble CEACAM1 and CEACAM1 L/S expression ratio.
Table 2.
Expression of CEACAM1 variants by melanoma cells
| CEACAM1 | CCM1-long (ΔCt) | CCM1-short (ΔCt) | L/S ratio | |
|---|---|---|---|---|
| Melanocytes | − | 11.42 | 12.10 | N/A |
| 624mel | + | 4.51 | 5.89 | 2.60 |
| 526mel | + | 4.83 | 6.50 | 3.17 |
| C8161 | + | 3.36 | 6.24 | 7.34 |
| 003mel | − | 9.80 | 10.70 | N/A |
| 001mel | + | 6.76 | 8.94 | 4.54 |
| 014mel | + | 4.85 | 7.85 | 7.98 |
| 39mel | + | 7.08 | 8.21 | 2.18 |
| 37mel | + | 6.25 | 7.33 | 2.12 |
| 42mel | − | 9.10 | 10.28 | N/A |
| 007mel | + | 4.87 | 8.87 | 16.06 |
Melanocytes and melanoma cells were stained for CEACAM1 expression in flow cytometry (depicted as positive or negative). All cells were tested in qPCR for differential expression of CEACAM1-long (CCM1-long) and CEACAM1-short (CCM1-short) as explained in “Materials and methods”. Results are presented as ΔCt, normalized to GAPDH. ΔCt results around 10 and more indicate on extremely low signal. The ratio between the variants (L/S ratio) was calculated as X = 2−ΔΔCt. Ratio was not calculated for extremely low signals
N/A not applicable
The production of soluble CEACAM1 is not metalloproteinase dependent
It can be speculated that CEACAM1 originates from melanoma cells, either through shedding, active secretion or from dead cells. Cultures were still less than 80% confluent at time of harvesting and viable cell count with trypan blue revealed that >97% of the cells were viable (data not shown). CEACAM1-positive melanoma cells were cultured for 3 days in the absence or presence of 5 μM of the broad metalloproteinase inhibitor BB94 [31]. Conditioned medium was collected and soluble CEACAM1 quantified. No significant differences between the presence and absence of BB94 were observed in several different melanoma cells (Fig. 5a). This implies that production of soluble CEACAM1 is probably not mediated by metalloproteinase-mediated cleavage.
Fig. 5.

Production of soluble CEACAM1 by melanoma cells. a Melanoma cells were incubated for 3 days in the presence of 5 μM BB94 (metalloproteinase inhibitor with broad specificity) or DMSO in equivalent dilution (control). Serum CEACAM1 was quantified in the supernatant. This figure shows the average of three performed experiments. b Melanoma cells were incubated for 1 day in the presence of 1 μg/ml or the absence of cycloheximide. Soluble CEACAM1 was quantified in the supernatant and corrected for the ratio of harvested cells between the different treatment groups. This figure shows the average of three performed experiments. c Melanoma cells were incubated for overnight period in the presence or absence of Monensin, an intracellular vesicular transport inhibitor. Soluble CEACAM1 was quantified in the supernatant (c) and cells were concomitantly stained intracellularly for CEACAM1 (d). An average of three performed experiments is shown in c and a representative histogram is shown in d
Production of soluble CEACAM1 depends on protein synthesis and secretion
Melanoma cells were cultured in the presence of the protein synthesis inhibitor cycloheximide. 250,000 cells were seeded in triplicate wells for 24 h in the presence of 1 μg/ml of cycloheximide, and then the supernatant and cells were harvested. Viable cell count revealed 380,000 cells per well in the absence of cycloheximide, as compared to 290,000 cells in the presence of the treatment (data not shown). Amounts of soluble CEACAM1 quantified in the conditioned media were, therefore, corrected accordingly. Soluble CEACAM1 quantification in the conditioned media showed a significant decrease in the presence of cycloheximide as compared to control treatment (Fig. 5b). Furthermore, addition of Monensin, an inhibitor of intracellular vesicular transport, resulted in a significant decrease in CEACAM1 concentration in the culture medium (Fig. 5c) and in a concomitant increase in intracellular staining of CEACAM1 (Fig. 5d). In conclusion, the combined observations suggest that soluble CEACAM1 is derived from live CEACAM1-positive melanoma cells, directly correlates with number of cells, depends on active protein synthesis and secretion, and is not mediated via protein cleavage and shedding.
Unusually high percentage of CEACAM1-positive NK and T cells in the peripheral blood of melanoma patients
The CEACAM1 expression pattern was determined on gated NK and T cells derived from peripheral blood lymphocytes of healthy donors and the melanoma patients. Lymphocytes were derived from the same blood samples tested for serum CEACAM1 concentration, which was not obtained in a peri-operative setup. The mean percentage of CEACAM1-positive NK cells in healthy donors was 15% (Fig. 6a). A significantly enhanced proportion of CEACAM-positive NK cells (33%) was observed in NED patients, but the highest proportion (45%) was observed in WED patients (Fig. 6a). Similarly, a significant increase in the mean proportion of CEACAM1-positive T cells (31%) was observed in WED patients (Fig. 6b). A statistically significant positive correlation between CEACAM1 expression by NK and T cells could be observed in WED patients (Spearman’s r = 0.5, P value < 0.05). A similar, yet milder, trend was observed in NED patients, without reaching statistical significance (Spearman’s r = 0.267, P value = 0.082). Supporting the data presented in Fig. 4b, there was no correlation between percentages of CEACAM1 either on T or on NK cells with the serum concentration of CEACAM1. In conclusion, although both soluble CEACAM1 concentrations and CEACAM1 expression on lymphocytes are generally linked to disease activity, they are not connected directly to each other.
Fig. 6.

Unusually high expression of CEACAM1 on circulating lymphocytes among melanoma patients. This figure shows scatter distribution of CEACAM1 expression profile on circulating NK cells (a) or T cells (b). There are three main groups of samples, healthy donors (filled squares), patients with no evidence of disease (NED, filled upright triangles) and patients with evidence of disease (WED, filled inverse triangles). Each individual shape represents a single sample from the same group. Y-axis denotes the percent of CEACAM1-positive circulating lymphocytes. c, d WED patients were further categorized into patients who died of disease (DOD) during follow-up and patients who remained alive with disease (AWD). This figure shows CEACAM1 scatter distribution on circulating NK cells (c) or T cells (d) in these subgroups. Horizontal lines indicate the median value of the group. Non-parametric two sided t test was used to compare between different groups, as indicated in each plot. *P value <0.05, **P value <0.01 and ***P value <0.001
Indeed, when WED patients were further categorized into DOD and AWD patients, the mean proportion of CEACAM1-positive NK cells among DOD patients (51.9%) was significantly higher than in AWD patients (34.4%) (Fig. 6c). However, there was no clear correlation between the percentage of CEACAM1 expression and time-to-death among these patients (data not shown). There was no difference in the percentage of CEACAM1-positive T cells between DOD and AWD patients (Fig. 6d).
Enhanced CEACAM1 expression is functional and inhibits NK-mediated lysis
Peripheral blood lymphocytes were derived either from melanoma patients (exemplar patients 38 and 71) or from healthy donors (Fig. 7a). CEACAM1-mediated inhibition of fresh lymphocytes was tested in natural cytotoxicity assays. The NK-sensitive 721.221 (.221/Mock) and 721.221 stably transfected with the CEACAM1 protein (.221/CEACAM1) were used as target cells. Natural killing activity of .221 cells was clearly observed with lymphocytes derived from all sources (Fig. 7b). Remarkably, a moderate, yet reproducible and significant inhibition of killing of the .221/CEACAM1 cells was observed only with the patient-derived lymphocytes (Fig. 7b). No similar inhibition was measured with the healthy donor-derived lymphocytes (Fig. 7b). Similar results were observed with lymphocytes derived from other patients (data not shown) as well as in re-directed lysis experiments performed with concurrent CEACAM1 engagement (data not shown). These results show that enhanced CEACAM1 expression on circulating NK cells is functional, and may expose the patient’s immune system to CEACAM1-mediated inhibition.
Fig. 7.

Enhanced CEACAM1 expression is functional and inhibits NK killing activity. a Plots show the CEACAM1 expression profile on gated peripheral blood NK cells. Samples were derived either from healthy donors or melanoma patients, as indicated in the figure. b Peripheral blood lymphocytes were tested for natural killing activity against NK-sensitive 221 cells. Target cells were either mock transfected (221/Mock, black bars) or stable transfected with CEACAM1 cDNA (221/CEACAM1, gray bars). Effector-to-target ratio was 50-to-1. Y-axis denotes the percent of specific lysis of target cells. This figure shows a representative experiment out of three performed. *P value <0.05. c Peripheral blood lymphocytes derived from a healthy donor were cultured either in culture medium or in serum. Serum was derived either from an allogeneic healthy donor or from melanoma patients with either low or high percentage of CEACAM1-positive lymphocytes, as indicated in the figure. Peripheral blood lymphocytes from four different donors were tested, each in three different sera samples from each category. This figure shows the staining results of gated lymphocytes of a representative experiment
Sera from patients do not induce CEACAM1 expression on lymphocytes
Fresh peripheral blood lymphocytes from healthy donors were incubated for 48 h in culture medium or serum derived either from: healthy donors, patients with low percentage of CEACAM1-positive lymphocytes or patients with high percentage of CEACAM1-positive lymphocytes. CEACAM1 was analyzed on gated lymphocytes cells. There were no significant differences in the expression of CEACAM1 among the different treatments on either CD56(+) or CD56(−) cells (Fig. 7c). These experiments suggest that the high expression of CEACAM1 on lymphocytes observed in some melanoma patients is probably not due to systemic soluble factors.
The phenotype of circulating NK cells in melanoma patients is generally abnormal
Peripheral blood NK cells were stained for the expression of various killing receptors, including NKG2D, NKp46, CD16, and NKp30. A remarkable decrease was observed in the expression profiles of NKp46, CD16, and NKp30, but not in NKG2D. Specifically, NKp46 was significantly down-regulated among all patients, as compared with healthy donors, but there was no significant difference between NED and WED patients. A significant down-regulation of CD16 and NKp30 was observed among WED patients, as compared to NED patients and healthy donors. There were no significant differences between NED patients and healthy donors in the expression of these receptors (Fig. 8). A statistically significant positive correlation was identified between CD16, NKp30, and NKp46, and in additional, between NKp46 and NKG2D (Table 3). A striking negative correlation was evident between expression of CEACAM1 and the expression of all killing receptors tested, except NKG2D (Table 3). These results indicate on a systemic irregularity in NK cell phenotype, which is not confined only to CEACAM1 expression.
Fig. 8.

Dysregulated expression of NK activating receptors by circulating NK cells. This figure shows scatter distribution of various NK activating receptors (indicated in the figure) expression profile on circulating NK cells. There are three main groups of samples, healthy donors (filled squares), patients with no evidence of disease (NED, filled upright triangles) and patients with evidence of disease (WED, filled inverse triangles). Each individual shape represents a single sample from the same group. Y-axis denotes the percent of receptor-positive circulating NK cells. Horizontal lines indicate the median value of the group, which is indicated numerically below. Non-parametric two sided t test was used to compare between different groups, as indicated in each plot. *P value <0.05, **P value <0.01
Table 3.
Correlation between CEACAM1 expression and NK activating receptors in melanoma patients
| CEACAM1 | CD16 | NKp30 | NKp46 | NKG2D | |
|---|---|---|---|---|---|
| CEACAM1 | 1 | −0.328** | −0.437*** | −0.270* | −0.024 |
| CD16 | −0.328** | 1 | 0.414** | 0.376** | 0.13 |
| NKp30 | −0.437*** | 0.414** | 1 | 0.353** | 0.072 |
| NKp46 | −0.207* | 0.376** | 0.353** | 1 | 0.351** |
| NKG2D | −0.024 | 0.13 | 0.072 | 0.351** | 1 |
The correlation was calculated using Spearman’s test. This table summarizes Spearman’s r values between each pair of parameters. *P value <0.05, **P value <0.01, ***P value <0.001
Discussion
The exact role of CEACAM1 in cancer is still not fully delineated, especially as CEACAM1 potentially delivers anti-proliferative signals [35] on the one hand, while on the other hand it mediates angiogenesis [36], adhesion [37], metastasis [38], and immune suppression [39]. The strong predictive association of surface CEACAM1 expression by melanoma cells with poor prognosis [15] mandates further evaluation of the role of this protein in mechanism of disease, as well as a readily available tool for clinical use.
We show that serum CEACAM1 concentration is substantially elevated in WED patients as compared to NED patients or healthy donors (Fig. 2). This result could imply that serum CEACAM1 is an indicator for sub-clinical evidence of disease. Another intriguing possibility is that high CEACAM1 levels might be a marker of MM predisposition, possibly appropriate in screening of populations at risk. The presence of serum CEACAM1 has been previously demonstrated in pancreatic adenocarcinoma patients [26]. Since none of the NED patients recurred during period of follow-up (Table 1), we concentrated on the WED patients. Among WED patients, higher CEACAM1 concentrations were observed in patients that died during period of follow-up, compared to patients that remained alive with disease (Fig. 2). Moreover, among DOD patients, patients with higher serum CEACAM1 concentrations died earlier (Fig. 2). Multivariate analysis showed that CEACAM1 has a hazard ratio of 2.4 when LDH was neutralized with borderline statistical significance of P = 0.06, probably due to the relatively small sample size of 37 patients. The effect of serum CEACAM1 on survival was demonstrated, mainly for the subsequent 12 months after blood sample (Fig. 2d). These results strongly suggest on the systemic involvement of CEACAM1 in melanoma, as well as its potential clinical importance as a biomarker with functional significance in melanoma. Future larger prospective studies are required to validate the prognostic value of serum CEACAM1.
We further show that soluble CEACAM1 originates in vitro from live CEACAM1-positive melanoma cells and correlates with number of tumor cells. Mechanistically, it is not produced through metalloproteinase-mediated cleavage and shedding, but depends on de novo protein synthesis and intact secretion machineries (Fig. 5). These results could be explained by specific production of a soluble form of the CEACAM1 protein. CEACAM proteins are subjected to alternative splicing [40] and it has been previously shown that alternative splicing can yield soluble CEACAM1 in rats [41]. The observations that soluble CEACAM1 was produced by CEACAM1-positive melanoma cells but not by CEACAM1-positive lymphocytes could be explained by differential splicing activity.
Despite the statistically significant difference in mean values, distribution analysis of serum CEACAM1 concentrations reveals an overlap between NED and WED groups. This may reflect the heterogeneity of subjects comprising different subgroups within the cohort (Table 1). Indeed, as described above, it seems that soluble CEACAM1 originates from CEACAM1-positive melanoma cells but not from CEACAM1-negative melanoma cells (Fig. 4). Further, no quantitative correlation between surface CEACAM1 expression intensity and normalized soluble CEACAM1 concentration could be observed (Fig. 4). Currently, it is impossible to predict the quantity of soluble CEACAM1 that will be derived from any given CEACAM1-positive melanoma cells. Differential characteristics of melanoma cells may affect serum CEACAM1 concentrations. Soluble CEACAM1 is not derived from CEACAM1-positive circulating lymphocytes, which point towards a mechanistic difference between melanoma cells and lymphocytes. The overlap may stem from the heterogenic attributes of melanoma cells between different patients, combined with the fact that the presence of CEACAM1 on the melanoma cells in majority of the tested patients was unknown. Therefore, a prospective large cohort study with defined patient subgroups and CEACAM1 expression status is mandated. Nevertheless, the statistically significant difference that is still apparent emphasizes the potential role of CEACAM1 as a tumor marker in melanoma.
Another point is that serum CEACAM1 was also detected in healthy donors, which means that it is normally produced in low levels. It is currently impossible to distinguish between tumor-derived soluble CEACAM1 and “normal” serum CEACAM1, as they have a similar molecular weight (data not shown) and both are similarly recognized by the test. Tumor-derived soluble CEACAM1 could differ from “normal” CEACAM1 in other biochemical properties, such as glycosylation patterns, which require further investigation. The concentrations of serum CEACAM1 measured in healthy donors in this study were higher than those reported in the study reported by Simeone et al. [26]. These differences may be attributed to a lack of standardized measuring test. Although both tests were ELISA-based, they differed in capturing mAb, detection methods, sample handling, and general ELISA protocols (incubation times, buffers, dilutions, etc.). Indeed, in a third study conducted by Draáberová et al. [23], the mean normal concentration detected was significantly higher than in our study (300 ng/ml). In that study, CEACAM1 was quantified by immunoprecipitation with a completely different mAb. As these concentrations are significant, serum CEACAM1 may carry a physiological role. Soluble CEACAM1 could function as a competitive antagonist and modulate CEACAM1 homophilic interactions. These interactions can occur normally between activated lymphocytes and activated endothelial cells. Thus, modulation of these interactions could affect rolling, adhesion, and recruitment of lymphocytes. Alternatively, soluble CEACAM1 could function agonistically and modulate other CEACAM1-mediated processes such as angiogenesis and insulin clearance. The function of soluble CEACAM1 in vivo thus remains to be determined.
Tumor markers are utilized in the clinical arena mainly to support diagnosis of disease and clinical monitoring of patients. Our observations show that serum CEACAM1 reflects disease activity and has some prognostic effect on survival (Fig. 2). Nevertheless, additional blood tests and follow-up of specific patients might have demonstrated an increase in CEACAM1 levels with the progression of disease. Since in our study only one CEACAM1 test was performed for each patient, this possibility cannot be ruled out. Indeed, the personal tumor marker profile in a given patient indicates tumor burden regarding other tumor markers such as PSA [42] and CEA [12, 13]. Our results suggest that soluble CEACAM1 may be indicative of tumor burden, as soluble CEACAM1 concentration was dependent on the absolute number of melanoma cells (Fig. 4). We assume that personal serum CEACAM1 monitoring over time may provide reliable clinical information, similar to PSA or CEA monitoring. Analysis of 50 melanoma specimens derived from metastatic lesions shows that surface CEACAM1 is significantly expressed in 70% of the cases (unpublished results). Thus, CEACAM1 monitoring may be relevant for a substantial portion of melanoma patients. Future prospective studies should, therefore, include serial serum CEACAM1 analysis in each melanoma patient, in order to correlate changes in CEACAM1 levels over time with clinical course of disease.
Importantly, a systemic involvement of CEACAM1 was also noted in the surface marker expression profile of circulating NK and T cells. A striking increase in CEACAM1 expression was observed in melanoma patients compared to healthy donors (Figs. 6, 7). The highest CEACAM1 expression percentages on NK cells were observed among patients who died of disease during follow-up (Fig. 6a; P value < 0.05). Further, the CEACAM1 expression pattern of NK cells positively correlated with the CEACAM1 expression pattern of T cells (Fig. 6c). Remarkably, increased CEACAM1 expression was functional and inhibited NK killing activity in an MHC class I-independent manner (Fig. 7). These combined observations provide a first link between melanoma patients, mainly those with worse prognosis, and systemic overexpression of functional CEACAM1 by circulating lymphocytes. A similar systemic overexpression of CEACAM1 among circulating NK cells was previously reported in Ankylosing Spondilitis patients [43] and in Bare Lymphocyte Syndrome type I patients [44]. It is tempting to speculate that overexpression of inhibitory CEACAM1 leads to immune inhibition and is involved in cancer progression. Yet, it remains to be determined whether the state of disseminated melanoma dictates phenotypic alterations in circulating lymphocytes, such as overexpression of CEACAM1.
This phenomenon could be explained by systemic stimulation, as CEACAM1 expression is activation dependent and driven by IL-2 [27, 28] or by IFNγ [22, 45]. However, as shown in Fig. 2, there was no significant difference either in IL-2 or in IFNγ levels. Alternatively, it can be accounted for abnormal development of NK cells. Disseminated malignancies may have systemic effects through multiple mechanisms and may thus affect the repertoire of immune cells. This possibility is supported by the concomitant profound abnormality in the expression profile of activating receptors CD16, NKp46, and NKG2D (Fig. 8). This observation concurs with a previous report on down-regulated expression of CD161 and NKG2D in metastatic melanoma patients [46]. The inverse correlation between activating NK receptors and CEACAM1 is highly significant statistically (Table 3), which indicates a common regulation mechanism that potentially impairs NK cell function. Indeed, CEACAM1 is normally expressed on CD16-negative NK cells [28], which fits with the strong inverse correlation observed here between CEACAM1 and CD16 (Table 3). Moreover, we have previously reported a generalized CEACAM1 up-regulation accompanied by dysregulated expression profile of other NK receptors in BLS type I patients [44]. Thus, evidence for global dysregulation of NK cell repertoire affecting both inhibitory and activating receptors is presented. It remains to be determined whether impaired development of NK cells results in progression of melanoma, or whether disseminated progressive melanoma directly affects NK cell repertoire and selects for potentially less reactive NK cells.
We show that both the increased serum concentration of CEACAM1 and surface expression of CEACAM1 on circulating NK cells are probably linked to progressive melanoma. Nevertheless, there is no direct correlation between these two phenomena. It is known that CEACAM1-positive melanoma is associated with poor prognosis and here we further provide evidence that soluble CEACAM1 can be derived from CEACAM1-positive melanoma cells. Thus, serum CEACAM1 concentrations are probably affected directly by the melanoma cells. However, dysregulation of NK cell repertoire could potentially occur regardless of CEACAM1. If this process is indeed orchestrated by tumor cells, it is expected that NK cells with diminished expression or function of activating receptors will be favored. In that case, since CEACAM1 expression is linked to diminished expression of activating NK receptors (such as CD16 [28]), CEACAM1 overexpression may be secondary to another process, even in patients bearing CEACAM1-negative melanoma. Noteworthy, 70% of metastatic melanoma specimens express CEACAM1, and may thus be able to impose additional inhibitory effect that might result in worse prognosis.
In conclusion, systemic dysregulation of serum and lymphocyte cell surface CEACAM1 not only provides improved knowledge on pathogenesis of disease, but may also potentially serve in the future as novel monitoring platform in melanoma patients, including tumor burden, relapse of disease, overall prognosis, and prediction of response to immunotherapy.
Acknowledgments
Many special thanks to Haya and Nehemia Lemelbaum for the enormous support allowing the authors to conduct these studies. The authors would also like to thank the volunteers who donated blood samples and Mr. Amit Markel for technical support.
Footnotes
G. Markel and R. Ortenberg have contributed equally to this work.
References
- 1.National Cancer Institute. Surveillance epidemiology and end results. http://seer.cancer.gov/csr/1975_2004/results_merged/sect_16_melanoma.pdf. Last accessed at 28 January 2009
- 2.National Cancer Institute. Surveillance epidemiology and end results. http://seer.cancer.gov/publications/aya/5_melanoma.pdf. Last accessed at 28 January 2009
- 3.Herlyn M. Human melanoma: development and progression. Cancer Metastasis Rev. 1990;9:101–112. doi: 10.1007/BF00046337. [DOI] [PubMed] [Google Scholar]
- 4.Breslow A. Thickness, cross-sectional areas and depth of invasion in the prognosis of cutaneous melanoma. Ann Surg. 1970;172:902–908. doi: 10.1097/00000658-197011000-00017. [DOI] [PMC free article] [PubMed] [Google Scholar]
- 5.Soong S-J, Shaw HM, Balch CM, et al. Predicting survival and recurrence in localized melanoma: a multivariate approach. World J Surg. 1992;16:191–195. doi: 10.1007/BF02071520. [DOI] [PubMed] [Google Scholar]
- 6.Schuchter L, Schultz DJ, Synnestvedt M, et al. A prognostic model for predicting 10-year survival in patients with primary melanoma. Ann Intern Med. 1996;125:369–375. doi: 10.7326/0003-4819-125-5-199609010-00003. [DOI] [PubMed] [Google Scholar]
- 7.Christianson DF, Anderson CM. Close monitoring and lifetime follow-up is optimal for patients with a history of melanoma. Semin Oncol. 2003;30:369–374. doi: 10.1016/S0093-7754(03)00097-6. [DOI] [PubMed] [Google Scholar]
- 8.Garbe C, Paul A, Kohler-Späth H, et al. Prospective evaluation of a follow-up schedule in cutaneous melanoma patients: recommendations for an effective follow-up strategy. J Clin Oncol. 2003;21:520–529. doi: 10.1200/JCO.2003.01.091. [DOI] [PubMed] [Google Scholar]
- 9.Deichmann M, Benner A, Bock M, et al. S100-Beta, melanoma-inhibiting activity, and lactate dehydrogenase discriminate progressive from nonprogressive American Joint Committee on Cancer stage IV melanoma. J Clin Oncol. 1999;17:1891–1896. doi: 10.1200/JCO.1999.17.6.1891. [DOI] [PubMed] [Google Scholar]
- 10.Deichmann M, Kahle B, Moser K, et al. Diagnosing melanoma patients entering American Joint Committee on Cancer stage IV, C-reactive protein in serum is superior to lactate dehydrogenase. Br J Cancer. 2004;91:699–702. doi: 10.1038/sj.bjc.6602043. [DOI] [PMC free article] [PubMed] [Google Scholar]
- 11.Beauchemin N, Draber P, Dveksler G, et al. Redefined nomenclature for members of the carcinoembryonic antigen family. Exp Cell Res. 1999;252:243–249. doi: 10.1006/excr.1999.4610. [DOI] [PubMed] [Google Scholar]
- 12.Vogelzang NJ, Lange PH, Goldman A. Acute changes of α-fetoprotein and human chorionic gonadotropin during induction chemotherapy of germ cell tumors. Cancer Res. 1982;42:4855–4861. [PubMed] [Google Scholar]
- 13.Locker GY, Hamilton S, Harris J, et al. ASCO 2006 update of recommendations for the use of tumor markers in gastrointestinal cancer. J Clin Oncol. 2006;24:5313–5327. doi: 10.1200/JCO.2006.08.2644. [DOI] [PubMed] [Google Scholar]
- 14.Hammarström S. The carcinoembryonic antigen (CEA) family: structures, suggested functions and expression in normal and malignant tissues. Semin Cancer Biol. 1999;9:67–81. doi: 10.1006/scbi.1998.0119. [DOI] [PubMed] [Google Scholar]
- 15.Thies A, Moll I, Berger J, et al. CEACAM1 expression in cutaneous malignant melanoma predicts the development of metastatic disease. J Clin Oncol. 2002;20:2530–2536. doi: 10.1200/JCO.2002.05.033. [DOI] [PubMed] [Google Scholar]
- 16.Laack E, Nikbakht H, Peters A, et al. Expression of CEACAM1 in adenocarcinoma of the lung: a factor of independent prognostic significance. J Clin Oncol. 2002;20:4279–4284. doi: 10.1200/JCO.2002.08.067. [DOI] [PubMed] [Google Scholar]
- 17.Sienel W, Dango S, Woelfle U, et al. Elevated expression of carcinoembryonic antigen-related cell adhesion molecule 1 promotes progression of non-small cell lung cancer. Clin Cancer Res. 2003;9:2260–2266. [PubMed] [Google Scholar]
- 18.Ebrahimnejad A, Streichert T, Nollau P, et al. CEACAM1 enhances invasion and migration of melanocytic and melanoma cells. Am J Pathol. 2004;165:1781–1787. doi: 10.1016/S0002-9440(10)63433-5. [DOI] [PMC free article] [PubMed] [Google Scholar]
- 19.Markel G, Wolf D, Hanna J, et al. Pivotal role of CEACAM1 protein in the inhibition of activated decidual lymphocyte functions. J Clin Invest. 2002;110:943–953. doi: 10.1172/JCI15643. [DOI] [PMC free article] [PubMed] [Google Scholar]
- 20.Markel G, Lieberman N, Katz G, et al. CD66a interactions between human melanoma and NK cells: a novel class I MHC-independent inhibitory mechanism of cytotoxicity. J Immunol. 2002;168:2803–2810. doi: 10.4049/jimmunol.168.6.2803. [DOI] [PubMed] [Google Scholar]
- 21.Markel G, Seidman R, Stern N, et al. Inhibition of human tumor-infiltrating lymphocyte effector functions by the homophilic carcinoembryonic cell adhesion molecule 1 interactions. J Immunol. 2006;177:6062–6071. doi: 10.4049/jimmunol.177.9.6062. [DOI] [PubMed] [Google Scholar]
- 22.Markel G, Seidman R, Cohen Y et al. (2008) Dynamic expression of protective CEACAM1 on melanoma cells during specific immune attack. Immunology [Epub ahead of print] [DOI] [PMC free article] [PubMed]
- 23.Dráberová L, Cerná H, Brodská H, et al. Soluble isoforms of CEACAM1 containing the A2 domain: increased serum levels in patients with obstructive jaundice and differences in 3-fucosyl-N-acetyl-lactosamine moiety. Immunology. 2000;101:279–287. doi: 10.1046/j.1365-2567.2000.00113.x. [DOI] [PMC free article] [PubMed] [Google Scholar]
- 24.Kondo Y, Hinoda Y, Akashi H, et al. Measurement of circulating biliary glycoprotein (CD66a) in liver diseases. J Gastroenterol. 2001;36:470–475. doi: 10.1007/s005350170070. [DOI] [PubMed] [Google Scholar]
- 25.Svenberg T, Wahren B, Hammarström S. Elevated serum levels of a biliary glycoprotein (BGP I) in patients with liver or biliary tract disease. Clin Exp Immunol. 1979;36:317–325. [PMC free article] [PubMed] [Google Scholar]
- 26.Simeone DM, Ji B, Banerjee M, et al. CEACAM1, a novel serum biomarker for pancreatic cancer. Pancreas. 2007;34:436–443. doi: 10.1097/MPA.0b013e3180333ae3. [DOI] [PubMed] [Google Scholar]
- 27.Moller MJ, Kammerer R, Grunert F, et al. Biliary glycoprotein (BGP) expression on T cells and on a natural-killer-cell sub-population. Int J Cancer. 1996;65:740–745. doi: 10.1002/(SICI)1097-0215(19960315)65:6<740::AID-IJC5>3.0.CO;2-Z. [DOI] [PubMed] [Google Scholar]
- 28.Kammerer R, Hahn S, Singer BB, et al. Biliary glycoprotein (CD66a), a cell adhesion molecule of the immunoglobulin superfamily, on human lymphocytes: structure, expression and involvement in T cell activation. Eur J Immunol. 1998;28:3664–3674. doi: 10.1002/(SICI)1521-4141(199811)28:11<3664::AID-IMMU3664>3.0.CO;2-D. [DOI] [PubMed] [Google Scholar]
- 29.Albarran-Somoza B, Franco-Topete R, Delgado-Rizo V, et al. CEACAM1 in cervical cancer and precursor lesions: association with human papillomavirus infection. J Histochem Cytochem. 2006;54:1393–1399. doi: 10.1369/jhc.6A6921.2006. [DOI] [PMC free article] [PubMed] [Google Scholar]
- 30.Markel G, Gruda R, Achdout H, et al. The critical role of residues 43R and 44Q of carcinoembryonic antigen cell adhesion molecules-1 in the protection from killing by human NK cells. J Immunol. 2004;173:3732–3739. doi: 10.4049/jimmunol.173.6.3732. [DOI] [PubMed] [Google Scholar]
- 31.Takino T, Saeki H, Miyamori H, et al. Inhibition of membrane-type 1 matrix metalloproteinase at cell–matrix adhesions. Cancer Res. 2007;67:11621–11629. doi: 10.1158/0008-5472.CAN-07-5251. [DOI] [PubMed] [Google Scholar]
- 32.Markel G, Achdout H, Katz G, et al. Biological function of the soluble CEACAM1 protein and implications in TAP2-deficient patients. Eur J Immunol. 2004;34:2138–2148. doi: 10.1002/eji.200425021. [DOI] [PubMed] [Google Scholar]
- 33.Groh V, Wu J, Yee C, et al. Tumour-derived soluble MIC ligands impair expression of NKG2D and T-cell activation. Nature. 2002;419:734–738. doi: 10.1038/nature01112. [DOI] [PubMed] [Google Scholar]
- 34.Vetter CS, Groh V, thor Straten P, et al. Expression of stress-induced MHC class I related chain molecules on human melanoma. J Invest Dermatol. 2002;118:600–605. doi: 10.1046/j.1523-1747.2002.01700.x. [DOI] [PubMed] [Google Scholar]
- 35.Izzi L, Turbide C, Houde C, et al. cis-Determinants in the cytoplasmic domain of CEACAM1 responsible for its tumor inhibitory function. Oncogene. 1999;18:5563–5572. doi: 10.1038/sj.onc.1202935. [DOI] [PubMed] [Google Scholar]
- 36.Horst AK, Ito WD, Dabelstein J, et al. Carcinoembryonic antigen-related cell adhesion molecule 1 modulates vascular remodeling in vitro and in vivo. J Clin Invest. 2006;116:1596–1605. doi: 10.1172/JCI24340. [DOI] [PMC free article] [PubMed] [Google Scholar]
- 37.Wikström K, Kjellström G, Obrink B. Homophilic intercellular adhesion mediated by C-CAM is due to a domain 1-domain 1 reciprocal binding. Exp Cell Res. 1996;227:360–366. doi: 10.1006/excr.1996.0285. [DOI] [PubMed] [Google Scholar]
- 38.Thies A, Mauer S, Fodstad O, et al. Clinically proven markers of metastasis predict metastatic spread of human melanoma cells engrafted in scid mice. Br J Cancer. 2007;96:609–616. doi: 10.1038/sj.bjc.6603594. [DOI] [PMC free article] [PubMed] [Google Scholar]
- 39.Gray-Owen SD, Blumberg RS. CEACAM1: contact-dependent control of immunity. Nat Rev Immunol. 2006;6:433–446. doi: 10.1038/nri1864. [DOI] [PubMed] [Google Scholar]
- 40.Barnett TR, Drake L, Pickle W., II Human biliary glycoprotein gene: characterization of a family of novel alternatively spliced RNAs and their expressed proteins. Mol Cell Biol. 1993;13:1273–1282. doi: 10.1128/mcb.13.2.1273. [DOI] [PMC free article] [PubMed] [Google Scholar]
- 41.Budt M, Michely B, Müller MM. Secreted CEACAM1 splice variants in rat cell lines and in vivo in rat serum. Biochem Biophys Res Commun. 2002;292:749–755. doi: 10.1006/bbrc.2002.6704. [DOI] [PubMed] [Google Scholar]
- 42.Stamey TA, Yang N, Hay AR, et al. Prostate-specific antigen as a serum marker for adenocarcinoma of the prostate. N Engl J Med. 1987;317:909–916. doi: 10.1056/NEJM198710083171501. [DOI] [PubMed] [Google Scholar]
- 43.Azuz-Lieberman N, Markel G, Mizrahi S, et al. Involvement Natural Killer cells and CEACAM1 in Ankylosing Spondylitis. Int Immunol. 2005;17:837–845. doi: 10.1093/intimm/dxh270. [DOI] [PubMed] [Google Scholar]
- 44.Markel G, Mussaffi H, Ling KL, et al. The mechanisms controlling NK cell autoreactivity in TAP2-deficient patients. Blood. 2004;10:31770–31778. doi: 10.1182/blood-2003-06-2114. [DOI] [PubMed] [Google Scholar]
- 45.Takahashi H, Okai Y, Paxton RJ, et al. Differential regulation of carcinoembryonic antigen and biliary glycoprotein by gamma-interferon. Cancer Res. 1993;53:1612–1619. [PubMed] [Google Scholar]
- 46.Konjević G, Mirjacić Martinović K, Vuletić A, et al. Low expression of CD161 and NKG2D activating NK receptor is associated with impaired NK cell cytotoxicity in metastatic melanoma patients. Clin Exp Metastasis. 2007;24:1–11. doi: 10.1007/s10585-006-9043-9. [DOI] [PubMed] [Google Scholar]