

Abstract
Female mice transgenic for the rat proto-oncogene c-erb-B2, under control of the mouse mammary tumor virus (MMTV) promoter (neuN), spontaneously develop metastatic mammary carcinomas. The development of these mammary tumors is associated with increased number of GR-1+CD11b+ myeloid derived suppressor cells (MDSCs) in the peripheral blood (PB), spleen and tumor. We report a complex relationship between tumor growth, MDSCs and immune regulatory molecules in non-mutated neu transgenic mice on a FVB background (FVB-neuN). The first and second tumors in FVB-neuN mice develop at a median of 265 (147–579) and 329 (161–523) days, respectively, resulting in a median survival time (MST) of 432 (201 to >500) days. During tumor growth, significantly increased number of MDSCs is observed in the PB and spleen, as well as, in infiltrating the mammary tumors. Our results demonstrate a direct correlation between tumor size and the number of MDSCs infiltrating the tumor and an inverse relationship between the frequency of CD4+ T-cells and MDSCs in the spleen. Quantitative reverse transcription-polymerase chain reaction (qRT-PCR) assessment of enzyme and cytokine transcript levels in the spleen, tumor, tumor-infiltrating non-parenchymal cells (NPCs) and mammary glands revealed a significant increase in transcript levels from grossly normal mammary glands and tumor-infiltrating NPCs during tumor progression. Tumor NPCs, as compared to spleen cells from wild-type (w/t) mice, expressed significantly higher levels of arginase-1 (ARG-1), nitric oxide synthase (NOS-2), vascular endothelial growth factor (VEGF-A) and significantly lower levels of interferon (IFN)-γ, interleukin (IL)-2 and fms-like tyrosine kinase-3 ligand (Flt3L) transcript levels. Transcript levels in the spleens of tumor-bearing (TB) mice also differed from normal mice, although to a lesser extent than transcript levels from tumor-infiltrating NPCs. Furthermore, both spleen cells and NPCs from TB mice, but not control mice, suppressed alloantigen responses by syngeneic control spleen cells. Correlative studies revealed that the number of MDSCs in the spleen was directly associated with granulocyte colony stimulating factor (G-CSF) transcript levels in the spleen; while the number of MDSCs in the tumors was directly correlated with splenic granulocyte macrophage stimulating factor (GM-CSF) transcript levels, tumor volume and tumor cell number. Together our results support a role for MDSCs in tumor initiation and progressive, T-cell depression and loss of function provide evidence which support multiple mechanisms of MDSC expansion in a site-dependent manner.
Electronic supplementary material
The online version of this article (doi:10.1007/s00262-009-0719-2) contains supplementary material, which is available to authorized users.
Keywords: MDSC, Mammary cancer, Transgenic, Neu
Introduction
During tumor progression and growth, Gr-1+CD11b+ myeloid-derived suppressor cells (MDSCs) are frequently increased within the circulation, spleen and tumor in response to tumor-secreted growth factors [1]. MDSCs may facilitate tumor angiogenesis, progression and metastasis, as well as, inhibit lymphocyte and dendritic cell expansion, activation and function [2, 3]. Autochthonus tumors recapitulate tumor induction, progression and metastasis and provide a model for studying tumor pathobiology. Tumor-associated expansion of MDSCs also inhibits T lymphocyte number and function [4–6] both of which are reversed by tumor excision [7]. Thus tumor-induced expansion of MDSCs in BALB-neuT transgenic mice is associated with a depression in T-cell mediated cytotoxicity suggesting a role for MDSCs in immune evasion [8, 9] and tumor progression.
In addition to neoplastic diseases, MDSCs are increased in numerous pathologic conditions including: chronic infections, inflammatory diseases, graft-versus-host disease and traumatic stress [8, 10, 11]. They were initially described in 1983 when they were identified as natural suppressor cells and defined as cells without lymphocyte-lineage markers that could suppress lymphocyte responses [12–14]. MDSCs in mice are Gr-1+CD11b+ cells [15, 16] and have been reported to variably express Ly6, CD31 [17], CD124, the interleukin (IL)-4 receptor-α chain [18] and CD115 (the macrophage-colony stimulating factor (M-CSF) receptor [19]). Tumor growth results in the expansion of this heterogeneous cellular population, which can inhibit not only the activation of T-cells by anti-CD3 and superantigens, but also the antigen-specific CD4+ and CD8+ T-cell responses [20–23]. The mechanism(s) of MDSC immunosuppression are diverse including: up-regulation of reactive oxygen species (ROS), nitric oxide (NO), and l-arginine metabolism, as well as, the secretion of immunosuppressive cytokines [10, 21].
In previous studies, we have reported that the size of transplantable murine mammary tumors are directly related to the expansion of MDSCs, tumor infiltration and gene expression, along with inverse relationship to T-cell number [23]. Tumor non-parenchymal cells (NPCs) in transplantable tumor models have increased levels of cyclooxygenase-2 (COX-2), arginase-1 (ARG-1) and nitric oxide synthase-2 (NOS-2) providing multiple mechanisms for T-cell suppression [23]. We report herein, that non-mutated neu transgenic mice on a FVB background (FVB-neuN) mice have multiple mechanisms regulating MDSCs expansion in the spleen and tumor. Transcript levels of granulocyte colony stimulating factor (G-CSF) in the spleen and granulocyte monocyte colony stimulating factor (GM-CSF) transcript levels in tumor NPCs are directly correlated with the number of MDSCs in the spleen and tumor, respectively. We suggest, based on these results in FVB-neuN mice and their mammary tumors [24], that there are multiple regulatory mechanisms for MDSC expansion that are organ/site dependent.
Materials and methods
Transgenic mice
Female FVB mice with the rat neu gene under control of the mouse mammary tumor virus (MMTV) promoter were a kind gift from Dr. K.U. Wagner (University of Nebraska Medical Center, Omaha, NE) and were bred in our animal facility at the University of Nebraska Medical Center. The mice were bred at 6 weeks of age and used as monoparous in these studies. All mice were treated according to the guidelines of Institutional Animal Care and Use Committee Requirements. The mice received irradiated feed from Harlan Teklad Lab and acetated water ad libitum.
Model
In this study, immune surrogates were analyzed by flow cytometry (FCM) and quantitative real-time polymerase chain reaction (qRT-PCR) at 2, 4 and 6 months of age and in mice bearing one or more gross tumors. Time to development of the first and second tumors as well as the total number of tumors at death was assessed. The primary and secondary tumors were measured twice a week from initial palpation to mortality. At necropsy we assessed the sites of metastasis, quantitated their number, confirmed the lesions as tumors histologically and studied the effect of tumor burden on white blood cell (WBC) counts in the blood, spleen and tumors following collagenase digestion. Tissues from grossly normal mammary glands were also obtained for qRT-PCR analysis. Non-necrotic tumor fragments, spleen cells and grossly normal mammary tissue were flash frozen and stored at −90°C for qRT-PCR analysis.
Cell isolation
Tumor NPCs and PB mononuclear cells (PBMCs) were prepared as described previously [25]. Briefly following tumor resection, tumors were washed in sterile Dulbecco’s modified eagle’s medium (DMEM) and scalpels used to cut them into 1 mm3 fragments in a solution of type IV collagenase (1.4 mg/ml) (Sigma) and DNase (0.3 KU/ml) (Sigma, St. Louis, MO). The fragments were incubated in trypsinization flasks with slow, continuous shaking at 37°C for 30 min, single cell suspensions removed and fresh enzyme added for three cycles of digestion. Cell suspensions were passed through Nytex filters and the mononuclear cells isolated by layering the washed cells over Lympholyte-M (Cedarlane). After centrifugation, tumor-infiltrating leukocytes were collected from the interphase. Spleen cells were obtained by mechanical disruption and prepared by osmotic lysis of red blood cells for flow analysis and WBC numbers were determined using a Scil Vet ABC Hematology Analyzer (Scil Animal Care Co, Grayslake, IL).
Proliferation assays
Lymphocyte proliferation assays were carried out with six replicates, using spleen cells cultured in RPMI-1640 medium and 15% FBS. The concanavalin-A (Con-A) mitogenesis was observed for 72 h at 5 µg/ml of Con-A into spleen cells. In the mixed lymphocyte reaction (MLR) co-culture assay 1.5 × 10⁴ spleen cells from FVB mice (responders) were co-cultured with 5 × 10⁴ irradiated (10,000 rads) BALB/c mice as stimulators for 5 days. The cultures were undertaken at 37°C in a 5% CO2 atmosphere with the addition of [methyl-3H]-thymidine (1 μCi [0.037 MBq] per well) (Amersham) for the last 18 h of incubation. Cells were harvested with a Micromate 196 cell harvester (Packard) and [3H]-thymidine incorporation was counted using a liquid scintillation counter (TOPCOUNT, Packard) and expressed as counts per minute (cpm).
Quantitative real-time polymerase chain reaction (qRT-PCR)
Whole tissue samples, isolated spleen cells and collagenase disassociated and ficoll hypaque isolated NPCs were used for RNA extraction following manufacturer recommendations using Trizol (Sigma, St. Louis, MO) [17]. Reverse transcription was with 5 μg RNA, Superscript II (Invitrogen, Carlsbad, CA) with (dT) 18 and random Hexamers (Invitrogen). Primers were designed using Beacon Designer 6.0 (Premier Biosoft, Palo Alto, CA) and are shown in Supplemental Table 1. qRT-PCR (2 ng of cDNA) was conducted according to manufacturer’s recommendations using iTaq Supermix (BioRad, Hercules, CA) and the iCycler (BioRad), preheating at 95°C (10 min), and 40 cycles of 15 s at 95°C, 30 s for annealing at 58–68°C, and 30 s at 72°C. Melt curves were 55–95°C for 30 s each. Specific information for each amplimer is found in Supplemental Table 1. Quantitation was during the 72°C portion of the cycle with GAPDH as the control and analysis performed by the 2−ΔΔCΤ, Livak Method [26].
Flow cytometric analysis
Single cell suspensions of spleen cells and tumor NPCs at a concentration of 1 × 10⁶ cells/ml were used in each tube in the staining panel. Non-specific binding was blocked with 5% normal mouse serum. Cells were labeled with fluorescent isothiocyanate (FITC), phycoerythrin (PE), CyChrome™, Per-CP-labeled fluorochrome or biotin-labeled Abs with streptavidin-labeled allophycocyanin (APC) by incubation on ice for 30 min. These included FITC conjugated CD11c (eBiosciences), NK, Gr-1, CD25 (BD pharmagen), PE conjugated CD3, CD8, CD83, Biotin/APC conjugated, CD4, CD11b (eBioscience) and CyChrome conjugated CD8, B220, CD62L (BD pharmagen). Additional information on the antibodies used is found in Supplemental Table 2. Cells were washed, fixed and acquired with a FACScan Plus (Becton Dickinson, Boston, MA). Forward and side scatter were collected on a linear scale, while the florescent signals were collected on a 4-decade log scale. Overlaps of emission spectra were electronically compensated and using the threshold on forward scatter to eliminate debris, 70,000–200,000 events were acquired and the frequency of subsets determined with Attractors™ 3.0 software (Becton Dickinson, San Jose, CA).
Histology and immunohistochemistry
Mice were killed at the identified times and samples of tissue or tumor fixed in zinc fixative and then paraffin embedded. Apoptotic cells were identified with a TUNNEL assay using the instructions supplied with the ApopTag Peroxidase In Situ Apoptosis Detection Kit (Chemicon International, Temecula, CA). Epitope retrieval used 20 μg/ml Proteinase K (Invitrogen, Carlsbad, CA). Gr-1 staining for MDSCs used purified rat anti-mouse Gr-1 clone RB6-8C5 (BD Pharmingen), diluted 1:30 with blocking serum. Sections were de-paraffinized and epitope retrieval was with microwave boiling in 0.01 M sodium citrate buffer pH 6.0. Sections were blocked with 3% hydrogen peroxide followed by 5% normal goat serum (Biomedia, Foster City, CA). Primary antibody was incubated for 1 h and the secondary antibody biotin mouse anti-rat (BD Pharmingen), diluted 1:50 in blocking serum and incubation for 30 min. We also stained for CD31 positive cells using purified anti-mouse PECAM-1 clone MEC13.3 (BD Pharmingen). This primary antibody was diluted 1:50 in either PBS, TBS or blocking serum. Epitope retrieval used 3 μg/ml Proteinase K, sections blocked with normal rabbit serum and an avidin/biotin blocking kit was used as per instructions (Vector laboratories, Inc, Burlingame, CA). After 1-h RT incubation with primary antibody, peroxidase was blocked with 0.3% hydrogen peroxide in methanol at RT for 10 min. The secondary antibody was a rabbit anti-rat (Vector Laboratories, Inc) diluted 1:500. All slides were enzyme–substrate treated with the R.T.U. Vectstain® kit (Vector Laboratories, Inc). Sections were counter stained with 0.5% methyl green solution in 0.1 M sodium acetate pH 4.2 (Acros Orgaincs, NJ).
Statistical analysis
A statistical analysis of data was performed using SPSS 10.0 for Windows (SPSS Inc., Chicago, IL). Where appropriate, mean values were compared using the Student’s two sample t test, otherwise data were compared using non-parametric Mann–Whitney analysis. The Spearman Rho test was used to assess the correlation. Significance was assumed at P ≤ 0.05. Cumulative incidence of tumor appearance and survival were analyzed using Kaplan Meier plots.
Results
Mammary tumor development in FVB-neuN mice
The immune, molecular (cytokine and enzyme) and histologic phenotypes of FVB-neuN mice that were grossly free of mammary tumors were studied at 2, 4 and 6 months of age. These cohorts were examined within three different experiments (N = 2 or 3 mice/cohort/experiment) resulting in six to eight mice per cohort. In addition, two non-transgenic FVB control mice were studied in each experiment. We also examined these parameters in mice with one or more gross tumors (N = 8) at a median (range) age of 9 months (8–9 months). The time to primary and secondary tumor development as studied in 64 monoparous mice with the observation that 56 of the 64 mice studied developed tumors. All mice were bred once at 6 weeks of age to accelerate tumor development. In these studies, the median time for the development of the first tumor was 265 days (range of 147–579 days) as shown in Fig. 1a (Kaplan Meier plot of cumulative mammary tumor development).
Fig. 1.

The induction and growth, as well as, survival characteristics of mammary tumors in FVB-neuN mice are shown. a Cumulative hazard assessment for the development of the first and second palpable tumors. b A Kaplan Meier cumulative survival plot is shown. c Tumor growth rates for the mice that developed tumors using the average time to the development of a palpable tumor for time 0. The average ± SEM tumor volume is plotted for the first and second tumors
A second tumor developed in 47 of 60 mice (4 mice were censored at this time point) with a median time to detection of 329 days (range 161–523 days). The median number of tumors per mouse was 3, with a range of 0–10. The tumor growth rates of both the first and second tumors were similar using the first day the tumor was palpated as time 0 (Fig. 1b). The median survival time for the FVB-neuN mice was 432 days (range of 201 to >500 days), as shown in a Kaplan Meier survival curve (Fig. 1c). Although, not all mice were successfully autopsied due to autolysis, autopsies were completed for 39 of the 50 mice who have died with 27 of the 39 mice demonstrating pulmonary metastases (62.9%) with a median of six pulmonary metastases and a range of 0–35 metastases per animal (Table 1). There were no liver metastases observed either grossly or histologically.
Table 1.
Overview of tumor induction, survival and metastases (mets) in FVB-neuN mice
| First tumor | Second tumor | MST | Mets | |
|---|---|---|---|---|
| No. of mice (%) | 56/64 (87.5) | 47/60 (78.3) | 50/56a (89.3) | 27/39b (62.9) |
| Median (days or numbers) | 265 | 329 | 432 | 6 |
| Range (days or numbers) | 147–579 | 161–523 | 201 to >500 | 0–35 |
The results are presented as median and range. The median time is in days to the development of the first and second palpable tumor. Median survival time (MST) as calculated with a Kaplan Meier survival curve
aThe number of dead mice over a total number studied. The number of dead mice is divided by the total number of mice
bThe number of mice who showed gross and/or histologic metastases divided by the total number of autopsied mice
Histopathology of mammary tumor developmental in FVB-neuN mice
The FVB-neuN transgenic female mice spontaneously develop mammary carcinomas with a well-defined progression from dysplasia to lobular and ductal carcinomas similar to BALB-neuT mice [27]. In these studies of monoparous FVB-neuN transgenic mice, few ductal changes were observed at 2 months of age, when most of the ducts were lined by a single layer of ductal epithelial cells (Fig. 2a), including normal tertiary and lateral ducts. In a few instances, lobular and ductal hyperplasia and lobular and ductal hyperplasia with persistent terminal end buds were observed. The frequency of hyperplastic lesions were increased in 4-month-old mice, in addition to dysplasia, hyperplasia and atypical hyperplasia which were observed histologically as ductal protrusions and intraductal hyperplasia (Fig. 2a). Ductal carcinoma in situ (DCIS) and lobular carcinoma in situ (LCIS) were also observed at 4 months of age (Fig. 2b). Multiple foci of carcinoma in situ (CIS) and small lobular carcinomas were observed at 6 months of age in all mammary fat pads examined (Fig. 2c) and in the grossly normal mammary glands of older mice with gross tumors (Fig. 2b). Indeed, by 6 months of age all female mice had intramammary CIS (Fig. 2d) such that histologic or gross carcinomas were observed in all mammary glands. Immunohistochemical examination of Gr-1+ cells revealed an extensive infiltration of MDSCs, in the FVB-neuN mammary tumors (Fig. 3a). Ring cells, as well as, histiocytic cells characteristic of MDSCs are seen in the tumors as shown in the insert of Fig. 3a in a section stained with hematoxylin and eosin (H&E). Arrows point to ring cells and histiocytic nuclei. An extensive infiltration of the tumors by microvessels or tubules and endothelial cell clusters were also observed throughout the non-necrotic areas of the primary tumor as assessed by staining against CD31 (Fig. 3b).The MDSCs are found infiltrating throughout the non-necrotic portions of the tumors with an increased frequency observed in necrotic areas (results not shown). Similarly, there are diffuse infiltrates of apoptotic tumor cells with high numbers found in necrotic foci within the tumors (Fig. 3c). Large, multifocal pulmonary metastases with central necrotic foci are observed in 62.9% of mice, which have extensive neoangiogenesis incorporating microvessel infiltrates and large vessels infiltrating the tumor parenchyma (Fig. 3d).
Fig. 2.

Hematoxylin and eosin stained, grossly normal mammary tissue from: a 2-month-old FVB-neuN mouse, b 4-month-old FVB-neuN mouse, c 6-month-old FVB-neuN mouse and d “Normal” mammary tissue in neuT mouse with gross neoplastic disease. ×200 magnification
Fig. 3.

a–c Photomicrographs (×200) are from non-necrotic foci of a mammary tumor in an FVB-neuN mice. a An immunohistochemical (IHC) stain of a primary tumor with an antibody to GR-1. The insert is an hematoxylin and eosin (H&E) stain shown ring and histiocytic cells marked by arrows. b Microtubules infiltrating the primary tumor (IHC using an antibody against CD31). c Tumor cell apoptosis as revealed by TUNNEL staining. d H&E stain of a pulmonary metastasis (×25)
Phenotypic analysis of lymphoid splenomegaly
Mice with gross mammary tumors had a marked splenomegaly with a 2.8-fold increase in spleen cell number. This observation was not found in animals with histologic dysplastic and/or neoplastic disease (Fig. 4a). Lymphocyte frequency, most notably natural killer (NK) cells and B-cells (B220+) were significantly decreased during tumor progression in the FVB-neuN mice (Fig. 4a). Nonetheless, due to the splenomeglia, the absolute number of lymphocytes and B-cells in TB mice was significantly increased as compared to 7-week-old wild-type (w/t) mice. This significance was not observed with NK cells due in part to the high co-efficient of error. The frequency of CD4+ lymphocytes did not vary significantly at any time studied, although at 6 months the absolute number of CD4+ lymphocytes was significantly depressed (Fig. 4b). In contrast to the decreased number of CD4+ cells at 6 months of age, the number of CD3+ and CD8+ cells in the spleens of TB mice were significantly increased. Further, in the 2-, 4-, and 6-month-old mice as compared to the 7-week-old, w/t mice the absolute number of CD3+ and CD8+ lymphocytes were significantly increased. However, in the TB mice the frequency of CD3+ and CD8+ cells decreased returning to the levels found in w/t mice, although due to the splenomegaly the absolute numbers remained significantly increased (Fig. 4b). Overall in the TB mice, the absolute number of splenic lymphocytes was increased 2.8-fold with CD3+, CD4+, CD8+ and NK+ cells increased 2.8-, 2.5-, 4.9- and 1.4-fold, respectively relative to w/t mice. The absolute number of T-reg cells, defined as CD4+CD25Br, was significantly increased during tumor progression and were significantly increased 22.3-fold in the spleens of TB mice (results not shown). The increase in the frequency of T-reg cells in the TB mice was such that in w/t mice the frequency was 0.05% while in the TB mice it was 0.37%.
Fig. 4.
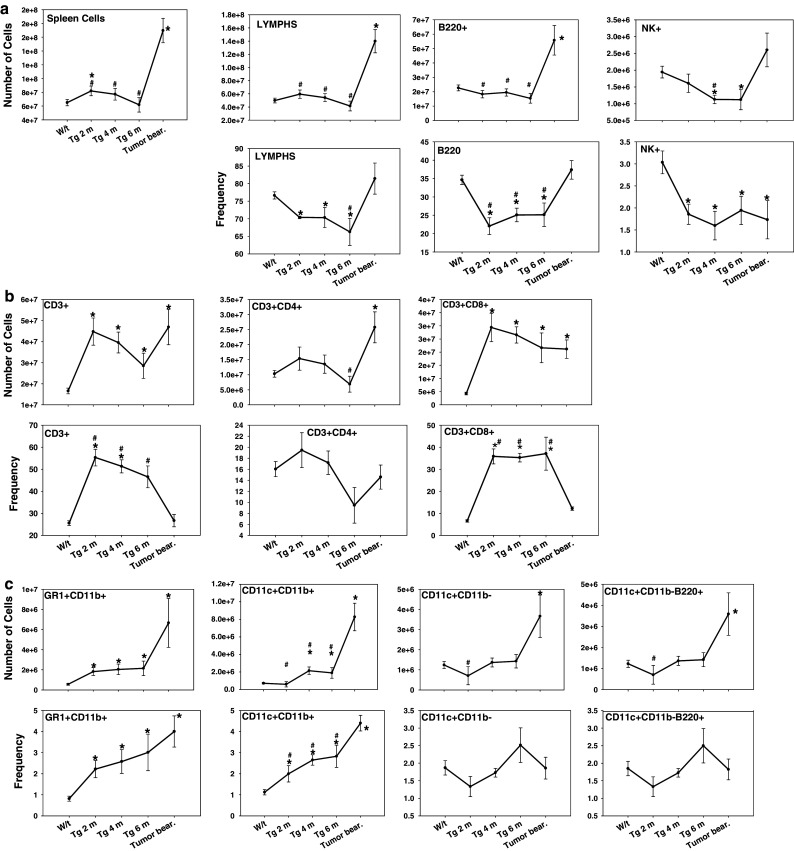
Flow cytometric analysis using four color staining panels including: a Non-T-cell lymphocyte subsets, b T-cell subsets and, c myeloid subsets. Results are expressed as frequency and absolute number of the cellular subset in the spleens of FVB-neuN mice. Analysis of myeloid cells includes MDSCs (Gr-1+CD11b+), DC2s (CD11c+CD11b+), DC1s (CD11c+CD11b−) and plasmacytoid DCs (CD11c+CD11b−B220+). The results presented include spleen cells from wild-type (W/t) FVB mice, FVB-neuN mice at 2 months of age (Tg 2 m), 4 months of age (Tg 4 m), 6 months of age (Tg 6 m) and from the spleens of mice with gross tumor burdens (Tumor bear). N = 6–8 in each cohort. An asterisk represents a cohort significantly different from w/t spleens, while a pound sign represents a significant difference from NPC isolated from the tumor. The mean ± SEM is shown for the tumor NPCs, spleen cells from TB mice and from the spleens of w/t FVB mice
Phenotypic analysis of myeloid splenomegaly
Both the frequency and absolute number of Gr-1+CD11b+cells (MDSCs) were significantly increased in the spleens of FVB-neuN mice during tumor progression and growth (Fig. 4c). The frequency of MDSC in w/t mice (average ± SEM) was 0.8 ± 0.1 and increased with tumor progression such that TB mice had an average of 4.0 ± 0.7%, which was a 5.0-fold increase. In association with the splenomegaly, there was a 11.2-fold increase in the absolute number (±SEM) of splenic MDSCs increasing from 0.6 ± 0.1 × 10⁶ cells in w/t mice to an average of 6.7 ± 2.4 × 10⁶ cells in TB mice. In addition, the frequency of myeloid DCs (CD11c+CD11b+) but not lymphoid or plasmacytoid DCs (CD11c+CD11b− and CD11c+CD11b+B220+, respectively) were significantly increased (4.0-fold) during tumor progression and growth, resulting in an 11.9-fold increase in the absolute number. Further, in association with the splenomeglia the absolute number of lymphoid and plasmacytoid DCs in spleens of the TB mice were significantly increased (3.1- and 3.0-fold, respectively).
Phenotypic analysis of tumor-infiltrating NPCs
In mice with gross tumor burdens, the tumors were collagenase dissociated, the NPCs isolated, stained and examined by flow cytometric analysis [28]. The tumors contained a median of 1.53 × 10⁸ collagenase dissociated cells, ranging from 2.9 × 10⁷ to 3.31 × 10⁸ cells and a median (range) of 3.05 × 10⁷ (5 × 10⁶–8.7 × 10⁷) NPCs. Thus, the median frequency of infiltrating NPCs following collagenase dissociation was 22.5% with a range of 2.2–42.4%. The frequency of NPCs in the tumors, which were lymphocytes, was significantly lower than the frequency found in the spleens of w/t and TB mice (Fig. 5a). This depression in the lymphocyte frequency included a significantly lower frequency of CD3+CD4+ and CD3+CD8+ cells. In contrast, the T-reg cell (CD4+CD25Br) frequency in the NPCs was significantly higher than in the spleens of w/t (8.0-fold increase). The frequency of MDSCs found in the NPCs was also significantly increased relative to the frequency in spleen cells of w/t (45.1-fold increase) and TB mice (9.0-fold increase relative to w/t mice). A significant increase (25-fold) in the frequency of lymphoid DCs (CD11c+CD11b−), but not myeloid DCs (CD11c+CD11b+), was also observed with the NPCs isolated from tumors relative to the frequency in the spleens of w/t mice. It is noted that the majority of the lymphoid DCs (CD11c+CD11b− cells) were plasmacytoid DCs (CD11c+CD11b−B220+ cells) in the tumor NPCs, which were increased 25.5-fold relative to both w/t spleens and the spleens of TB mice. This contrasts with the spleens of TB mice where the myeloid DCs (4.0-fold increase relative to w/t spleens) were significantly increased relative to w/t spleens, despite the significant increase in MDSC (5.0-fold). The primary cellular phenotype found in the NPCs infiltrating mammary tumors were MDSCs and lymphoid DCs, both of which represented approximately 40% of the total NPCs (Fig. 5a).
Fig. 5.

(a) Cellular analysis of the tumor-infiltrating non-parenchymal cells (NPCs) from FVB-neuN mice versus spleen cells from w/t versus TB (Tumor spleen) mice and (b, c) suppressive activity of spleen cells and NPCs from TB mice (b) Con-A mitogenic activity and (c) MLR coculture responses with irradiated allogeneic spleen cells from BALB/c. The tumors were surgically excised, reduced to 1 mm fragments using cross scalpel blades, collagenase/DNase dissociated and the NPCs separated from parenchymal cells by Ficoll hypaque density gradient centrifugation. The frequency of the various subpopulations are shown herein as an average ± SEM for the tumor NPCs (a) and incorporation of 3H-thymidine into stimulated spleen cells or NPCs from the TB animals and from the spleens of w/t FVB mice (b, c). And asterisk represents a significant difference from w/t mice; while a pound sign represents significantly different from the NPCs in TB mice
Immunosuppressive activity of spleen cells and NPCs in TB mice
Con-A mitogenesis by spleen cells from TB FVB-neuN mice, as compared to w/t FVB mice, is shown in Fig. 5b. These results demonstrate that the con-A mitogenesis by spleen cells from TB mice was significantly decreased. As there were differences in the frequency of T-cells in the spleens of TB FVB-neuN mice, as compared to w/t mice, the cells were irradiated and co-cultured with w/t FVB spleen cells (responders) and irradiated BALB/c spleen cells as stimulator cells. The addition of irradiated spleen cells from TB mice or NPCs significantly reduced the allo-reactive response. Indeed, the addition of NPCs from tumors reduced the MLR response to a significantly greater extent than the spleen cells (Fig. 5c). In contrast to irradiated spleen cells from TB mice the addition of irradiated spleen cells from w/t mice had no effect on the MLR. The suppressive activity of FVB-neuN spleen cells or NPCs from TB mice to allogeneic antigen responses by syngeneic lymphocytes resulted in a 26.8 or 49.0% (respectively) decrease in the MLR (Fig. 5c). The suppression was significantly higher with tumor NPCs which had a significantly increased frequency of Gr1+CD11b+MDSCs.
Cytokine and enzyme transcript levels in spleen cells during tumor progression
Studies in the regulation of MDSCs and T-cells in the spleens of FVB-neuN mice focused on cytokines and enzymes associated with MDSC expansion and regulation of T-cells. This included the qRT-PCR analysis of IL-1β, IL-2, IL-4, IL-10, IL-12, VEGF-A, G-CSF, GM-CSF, Flt3L, TGF-β, IFN-γ, ARG-1, COX-2, NOS-2, CXCL12, FOXp3, SCF and TCR3-ζ. We show in Figs. 6 and 7 only those cytokines, growth factors and enzymes that were consistently increased or decreased in response to tumor growth. Transcription levels of ARG-1 in spleen cells were increased during tumor progression, although in TB animals ARG-1 transcript levels were significantly reduced compared to 6-month-old mice with histologic disease, but still significantly higher than the levels found in w/t mice (Fig. 6a).
Fig. 6.
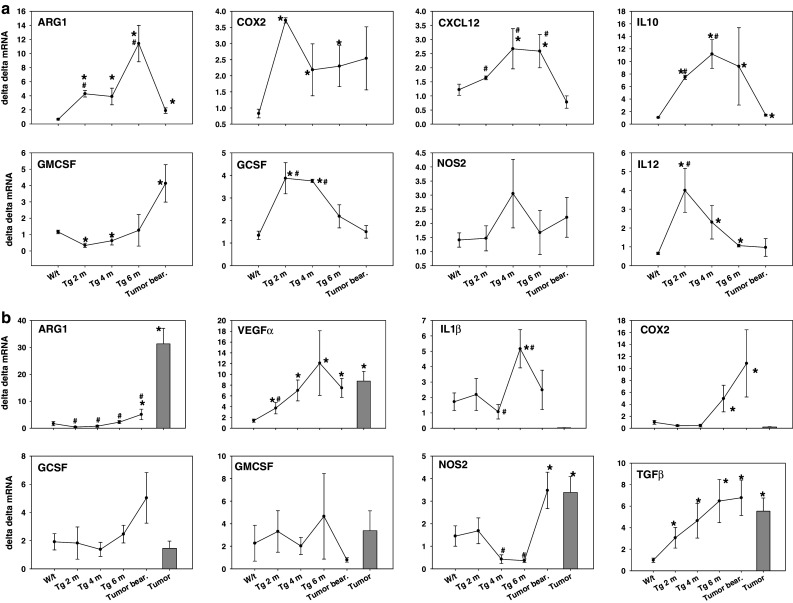
Expression of cytokine and enzyme transcript levels in (a) spleen cells and (b) mammary tumors and mammary tissues of FVB-neuN mice. The results presented represent the transcript levels compared to w/t spleens in w/t (FVB mice, FVB-neuN mice at 2 months of age (Tg 2 m), FVB-neuN mice at 4 months of age (Tg 4 m), FVB-neuN mice at 6 months of age (Tg 6 m) and from the spleens of mice with gross tumor burdens (Tumor bear). In the mammary tissue studies, (b) grossly normal tissue was also studied. N = 6–8 in each cohort. An asterisk represents a significant difference from w/t mice, while a pound sign represents a significant difference from TB mice. The mean ± SEM of the ΔΔCT versus w/t spleen cells is shown with the exception of mammary tissue which is compared to w/t mammary tissue
Fig. 7.
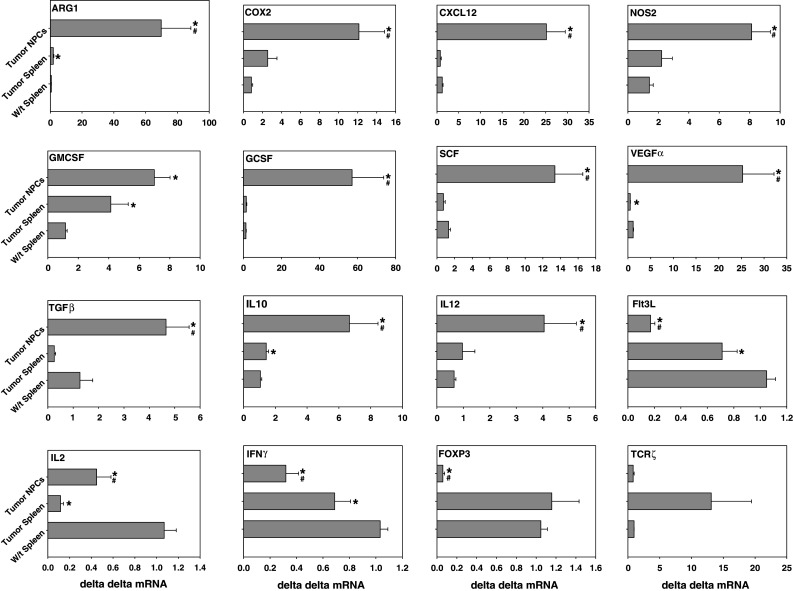
Analysis of enzyme and cytokine transcript levels (mean ± of the ΔΔCT) in spleen cells and tumor NPCs from TB mice versus w/t spleen cells. The results represent studies in w/t mice, spleens of mice with gross tumor burdens (tumor bear) and NPCs from tumors. N = 6–8 in each cohort. An asterisk represents a significant difference from w/t mice while a pound sign represents a significant difference from the NPCs in TB mice. The mean ± SEM is shown in each instance
A similar profile of transcript level changes was observed for CXCL12, IL-10, G-CSF and IL-12 in the spleen cells of FVB-neuN mice during tumor induction and progression. In contrast, GM-CSF transcript levels were significantly depressed in the splenocytes of mice which are 2 and 4 months of age during tumor progression, but significantly increased (3.6-fold) in TB mice relative to the transcript levels found in spleens of w/t mice. In contrast to ARG-1 levels, NOS-2 transcript levels did not change significantly in the spleens of the FVB-neuN mice including TB mice at any time relative to w/t mice. However, COX-2 transcript levels were significantly increased, relative to w/t mice, during tumor progression, but due to the large S.E.M in the TB mice the increase was not significant. It is noted that VEGF-A levels were little changed in any of these splenic samples (results not shown).
Expression of cytokine and enzyme transcript levels in mammary tissues and mammary tumors
The transcript levels of cytokines, growth factors and enzymes were also examined in grossly normal mammary tissue from non-tumor-bearing mice during tumor progression, as well as, from the grossly normal mammary gland tissue from TB mice and compared to mammary tumors and the mammary tissue of w/t mice (Fig. 6b). The levels of VEGF-A, and TGF-β increased significantly during tumor progression and all time points examined were significantly higher than the levels observed in the mammary tissue of w/t mice. The COX-2 levels were significantly increased in the mammary glands of 6-month-old mice, which based on our immunohistochemistry (IHC) and H&E stain studies had incipient tumors. Further, the levels of ARG-1, COX-2 and NOS-2 were significantly increased in grossly normal mammary tissue from TB mice. Non-necrotic tissue from gross mammary tumors also had significantly increased levels of ARG-1 (18.4-fold), VEGF-A (6.2-fold), NOS-2 (2.3-fold) and TGF-β (5.5-fold). However, these increased transcript levels in the mammary tumors differed from G-CSF and GM-CSF which were not significantly increased in the mammary tissues of TB mice or the tumor tissue. This contrasts with the significant increase in the G-CSF and GM-CSF found in the tumor NPCs suggesting that it is the infiltrating leukocytes found within the tumors, but not the mammary tissues that are the source of these cytokines which appear to support MDSC expansion, angiogenesis and tumor growth.
Expression of cytokine and enzyme transcription levels in tumor-infiltrating NPCs
In general, the cytokine growth factor and enzyme transcript levels from NPCs isolated from mammary tumors are significantly higher than the levels observed in the spleens of the TB mice (Fig. 7). Thus the spleens of the TB mice had significantly increased transcript levels of ARG-1, IL10 (results not shown) and GM-CSF as compared to spleen cells of w/t mice (Fig. 6a). However, the levels of these enzymes and cytokines were significantly increased in the NPCs compared to spleen cells from w/t mice. Thus, the NPCs from the tumor had 106.9-, 14.6-, 20.6-, 42.5-, 6.0-, 10.1-, 6.3-, 6.2-, 22.0-, 5.8-, 3.7-fold increase in transcript levels of ARG-1, COX-2, CXCl2, G-SCF, GM-CSF, SCF, IL-10, IL-12, VEGF-A, NOS-2 and TGFβ, respectively compared to spleen cells from w/t mice. The transcript levels of ARG-1, COX-2, CXCL12, NOS-2, G-CSF, SCF, VEGF-A TGF-β, IL-10. IL-12 was also significantly higher in the NPCs compared to spleen cells from TB mice. In contrast, the NPCs from the tumors had a 0.16-, 0.42-, 0.31- and 0.06-fold decrease in transcript levels of Flt3L, IL-2, IFN-γ and Fox-P3, respectively compared to spleen cells from w/t mice. The levels of Flt3L, IL-2 and IFN-γ were also significantly depressed in the spleen cells from TB mice as compared to spleen cells from TB mice suggesting a type 2 immune profile (Figs. 6a, 7). The depression in IL-2 and IFN-γ suggest a decrease in type 1 lymphocytes, although this is not consistent with the significant increase in IL-12, a histologic origin type I cytokine. The transcript levels of Fox-p3 in the tumor-infiltrating NPCs compared to the levels found in the spleens of w/t mice suggest a significant decrease in tumor-infiltrating T-reg cells (Fig. 7). The depression in Fox P3 levels was not consistent with the levels of CD4+CD25Br cells in the tumor NPCs which had a 6-fold increase in frequency (Fig. 5). The transcript levels of Flt3L were also significantly lower in the tumor-infiltrating NPCs as compared to the levels in w/t mice. However, the spleens and tumor NPCs, of TB mice had a significant decrease in Flt3L transcript levels relative to w/t mice.
Correlation of tumor growth, MDSCs and cytokine transcript T-cells in TB mice
The frequencies and absolute number of MDSCs were significantly increased in the spleens of TB mice relative to spleens from w/t mice, as well as, significantly increased within the tumor NPCs. Studies to clarify the relationship between MDSCs, T-cells and regulatory growth factors, enzymes and cytokines were undertaken using the results from 16 TB FVB-neuN mice with a median tumor volume of 235.3 mm3 ranging from 27.7 to 10,022 mm3.
Results used for all correlation studies are shown in Table 2. Studies into relationships between Flt3L transcript levels within the spleen revealed a direct association with the tumor volume (R = 0.579, P = 0.012). However, this relationship was not observed with the Flt3L transcript levels in the tumor NPCs. Interestingly, there was an inverse relationship between splenic Flt3L transcript levels and the absolute number of CD4 cells in the spleen (R = −0.838, P ≤ 0.000) and absolute number of MDSCs in tumor NPCs (R = 0.762, P = 0.000), as well as, tumor Flt3L transcript levels. As expected there was also a direct relationship (R = 0.622, P = 0.006) between the tumor cellularity following collagenase disassociation and tumor volume. No correlation was observed between tumor volume and VEGF-A transcript levels in the spleen or tumor NPCs. Transcript levels of G-CSF in spleen cells directly correlated with the number of MDSCs in the spleens (R = 0.532, P = 0.023), but not the tumor NPCs. There was also an inverse relationship between G-CSF transcript levels within the NPCs infiltrating the tumor and tumor volume (R = −0.502, P = −0.04) number of CD4+ cells in the spleen (R = −0.702, P = 0.003), in the tumor NPCs (R = −0.623, P = −0.000) and number of MDSCs in the tumor (R = −0.623, P = −0.008) but not the spleen.
Table 2.
The Spearman Rho test was used to assess the correlation between the number of cells within the spleen (SPC) or within the non-parenchymal cells (NPC) within the tumor (tum)
| SPC | SPC | SPC | SPC | SPC | tum | tum | tum | tum | tum | tum | ||
|---|---|---|---|---|---|---|---|---|---|---|---|---|
| Flt3L | G-CSF | GM-CSF | VEG-A | % CD4 | Flt3L | G-CSF | GM-CSF | VEG-A | % CD4 | Cell # | ||
| SPC | # CD4 | −0.838 | 0.07 | 0.762 | 0.215 | 0.757 | −0.567 | −0.702 | 0.018 | 0.032 | −0.514 | 0.776 |
| SPC | # MDSC | −0.126 | 0.532 | 0.308 | 0.116 | 0.284 | −0.077 | −0.199 | −0.457 | −0.226 | −0.21 | 0.346 |
| tum | # CD4 | −0.469 | 0.275 | 0.508 | −0.06 | 0.515 | −0.429 | −0.821 | −0.071 | −0.271 | 0.007 | 0.392 |
| tum | # MDSC | −0.762 | 0.004 | 0.718 | 0.244 | 0.857 | −0.534 | −0.623 | 0 | −0.047 | −0.53 | 0.785 |
| tum | vol | 0.579 | −0.17 | 0.731 | 0.468 | 0.285 | −0.277 | −0.502 | −0.015 | −0.321 | −0.338 | 0.622 |
The parameters examined included the number and percent of CD3 + CD4 + (CD4) cells within the spleen and tum (% CD4 and # CD4, respectively) and the percent and number of MDSCs (# MDSC) within the SPC and tum. The tumor volume was calculated using the formula for a prorated sphere and expressed as mm3. The total cellularity of the tum following collagenase dissociation was also analyzed. In addition, the transcript number for Flt3L, G-CSF, GM-CSF and VEGF-A (VEG-A) were assessed versus w/t spleens NPCs isolated from tumors and SPC found in TB mice. The results are expressed as an R value shown herein. A significant difference (P ≤ 0.05) is indicated in bold number
Within the spleen, GM-CSF transcript levels were directly correlated with the frequency of CD4+ cells (R = 0.762, P = 0.000), but not with the number MDSCs in the spleen (R = 0.308, P = 0.213). Similarly, there was a direct correlation between GM-CSF transcript levels in the spleen and the number of CD4 cells found within the tumor NPCs (R = 0.508, P = 0.044) and the number of MDSCs found within the NPCs of tumors (R = 0.718, P = 0.001). This absolute number of MDSCs is also consistent with the tumor volume such that there was a direct correlation between splenic GM-CSF levels and tumor size (R = 0.731, P = 0.000). In contrast the levels of GM-CSF found within the NPCs of tumors did not correlate with any of these parameters. These relationships differ from those observed with the splenic Flt3L transcript levels, which were inversely related to the number of MDSCs (R = −0.762, P = 0.027) within the tumor NPCs. Thus, the number of MDSCs within the tumor is related to the splenic transcript levels of GM-CSF and inversely with G-CSF and Flt3L levels within the tumor NPCs. Together these results suggest that there are differences between tumor models, including transgenic tumor models, in the relationships between MDSCs expansion and growth factor and cytokine transcript levels, but also the sites of MDSC expansion as shown here for the spleen and the tumor.
Discussion
Transgenic female mice expressing the transforming rat oncogene c-erb-B2 (ErbB2/Neu) under control of the mouse mammary tumor virus (MMTV) promoter reproducibly develop mammary tumors [24]. The resultant metastatic mammary tumors have a progression similar to the 15–30% of women with Her-2-neu positive breast cancers [29, 30] which are associated with a poor prognosis [30] and resistance to endocrine and conventional chemotherapy [27, 31–34]. To date, most of the “survival” studies have focused on ErbB2-neu transgenic mice on a BALB/c background [35], examining potential mechanisms associated with tumor induction, progression and therapeutic intervention [7, 27, 32, 35, 36]; although, a few studies have been undertaken in FVB mice [37–39].
In our studies, the tumor incidence in monoparous FVB-neuN mice was 90%, with a median time to tumor induction of 265 days. While this is a high tumor incidence compared to nulliparous FVB-neuN mice, the time to tumor induction was longer in FVB-neuN mice compared to the FVB-neuT (MMTV/activated neu) mice, 89 days (range 78–95) reported by Muller et al. [34], and the BALB-neuT mice, 18–25 weeks of age reported by Boggio et al. [40]. Further, survival of the monoparous FVB-neuN mice is prolonged (median survival of 432 days) as opposed to 183 days, as reported for BALB-neuT mice [41, 42]. Wagner et al. reported that parity promoted tumorigenesis in FVB- neuN mice and shortened the overall onset of the disease, such that all multiparous littermate controls developed mammary tumors in less than 1 year in a manner dependent on the number of pregnancies [43]. Landis et al. suggested that MMTV-neu mice that were maintained pregnant or lactating, beginning at 3 weeks of age, had accelerated tumorigenesis [44], which remained stochastic, indicating that early pregnancy is not a requisite for tumorigenesis. These results are consistent with the observations from the lab of Forni [5] where FVB-neuN transgenic mice had a marked delay in tumor onset and a reduction in tumor multiplicity compared to BALB-NeuT (MMTV/activated neu) female mice [36]. In our studies, which used monoparous FVB-neuN mice with a long latency and slow growth also develop a high incidence of lung metastases, which may be due to the prolonged tumor progression. As discussed herein, based on the histologic studies, tumor development is a multi-step process beginning with dysplastic lesions, progressing through multiple intermediary stages including hyerproliferation and cellular abnormalities and resulting in invasive, metastatic carcinomas [33].
In our histopathologic studies of FVB-neuN mice, tumors develop similarly, to that observed in BALB-neuT mice [5, 36], but with a slower induction and progression timeline. We have extended the BALB-neuT studies with the finding of a Gr-1+ cell infiltration that is increased within necrotic foci. Numerous apoptotic cells are also found within the tumors, as well as, extensive capillary formation most notably within pulmonary metastases. Thus, FVB-neuN mice differ from the BALB-neuT mice based on the kinetics of tumor induction and progression, as well as, a lack of hepatic metastases.
Abnormalities in myelopoiesis can occur in patients with a wide variety of tumor histiotypes [7, 38, 45–47] typically observed as a leukocytosis/granulocytosis which is described as a “perineoplastic syndrome”. This is not associated with invasion or metastasis, but rather tumor secretion of cytokines and growth factors [10]. Thus, tumor secretion of VEGF-A, G-CSF, GM-CSF or SCF have all been shown to expand the number of circulating hematopoietic progenitors [48, 49] and to alter CD34+ and dendritic cell homing, infiltration and maturation [24, 50–53]. Expansion of MDSCs has been observed in TB mice and in response to cyto-reductive therapy [54], as well as, in the PB of cancer patients [55]. We report herein, studies into the relationship between tumor progression and myelopoiesis [32, 36, 56] using the FVB-neuN murine model. Progression of mammary tumors [33, 57] occurs in association with splenomeglia, a progressive increase in circulating Gr-1+CD11b+ cells and a reduction in T-cell frequency. Unlike the studies in BALB-neuT mice, our studies revealed a significant inverse relationship between splenic CD4+ lymphocyte numbers and tumor volume and cellularity (P = 0.011 and 0.000, respectively). The studies in BALB-neuT mice, reported a relationship between tumor multiplicity and MDSC frequency, but not tumor volume [7]. Our studies also observed a significant inverse relationship between the frequency of splenic CD4+ cells and the number of MDSCs within the tumor (P = 0.027).
Multiple cytokines and growth factors appear to be responsible for the tumor-associated expansion of hematopoietic progenitor cells. This includes VEGF-A which is produced in high amounts by many tumors [56] and whose production is associated with a poor prognosis [58]. VEGF-A has been suggested to regulate hematopoietic progenitor differentiation, expansion of MDSCs and to modify DC maturation and function, in addition to, affecting steady state hematopoiesis and increasing number of committed myeloid progenitors [4, 6, 51, 56, 59–61]. In several murine models, injection with VEGF-A has been shown to reduce DC number and to inhibit in the function and maturation [7, 29, 62]. Consistent with this observation, treatment with antibodies against VEGF-A has been shown to restore DC maturation and function and in some, but not all studies to reduce MDSC number [4, 50, 63]. In BALB-neuT mice, increasing levels of serum VEGF-A, presumably secreted by the mammary tumors, has been suggested to account for the increased number of hematopoietic progenitors [7, 40, 58, 64]. We report that the transcript levels of VEGF-A by NPCs (ΔΔCT 25 ± 6.9) are significantly higher than the levels observed in mammary tumor parenchyma (ΔΔCT 8.7 ± 1.8) suggesting that the infiltrating NPCs are responsible much of the increase in VEGF-A transcripts as opposed to the tumor parenchyma. Furthermore, the tumor-infiltrating NPCs and their production of high VEGF-A transcript levels are due to tumor cell–spleen cell interactions in TB mice, as significantly lower levels of VEGF-A transcript levels (ΔΔCT 0.5 ± 0.05) are observed with spleen cells. However, despite the increased levels of VEGF-A, no significant correlation was observed in our studies between tumor burden and VEGF-A transcript levels in leukocytes from either the spleen or tumor. These differ from results with BALB-neuT mice that have shown a direct association between tumor secretion of VEGF-A and MDSCs [40, 64]. In addition, an association between tumor multiplicity in BALB-neuT mice and the frequency of MDSCs has been reported in the PB and spleen has been observed, suggesting that tumor burden affects overall hematopoiesis [7].
In other studies, tumor-associated GM-CSF secretion by transplanted tumors was suggested to be responsible for abnormal myeloid differentiation [50]. Melani et al. reported that immature myeloid cells, that were Gr-1+Mac-1+CD31+, in the PB and spleens of BALB-neuT and the myeloid cell expansion was mediated by VEGF but not GM-CSF [7]. This observation was extended by a study of GM-CSF-induced Gr1+Cd11b+ MDSCs that substantially impaired antigen-specific T-cell responses and adversely affected antitumor immune responses in vivo [65]. Furthermore, several reports have shown that high-dose GM-CSF producing vaccines impair the immune response through the recruitment of myeloid suppressor cells [66]. In our studies using FVB-neuN mice, there was a significant increase in the GM-CSF transcript levels from tumor NPCs (ΔΔCT 7.0 ± 1.0) and splenic cells (ΔΔCT 4.1 ± 1.1) as compared to w/t mice. However, in the BALB-neuT transgenic mouse model, increased levels of GM-CSF was not observed [7] suggesting that multiple mechanisms can regulate abnormal myelodifferentiation. Similar to VEGF-A, increased levels of GM-CSF were not associated with mammary tumor parenchyma, but rather with infiltrating NPCs. In our studies, we observed a direct correlation between splenic GM-CSF transcript levels and the number of MDSCs within the tumors, but not spleens. This was not observed with the tumor NPC GM-CSF transcript levels, which did not correlate with tumor burden. Interestingly, tumor NPC, G-CSF transcript levels were inversely related to the number of MDSCs within the tumor NPCs. This contrasts with the 38.1-fold increase in G-CSF transcript levels in the spleen that directly correlated with MDSC number within the spleen. Thus, G-CSF may be critical to the regulation of splenic MDSCs; whereas, spleen GM-CSF may regulate MDSCs within tumors. Furthermore, in these studies, VEGF-A transcript levels from both the spleen and tumor NPCs, were not related to the number of MDSCs within the spleen or tumor. Our studies with FVB-neuN mice also revealed a significant suppression in Flt3L transcript levels by the tumor NPCs and spleen cells as compared to levels in the spleen cells of w/t mice and an inverse relationship with MDSC number within the tumor. Thus, depressed Flt3L transcript levels were associated with a higher number of MDSCs within the tumor NPCs. As Flt3L is both a DC [67] and MDSC [64] growth factor. It is possible that the higher levels of Flt3L might drive progenitor cells toward DC precursors, reducing MDSCs. In our studies, tumor NPCs had an 80% reduction in Flt3L transcript levels; whereas, the spleen cells of TB animals had less of a depression in Flt3L transcript levels. Further, the mammary tumors of FVB-neuN mice had significantly increased VEGF-A and TGF-β, but not GM-CSF or G-CSF transcript levels. Thus, VEGF-A transcript levels within dysplastic and premalignant mammary tissue may have a critical, local-regional role in tumor induction and progression. In contrast, spleen cells, in the FVB-neuN mice have significantly increased GM-CSF and SCF transcript levels (results not shown), but not TGF-β or VEGF-A (results not shown); while the tumor-infiltrating NPCs in the FVB-neuN mice had significantly increased, as compared to tumor parenchyma, transcript levels of G-CSF (57.1 ± 16.6 vs. 1.5 ± 0.5), VEGF-A (25.3 ± 6.9 vs. 8.7 ± 1.8), and GM-CSF (7.0 ± 1.0 vs. 3.4 ± 1.8), respectively.
Our data suggests a role for G-CSF and GM-CSF expression in MDSCs expansion and mammary tumor development in FVB-neuN mice [68]. However, there was no direct correlation between MDSCs infiltrating the tumor, transcript levels of CCL2 (145.5 ± 39.7) and CXCL12 (25.2 ± 4.4) were significantly increased in the tumor-infiltrating NPCs in the FVB-NeuN. In the study by Worschech et al. transcript levels within tumors in FVB-neuN transgenic mice were compared to levels within the tumor microenvironment of w/t FVB mice which were capable of rejecting neu over expressing mammary tumors [69]. These studies suggested that the immune rejection in w/t mice was primarily mediated through IFN-γ stimulated genes and T-cell effector mechanisms. This contrasted with the transgenic tumor model, which had activated immune suppressive pathways, specifically the IL-10, SOCS-1 and SOCS-3 signaling pathways. In a study of microarrays which analyzed the gene expression profile of mammary tissue from untreated transgenic mice to vaccine-treated tumor-free BALB-neuT mice [70]. At 15 weeks of age revealed an up-regulation of gene encoding antibodies, IFNγ-inducing genes, and inflammatory molecules. Interestingly, immunization up-regulated expression of antibody-related genes, while the expression of genes related to CTL were not up-regulated. In addition, an up-regulation of S100A9, ligands of the receptor for advanced glycation end-products (RAGE) were demonstrated to be related to MDSCs. These studies strongly support the presence of MDSCs in neu transgenic mice and the therapeutic response to a reduction in MDSCs.
In summary, in FVB-neuN mice, tumor size directly correlates to the splenic transcript levels of Flt3L and GM-CSF, but not VEGF-A or GM-CSF within tumor NPCs. There is also an inverse relationship between G-CSF transcript levels within the tumor and tumor volume. Tumor volume also directly correlated with the number of MDSC within the tumor, as did tumor cellularity. We conclude that MDSCs and their associated suppression of T-cell function and frequency have a role in tumor induction, progression and potentially metastasis by mammary tumors in FVB-neuN mice. Furthermore, we suggest that in this tumor model, MDSC expansion maybe due to multiple cytokines secreted by cells from different organs.
Electronic supplementary material
Below is the link to the electronic supplementary material.
Acknowledgments
3419012108027 Avon—Adenovirus p53 Infected DC Vaccine for Breast Cancer. 3132050740—Nebraska Research Initiative—“Translation of Biotechnology into the Clinic”. The authors would like to thank Miss Jill Hallgren for editing of the manuscript.
References
- 1.Kaplan RN, Psaila B, Lyden D. Bone marrow cells in the ‘pre-metastatic niche’: within bone and beyond. Cancer Metastasis Rev. 2006;25(4):521–529. doi: 10.1007/s10555-006-9036-9. [DOI] [PubMed] [Google Scholar]
- 2.Ahn GO, Brown JM. Matrix metalloproteinase-9 is required for tumor vasculogenesis but not for angiogenesis: role of bone marrow-derived myelomonocytic cells. Cancer Cell. 2008;13(3):193–205. doi: 10.1016/j.ccr.2007.11.032. [DOI] [PMC free article] [PubMed] [Google Scholar]
- 3.Seandel M, Butler J, Lyden D, Rafii S. A catalytic role for proangiogenic marrow-derived cells in tumor neovascularization. Cancer Cell. 2008;13(3):181–183. doi: 10.1016/j.ccr.2008.02.016. [DOI] [PMC free article] [PubMed] [Google Scholar]
- 4.Fricke I, Mirza N, Dupont J, Lockhart C, Jackson A, Lee JH, et al. Vascular endothelial growth factor-trap overcomes defects in dendritic cell differentiation but does not improve antigen-specific immune responses. Clin Cancer Res. 2007;13(16):4840–4848. doi: 10.1158/1078-0432.CCR-07-0409. [DOI] [PubMed] [Google Scholar]
- 5.Serafini P, Meckel K, Kelso M, Noonan K, Califano J, Koch W, et al. Phosphodiesterase-5 inhibition augments endogenous antitumor immunity by reducing myeloid-derived suppressor cell function. J Exp Med. 2006;203(12):2691–2702. doi: 10.1084/jem.20061104. [DOI] [PMC free article] [PubMed] [Google Scholar]
- 6.Serafini P, Mgebroff S, Noonan K, Borrello I. Myeloid-derived suppressor cells promote cross-tolerance in B-cell lymphoma by expanding regulatory T cells. Cancer Res. 2008;68(13):5439–5449. doi: 10.1158/0008-5472.CAN-07-6621. [DOI] [PMC free article] [PubMed] [Google Scholar]
- 7.Melani C, Chiodoni C, Forni G, Colombo MP. Myeloid cell expansion elicited by the progression of spontaneous mammary carcinomas in c-erbB-2 transgenic BALB/c mice suppresses immune reactivity. Blood. 2003;102(6):2138–2145. doi: 10.1182/blood-2003-01-0190. [DOI] [PubMed] [Google Scholar]
- 8.Bronte V, Serafini P, Apolloni E, Zanovello P. Tumor-induced immune dysfunctions caused by myeloid suppressor cells. J Immunother. 2001;24(6):431–446. doi: 10.1097/00002371-200111000-00001. [DOI] [PubMed] [Google Scholar]
- 9.Grizzle WE, Xu X, Zhang S, Stockard CR, Liu C, Yu S, et al. Age-related increase of tumor susceptibility is associated with myeloid-derived suppressor cell mediated suppression of T cell cytotoxicity in recombinant inbred BXD12 mice. Mech Ageing Dev. 2007;128(11–12):672–680. doi: 10.1016/j.mad.2007.10.003. [DOI] [PubMed] [Google Scholar]
- 10.Talmadge JE. Pathways mediating the expansion and immunosuppressive activity of myeloid-derived suppressor cells and their relevance to cancer therapy. Clin Cancer Res. 2007;13(18 Pt 1):5243–5248. doi: 10.1158/1078-0432.CCR-07-0182. [DOI] [PubMed] [Google Scholar]
- 11.Gabrilovich D. Mechanisms and functional significance of tumour-induced dendritic-cell defects. Nat Rev Immunol. 2004;4(12):941–952. doi: 10.1038/nri1498. [DOI] [PubMed] [Google Scholar]
- 12.Badger AM, King AG, Talmadge JE, Schwartz DA, Picker DH, Mirabelli CK, et al. Induction of non-specific suppressor cells in normal Lewis rats by a novel azaspirane SK&F 105685. J Autoimmun. 1990;3(4):485–500. doi: 10.1016/S0896-8411(05)80015-0. [DOI] [PubMed] [Google Scholar]
- 13.Holda JH, Maier T, Claman HN. Murine graft-versus-host disease across minor barriers: immunosuppressive aspects of natural suppressor cells. Immunol Rev. 1985;88:87–105. doi: 10.1111/j.1600-065X.1985.tb01154.x. [DOI] [PubMed] [Google Scholar]
- 14.Strober S. Natural suppressor (NS) cells, neonatal tolerance, and total lymphoid irradiation: exploring obscure relationships. Annu Rev Immunol. 1984;2:219–237. doi: 10.1146/annurev.iy.02.040184.001251. [DOI] [PubMed] [Google Scholar]
- 15.Bronte V, Apolloni E, Cabrelle A, Ronca R, Serafini P, Zamboni P, et al. Identification of a CD11b(+)/Gr-1(+)/CD31(+) myeloid progenitor capable of activating or suppressing CD8(+) T cells. Blood. 2000;96(12):3838–3846. [PMC free article] [PubMed] [Google Scholar]
- 16.Bronte V, Wang M, Overwijk WW, Surman DR, Pericle F, Rosenberg SA, et al. Apoptotic death of CD8+ T lymphocytes after immunization: induction of a suppressive population of Mac-1+/Gr-1+ cells. J Immunol. 1998;161(10):5313–5320. [PMC free article] [PubMed] [Google Scholar]
- 17.Leenen PJ, de Bruijn MF, Voerman JS, Campbell PA, van EW. Markers of mouse macrophage development detected by monoclonal antibodies. J Immunol Methods. 1994;174(1–2):5–19. doi: 10.1016/0022-1759(94)90005-1. [DOI] [PubMed] [Google Scholar]
- 18.Gallina G, Dolcetti L, Serafini P, De SC, Marigo I, Colombo MP, et al. Tumors induce a subset of inflammatory monocytes with immunosuppressive activity on CD8+ T cells. J Clin Invest. 2006;116(10):2777–2790. doi: 10.1172/JCI28828. [DOI] [PMC free article] [PubMed] [Google Scholar]
- 19.Huang B, Pan PY, Li Q, Sato AI, Levy DE, Bromberg J, et al. Gr-1+CD115+ immature myeloid suppressor cells mediate the development of tumor-induced T regulatory cells and T-cell anergy in tumor-bearing host. Cancer Res. 2006;66(2):1123–1131. doi: 10.1158/0008-5472.CAN-05-1299. [DOI] [PubMed] [Google Scholar]
- 20.Dugast AS, Haudebourg T, Coulon F, Heslan M, Haspot F, Poirier N, et al. Myeloid-derived suppressor cells accumulate in kidney allograft tolerance and specifically suppress effector T cell expansion. J Immunol. 2008;180(12):7898–7906. doi: 10.4049/jimmunol.180.12.7898. [DOI] [PubMed] [Google Scholar]
- 21.Rodriguez PC, Ochoa AC. Arginine regulation by myeloid derived suppressor cells and tolerance in cancer: mechanisms and therapeutic perspectives. Immunol Rev. 2008;222:180–191. doi: 10.1111/j.1600-065X.2008.00608.x. [DOI] [PMC free article] [PubMed] [Google Scholar]
- 22.Serafini P, De Santo C, Marigo I, Cingarlini S, Dolcetti L, Gallina G, et al. Derangement of immune responses by myeloid suppressor cells. Cancer Immunol Immunother. 2004;53(2):64–72. doi: 10.1007/s00262-003-0443-2. [DOI] [PMC free article] [PubMed] [Google Scholar]
- 23.Donkor M, Lahue E, Hoke T, Shafer L, Coskun U, Solheim JC et al. (2009) Mammary tumor heterogeneity in the expansion of myeloid-derived suppressor cells. Int Immunopharmacol. [Epub ahead of print] [DOI] [PubMed]
- 24.Talmadge JE, Singh RK, Fidler IJ, Raz A. Murine models to evaluate novel and conventional therapeutic strategies for cancer. Am J Pathol. 2007;170(3):793–804. doi: 10.2353/ajpath.2007.060929. [DOI] [PMC free article] [PubMed] [Google Scholar]
- 25.Talmadge JE, Hood KC, Zobel LC, Shafer LR, Coles M, Toth B. Chemoprevention by cyclooxygenase-2 inhibition reduces immature myeloid suppressor cell expansion. Int Immunopharmacol. 2007;7(2):140–151. doi: 10.1016/j.intimp.2006.09.021. [DOI] [PubMed] [Google Scholar]
- 26.Livak KJ, Schmittgen TD. Analysis of relative gene expression data using real-time quantitative PCR and the 2(-Delta Delta C(T)) Method. Methods. 2001;25(4):402–408. doi: 10.1006/meth.2001.1262. [DOI] [PubMed] [Google Scholar]
- 27.Guy CT, Cardiff RD, Muller WJ. Activated neu induces rapid tumor progression. J Biol Chem. 1996;271(13):7673–7678. doi: 10.1074/jbc.271.13.7673. [DOI] [PubMed] [Google Scholar]
- 28.Key ME, Talmadge JE, Fogler WE, Bucana C, Fidler IJ. Isolation of tumoricidal macrophages from lung melanoma metastases of mice treated systemically with liposomes containing a lipophilic derivative of muramyl dipeptide. J Natl Cancer Inst. 1982;69(5):1198. [PubMed] [Google Scholar]
- 29.Shojaei F, Wu X, Malik AK, Zhong C, Baldwin ME, Schanz S, et al. Tumor refractoriness to anti-VEGF treatment is mediated by CD11b + Gr1 + myeloid cells. Nat Biotechnol. 2007;25(8):911–920. doi: 10.1038/nbt1323. [DOI] [PubMed] [Google Scholar]
- 30.Salomon DS, Brandt R, Ciardiello F, Normanno N. Epidermal growth factor-related peptides and their receptors in human malignancies. Crit Rev Oncol Hematol. 1995;19(3):183–232. doi: 10.1016/1040-8428(94)00144-I. [DOI] [PubMed] [Google Scholar]
- 31.Bouchard L, Lamarre L, Tremblay PJ, Jolicoeur P. Stochastic appearance of mammary tumors in transgenic mice carrying the MMTV/c-neu oncogene. Cell. 1989;57(6):931–936. doi: 10.1016/0092-8674(89)90331-0. [DOI] [PubMed] [Google Scholar]
- 32.Guy CT, Webster MA, Schaller M, Parsons TJ, Cardiff RD, Muller WJ. Expression of the neu protooncogene in the mammary epithelium of transgenic mice induces metastatic disease. Proc Natl Acad Sci USA. 1992;89(22):10578–10582. doi: 10.1073/pnas.89.22.10578. [DOI] [PMC free article] [PubMed] [Google Scholar]
- 33.Wellings SR, Jensen HM. On the origin and progression of ductal carcinoma in the human breast. J Natl Cancer Inst. 1973;50(5):1111–1118. doi: 10.1093/jnci/50.5.1111. [DOI] [PubMed] [Google Scholar]
- 34.Muller WJ, Sinn E, Pattengale PK, Wallace R, Leder P. Single-step induction of mammary adenocarcinoma in transgenic mice bearing the activated c-neu oncogene. Cell. 1988;54(1):105–115. doi: 10.1016/0092-8674(88)90184-5. [DOI] [PubMed] [Google Scholar]
- 35.Di CE, Diodoro MG, Boggio K, Modesti A, Modesti M, Nanni P, et al. Analysis of mammary carcinoma onset and progression in HER-2/neu oncogene transgenic mice reveals a lobular origin. Lab Invest. 1999;79(10):1261–1269. [PubMed] [Google Scholar]
- 36.Boggio K, Nicoletti G, Di Carlo E, Cavallo F, Landuzzi L, Melani C, et al. Interleukin 12-mediated prevention of spontaneous mammary adenocarcinomas in two lines of Her-2/neu transgenic mice. J Exp Med. 1998;188(3):589–596. doi: 10.1084/jem.188.3.589. [DOI] [PMC free article] [PubMed] [Google Scholar]
- 37.Nanni P, Nicoletti G, De GC, Landuzzi L, Di CE, Iezzi M, et al. Prevention of HER-2/neu transgenic mammary carcinoma by tamoxifen plus interleukin 12. Int J Cancer. 2003;105(3):384–389. doi: 10.1002/ijc.11092. [DOI] [PubMed] [Google Scholar]
- 38.Sas S, Chan T, Sami A, El-Gayed A, Xiang J. Vaccination of fiber-modified adenovirus-transfected dendritic cells to express HER-2/neu stimulates efficient HER-2/neu-specific humoral and CTL responses and reduces breast carcinogenesis in transgenic mice. Cancer Gene Ther. 2008;15(10):655–666. doi: 10.1038/cgt.2008.18. [DOI] [PubMed] [Google Scholar]
- 39.Singh R, Paterson Y. Vaccination strategy determines the emergence and dominance of CD8+ T-cell epitopes in a FVB/N rat HER-2/neu mouse model of breast cancer. Cancer Res. 2006;66(15):7748–7757. doi: 10.1158/0008-5472.CAN-05-4469. [DOI] [PubMed] [Google Scholar]
- 40.Boggio K, Di CE, Rovero S, Cavallo F, Quaglino E, Lollini PL, et al. Ability of systemic interleukin-12 to hamper progressive stages of mammary carcinogenesis in HER2/neu transgenic mice. Cancer Res. 2000;60(2):359–364. [PubMed] [Google Scholar]
- 41.Cipriani B, Fridman A, Bendtsen C, Dharmapuri S, Mennuni C, Pak I, et al. Therapeutic vaccination halts disease progression in BALB-neuT mice: the amplitude of elicited immune response is predictive of vaccine efficacy. Hum Gene Ther. 2008;19(7):670–680. doi: 10.1089/hum.2007.127. [DOI] [PubMed] [Google Scholar]
- 42.Street SE, Zerafa N, Iezzi M, Westwood JA, Stagg J, Musiani P, et al. Host perforin reduces tumor number but does not increase survival in oncogene-driven mammary adenocarcinoma. Cancer Res. 2007;67(11):5454–5460. doi: 10.1158/0008-5472.CAN-06-4084. [DOI] [PubMed] [Google Scholar]
- 43.Henry MD, Triplett AA, Oh KB, Smith GH, Wagner KU. Parity-induced mammary epithelial cells facilitate tumorigenesis in MMTV-neu transgenic mice. Oncogene. 2004;23(41):6980–6985. doi: 10.1038/sj.onc.1207827. [DOI] [PubMed] [Google Scholar]
- 44.Landis MD, Seachrist DD, Abdul-Karim FW, Keri RA. Sustained trophism of the mammary gland is sufficient to accelerate and synchronize development of ErbB2/Neu-induced tumors. Oncogene. 2006;25(23):3325–3334. doi: 10.1038/sj.onc.1209365. [DOI] [PMC free article] [PubMed] [Google Scholar]
- 45.Estrov Z, Talpaz M, Mavligit G, Pazdur R, Harris D, Greenberg SM, et al. Elevated plasma thrombopoietic activity in patients with metastatic cancer-related thrombocytosis. Am J Med. 1995;98(6):551–558. doi: 10.1016/S0002-9343(99)80013-8. [DOI] [PubMed] [Google Scholar]
- 46.Kitamura H, Kodama F, Odagiri S, Nagahara N, Inoue T, Kanisawa M. Granulocytosis associated with malignant neoplasms: a clinicopathologic study and demonstration of colony-stimulating activity in tumor extracts. Hum Pathol. 1989;20(9):878–885. doi: 10.1016/0046-8177(89)90100-7. [DOI] [PubMed] [Google Scholar]
- 47.Ruka W, Rutkowski P, Kaminska J, Rysinska A, Steffen J. Alterations of routine blood tests in adult patients with soft tissue sarcomas: relationships to cytokine serum levels and prognostic significance. Ann Oncol. 2001;12(10):1423–1432. doi: 10.1023/A:1012527006566. [DOI] [PubMed] [Google Scholar]
- 48.Fu YX, Watson G, Jimenez JJ, Wang Y, Lopez DM. Expansion of immunoregulatory macrophages by granulocyte-macrophage colony-stimulating factor derived from a murine mammary tumor. Cancer Res. 1990;50(2):227–234. [PubMed] [Google Scholar]
- 49.Pan PY, Wang GX, Yin B, Ozao J, Ku T, Divino CM, et al. Reversion of immune tolerance in advanced malignancy: modulation of myeloid-derived suppressor cell development by blockade of stem-cell factor function. Blood. 2008;111(1):219–228. doi: 10.1182/blood-2007-04-086835. [DOI] [PMC free article] [PubMed] [Google Scholar]
- 50.Bronte V, Chappell DB, Apolloni E, Cabrelle A, Wang M, Hwu P, et al. Unopposed production of granulocyte-macrophage colony-stimulating factor by tumors inhibits CD8+ T cell responses by dysregulating antigen-presenting cell maturation. J Immunol. 1999;162(10):5728–5737. [PMC free article] [PubMed] [Google Scholar]
- 51.Gabrilovich DI, Chen HL, Girgis KR, Cunningham HT, Meny GM, Nadaf S, et al. Production of vascular endothelial growth factor by human tumors inhibits the functional maturation of dendritic cells. Nat Med. 1996;2(10):1096–1103. doi: 10.1038/nm1096-1096. [DOI] [PubMed] [Google Scholar]
- 52.Oyama T, Ran S, Ishida T, Nadaf S, Kerr L, Carbone DP, et al. Vascular endothelial growth factor affects dendritic cell maturation through the inhibition of nuclear factor-kappa B activation in hemopoietic progenitor cells. J Immunol. 1998;160(3):1224–1232. [PubMed] [Google Scholar]
- 53.Young MR, Kolesiak K, Wright MA, Gabrilovich DI. Chemoattraction of femoral CD34+ progenitor cells by tumor-derived vascular endothelial cell growth factor. Clin Exp Metastasis. 1999;17(10):881–888. doi: 10.1023/A:1006708607666. [DOI] [PubMed] [Google Scholar]
- 54.Diaz-Montero CM, Salem ML, Nishimura MI, Garrett-Mayer E, Cole DJ, Montero AJ. Increased circulating myeloid-derived suppressor cells correlate with clinical cancer stage, metastatic tumor burden, and doxorubicin–cyclophosphamide chemotherapy. Cancer Immunol Immunother. 2009;58(1):49–59. doi: 10.1007/s00262-008-0523-4. [DOI] [PMC free article] [PubMed] [Google Scholar]
- 55.Ochoa AC, Zea AH, Hernandez C, Rodriguez PC. Arginase, prostaglandins, and myeloid-derived suppressor cells in renal cell carcinoma. Clin Cancer Res. 2007;13(2 Pt 2):721s–726s. doi: 10.1158/1078-0432.CCR-06-2197. [DOI] [PubMed] [Google Scholar]
- 56.Marty M, Pivot X. The potential of anti-vascular endothelial growth factor therapy in metastatic breast cancer: clinical experience with anti-angiogenic agents, focusing on bevacizumab. Eur J Cancer. 2008;44(7):912–920. doi: 10.1016/j.ejca.2008.01.005. [DOI] [PubMed] [Google Scholar]
- 57.Krishnamurthy S, Sneige N. Molecular and biologic markers of premalignant lesions of human breast. Adv Anat Pathol. 2002;9(3):185–197. doi: 10.1097/00125480-200205000-00002. [DOI] [PubMed] [Google Scholar]
- 58.Melani C, Sangaletti S, Barazzetta FM, Werb Z, Colombo MP. Amino-biphosphonate-mediated MMP-9 inhibition breaks the tumor-bone marrow axis responsible for myeloid-derived suppressor cell expansion and macrophage infiltration in tumor stroma. Cancer Res. 2007;67(23):11438–11446. doi: 10.1158/0008-5472.CAN-07-1882. [DOI] [PMC free article] [PubMed] [Google Scholar]
- 59.Gabrilovich DI, Bronte V, Chen SH, Colombo MP, Ochoa A, Ostrand-Rosenberg S, et al. The terminology issue for myeloid-derived suppressor cells. Cancer Res. 2007;67(1):425. doi: 10.1158/0008-5472.CAN-06-3037. [DOI] [PMC free article] [PubMed] [Google Scholar]
- 60.Kusmartsev S, Gabrilovich DI. Immature myeloid cells and cancer-associated immune suppression. Cancer Immunol Immunother. 2002;51(6):293–298. doi: 10.1007/s00262-002-0280-8. [DOI] [PMC free article] [PubMed] [Google Scholar]
- 61.Solheim JC, Reber AJ, Ashour AE, Robinson S, Futakuchi M, Kurz SG, et al. Spleen but not tumor infiltration by dendritic and T cells is increased by intravenous adenovirus-Flt3 ligand injection. Cancer Gene Ther. 2007;14(4):364–371. doi: 10.1038/sj.cgt.7701018. [DOI] [PubMed] [Google Scholar]
- 62.Gabrilovich DI, Velders MP, Sotomayor EM, Kast WM. Mechanism of immune dysfunction in cancer mediated by immature Gr-1+ myeloid cells. J Immunol. 2001;166(9):5398–5406. doi: 10.4049/jimmunol.166.9.5398. [DOI] [PubMed] [Google Scholar]
- 63.Kusmartsev S, Eruslanov E, Kubler H, Tseng T, Sakai Y, Su Z, et al. Oxidative stress regulates expression of VEGFR1 in myeloid cells: link to tumor-induced immune suppression in renal cell carcinoma. J Immunol. 2008;181(1):346–353. doi: 10.4049/jimmunol.181.1.346. [DOI] [PubMed] [Google Scholar]
- 64.Reilly RT, Gottlieb MB, Ercolini AM, Machiels JP, Kane CE, Okoye FI, et al. HER-2/neu is a tumor rejection target in tolerized HER-2/neu transgenic mice. Cancer Res. 2000;60(13):3569–3576. [PubMed] [Google Scholar]
- 65.Serafini P, Carbley R, Noonan KA, Tan G, Bronte V, Borrello I. High-dose granulocyte-macrophage colony-stimulating factor-producing vaccines impair the immune response through the recruitment of myeloid suppressor cells. Cancer Res. 2004;64(17):6337–6343. doi: 10.1158/0008-5472.CAN-04-0757. [DOI] [PubMed] [Google Scholar]
- 66.Parmiani G, Castelli C, Pilla L, Santinami M, Colombo MP, Rivoltini L. Opposite immune functions of GM-CSF administered as vaccine adjuvant in cancer patients. Ann Oncol. 2007;18(2):226–232. doi: 10.1093/annonc/mdl158. [DOI] [PubMed] [Google Scholar]
- 67.Reber AJ, Ashour AE, Robinson SN, Talmadge JE, Solheim JC. Flt3 ligand bioactivity and pharmacology in neoplasia. Curr Drug Targets Immune Endocr Metabol Disord. 2004;4(2):149–156. doi: 10.2174/1568008043339956. [DOI] [PubMed] [Google Scholar]
- 68.Calogero RA, Cordero F, Forni G, Cavallo F. Inflammation and breast cancer. Inflammatory component of mammary carcinogenesis in ErbB2 transgenic mice. Breast Cancer Res. 2007;9(4):211. doi: 10.1186/bcr1745. [DOI] [PMC free article] [PubMed] [Google Scholar]
- 69.Worschech A, Kmieciak M, Knutson KL, Bear HD, Szalay AA, Wang E, et al. Signatures associated with rejection or recurrence in HER-2/neu-positive mammary tumors. Cancer Res. 2008;68(7):2436–2446. doi: 10.1158/0008-5472.CAN-07-6822. [DOI] [PMC free article] [PubMed] [Google Scholar]
- 70.Astolfi A, Landuzzi L, Nicoletti G, De GC, Croci S, Palladini A, et al. Gene expression analysis of immune-mediated arrest of tumorigenesis in a transgenic mouse model of HER-2/neu-positive basal-like mammary carcinoma. Am J Pathol. 2005;166(4):1205–1216. doi: 10.1016/S0002-9440(10)62339-5. [DOI] [PMC free article] [PubMed] [Google Scholar]
Associated Data
This section collects any data citations, data availability statements, or supplementary materials included in this article.