

Summary
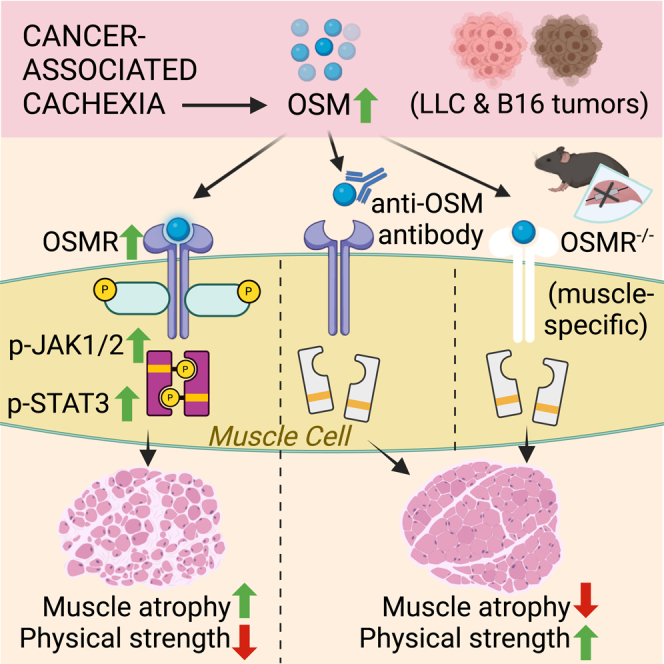
Progressive weakness and muscle loss are associated with multiple chronic conditions, including muscular dystrophy and cancer. Cancer-associated cachexia, characterized by dramatic weight loss and fatigue, leads to reduced quality of life and poor survival. Inflammatory cytokines have been implicated in muscle atrophy; however, available anticytokine therapies failed to prevent muscle wasting in cancer patients. Here, we show that oncostatin M (OSM) is a potent inducer of muscle atrophy. OSM triggers cellular atrophy in primary myotubes using the JAK/STAT3 pathway. Identification of OSM targets by RNA sequencing reveals the induction of various muscle atrophy-related genes, including Atrogin1. OSM overexpression in mice causes muscle wasting, whereas muscle-specific deletion of the OSM receptor (OSMR) and the neutralization of circulating OSM preserves muscle mass and function in tumor-bearing mice. Our results indicate that activated OSM/OSMR signaling drives muscle atrophy, and the therapeutic targeting of this pathway may be useful in preventing muscle wasting.
Keywords: cancer cachexia, skeletal muscle atrophy, oncostatin M, JAK/STAT3 signaling
Graphical abstract
Highlights
-
•
OSM induces the JAK/STAT3 pathway to promote the expression of muscle atrophy genes
-
•
High OSM levels trigger skeletal muscle wasting in mice
-
•
Mice lacking OSM receptor are protected from tumor-induced muscle wasting
-
•
Neutralization of circulating OSM preserves muscle tissue in tumor-bearing mice
Progressive muscle loss in cancer patients is a major unresolved problem that negatively influences treatment and survival. Domaniku-Waraich et al. show that tumor-induced cytokine oncostatin M (OSM) drives muscle atrophy. Inhibition of OSM signaling in preclinical tumor models protects from muscle wasting, indicating a therapeutic potential in targeting this pathway.
Introduction
Skeletal muscle atrophy is characterized by the loss of muscle mass due to excessive protein catabolism and the consequent poor muscle strength.1 Muscle loss is associated with multiple conditions, including aging (i.e., sarcopenia), organ failures, immune system complications, and muscular dystrophies.1,2 Muscle wasting is also a hallmark of cachexia syndrome linked to chronic diseases such as cancer, kidney disease, and heart failure.3 Cachexia-led progressive atrophy of muscle and adipose tissues causes dramatic weight loss, which is associated with poor quality of life due to frailty and restrained daily activity. Cachexia is particularly common among cancer patients and is the direct cause of ∼ 20% of all cancer deaths.4 It leads to a poor response to chemotherapy, often prevents patients from receiving further therapies, and negatively influences survival. With no effective treatment to block muscle wasting, cachexia has remained a significant unmet medical need.5,6
Systemic inflammation has long been linked to cancer cachexia, and proinflammatory cytokines tumor necrosis factor α (TNF-α), interleukin-1 (IL-1), and IL-6 have been suggested as causal agents.7 Although TNF-α has many systemic effects, its role in muscle wasting remains unclear.1 Anti-TNF-α therapies have failed to prevent muscle atrophy in patients with advanced cancer cachexia.8,9 IL-1 and IL-6 are upregulated in animal models of cancer cachexia, and targeting IL-6 ameliorates muscle loss in cachectic mice.1,10 Clinical trials using anti-IL-1 and anti-IL-6 therapies showed promising results; however, a satisfactory effect on skeletal muscle mass was not attained.11,12 To design novel targeted therapies, a better understanding of the link between inflammatory mediators and muscle atrophy is needed.
Investigating muscle wasting in a murine model of cancer cachexia, we identified oncostatin M (OSM) as a potential mediator of inflammatory responses in skeletal muscle. OSM is a member of the IL-6 family of cytokines and has crucial functions in cell growth, differentiation, and inflammation.13 OSM was originally identified for its ability to inhibit tumorigenesis.14 However, it modulates a variety of biological processes that are cell type dependent, including liver development, hematopoiesis, and bone metabolism.15 Elevated OSM levels have been observed in cancer and inflammatory diseases in humans.13,15 OSM signals through its receptor, OSMR, and the receptor subunit GP130. The Osmr gene itself is a transcriptional target of OSM.16,17 Upon detecting elevated Osmr mRNA levels in muscles of tumor-bearing cachectic mice, we investigated the role of OSM/OSMR signaling in wasting. We found that OSM is a potent inducer of muscle atrophy in cultured primary myotubes and in the muscle tissue of mice. In fact, muscle-specific OSMR-knockout (KO) mice are resistant to tumor-driven muscle wasting.18 We showed that neutralization of OSM by a specific antibody preserves muscle mass and function in tumor-bearing mice. Our findings argue that OSM/OSMR signaling is a crucial driver of muscle loss.
Results
OSM promotes cellular atrophy in cultured primary myotubes
Using the murine Lewis lung carcinoma (LLC) and B16 melanoma models of cancer cachexia, we detected highly elevated mRNA levels of the Osmr gene in atrophying muscles (Figures 1A and 1B). Similarly, the expression of E3 ubiquitin ligase genes Atrogin1 and MuRF1, whose protein products are well-recognized activators of protein breakdown associated with muscle atrophy, was also elevated. To test whether enhanced OSMR activity contributes to the muscle atrophy process, we isolated mouse primary myoblast cells and differentiated them into myotubes. Treatment of the primary myotubes with a recombinant OSM protein induced the expression of Atrogin1 without altering MuRF1 levels (Figure 1C). OSM treatment also increased mRNA levels of its receptor Osmr along with mRNA levels of the downstream components of cytokine signaling Janus kinase 2 (Jak2) and suppressor of cytokine signaling 3 (Socs3) (Figure 1C). Furthermore, OSM-treated myotubes exhibited reduced diameter, a sign of cellular atrophy (Figure 1D). OSM promoted a stronger atrophy-inducing effect because myotube diameters were reduced more significantly compared to other IL-6 family cytokines implicated in muscle atrophy, such as IL-6 and leukemia inhibitory factor (LIF) (Figures 1D and 1E). Immunofluorescently labeled myosin heavy-chain (MyHC) signal was also significantly reduced in OSM-treated myotubes, in which a more pronounced atrophy phenotype was observed compared to cells treated with IL-6 and LIF (Figures S1A and S1B). OSM-dependent reduction in MyHC protein was also detected by western blotting. This effect was blocked by the proteasome inhibitor MG132 (Figure S1C). In fact, OSM administration to primary myotube cultures promoted protein ubiquitination (Figure S1D). In addition to Atrogin1, OSM also upregulated the expression of other E3 ubiquitin ligases, such as Traf6, Ubr2, Nedd4, and Musa1 (Figure S1E). These findings argue that OSM promotes atrophy in myotubes by enhancing protein degradation.
Figure 1.

OSM promotes cellular atrophy in cultured primary myotubes
(A and B) C57BL/6 mice inoculated with LLC (A) or B16 (B) cells were sacrificed 16 or 14 days later, respectively, and changes in gene expression of gastrocnemius muscle were determined by RT-qPCR (n = 5 for the control groups, n = 7 for the LLC group, and n = 5 for the B16 group).
(C) Mouse primary myotubes were treated with recombinant OSM (250 ng/mL) for 48 h. Changes in gene expression were determined by RT-qPCR (n = 3 for each group).
(D and E) Mouse primary myotubes were transduced with a GFP adenovirus. Cells were treated with recombinant OSM, IL-6, or LIF (each 250 ng/mL) for 48 h and then visualized under the fluorescence microscope. Scale bar, 50 μm (D). Average myotube diameter was measured (n = 4 for each group) (E).
(F and G) Mouse primary myotubes were treated with recombinant OSM, IL-6, or LIF (each 250 ng/mL) for 48 h. Gene expression profiles were analyzed by RNA sequencing. The heatmap of significant genes up- or downregulated more than 2-fold is shown (n = 2 for each group) (F). Changes in gene expression were determined by RT-qPCR (n = 3 for each group) (G).
Data are presented as mean ± SEM. Statistical analysis was conducted using 2-tailed t test (A–C) and 1-way ANOVA with Tukey’s post hoc test (E and G).
We investigated the impact of OSM, IL-6, and LIF on the global gene expression profiles of mouse primary myotubes using RNA sequencing and identified additional gene targets. Expression profiles of OSM-treated myotubes varied the most from the control group as evidenced by principal-component analysis (Figure S2A). The highest number of genes with significant differential expression was detected in the OSM treatment group (Figures S2B and S2C). OSM appeared to have a larger footprint on the transcriptome of myotubes as visualized in the heatmap of the differentially expressed genes (Figure 1F). A list of the genes with significant expression changes is presented in Data S1 and the datasets can be found in GEO: GSE222208. Pathway enrichment analysis demonstrated that genes upregulated by OSM involve targets of JAK/STAT (signal transducer and activator of transcription) signaling included in hallmark pathways such as inflammatory response, cytokine signaling, hypoxia, and the epithelial-mesenchymal transition, whereas genes downregulated by OSM are mostly related to cell-cycle regulation (Figure S2D). A complete list of these gene sets is shown in Data S2. From the analysis of RNA sequencing data, several muscle atrophy-related genes, including Atrogin1 (Fbxo32), Ampd3, Mt1, Mt2, Sln, Cebpd, Igfbp3, and Serpina3n, were found to be upregulated (Figure 1F; Data S1). We tested mRNA levels of these genes in mouse primary myotubes treated with OSM, IL-6, or LIF. In line with the impact on myotube appearance, OSM treatment stimulated a larger increase in Atrogin1 levels (Figure 1G). Similarly, more pronounced changes in the expression levels of Ampd3, Mt1, Mt2, Igfbp3, and Serpina3n were detected in response to OSM treatment (Figure 1G). A dose-response experiment demonstrated that low doses of OSM also stimulated the phosphorylation of STAT3 and the expression of atrophy-related genes in primary myotubes (Figures S3A and S3B). Our findings argue that OSM is a potent inducer of cellular atrophy in primary myotubes, and it significantly alters myotube gene expression.
OSM uses JAK/STAT3 signaling to elicit its effects in myotubes
OSM/OSMR signaling is known to activate STAT transcription factors, and the involvement of the JAK/STAT pathway in the atrophying muscle tissue was previously reported.15,19 Therefore, we investigated the effect of OSM administration on the phosphorylation and activation of the JAK/STAT signaling components. Treatment of mouse primary myotubes with recombinant OSM induced the phosphorylation of JAK2, STAT1, STAT3, and STAT5 (Figure 2A). Similar responses were obtained when myotubes were treated with recombinant LIF, whereas IL-6 treatment elicited milder effects. OSM-induced phosphorylation events were completely blocked when myotubes were also treated with JAK1/2 kinase inhibitor ruxolitinib (Rux; Figure 2B). In accordance, OSM-induced expression of atrophy-related genes was also reversed by Rux treatment, arguing an indispensable role for JAK kinases downstream of the OSM signaling (Figures 2C and S1E). Activation of the nuclear factor κB (NF-κB) signaling in atrophying muscles was also previously reported.20 However, treatment of primary myotubes with OSM did not alter the phosphorylation of NF-κB signaling elements, including IκB, p105-NF-κB, and p65-RelA (Figure S3C), and the processing of p105-NF-κB and p100-NF-κB2 into p50-NF-κB and p52-NF-κB2, respectively (Figure S3D). Although extended exposure of muscle cells to OSM protein stimulated EDA2R signaling that involves NF-κBs,18 the results of acute administration presented here argue that OSM cannot activate the NF-κB pathway directly.
Figure 2.

OSM uses JAK/STAT3 signaling to elicit its effects in myotubes
(A) Mouse primary myotubes were treated with recombinant OSM, IL-6, or LIF (each 250 ng/mL) for 10 min. Protein levels were determined by western blotting. Blots are representative of 3 independent experiments.
(B) Mouse primary myotubes were treated with Rux (2 μM) for 30 min, and then recombinant OSM (250 ng/mL) was added for 10 min. Protein levels were determined by western blotting. Blots are representative of 3 independent experiments.
(C) Mouse primary myotubes were treated with Rux (2 μM) and recombinant OSM (250 ng/mL) for 48 h mRNA levels were determined by RT-qPCR (n = 3 for each group).
(D–G) Mouse primary myotubes were transduced with LacZ or Stat3-Y705F expressing adenoviruses and treated with recombinant OSM (250 ng/mL) for 48 h. Protein levels were determined by western blotting (D). Blots are representative of 3 independent experiments. mRNA levels were tested by RT-qPCR (n = 3 for each group) (E). Cells were also transduced with a GFP adenovirus for fluorescence imaging. The average myotube diameter was measured (n = 4 for each group) (F). Myotubes were visualized under the fluorescence microscope. Scale bar, 50 μm (G).
Data are presented as mean ± SEM. Statistical analysis was conducted using 1-way ANOVA with Tukey’s post hoc test.
We next investigated the activation of STAT transcription factors in muscle tissue of LLC and B16 tumor-bearing mice. In line with previous reports, tumors induced STAT3 phosphorylation in muscle19,21,22 while the expression of Atrogin1, MuRF1, Osmr, Serpina3n, and Cebpd also increased (Figures S4A–S4E). Muscle-specific STAT3 depletion was previously shown to attenuate tumor-driven muscle wasting, and STAT3 involvement in Atrogin1 transcription was reported.19,22 Therefore, we tested the role of STAT3 in OSM-induced atrophy using a dominant-negative STAT3 isoform. STAT3-Y705F mutant was overexpressed in mouse primary myotubes by adenoviral delivery. The dominant-negative form blocked OSM-driven phosphorylation and activation of endogenous STAT3 protein (Figure 2D). Importantly, OSM-induced changes in the expression of atrophy-related genes were suppressed by the overexpression of the dominant-negative STAT3 (Figure 2E). These myotubes were also resistant to OSM-driven cellular atrophy because myotube diameter did not change (Figures 2F and 2G). These findings indicate that OSM uses JAK/STAT3 signaling to promote the expression of atrophy genes and the resultant cellular atrophy in primary myotubes. Previously, OSM was also indicated to activate MAPK signaling.23 We found that OSM administration to primary myotube cultures induced the phosphorylation of ERK1/2 in a JAK-dependent manner (Figure S5A). In fact, OSM was more potent in promoting ERK phosphorylation compared with IL-6 and LIF (Figure S5B). Inhibition of ERK activation blunted but did not abrogate OSM-induced transcriptional changes (Figure S5C). Therefore, it is likely that ERK activation by OSM serves to maximize the JAK/STAT3 activity in muscle cells.
OSM overexpression causes muscle atrophy in mice
We investigated the potential of OSM to promote muscle atrophy in vivo by overexpressing it in muscle tissues of mice. For this purpose, we generated an adenoviral vector expressing mouse OSM. When mouse primary myotubes were transduced with the OSM adenovirus, they were induced to undergo atrophy as evidenced by a decrease in their diameter (Figures S6A and S6B). The overexpression of OSM in primary myotubes also stimulated the expression of Osmr and muscle atrophy-related genes, including Atrogin1 (Figures S6C and S6D). Next, we administrated the OSM adenovirus into the tibialis anterior (TA) muscle unilaterally while the contralateral TA muscle was transduced with a control LacZ adenovirus. The weight of TA muscles of both male and female mice fell significantly 7 days after the transduction with adeno-OSM, whereas gastrocnemius muscles were unaffected (Figures 3A and S6E). A similar atrophic effect was also observed in gastrocnemius muscles transduced with the adeno-OSM (Figure S6F). H&E staining of TA tissue sections demonstrated a significant drop in muscle fiber cross-sectional area (CSA) in response to adeno-OSM (Figures 3B and 3C). An increase in the frequency of fibers with a small CSA was detected (Figures 3D and S6G). OSM overexpression did not change the composition of muscle fiber types, all of which were prone to OSM-induced atrophy (Figures S6H and S6I). The overexpression of OSM in muscle tissue induced mRNA levels of Osmr, and the atrophy-related genes Atrogin1, Ampd3, Cebpd, Igfbp3, Sln, Mt1, Mt2, and Serpina3n without affecting the expression of Il6 (Figures 3E and S6J). OSM overexpression also increased total protein levels of Atrogin1, MURF1, STAT1, STAT3, and STAT5 in muscle tissue (Figures 3F and 3G). However, the phosphorylation of only STAT3 was stimulated by OSM relative to the total protein levels (Figures 3F and 3G). These results argue that activation of OSM/OSMR signaling is able to promote atrophy in muscle tissue in vivo.
Figure 3.

OSM overexpression causes muscle atrophy in mice
TA muscles of C57BL/6 mice were transduced with LacZ or OSM expressing adenoviruses. Mice were sacrificed 7 days later (n = 6 for each group).
(A and B)Tissues were weighed (A) and H&E stained (B). Scale bar, 100 μm.
(C and D) Muscle fiber CSA (C) and the fiber frequency distribution were determined (D) (n = 3 for each group).
(E–G) Changes in gene expression were determined by RT-qPCR (n = 6 for each group) (E). Protein levels were tested by western blotting. Asterisk indicates nonspecific band (F). Band intensities were quantified (G) (n = 6 for each group).
Data are presented as individual measurements (points) and mean ± SEM. Statistical analysis was conducted using 2-tailed t test.
Muscle-specific depletion of OSMR protects from muscle loss
We next investigated the contribution of the OSM signaling to tumor-induced muscle wasting using muscle-specific OSMR-deficient mice. Although OSMR also functions as a co-receptor for IL-31,24 the lack of IL-31 receptor A (IL-31RA) expression in muscle tissue indicates that primarily OSM function was hindered in these mice. We inoculated these mice with B16 tumors and investigated cachexia phenotypes. Tumor growth was comparable between wild-type (WT) and KO mice, both of which also lost adipose tissue mass (Figures S7A and S7B). However, whereas WT mice experienced tumor-induced muscle wasting evidenced by reductions in the weight of gastrocnemius and TA muscles, OSMR-deficient mice were protected (Figure 4A). The latter group also exhibited significantly improved muscle strength assessed by forelimb grip strength and inverted screen hang tests (Figures 4B and 4C). The examination of the histology of gastrocnemius and TA muscles by H&E staining showed a reduction in average muscle fiber CSA and an enrichment in fibers with a small CSA (Figures 4D–4F and S7C–S7G). The analysis of the composition of muscle fiber types indicated that tumor growth did not lead to a significant change. However, there was a trend toward a reduction in type IIb fiber frequency and an increase in type IIx and type IIa fibers in gastrocnemius and TA muscles of OSMR-deficient mice (Figures S7H and S7I). The CSA of type IIb and type IIx fibers in these muscles was significantly reduced in WT mice upon tumor inoculation, whereas this effect was blocked in OSMR-deficient mice (Figures S7J and S7K). In muscles of WT mice, tumor inoculation increased the abundance of Atrogin1 and MURF1 proteins and the phosphorylation of STAT3. These changes were attenuated in the KO mice (Figures 4G and 4H). Previously, we reported that OSMR depletion in muscle tissue preserved muscle mass and strength in LLC tumor-bearing mice.18 Collectively, our findings indicate that the OSM/OSMR signaling in muscle tissue contributes to the tumor-induced activation of JAK/STAT3 and muscle atrophy pathways.
Figure 4.

Muscle-specific depletion of OSMR protects from muscle loss
Mice inoculated with B16 cells were sacrificed 14 days later (n = 5 for the KO group and n = 7 for other groups).
(A–C) Muscle tissues were weighed (A). Forelimb grip strength (B) and inverted screen hanging performance (C) were measured before the sacrifice (n = 6 for the WT group, n = 5 for the KO group, and n = 7 for other groups).
(D–F) Gastrocnemius muscle cross-sections were H&E stained (D), and CSA (E) and the fiber frequency distribution (F) were measured (n = 4 for each group). Scale bar, 100 μm.
(G and H) Protein levels were tested by western blotting (G), and the band intensities were quantified (H) (n = 3 for each group).
Data are presented as individual measurements (points) and mean ± SEM. Statistical analysis was conducted using 2-way ANOVA with Tukey’s post hoc test.
Neutralization of OSM ameliorates tumor-driven muscle wasting
To investigate the therapeutic potential of targeting OSM signaling to prevent cachexia-linked muscle wasting, we used a neutralizing anti-OSM antibody. When treated to primary myotubes along with the recombinant OSM protein, the anti-OSM antibody prevented the upregulation of OSM target genes (Figure 5A). After documenting its neutralizing effect, we administered the anti-OSM antibody to LLC-tumor bearing mice. A nontumor-bearing group and a control tumor-bearing group received an isotype control immunoglobulin G (IgG) antibody. The antibody treatment was performed 10, 12, 14, and 15 days posttumor inoculation and mice were sacrificed 1 day after the last injection (Figure 5B). The anti-OSM antibody did not affect the size of LLC tumors (Figure 5C) and exerted a limited impact on the wasting of adipose tissues (Figure S8A). Remarkably, the muscle mass of the tumor-bearing mice was preserved upon anti-OSM administration (Figure 5D), and these mice exhibited a trend toward improved forelimb grip strength (Figure 5E). H&E staining of gastrocnemius muscle sections also demonstrated increased muscle fiber CSA in the anti-OSM group compared with the IgG group of the tumor-bearing mice (Figures 5F and 5G). Tumor-driven increase in the frequency of muscle fibers with a small CSA was suppressed upon anti-OSM administration (Figures 5H and S8B). The neutralization of OSM led to a significant reduction in the phosphorylation of STAT3 and the accumulation MURF1, and a trend for reduced Atrogin1 was also detected (Figures 5I and 5J). These findings indicate that OSM plays a direct role in tumor-induced muscle wasting and the blockade of OSM activity can be used to ameliorate cachexia-associated muscle loss.
Figure 5.

Neutralization of OSM ameliorates tumor-induced muscle wasting
(A) Mouse primary myotubes were treated with recombinant OSM (250 ng/mL) and IgG or anti-OSM antibodies (10 μg/mL) for 48 h. Changes in gene expression were determined by RT-qPCR (n = 3 for each group).
(B–E) Mice inoculated with LLC cells received IgG or anti-OSM antibody injections and were sacrificed 16 days posttumor inoculation. Tumor (C) and muscle tissues (D) were weighed. Forelimb grip strength was measured before the sacrifice (n = 7 for each group) (E).
(F–H) Gastrocnemius muscle cross-sections were H&E stained (G), CSA (F), and the fiber frequency distribution (H) were measured (n = 3 for each group). Scale bar, 100 μm.
(I and J) Gastrocnemius muscle protein levels were determined by western blotting. Asterisk indicates the nonspecific band (I). Band intensities were quantified (J) (n = 3 for each group).
(K and L) OSMR expression values of normal subjects and PDAC patients were analyzed by GEO2R (GSE130563) (n = 16 for noncancer controls, n = 5 for noncachectic PDAC patients, and n = 17 for cachectic PDAC patients) (K). GSEA of the top 200 OSM target genes was performed by comparing cachectic PDAC patients with noncancer controls and noncachectic PDAC patients (GEO: GSE130563) (L).
Data are presented as individual measurements (points) and mean ± SEM. Statistical analysis was conducted using 1-way ANOVA with Tukey’s post hoc test (A, C–F, H, and J) and GEO2R with adjustments for multiple tests (K and L).
Previously, high plasma levels of OSM were detected in tumor-bearing cachectic mice.18,21 However, OSM expression in these tumors is very low. Persistent activation of the immune system may also lead to the systemic accumulation of OSM.15 We used LLC tumors to inoculate mice with severe combined immunodeficiency (SCID). Remarkably, OSM was undetectable in plasma samples of tumor-bearing SCID mice arguing that the immune system is likely the source of tumor-induced OSM. However, we also found that these mice exhibit dramatic adipose tissue loss accompanied by relatively milder muscle wasting (Figures S8C and S8D). These results argue that cancer-associated cachexia in immunodeficient mice likely involves additional molecular mechanisms driving the atrophy of adipose and muscle tissues.
OSM target genes are upregulated in muscles of cancer and muscular dystrophy patients
We examined whether the activation of OSM/OSMR signaling is linked to muscle loss in humans. We analyzed publicly available human gene expression datasets and tested transcript levels of OSM target genes. Our analysis revealed upregulated OSMR expression in muscle biopsies of weight-losing pancreatic ductal adenocarcinoma (PDAC) patients. Gene expression profiles of rectus abdominis muscle biopsies from 17 cachectic PDAC patients, 5 noncachectic PDAC patients, and 16 noncancer controls were compared by Judge et al. using microarrays.25 Analysis of this dataset revealed upregulated OSMR expression in cachectic patients compared to noncachectic and noncancer controls, whereas OSM expression was unchanged (Figure 5K). We further analyzed this dataset to determine whether the expression of the gene targets of OSM/OSMR signaling correlates with OSMR transcript levels. We compiled the top 200 genes significantly upregulated by OSM in primary myotubes and performed gene set enrichment analysis (GSEA) using this gene list. Annotated genes with known human orthologs were chosen (Table S1). GSEA analysis of the datasets revealed that OSM target genes were significantly overrepresented in muscle biopsies of cachectic PDAC patients (GEO: GSE130563; normalized enrichment score [NES] = 2.17, p < 0.001) (Figure 5L).
Our gene expression analysis also revealed significantly increased OSMR transcript levels in muscular dystrophy diseases, including Duchenne muscular dystrophy (DMD) and facioscapulohumeral muscular dystrophy (FSHD). In a study by Dadgar et al., 49 muscle biopsies from patients with DMD, Becker muscular dystrophy (BMD) and limb girdle muscular dystrophy (LGMD) were investigated.26 Analysis of this dataset (GEO: GSE109178) indicated that OSMR transcript was upregulated in patients with DMD (n = 17, fold change = 4.0, padj < 0.0000009), BMD (n = 11, fold change = 3.1, padj < 0.0022) and dysferlin-deficient LGMD2B (n = 8, fold change = 4.5, padj < 0.009) compared to normal subjects (n = 6) (Figure S9A). The same research group also reported comparative profiling of 117 muscle biopsies from 13 different muscle disease groups. Analysis of the dataset (GEO: GSE3307) showed OSMR upregulation in patients with DMD (n = 10, fold change = 2.3, padj < 0.000014), BMD (n = 5, fold change = 2.2, padj < 0.018), acute quadriplegic myopathy (n = 5, fold change = 2.4, padj < 0.0019), FSHD (n = 14, fold change = 1.6, padj < 0.008), juvenile dermatomyositis (JDM) (n = 21, fold change = 2.2, padj < 0.0007), calpain3-deficient LGMD2A (n = 10, fold change = 2.0, padj < 0.0007), dysferlin-deficient LGMD2B (n = 11, fold change = 2.7, padj < 0.0007), and fukutin-related protein-deficient LGMD2I (n = 7, fold change = 1.7, padj < 0.05) compared to normal subjects (n = 18) (Figure S9B; Table S2). In addition, analysis of gene expression profiles of muscle biopsies from 10 DMD patients and 10 unaffected subjects studied by Haslett et al. (GEO: GSE1007)27 revealed a 2.4-fold increase in OSMR levels in DMD patients (padj < 0.0002) (Figure S9C). Lastly, we analyzed the dataset generated by Wang et al., who collected MRI-informed muscle biopsies from FSHD patients and investigated the expression of target genes of double homeobox 4 (DUX4), whose aberrant expression in muscle is linked to this disease.28 Nine control subjects and 36 individuals with FSHD were included in this study, and patients were grouped based on expression levels of selected biomarkers. Groups 1 through 4 reflected higher DUX4 target gene expression and disease severity in ascending order, with group 4 exhibiting the highest pathology scores.28 Our analysis of the dataset (GEO: GSE115650) revealed increased OSMR expression in all of the groups, with the highest levels observed in group 4. OSMR was upregulated by 3.5-fold (padj < 0.000032) in all FSHD samples combined (Figure S9D). A 1-year follow-up assessment of muscle biopsies was published for the same patients (GEO: GSE140261) in which OSMR transcript levels remained elevated (n = 27, fold change = 3.1, padj < 0.00000022) (Figure S9E).29
Finally, we also tested whether the OSM target genes are upregulated in muscular dystrophies. We performed GSEA analysis using the top 200 genes upregulated by OSM. Our analysis determined that OSM target genes were significantly enriched in muscle biopsies of patients with DMD (GEO: GSE1007, NES = 1.57, p < 0.001) (Figure S9F), and FSHD (GEO: GSE115650, NES = 2.62, p < 0.001 [Figure S9G] and GEO: GSE140261, NES = 2.6, p < 0.001 [Figure S9H]). In fact, our analysis showed that the OSM target gene set is also significantly enriched in other muscular dystrophies as well, including BMD, JDM, and LGMD, in which high OSMR levels were detected (Table S2). Elevated levels of OSMR transcript and the enrichment of OSM target genes in muscular dystrophies implicate the activation of the OSM/OSMR pathway in these diseases.
Discussion
In this study, we investigated the role of OSM/OSMR signaling in skeletal muscle atrophy. Our findings revealed that activation of this pathway promotes atrophy in cultured primary myotubes and in muscle tissue, and the neutralization of OSM protects from tumor-induced muscle wasting. OSM is a member of the IL-6 family of cytokines. IL-6 and LIF from the same family were previously described to stimulate muscle atrophy. Elevated IL-6 serum levels were detected in different experimental models of cancer cachexia19,30 and also in cancer patients exhibiting weight loss.31 JAK/STAT3 pathway activation and muscle wasting in the presence of IL-6 were reported.19 The use of IL-6 receptor antibodies preserved muscle mass in IL-6 transgenic mice, mice inoculated with IL-6-overexpressing LLC cells, and in other cachexia tumor models.32,33,34,35,36 Previous reports also demonstrated that LIF is secreted by cachexia-inducing C26 colon carcinoma cells, and it activates the JAK/STAT3 signaling to promote atrophy in C2C12 myotubes.37 Tumor-driven LIF expression in muscle tissue was also linked to the atrophy process.38 Previously, OSM was shown to inhibit the myogenic differentiation of C2C12 cells.39 A relevant study also reported that OSM treatment induces atrophy in C2C12 myotubes in a STAT3-dependent manner.40 Our previous work also identified OSM as an atrophy-inducing factor in primary myotubes. OSM, together with EDA-A2, additively promoted cellular atrophy and the expression of atrophy-related genes in primary myotubes.18 Here, we found that OSM is more potent in inducing cellular atrophy compared to IL-6 and LIF. In accordance, OSM elicited more pronounced effects on the expression of atrophy-related genes in these cells. Adenoviral overexpression of OSM in skeletal muscle tissue also stimulated atrophy and the expression of genes related to this process. A recent study also described muscle loss upon adeno-associated virus-mediated OSM overexpression in mice.41 Our findings demonstrate that OSM promotes muscle atrophy both in vitro and in vivo.
Our results indicated that similar to IL-6 and LIF, OSM uses the JAK/STAT3 signaling to render its atrophic effect. STAT3 activation has been described in the atrophying muscle tissue of tumor-bearing mice. Muscle-specific STAT3 KO mice were reported to be resistant to muscle wasting, arguing a central role for STAT3 in muscle loss.19,22 We found that OSM treatment of primary myotubes induces the phosphorylation of not only STAT3 but also STAT1 and STAT5. However, inhibition of STAT3 activity alone was sufficient to block OSM-driven changes in myotube diameter and atrophy-related gene expression. In fact, OSM overexpression in TA muscles of mice increased the phosphorylation of STAT3 only. Similarly, robust STAT3 activation was observed in muscles of tumor-bearing mice. STAT3-dependent transcriptional regulation of muscle atrophy-related genes, including Atrogin1, Mt1, Mt2, and Serpina3n, was previously described.22,42,43 Our findings implied that OSM-induced muscle loss involves the JAK/STAT3 signaling, which likely drives the expression of the atrophy genes.
Here, we analyzed global gene expression profiles of primary myotubes by RNA sequencing and determined OSM target genes. In line with a previous report, we found that OSM regulated mRNA levels of Atrogin1 but not MuRF1 in muscle cells.40 However, OSM overexpression in muscle tissue significantly increased the protein expression of both genes. Our analysis identified additional atrophy-related genes as transcriptional targets of the OSM pathway, such as Serpina3n, Ampd3, Mt1, Mt2, Sln, Igfbp3, and Cepbd. Serpina3n encodes a serine protease inhibitor, which is upregulated in injured muscle.44 Serpina3n expression in muscle was significantly increased in glucocorticoid-induced muscle atrophy and in C26 tumor-inoculated cachectic mice.45,46 Serpina3n was proposed as a circulating biomarker of muscle atrophy.45 In fact, we found that Serpina3n is one of the top gene targets of the OSM pathway in myotubes. Ampd3 controls the adenine nucleotide content to ATP ratio and plays an important role in balancing muscle metabolism.47 Ampd3 levels were upregulated in muscles undergoing atrophy.48,49,50 Its overexpression in C2C12 cells or TA muscles of mice was shown to mimic metabolic changes that occur during muscle atrophy.51 Metallothioneins Mt1 and Mt2 encode metal-binding small ubiquitous proteins that have protective effects during oxidative stress.52 Mt1 and Mt2 expression levels are upregulated in human and murine muscles undergoing atrophy.50,53,54 MT1/2-deleted muscles exhibit improved muscle mass and strength.55 Sln (sarcolipin) encodes a micropeptide that regulates the activity of sarcoplasmic reticulum Ca2+-ATPase pumps. Sln expression is upregulated in several myopathies, including DMD.56 Knockdown of Sln ameliorated muscle physiology and survival in a mouse model of DMD.57 Igfbp3 encodes an insulin growth factor (IGF)-binding protein, which was shown to suppress IGF signaling and promote atrophy in C2C12 myotubes.58 Increased Igfbp3 levels were detected in the muscles of tumor-bearing mice.59 Cebpd (CAAT/enhancer-binding protein δ) expression was induced in atrophying muscles of glucocorticoid-treated and tumor-bearing mice.60,61 STAT3-induced Cebpd activity was shown to promote Myostatin and Atrogin1 expression in muscle and Cebpd deletion in mice protected from tumor-induced muscle wasting.22,62 Our results indicated that the transcription of these atrophy-related genes is regulated by OSM in a JAK/STAT3-dependent manner. Further investigation is needed to assess the potential contribution of these target genes to OSM-induced muscle atrophy.
Evidence supporting the role of OSM in cancer cachexia comes from tumor inoculation studies using muscle-specific OSMR-KO mice.18 Upon tumor growth, these mice exhibited reduced muscle wasting and improved muscle strength compared to their WT controls. Expression of muscle atrophy-related genes, including Atrogin1, MuRF1, and Eda2r, was reduced in muscles of tumor-bearing OSMR-deficient mice.18 The result presented here corroborates these findings and highlights the therapeutic potential of blocking the OSM/OSMR signaling. The neutralization of tumor-induced OSM using a specific antibody phenocopied the OSMR deficiency in mice. Our results indicated that OSM blockade in tumor-bearing mice attenuates muscle atrophy, accompanied by reduced expression of atrophy genes in muscle tissue. However, we found that the improvement in muscle mass in response to OSM neutralization does not fully recover the grip strength of mice. A similar disconnect in improving muscle mass and function has been described in various clinical trials testing drugs in cachectic cancer patients.63 It is likely that additional interventions, such as nutritional supplementation and self-exercise, are needed to restore physical strength.
Previously, IL-6 was reported as the main inflammatory mediator driving muscle wasting during cancer cachexia. However, anti-IL-6 therapies did not satisfactorily prevent muscle wasting in cancer patients.11,12 A previous tumor inoculation study using IL-6 receptor KO mice showed the preservation of fat mass without an effect on muscle wasting.64 Our results argue that OSMR protein is necessary for tumor-driven muscle loss, and the inhibition of OSM/OSMR signaling may be useful in preventing cancer cachexia. Future studies should use neutralizing antibodies against human OSM/OSMR to establish a clinical benefit. We detected elevated transcript levels of OSMR and other OSM targets in muscle biopsies of PDAC patients exhibiting cachexia. The patient groups that would benefit most from an OSM/OSMR therapy should be determined by testing for elevated OSM levels in plasma samples. It should also be noted that OSM/OSMR activity was associated with muscle regeneration, and therefore, this pathway may have a dual role in muscle physiology.65,66 Mouse OSM is generally accepted to act through the OSMR/GP130 complex, and there are reports that it may also use LIF receptor (LIFR) in certain cell types.67 However, human OSM has been characterized to signal through both OSMR and LIFR.13 Therefore, targeting of OSMR alone may not be sufficient to silence OSM signaling in cancer patients, whereas the blocking of GP130 may elicit additional benefits of the concomitant suppression of OSM, IL-6, and LIF pathways. In fact, the relative expression of OSM, IL-6, and LIF in tumors or their induction in immune cells can vary, and the contribution of these cytokines to muscle wasting will depend on their production levels and systemic availability. A therapeutic approach targeting all IL-6 family cytokines simultaneously will likely yield more effective clinical outcomes.
Lastly, our analysis of publicly available gene expression datasets showed that OSMR transcript levels were significantly upregulated and OSM target genes were significantly enriched in muscle biopsies of patients with muscular dystrophies, such as DMD and FSHD. These results hinted at the activation of OSM/OSMR signaling in these muscle samples. In fact, inflammatory response has been indicated to play a central role in the progression of muscular dystrophies.68,69 Therefore, it is tempting to ask whether OSM functions as an inflammatory mediator involved in the development of muscle weakness and damage in muscular dystrophies. Further studies using animal models and testing protein-level changes in patient samples are required to establish a role for the OSM/OSMR pathway in muscle loss associated with these diseases.
Limitations of the study
We used forelimb grip force and inverted screen hanging time measurements to assess the physical strength of cachectic mice. However, in situ muscle force measurements lacking in this study would be a more direct way of evaluating muscle strength. OSM was not detected in plasma samples of tumor-bearing immunodeficient mice, indicating that the major source of circulating OSM must be the immune system. However, the type of cells that produce OSM in response to tumor growth remains to be determined. Additional studies are needed to identify the exact source of this cytokine. OSM target genes, including OSMR, were found to be elevated in muscle biopsies of patients with PDAC and muscular dystrophies. It was not possible to test how plasma OSM levels change in these patients because these samples were not available to us. Future clinical studies should measure circulating OSM and its correlation with muscle wasting and other disease outcomes.
STAR★Methods
Key resources table
| REAGENT or RESOURCE | SOURCE | IDENTIFIER |
|---|---|---|
| Antibodies | ||
| Goat anti-mouse OSM antibody | R&D Systems | Cat# AF-495-NA; RRID:AB_354507 |
| Goat IgG antibody | R&D Systems | Cat# AB-108-C; RRID:AB_354267 |
| Stat1 Antibody | Cell Signaling | Cat# 9172; RRID:AB_2198300 |
| Phospho-Stat1 (Tyr701) (D4A7) Rabbit mAb | Cell Signaling | Cat# 7649; RRID:AB_10950970 |
| Stat3 (124H6) Mouse mAb | Cell Signaling | Cat# 9139; RRID:AB_331757 |
| phospho-Stat3-Tyr705 | Cell Signaling | Cat# 9145; RRID:AB_2491009 |
| Stat5 | Cell Signaling | Cat# 94205T; RRID:AB_2737403 |
| phospho-Stat5-Tyr694 | Cell Signaling | Cat# 4322T; RRID:AB_2315225 |
| Jak2 (D2E12) XP Rabbit mAb | Cell Signaling | Cat# 3230; RRID:AB_2128522 |
| Phospho-Jak2 (Tyr1008) (D4A8) Rabbit mAb | Cell Signaling | Cat# 8082; RRID:AB_10949104 |
| β-Actin (8H10D10) Mouse mAb | Cell Signaling | Cat# 3700; RRID:AB_2242334 |
| NF-κB p65 (D14E12) XP Rabbit mAb | Cell Signaling | Cat# 8242; RRID:AB_10859369 |
| Phospho-NF-κB p65 (Ser536) (93H1) Rabbit mAb | Cell Signaling | Cat# 3033; RRID:AB_331284 |
| NF-κB1 p105/p50 (D7H5M) Rabbit Antibody | Cell Signaling | Cat# 12540; RRID:AB_2687614 |
| Phospho-NF-kappa-B p105 (Ser933) (18E6) Rabbit mAb | Cell Signaling | Cat# 4806; RRID:AB_2282911 |
| NF-κB2 p100/p52 Antibody | Cell Signaling | Cat# 4882; RRID:AB_10695537 |
| IκBα (L35A5) Mouse mAb | Cell Signaling | Cat# 4814; RRID:AB_390781 |
| Phospho-IκBα (Ser32) (14D4) Rabbit mAb | Cell Signaling | Cat# 2859; RRID:AB_561111 |
| Atrogin-1 | ECM Bioscience | Cat# AP2041; RRID:AB_2246979 |
| MuRF1 | ECM Bioscience | Cat# MP3401; RRID:AB_2208832 |
| MyHC antibody | DSHB | Cat# MF20; RRID:AB_2147781 |
| Myosin Heavy Chain Type IIA Antibody (SC-71) | DSHB | Cat#AB_2147165; RRID:AB_2147165 |
| Myosin Heavy Chain Type IIB Antibody (BF-F3) | DSHB | AB_2266724; RRID:AB_2266724 |
| Myosin Heavy Chain Type IIX Antibody (6H1) | DSHB | Cat#AB_2314830; RRID:AB_1157897 |
| Myosin Heavy Chain Type I Antibody (BA-F8) | DSHB | Cat#AB_10572253; RRID:AB_10572253 |
| IRDye 680RD Goat anti-Mouse IgG | LI-COR Biosciences | Cat# 926–68070; RRID:AB_10956588 |
| IRDye 800CW Goat anti-Rabbit IgG | LI-COR Biosciences | Cat# 926–32211, RRID:AB_621843 |
| Goat Anti-Mouse IgG H&L (Alexa Fluor® 594) | Abcam | Cat# ab150116, RRID:AB_2650601 |
| Goat Anti-Mouse IgM mu chain (Alexa Fluor® 488) | Abcam | Cat#: ab150121; RRID:AB_2801490 |
| Ubiquitin Antibody | Cell Signaling | Cat# 3933; RRID:AB_2180538 |
| Anti-mouse IgG, HRP-linked Antibody | Cell Signaling | Cat #7076; RRID: AB_330924 |
| Anti-rabbit IgG, HRP-linked Antibody | Cell Signaling | Cat#7074; RRID:AB_2099233 |
| Bacterial and virus strains | ||
| pAd/CMV/V5-DEST OSM | This paper | N/A |
| pAd/CMV/V5-DEST LacZ | This paper | N/A |
| Chemicals, peptides, and recombinant proteins | ||
| Qiazol reagent | Qiagen | Cat# 79306 |
| Recombinant Mouse Oncostatin M (OSM) Protein | R&D Systems | Cat# 495-MO |
| Recombinant Mouse IL-6 Protein | R&D Systems | Cat# 406-ML |
| Recombinant Mouse LIF Protein | R&D Systems | Cat#8878-LF |
| Ruxolitinib, ATP-competitive JAK1/2 inhibitor | Abcam | Cat#ab141356 |
| MG132 | Sigma | Cat# M8699 |
| Trametinib (GSK1120212) | Selleckchem | Cat# S2673 |
| DAPI (hydrochloride) | Cayman | Cat# 14285 |
| iTaq Universal SYBR Green Supermix | Bio-Rad | Cat#172-5120 |
| Lipofectamine™ 2000 Transfection Reagent | Invitrogen | Cat#11668500 |
| Critical commercial assays | ||
| Virapower Adenoviral expression system | Invitrogen | Cat#K4930-00 |
| Adeno-X™ Maxi Purification Kit | Clontech | Cat#631532 |
| Adeno-X™ Rapid Titer Kit | Clontech | Cat#631028 |
| Mouse Oncostatin M (OSM) Quantikine ELISA Kit | R&D Systems | Cat#MSM00 |
| Direct-zol RNA MiniPrep kit | Zymo Research | Cat#R2052 |
| EcoPURE Total RNA Kit | EcoTech | Cat#E2075 |
| Deposited data | ||
| Raw and processed data | This paper | GEO: GSE222208 |
| Processed data | Judge et al.25 | GEO: GSE130563 |
| Processed data | Dadgar et al.26 | GEO: GSE3307 |
| Processed data | Dadgar et al.26 | GEO: GSE109178 |
| Processed data | Haslett et al.27 | GEO: GSE1007 |
| Processed data | Wang et al.28 | GEO: GSE115650 |
| Processed data | Wong et al.29 | GEO: GSE140261 |
| Experimental models: Cell lines | ||
| Mouse primary myoblasts | This paper | N/A |
| Lewis Lung Carcinoma (LLC) | ATCC | Cat#CRL-1642 |
| B16 (B16-F10) melanoma | ATCC | Cat#CRL-6475 |
| Experimental models: Organisms/strains | ||
| Mouse: B6; 129-Osmrtm1.1Nat/J | The Jackson Laboratory | Strain#011081; RRID:IMSR_JAX:011081 |
| Mouse: B6.Cg-Tg(ACTA1-cre)79Jme/J | The Jackson Laboratory | Strain#006149; RRID:IMSR_JAX:006149 |
| Mouse: C57BL/6 | Koc University Animal Research Facility | N/A |
| Mouse: NOD-SCID (NOD.Cg-Prkdcscid/J) | The Jackson Laboratory | Strain#001303; RRID:IMSR_JAX:001303 |
| Oligonucleotides | ||
| Primers for RT-QPCR | This paper | See Table S3 for details |
| Recombinant DNA | ||
| Mouse STAT3-Y705F plasmid | Prof. Gerhard Müller-Newen (RWTH Aachen University) | N/A |
| Osm (NM_001013365) Mouse Tagged ORF Clone | Origene | Cat#: MR226014 |
| Software and algorithms | ||
| GraphPad Prism 8.0 | GraphPad | https://www.graphpad.com/ |
| ImageJ | NIH | https://imagej.net/ij/index.html |
| Adobe Illustrator 2023 | Adobe | https://www.adobe.com/products/illustrator.html |
| GSEA (v4.1.0) | UC San Diego and Broad Institute | https://www.gsea-msigdb.org/ |
| FastQC (v.0.11.9) | Babraham Bioinformatics | https://www.bioinformatics.babraham.ac.uk/projects/fastqc/ |
| MultiQC (v1.12) | https://doi.org/10.1093/bioinformatics/btw354 | https://multiqc.info/ |
| trimGalore (v0.6.5) | Babraham Bioinformatics | https://www.bioinformatics.babraham.ac.uk/projects/trim_galore/ |
| STAR (v2.7.3a) | https://doi.org/10.1093/bioinformatics/bts635 | https://github.com/alexdobin/STAR |
| qualimap (v.2.2.1) | https://doi.org/10.1093/bioinformatics/bts503 | http://qualimap.conesalab.org/ |
| HTSeq (v0.11.1) | https://doi.org/10.1093/bioinformatics/btac166 | https://htseq.readthedocs.io/ |
| R Studio (v2021.09.2 + 382) | Posit Software | https://posit.co/products/open-source/rstudio/ |
| DESeq2 (v1.34.0) | https://doi.org/10.1186/s13059-014-0550-8 | https://bioconductor.org/packages/release/bioc/html/DESeq2.html |
Resource availability
Lead contact
Further information and requests for resources and reagents should be directed to and will be fulfilled by the lead contact, Serkan Kir (skir@ku.edu.tr).
Materials availability
All reagents generated in this study are available from the lead contact with a completed Materials Transfer Agreement.
Data and code availability
-
•
RNA sequencing data generated in this study are available in the GEO database with accession number GSE222208. Human gene expression datasets analyzed here are also available in the GEO database; GSE130563,25 GSE1007,27 GSE109178,26 GSE115650,28 GSE140261,29 and GSE3307.26
-
•
This paper does not report original code.
-
•
Any additional information required to reanalyze the data reported in this paper is available from the lead contact upon request.
Experimental model and study participant details
Mice
All experimental procedures were conducted in the Koc University Animal Research Facility in accordance with institutional policies and animal care ethics guidelines. 8-12-week-old male mice were used in all experiments unless otherwise stated. Mice were housed in 12-h light/dark cycles (7a.m.-7p.m.) and provided ad libitum access to standard rodent chow diet and water. All mice were maintained on a pure C57BL/6 background. Immunodeficient Prkdcscid mice were obtained from Jackson laboratory (strain #001303). Muscle-specific OSMR-knockout mice were generated by crossing OSMR-floxed (strain #011081) and ACTA1-Cre mice (strain #006149) purchased from Jackson laboratory. Plasma OSM levels were measured using a mouse Oncostatin M (OSM) ELISA Kit (R&D Systems, MSM00). All animal protocols were approved by the Institutional Animal Care and Use Committee of Koc University.
Cell lines and primary myoblast culture
Lewis lung carcinoma (LLC) and B16 (B16-F10) melanoma cells were cultured in DMEM medium (Sigma; 5796) with 10% fetal bovine serum (FBS) and penicillin-streptomycin (Invitrogen). B16 cells were also supplemented with freshly added 2 mM L-glutamine (Invitrogen). Mouse primary myoblasts were isolated from limb muscles of pups (2–3 days old) as described previously.70 Cells were cultured in Ham’s F-10 nutrient mixture (Invitrogen) with 20% FBS (Invitrogen) supplemented with 2.5 ng/mL basic fibroblast growth factor (bFGF) (Sigma) and penicillin/streptomycin (Invitrogen). Myoblasts were then transferred to DMEM (Sigma 5796) supplemented with 5% horse serum and penicillin/streptomycin (Invitrogen) for differentiation. All myotube experiments were repeated at least three times using different batches of myoblast cells and representative results were reported. In all experiments, myotubes were harvested 72 h after the initiation of differentiation. Recombinant proteins were administered to the cells for the indicated durations before the harvest. Adeno-GFP was added to the cells at the start of differentiation for fluorescent myotube imaging performed using a live cell imager (Zeiss Axiolab live-cell imager). The diameters of individual myotubes were measured using ImageJ software. Treatments with other adenoviruses were performed 24 h after differentiation.
Method details
Tumor inoculation and antibody administration
Mice were randomly assigned into groups while satisfying the criteria that the average body weight in each group is similar. All mice used in tumor inoculation experiments were from C57BL/6 background. LLC (5 × 10⁶ per mouse) and B16 (2.5 × 10⁶ per mouse) cells were injected subcutaneously over the flank. Non-tumor-bearing control mice received the vehicle (PBS) only. Mice were housed individually in all tumor inoculation experiments. In antibody administration experiments, mice were injected intraperitoneally with control IgG (AB-108-C) or anti-OSM (AF-495-NA) antibodies (1 mg/kg) for 4 times; 10, 12, 14 and 15 days post-tumor inoculation. Mice were sacrificed 16 days after tumor inoculation. Gastrocnemius and TA muscles and tumors were dissected and weighed using an analytical balance.
Grip strength and inverted screen tests
Forelimb grip forces were measured on the same day as sacrifice using grip strength meter (Ugo Basile grip strength meter). Each mouse was held from its tail and allowed to grab a bar attached to a force transducer while being pulled horizontally away from the bar. The peak force applied before releasing the bar was registered from at least 3 repetitions and averaged to determine the grip strength of each mouse. Kondziela’s inverted screen test was performed the day before the sacrifice. Mice were placed in the center of a wire mesh screen, which was rotated upside down. The screen was kept at 60cm above a cushioned surface. The hanging time was restricted between 1 and 10 min. For mice that hung shorter than a minute, the inverted screen test was attempted again after a resting interval.
Tissue histology and immunostaining
Muscle tissues were frozen in liquid nitrogen-cooled isopentane for 15–20 s. Frozen tissues were embedded in cryomolds in Tissue-Tek OCT freezing medium (Sakura). 7 μm thick sections were cut using a cryostat (Leica) and collected on Superfrost Plus slides (Thermo). For hematoxylin & eosin staining, sections were fixed with 4% paraformaldehyde and treated with hematoxylin (Merck 105174), 0.1% HCl, eosin (Merck 109844), 70–100% ethanol gradient and xylene (Isolab), respectively. The muscle fiber cross-sectional area was assessed using ImageJ software. For immunostaining, sections were incubated in a blocking solution (3% BSA, 0.1% Triton X- and 5% horse serum) for 1 h at room temperature and then overnight at +4°C with primary antibodies (Type IIa fibers, SC-71, DSHB; Type IIb fibers, BF-F3, DSHB; Type IIx fibers, 6H-1, DSHB; Type I fibers, BA-F8, DSHB). Tissue sections were washed three times with PBS and then incubated for 1h in the blocking solution with secondary antibodies (goat anti-mouse IgM H&L Alexa Fluor 488 (ab150121, Abcam) and goat anti-mouse IgG H&L Alexa Fluor 594 (ab150116, Abcam)). Sections were washed three times with PBS and mounted using a homemade mounting medium and visualized under fluorescence microscopy (Zeiss). The fiber-type number and cross-sectional area were measured using ImageJ.
Adenovirus production and injection
Adenovirus vectors were generated using the Virapower Adenoviral expression system (Invitrogen). Open reading frames of Osm and Stat3-Y705F following a CACC sequence were cloned into a pENTR-D-TOPO plasmid and then recombined into the pAd-CMV-DEST adenoviral plasmid using LR clonase II. LacZ adenoviral plasmid was provided in the kit. After digestion with PacI (Thermo), adenoviral plasmids were transfected into 293A cells using Lipofectamine 2000 (Invitrogen). 293A cells were cultured in DMEM (Sigma 5796), 10% FBS (Invitrogen) and penicillin/streptomycin (Invitrogen). Adenoviral particles were collected from cell culture supernatant following the manufacturer’s instructions. Adeno-X Maxi Purification Kit and Adeno-X Rapid Titer Kit from Clontech were used for purification and titration, respectively. Mice were injected unilaterally with 5x10⁸ infectious units of Adeno-OSM into the TA muscle while the contralateral muscle received the same dose of control Adeno-LacZ. Mice were sacrificed 7 days later.
Western blotting
Total protein from cells was isolated using lysis buffer containing 50 mM Tris (pH 7.5), 150 mM NaCl, 1% Triton X-100, 5 mM EDTA, 1 mM PMSF, supplemented with protease inhibitor tablets (Roche) and phosphatase inhibitors; 20 mM NaF, 10 mM β-glycerol phosphate, 10 mM Na4P2O7, 2 mM Na3VO4. A similar lysis buffer was used for tissue samples where 1% NP40 was used as the detergent and 10% glycerol was added. Tissues were homogenized using a Kinematica (PT1200E) homogenizer. The homogenates were centrifuged at 13,000 rpm for 10 min and the supernatants were used as lysates. Protein concentration was determined by Bio-Rad Protein assay. For each run, 30 μg of protein lysate was resolved in SDS-polyacrylamide gel and then blotted in a nitrocellulose membrane (Thermo). After blocking with 5% non-fat milk in Tris-buffered saline containing 0.05% Tween 20 (TBS-T), the membrane was blotted overnight with primary antibodies in TBS-T containing 5% BSA (Cell signaling antibodies; Stat1 (9172), phospho-Stat1-Tyr701 (7649), Stat3 (9139), phospho-Stat3-Tyr705 (9145), Stat5 (94205T), phospho-Stat5-Tyr694 (4322T), Jak2 (3230), phospho-Jak2-Tyr1008 (8082), β-actin (3700), p65-RelA (8242), phospho-p65-RelA-Ser536 (3033), p105/p50-NFκB (12540), phospho-p105-NFκB-Ser932 (4806), p100/p52-NFκB2 (4882), IκB (4814)phospho-IκB-Ser32 (2859), Ubiquitin (3933). ECM Bioscience antibodies; Atrogin1 (AP2041) and MURF1 (MP3401), and DSHB; MyHC antibody (MF20)). For secondary antibody incubation, TBS-T containing 5% milk was used (Cell signaling, anti-rabbit (7074) and anti-mouse (7076)). WesternBright blotting substrates from Advansta were used to visualize the results on a Chemidoc imaging system (Bio-rad). For blots visualized with a Licor Odyssey CLx imaging system, IRDye 680RD anti-mouse (926–68070) and IRDye 800CW anti-rabbit (926–32211) secondary antibodies were used. Blot images were quantified using ImageJ Software. Phosphorylated proteins were normalized to their respective total protein signals. Atrogin1 and MURF1 levels were normalized to β-actin signal.
Immunofluorescence
Primary myotubes were fixed with pre-cold methanol for 10 min at −20°C, incubated in a blocking solution (3% bovine serum albumin +0.1% Triton X-100 + 10% Horse serum) for 1 h at room temperature and then incubated with myosin heavy chain (MyHC) antibody (1:1000) (DSHB, MF20) in the blocking solution for 1 h at room temperature. Myotubes were washed with PBS and incubated with anti-mouse IgG H&L Alexa Fluor 594 secondary antibody (1:2000) (Abcam, ab150116) and DAPI (1:3000) (Cayman, 14285) in the blocking solution for 1 h at room temperature and then mounted using homemade mounting medium. Cells were visualized using fluorescence microscopy (Zeiss). MyHC signal was normalized to the number of myotube nuclei. Fields with similar density of myotubes were chosen.
RT-qPCR
Total RNA from cultured cells or tissue samples was extracted using Qiazol reagent (Qiagen) and purified with RNA spin columns (Ecotech). Tissues were homogenized using TissueLyzer LT (Qiagen). Complementary DNA synthesis was carried out with High-Capacity cDNA Reverse Transcription kit (Thermo). The resultant cDNA was analyzed by RT–qPCR using a CFX Connect instrument (Bio-Rad). In each reaction, 25 ng of cDNA and 150 nmol of each primer were mixed with iTaq Universal SYBR Green Supermix (Bio-Rad). Relative mRNA levels were calculated by the ΔΔCt method and normalized to cyclophilin or β-actin mRNA. Myod was used as the internal control in experiments involving adenovirus injection into TA muscles.
RNA sequencing
Differentiated mouse primary myotubes were treated with OSM, LIF or IL6 for 48 h (250 ng/mL each). Total RNA was isolated and DNase-treated using Qiazol reagent (Qiagen) and Direct-zol RNA MiniPrep kit (Zymo Research). Samples were prepared using Illumina TruSeq Stranded mRNA Library Prep Kit. Pair-end sequencing was performed using Illumina NovaSeq technology producing a total of 60 million (2 x 100bp) paired-end reads per sample. The quality check of the raw and trimmed data was performed with FastQC (v.0.11.9) and MultiQC (v1.12). Adaptor sequences and poor-quality sequences were removed with trimGalore (v0.6.5). Mouse genome index (GRCm39) was created with STAR (v2.7.3a) using genomeGenerate run mode. Trimmed sequences were mapped onto this index using STAR alignReads run mode. Quality check of alignments was performed with qualimap (v.2.2.1). Alignments were quantified using HTSeq-count (v0.11.1) Python package. Differential gene expression analysis was done with R Studio (v2021.09.2 + 382) and DESeq2 (v1.34.0) R package. Plots were visualized with ggplot2 (v3.3.5) and EnhancedVolcano (v.1.12.0) R packages. Gene set enrichment analysis results and plots were generated using GSEA (v4.1.0) software.
Human gene expression analysis
Gene expression profiles of skeletal muscle samples from PDAC patients, muscular dystrophy patients and normal subjects were accessed from Gene Expression Omnibus (GEO) database as normalized datasets. Microarray datasets (GSE130563, GSE1007, GSE109178 and GSE3307) were analyzed by GEO2R using default settings. RNA sequencing datasets (GSE115650 and GSE140261) were also accessed from the GEO database. Gene count normalization and fold change calculations were performed using the DEseq2 R package as described above. p values were adjusted for multiple testing. Gene set enrichment analysis was performed using GSEA (v4.1.0) software. Microarray data provided in multiple files (GSE1007 and GSE3307) were combined sample-wise to create a single dataset for GSEA analysis.
Quantification and statistical analysis
Values are expressed as mean ± SEM. Error bars (SEM) shown in all results were derived from biological replicates. Comparisons between two groups were evaluated using a two-tailed, unpaired t-test. Comparisons of more than two groups were performed using one-way or two-way ANOVA and corrected for multiple comparisons using Tukey’s post-hoc test.
Acknowledgments
We gratefully acknowledge the use of the Koc University Research Center for Translational Medicine animal facility infrastructure. We thank Prof. Gerhard Müller-Newen (RWTH Aachen University) for providing the mouse STAT3-Y705F plasmid. Also, we greatly appreciate Beril Esin for her support in the GEO database search. This work was supported by the EMBO installation grant (no. 4162) and The Scientific and Technological Research Council of Türkiye (TUBITAK) grants 118Z791 and 118C014 to S.K.
Author contributions
S.K. conceived and designed the experiments. A.D.-W., S.A., B.T., M.S., S.D.Ö., S.N.B., D.H.A., A.E.K., and S.K. performed the experiments. A.D.-W., S.A., B.T., M.S., S.D.Ö., A.E.K., and S.K. analyzed the data. A.D.W. and S.K. wrote the manuscript.
Declaration of interests
The authors declare no competing interests.
Published: April 5, 2024
Footnotes
Supplemental information can be found online at https://doi.org/10.1016/j.xcrm.2024.101498.
Supplemental information
References
- 1.Cohen S., Nathan J.A., Goldberg A.L. Muscle wasting in disease: molecular mechanisms and promising therapies. Nat. Rev. Drug Discov. 2015;14:58–74. doi: 10.1038/nrd4467. [DOI] [PubMed] [Google Scholar]
- 2.Mercuri E., Bönnemann C.G., Muntoni F. Muscular dystrophies. Lancet. 2019;394:2025–2038. doi: 10.1016/S0140-6736(19)32910-1. [DOI] [PubMed] [Google Scholar]
- 3.Argilés J.M., Stemmler B., López-Soriano F.J., Busquets S. Inter-tissue communication in cancer cachexia. Nat. Rev. Endocrinol. 2018;15:9–20. doi: 10.1038/s41574-018-0123-0. [DOI] [PubMed] [Google Scholar]
- 4.Argilés J.M., López-Soriano F.J., Stemmler B., Busquets S. Cancer-associated cachexia - understanding the tumour macroenvironment and microenvironment to improve management. Nat. Rev. Clin. Oncol. 2023;20:250–264. doi: 10.1038/s41571-023-00734-5. [DOI] [PubMed] [Google Scholar]
- 5.Dolly A., Dumas J.F., Servais S. Cancer cachexia and skeletal muscle atrophy in clinical studies: what do we really know? J. Cachexia Sarcopenia Muscle. 2020;11:1413–1428. doi: 10.1002/jcsm.12633. [DOI] [PMC free article] [PubMed] [Google Scholar]
- 6.Ferrer M., Anthony T.G., Ayres J.S., Biffi G., Brown J.C., Caan B.J., Cespedes Feliciano E.M., Coll A.P., Dunne R.F., Goncalves M.D., et al. Cachexia: A systemic consequence of progressive, unresolved disease. Cell. 2023;186:1824–1845. doi: 10.1016/j.cell.2023.03.028. [DOI] [PMC free article] [PubMed] [Google Scholar]
- 7.Webster J.M., Kempen L.J.A.P., Hardy R.S., Langen R.C.J. Inflammation and Skeletal Muscle Wasting During Cachexia. Front. Physiol. 2020;11:597675. doi: 10.3389/fphys.2020.597675. [DOI] [PMC free article] [PubMed] [Google Scholar]
- 8.Jatoi A., Dakhil S.R., Nguyen P.L., Sloan J.A., Kugler J.W., Rowland K.M., Jr., Soori G.S., Wender D.B., Fitch T.R., Novotny P.J., Loprinzi C.L. A placebo-controlled double blind trial of etanercept for the cancer anorexia/weight loss syndrome: results from N00C1 from the North Central Cancer Treatment Group. Cancer. 2007;110:1396–1403. doi: 10.1002/cncr.22944. [DOI] [PubMed] [Google Scholar]
- 9.Jatoi A., Ritter H.L., Dueck A., Nguyen P.L., Nikcevich D.A., Luyun R.F., Mattar B.I., Loprinzi C.L. A placebo-controlled, double-blind trial of infliximab for cancer-associated weight loss in elderly and/or poor performance non-small cell lung cancer patients (N01C9) Lung cancer. 2010;68:234–239. doi: 10.1016/j.lungcan.2009.06.020. [DOI] [PMC free article] [PubMed] [Google Scholar]
- 10.Strassmann G., Fong M., Kenney J.S., Jacob C.O. Evidence for the involvement of interleukin 6 in experimental cancer cachexia. J. Clin. Invest. 1992;89:1681–1684. doi: 10.1172/JCI115767. [DOI] [PMC free article] [PubMed] [Google Scholar]
- 11.Bayliss T.J., Smith J.T., Schuster M., Dragnev K.H., Rigas J.R. A humanized anti-IL-6 antibody (ALD518) in non-small cell lung cancer. Expert Opin. Biol. Ther. 2011;11:1663–1668. doi: 10.1517/14712598.2011.627850. [DOI] [PubMed] [Google Scholar]
- 12.Marceca G.P., Londhe P., Calore F. Management of Cancer Cachexia: Attempting to Develop New Pharmacological Agents for New Effective Therapeutic Options. Front. Oncol. 2020;10:298. doi: 10.3389/fonc.2020.00298. [DOI] [PMC free article] [PubMed] [Google Scholar]
- 13.Hermanns H.M. Oncostatin M and interleukin-31: Cytokines, receptors, signal transduction and physiology. Cytokine Growth Factor Rev. 2015;26:545–558. doi: 10.1016/j.cytogfr.2015.07.006. [DOI] [PubMed] [Google Scholar]
- 14.Zarling J.M., Shoyab M., Marquardt H., Hanson M.B., Lioubin M.N., Todaro G.J. Oncostatin M: a growth regulator produced by differentiated histiocytic lymphoma cells. Proc. Natl. Acad. Sci. USA. 1986;83:9739–9743. doi: 10.1073/pnas.83.24.9739. [DOI] [PMC free article] [PubMed] [Google Scholar]
- 15.Richards C.D. The enigmatic cytokine oncostatin m and roles in disease. ISRN Inflamm. 2013;2013:512103. doi: 10.1155/2013/512103. [DOI] [PMC free article] [PubMed] [Google Scholar]
- 16.Blanchard F., Wang Y., Kinzie E., Duplomb L., Godard A., Baumann H. Oncostatin M regulates the synthesis and turnover of gp130, leukemia inhibitory factor receptor alpha, and oncostatin M receptor beta by distinct mechanisms. J. Biol. Chem. 2001;276:47038–47045. doi: 10.1074/jbc.M107971200. [DOI] [PubMed] [Google Scholar]
- 17.Stephens J.M., Bailey J.L., Hang H., Rittell V., Dietrich M.A., Mynatt R.L., Elks C.M. Adipose Tissue Dysfunction Occurs Independently of Obesity in Adipocyte-Specific Oncostatin Receptor Knockout Mice. Obesity. 2018;26:1439–1447. doi: 10.1002/oby.22254. [DOI] [PMC free article] [PubMed] [Google Scholar]
- 18.Bilgic S.N., Domaniku A., Toledo B., Agca S., Weber B.Z.C., Arabaci D.H., Ozornek Z., Lause P., Thissen J.P., Loumaye A., Kir S. EDA2R-NIK signalling promotes muscle atrophy linked to cancer cachexia. Nature. 2023;617:827–834. doi: 10.1038/s41586-023-06047-y. [DOI] [PubMed] [Google Scholar]
- 19.Bonetto A., Aydogdu T., Jin X., Zhang Z., Zhan R., Puzis L., Koniaris L.G., Zimmers T.A. JAK/STAT3 pathway inhibition blocks skeletal muscle wasting downstream of IL-6 and in experimental cancer cachexia. Am. J. Physiol. Endocrinol. Metab. 2012;303:E410–E421. doi: 10.1152/ajpendo.00039.2012. [DOI] [PMC free article] [PubMed] [Google Scholar]
- 20.Cai D., Frantz J.D., Tawa N.E., Jr., Melendez P.A., Oh B.C., Lidov H.G.W., Hasselgren P.O., Frontera W.R., Lee J., Glass D.J., Shoelson S.E. IKKbeta/NF-kappaB activation causes severe muscle wasting in mice. Cell. 2004;119:285–298. doi: 10.1016/j.cell.2004.09.027. [DOI] [PubMed] [Google Scholar]
- 21.Bonetto A., Aydogdu T., Kunzevitzky N., Guttridge D.C., Khuri S., Koniaris L.G., Zimmers T.A. STAT3 activation in skeletal muscle links muscle wasting and the acute phase response in cancer cachexia. PLoS One. 2011;6:e22538. doi: 10.1371/journal.pone.0022538. [DOI] [PMC free article] [PubMed] [Google Scholar]
- 22.Silva K.A.S., Dong J., Dong Y., Dong Y., Schor N., Tweardy D.J., Zhang L., Mitch W.E. Inhibition of Stat3 activation suppresses caspase-3 and the ubiquitin-proteasome system, leading to preservation of muscle mass in cancer cachexia. J. Biol. Chem. 2015;290:11177–11187. doi: 10.1074/jbc.M115.641514. [DOI] [PMC free article] [PubMed] [Google Scholar]
- 23.Van Wagoner N.J., Choi C., Repovic P., Benveniste E.N. Oncostatin M regulation of interleukin-6 expression in astrocytes: biphasic regulation involving the mitogen-activated protein kinases ERK1/2 and p38. J. Neurochem. 2000;75:563–575. doi: 10.1046/j.1471-4159.2000.0750563.x. [DOI] [PubMed] [Google Scholar]
- 24.Ferretti E., Corcione A., Pistoia V. The IL-31/IL-31 receptor axis: general features and role in tumor microenvironment. J. Leukoc. Biol. 2017;102:711–717. doi: 10.1189/jlb.3MR0117-033R. [DOI] [PubMed] [Google Scholar]
- 25.Judge S.M., Nosacka R.L., Delitto D., Gerber M.H., Cameron M.E., Trevino J.G., Judge A.R. Skeletal Muscle Fibrosis in Pancreatic Cancer Patients with Respect to Survival. JNCI Cancer Spectr. 2018;2:pky043. doi: 10.1093/jncics/pky043. [DOI] [PMC free article] [PubMed] [Google Scholar]
- 26.Dadgar S., Wang Z., Johnston H., Kesari A., Nagaraju K., Chen Y.W., Hill D.A., Partridge T.A., Giri M., Freishtat R.J., et al. Asynchronous remodeling is a driver of failed regeneration in Duchenne muscular dystrophy. J. Cell Biol. 2014;207:139–158. doi: 10.1083/jcb.201402079. [DOI] [PMC free article] [PubMed] [Google Scholar]
- 27.Haslett J.N., Sanoudou D., Kho A.T., Han M., Bennett R.R., Kohane I.S., Beggs A.H., Kunkel L.M. Gene expression profiling of Duchenne muscular dystrophy skeletal muscle. Neurogenetics. 2003;4:163–171. doi: 10.1007/s10048-003-0148-x. [DOI] [PubMed] [Google Scholar]
- 28.Wang L.H., Friedman S.D., Shaw D., Snider L., Wong C.J., Budech C.B., Poliachik S.L., Gove N.E., Lewis L.M., Campbell A.E., et al. MRI-informed muscle biopsies correlate MRI with pathology and DUX4 target gene expression in FSHD. Hum. Mol. Genet. 2019;28:476–486. doi: 10.1093/hmg/ddy364. [DOI] [PMC free article] [PubMed] [Google Scholar]
- 29.Wong C.J., Wang L.H., Friedman S.D., Shaw D., Campbell A.E., Budech C.B., Lewis L.M., Lemmers R.J.F.L., Statland J.M., van der Maarel S.M., et al. Longitudinal measures of RNA expression and disease activity in FSHD muscle biopsies. Hum. Mol. Genet. 2020;29:1030–1043. doi: 10.1093/hmg/ddaa031. [DOI] [PMC free article] [PubMed] [Google Scholar]
- 30.Baltgalvis K.A., Berger F.G., Pena M.M.O., Davis J.M., Muga S.J., Carson J.A. Interleukin-6 and cachexia in ApcMin/+ mice. Am. J. Physiol. Regul. Integr. Comp. Physiol. 2008;294:R393–R401. doi: 10.1152/ajpregu.00716.2007. [DOI] [PubMed] [Google Scholar]
- 31.Scott H.R., McMillan D.C., Crilly A., McArdle C.S., Milroy R. The relationship between weight loss and interleukin 6 in non-small-cell lung cancer. Br. J. Cancer. 1996;73:1560–1562. doi: 10.1038/bjc.1996.294. [DOI] [PMC free article] [PubMed] [Google Scholar]
- 32.Ando K., Takahashi F., Kato M., Kaneko N., Doi T., Ohe Y., Koizumi F., Nishio K., Takahashi K. Tocilizumab, a proposed therapy for the cachexia of Interleukin6-expressing lung cancer. PLoS One. 2014;9:e102436. doi: 10.1371/journal.pone.0102436. [DOI] [PMC free article] [PubMed] [Google Scholar]
- 33.Tsujinaka T., Fujita J., Ebisui C., Yano M., Kominami E., Suzuki K., Tanaka K., Katsume A., Ohsugi Y., Shiozaki H., Monden M. Interleukin 6 receptor antibody inhibits muscle atrophy and modulates proteolytic systems in interleukin 6 transgenic mice. J. Clin. Invest. 1996;97:244–249. doi: 10.1172/JCI118398. [DOI] [PMC free article] [PubMed] [Google Scholar]
- 34.White J.P., Baynes J.W., Welle S.L., Kostek M.C., Matesic L.E., Sato S., Carson J.A. The regulation of skeletal muscle protein turnover during the progression of cancer cachexia in the Apc(Min/+) mouse. PLoS One. 2011;6:e24650. doi: 10.1371/journal.pone.0024650. [DOI] [PMC free article] [PubMed] [Google Scholar]
- 35.Fujita J., Tsujinaka T., Yano M., Ebisui C., Saito H., Katsume A., Akamatsu K., Ohsugi Y., Shiozaki H., Monden M. Anti-interleukin-6 receptor antibody prevents muscle atrophy in colon-26 adenocarcinoma-bearing mice with modulation of lysosomal and ATP-ubiquitin-dependent proteolytic pathways. Int. J. Cancer. 1996;68:637–643. doi: 10.1002/(SICI)1097-0215(19961127)68:5<637::AID-IJC14>3.0.CO;2-Z. [DOI] [PubMed] [Google Scholar]
- 36.Miller A., McLeod L., Alhayyani S., Szczepny A., Watkins D.N., Chen W., Enriori P., Ferlin W., Ruwanpura S., Jenkins B.J. Blockade of the IL-6 trans-signalling/STAT3 axis suppresses cachexia in Kras-induced lung adenocarcinoma. Oncogene. 2017;36:3059–3066. doi: 10.1038/onc.2016.437. [DOI] [PubMed] [Google Scholar]
- 37.Seto D.N., Kandarian S.C., Jackman R.W. A Key Role for Leukemia Inhibitory Factor in C26 Cancer Cachexia. J. Biol. Chem. 2015;290:19976–19986. doi: 10.1074/jbc.M115.638411. [DOI] [PMC free article] [PubMed] [Google Scholar]
- 38.Xie K., Xiong H., Xiao W., Xiong Z., Hu W., Ye J., Xu N., Shi J., Yuan C., Chen Z., et al. Downregulation of miR-29c promotes muscle wasting by modulating the activity of leukemia inhibitory factor in lung cancer cachexia. Cancer Cell Int. 2021;21:627. doi: 10.1186/s12935-021-02332-w. [DOI] [PMC free article] [PubMed] [Google Scholar]
- 39.Xiao F., Wang H., Fu X., Li Y., Ma K., Sun L., Gao X., Wu Z. Oncostatin M inhibits myoblast differentiation and regulates muscle regeneration. Cell Res. 2011;21:350–364. doi: 10.1038/cr.2010.144. [DOI] [PMC free article] [PubMed] [Google Scholar]
- 40.Miki Y., Morioka T., Shioi A., Fujimoto K., Sakura T., Uedono H., Kakutani Y., Ochi A., Mori K., Shoji T., et al. Oncostatin M induces C2C12 myotube atrophy by modulating muscle differentiation and degradation. Biochem. Biophys. Res. Commun. 2019;516:951–956. doi: 10.1016/j.bbrc.2019.06.143. [DOI] [PubMed] [Google Scholar]
- 41.Jengelley D.H.A., Wang M., Narasimhan A., Rupert J.E., Young A.R., Zhong X., Horan D.J., Robling A.G., Koniaris L.G., Zimmers T.A. Exogenous Oncostatin M induces Cardiac Dysfunction, Musculoskeletal Atrophy, and Fibrosis. Cytokine. 2022;159:155972. doi: 10.1016/j.cyto.2022.155972. [DOI] [PMC free article] [PubMed] [Google Scholar]
- 42.Dai H., Wang L., Li L., Huang Z., Ye L. Metallothionein 1: A New Spotlight on Inflammatory Diseases. Front. Immunol. 2021;12:739918. doi: 10.3389/fimmu.2021.739918. [DOI] [PMC free article] [PubMed] [Google Scholar]
- 43.de Mezer M., Rogaliński J., Przewoźny S., Chojnicki M., Niepolski L., Sobieska M., Przystańska A. SERPINA3: Stimulator or Inhibitor of Pathological Changes. Biomedicines. 2023;11:156. doi: 10.3390/biomedicines11010156. [DOI] [PMC free article] [PubMed] [Google Scholar]
- 44.Tjondrokoesoemo A., Schips T., Kanisicak O., Sargent M.A., Molkentin J.D. Genetic overexpression of Serpina3n attenuates muscular dystrophy in mice. Hum. Mol. Genet. 2016;25:1192–1202. doi: 10.1093/hmg/ddw005. [DOI] [PMC free article] [PubMed] [Google Scholar]
- 45.Gueugneau M., d'Hose D., Barbé C., de Barsy M., Lause P., Maiter D., Bindels L.B., Delzenne N.M., Schaeffer L., Gangloff Y.G., et al. Increased Serpina3n release into circulation during glucocorticoid-mediated muscle atrophy. J. Cachexia Sarcopenia Muscle. 2018;9:929–946. doi: 10.1002/jcsm.12315. [DOI] [PMC free article] [PubMed] [Google Scholar]
- 46.Shum A.M.Y., Fung D.C.Y., Corley S.M., McGill M.C., Bentley N.L., Tan T.C., Wilkins M.R., Polly P. Cardiac and skeletal muscles show molecularly distinct responses to cancer cachexia. Physiol. Genomics. 2015;47:588–599. doi: 10.1152/physiolgenomics.00128.2014. [DOI] [PubMed] [Google Scholar]
- 47.Miller S.G., Hafen P.S., Brault J.J. Increased Adenine Nucleotide Degradation in Skeletal Muscle Atrophy. Int. J. Mol. Sci. 2019;21:88. doi: 10.3390/ijms21010088. [DOI] [PMC free article] [PubMed] [Google Scholar]
- 48.Brocca L., Toniolo L., Reggiani C., Bottinelli R., Sandri M., Pellegrino M.A. FoxO-dependent atrogenes vary among catabolic conditions and play a key role in muscle atrophy induced by hindlimb suspension. J. Physiol. 2017;595:1143–1158. doi: 10.1113/JP273097. [DOI] [PMC free article] [PubMed] [Google Scholar]
- 49.Ibebunjo C., Chick J.M., Kendall T., Eash J.K., Li C., Zhang Y., Vickers C., Wu Z., Clarke B.A., Shi J., et al. Genomic and proteomic profiling reveals reduced mitochondrial function and disruption of the neuromuscular junction driving rat sarcopenia. Mol. Cell Biol. 2013;33:194–212. doi: 10.1128/MCB.01036-12. [DOI] [PMC free article] [PubMed] [Google Scholar]
- 50.Lecker S.H., Jagoe R.T., Gilbert A., Gomes M., Baracos V., Bailey J., Price S.R., Mitch W.E., Goldberg A.L. Multiple types of skeletal muscle atrophy involve a common program of changes in gene expression. FASEB J. 2004;18:39–51. doi: 10.1096/fj.03-0610com. [DOI] [PubMed] [Google Scholar]
- 51.Miller S.G., Hafen P.S., Law A.S., Springer C.B., Logsdon D.L., O'Connell T.M., Witczak C.A., Brault J.J. AMP deamination is sufficient to replicate an atrophy-like metabolic phenotype in skeletal muscle. Metabolism. 2021;123:154864. doi: 10.1016/j.metabol.2021.154864. [DOI] [PMC free article] [PubMed] [Google Scholar]
- 52.Carpenè E., Andreani G., Isani G. Metallothionein functions and structural characteristics. J. Trace Elem. Med. Biol. 2007;21:35–39. doi: 10.1016/j.jtemb.2007.09.011. [DOI] [PubMed] [Google Scholar]
- 53.Urso M.L., Scrimgeour A.G., Chen Y.W., Thompson P.D., Clarkson P.M. Analysis of human skeletal muscle after 48 h immobilization reveals alterations in mRNA and protein for extracellular matrix components. J. Appl. Physiol. 2006;101:1136–1148. doi: 10.1152/japplphysiol.00180.2006. [DOI] [PubMed] [Google Scholar]
- 54.Urso M.L., Chen Y.W., Scrimgeour A.G., Lee P.C., Lee K.F., Clarkson P.M. Alterations in mRNA expression and protein products following spinal cord injury in humans. J. Physiol. 2007;579:877–892. doi: 10.1113/jphysiol.2006.118042. [DOI] [PMC free article] [PubMed] [Google Scholar]
- 55.Summermatter S., Bouzan A., Pierrel E., Melly S., Stauffer D., Gutzwiller S., Nolin E., Dornelas C., Fryer C., Leighton-Davies J., et al. Blockade of Metallothioneins 1 and 2 Increases Skeletal Muscle Mass and Strength. Mol. Cell Biol. 2017;37 doi: 10.1128/MCB.00305-16. e00305-16. [DOI] [PMC free article] [PubMed] [Google Scholar]
- 56.Schneider J.S., Shanmugam M., Gonzalez J.P., Lopez H., Gordan R., Fraidenraich D., Babu G.J. Increased sarcolipin expression and decreased sarco(endo)plasmic reticulum Ca2+ uptake in skeletal muscles of mouse models of Duchenne muscular dystrophy. J. Muscle Res. Cell Motil. 2013;34:349–356. doi: 10.1007/s10974-013-9350-0. [DOI] [PubMed] [Google Scholar]
- 57.Voit A., Patel V., Pachon R., Shah V., Bakhutma M., Kohlbrenner E., McArdle J.J., Dell'Italia L.J., Mendell J.R., Xie L.H., et al. Reducing sarcolipin expression mitigates Duchenne muscular dystrophy and associated cardiomyopathy in mice. Nat. Commun. 2017;8:1068. doi: 10.1038/s41467-017-01146-7. [DOI] [PMC free article] [PubMed] [Google Scholar]
- 58.Huang X.Y., Huang Z.L., Yang J.H., Xu Y.H., Sun J.S., Zheng Q., Wei C., Song W., Yuan Z. Pancreatic cancer cell-derived IGFBP-3 contributes to muscle wasting. J. Exp. Clin. Cancer Res. 2016;35:46. doi: 10.1186/s13046-016-0317-z. [DOI] [PMC free article] [PubMed] [Google Scholar]
- 59.Cole C.L., Bachman J.F., Ye J., Murphy J., Gerber S.A., Beck C.A., Boyce B.F., Muthukrishnan G., Chakkalakal J.V., Schwarz E.M., Linehan D. Increased myocellular lipid and IGFBP-3 expression in a pre-clinical model of pancreatic cancer-related skeletal muscle wasting. J. Cachexia Sarcopenia Muscle. 2021;12:731–745. doi: 10.1002/jcsm.12699. [DOI] [PMC free article] [PubMed] [Google Scholar]
- 60.Yang H., Mammen J., Wei W., Menconi M., Evenson A., Fareed M., Petkova V., Hasselgren P.O. Expression and activity of C/EBPbeta and delta are upregulated by dexamethasone in skeletal muscle. J. Cell. Physiol. 2005;204:219–226. doi: 10.1002/jcp.20278. [DOI] [PubMed] [Google Scholar]
- 61.Fontes-Oliveira C.C., Busquets S., Fuster G., Ametller E., Figueras M., Olivan M., Toledo M., López-Soriano F.J., Qu X., Demuth J., et al. A differential pattern of gene expression in skeletal muscle of tumor-bearing rats reveals dysregulation of excitation-contraction coupling together with additional muscle alterations. Muscle Nerve. 2014;49:233–248. doi: 10.1002/mus.23893. [DOI] [PubMed] [Google Scholar]
- 62.Zhang L., Pan J., Dong Y., Tweardy D.J., Dong Y., Garibotto G., Mitch W.E. Stat3 activation links a C/EBPdelta to myostatin pathway to stimulate loss of muscle mass. Cell Metab. 2013;18:368–379. doi: 10.1016/j.cmet.2013.07.012. [DOI] [PMC free article] [PubMed] [Google Scholar]
- 63.Domaniku A., Bilgic S.N., Kir S. Muscle wasting: emerging pathways and potential drug targets. Trends Pharmacol. Sci. 2023;44:705–718. doi: 10.1016/j.tips.2023.07.006. [DOI] [PubMed] [Google Scholar]
- 64.Petruzzelli M., Schweiger M., Schreiber R., Campos-Olivas R., Tsoli M., Allen J., Swarbrick M., Rose-John S., Rincon M., Robertson G., et al. A switch from white to brown fat increases energy expenditure in cancer-associated cachexia. Cell Metab. 2014;20:433–447. doi: 10.1016/j.cmet.2014.06.011. [DOI] [PubMed] [Google Scholar]
- 65.Sampath S.C., Sampath S.C., Ho A.T.V., Corbel S.Y., Millstone J.D., Lamb J., Walker J., Kinzel B., Schmedt C., Blau H.M. Induction of muscle stem cell quiescence by the secreted niche factor Oncostatin M. Nat. Commun. 2018;9:1531. doi: 10.1038/s41467-018-03876-8. [DOI] [PMC free article] [PubMed] [Google Scholar]
- 66.Latroche C., Weiss-Gayet M., Muller L., Gitiaux C., Leblanc P., Liot S., Ben-Larbi S., Abou-Khalil R., Verger N., Bardot P., et al. Coupling between Myogenesis and Angiogenesis during Skeletal Muscle Regeneration Is Stimulated by Restorative Macrophages. Stem Cell Rep. 2017;9:2018–2033. doi: 10.1016/j.stemcr.2017.10.027. [DOI] [PMC free article] [PubMed] [Google Scholar]
- 67.Walker E.C., Johnson R.W., Hu Y., Brennan H.J., Poulton I.J., Zhang J.G., Jenkins B.J., Smyth G.K., Nicola N.A., Sims N.A. Murine Oncostatin M Acts via Leukemia Inhibitory Factor Receptor to Phosphorylate Signal Transducer and Activator of Transcription 3 (STAT3) but Not STAT1, an Effect That Protects Bone Mass. J. Biol. Chem. 2016;291:21703–21716. doi: 10.1074/jbc.M116.748483. [DOI] [PMC free article] [PubMed] [Google Scholar]
- 68.Raimondo T.M., Mooney D.J. Anti-inflammatory nanoparticles significantly improve muscle function in a murine model of advanced muscular dystrophy. Sci. Adv. 2021;7:eabh3693. doi: 10.1126/sciadv.abh3693. [DOI] [PMC free article] [PubMed] [Google Scholar]
- 69.Rosenberg A.S., Puig M., Nagaraju K., Hoffman E.P., Villalta S.A., Rao V.A., Wakefield L.M., Woodcock J. Immune-mediated pathology in Duchenne muscular dystrophy. Sci. Transl. Med. 2015;7:299rv4. doi: 10.1126/scitranslmed.aaa7322. [DOI] [PMC free article] [PubMed] [Google Scholar]
- 70.Springer M.L., Rando T.A., Blau H.M. Gene delivery to muscle. Curr Protoc Hum Genet Chapter. Curr. Protoc. Hum. Genet. 2002;Chapter 13:Unit13.4. doi: 10.1002/0471142905.hg1304s31. Unit13 14. [DOI] [PubMed] [Google Scholar]
Associated Data
This section collects any data citations, data availability statements, or supplementary materials included in this article.
Supplementary Materials
Data Availability Statement
-
•
RNA sequencing data generated in this study are available in the GEO database with accession number GSE222208. Human gene expression datasets analyzed here are also available in the GEO database; GSE130563,25 GSE1007,27 GSE109178,26 GSE115650,28 GSE140261,29 and GSE3307.26
-
•
This paper does not report original code.
-
•
Any additional information required to reanalyze the data reported in this paper is available from the lead contact upon request.