

Abstract
Current nucleic acid delivery methods have not achieved efficient, non‐toxic delivery of miRNAs with tumor‐specific selectivity. In this study, a new delivery system based on light‐inducible gold–silver–gold, core–shell–shell (CSS) nanoparticles is presented. This system delivers small nucleic acid therapeutics with precise spatiotemporal control, demonstrating the potential for achieving tumor‐specific selectivity and efficient delivery of miRNA mimics. The light‐inducible particles leverage the photothermal heating of metal nanoparticles due to the local surface plasmonic resonance for controlled chemical cleavage and release of the miRNA mimic payload. The CSS morphology and composition result in a plasmonic resonance within the near‐infrared (NIR) region of the light spectrum. Through this method, exogenous miR‐34a‐5p mimics are effectively delivered to human squamous cell carcinoma TE10 cells, leading to apoptosis induction without adverse effects on untransformed keratinocytes in vitro. The CSS nanoparticle delivery system is tested in vivo in Foxn1nu athymic nude mice with bilateral human esophageal TE10 cancer cells xenografts. These experiments reveal that this CSS nanoparticle conjugates, when systemically administered, followed by 850 nm light emitting diode irradiation at the tumor site, 6 h post‐injection, produce a significant and sustained reduction in tumor volume, exceeding 87% in less than 72 h.
Keywords: Diels–Alder, esophageal cancer, miR‐34a, near‐infrared, plasmonic nanoparticles
This study describes a novel light‐inducible gold–silver–gold, core–shell–shell nanoparticle system for delivery of small nucleic acid therapeutics providing precise spatiotemporal control. They demonstrate their potential to efficiently deliver miRNA mimics to tumors, by leveraging the near infrared plasmonic heating of these nanoparticles and activation of retro Diels‐Alder reactions to precisely control release of functional nucleic acids.

1. Introduction
As case numbers of head and neck cancers have increased worldwide, research has reinforced that many of our modern treatments cause severe and often long‐lasting side effects to patients suffering with esophageal cancer.[ 1 , 2 , 3 ] Cancer treatments such as chemotherapy and radiation often leave patients in severe discomfort, and with injurious loss of tissue in tissues critical for healthy post‐treatment quality of life. Although several of these approaches can be exceedingly efficacious in treating numerous types of cancer, the repercussions for patients with head and neck or esophageal cancers can be considerably more severe.[ 2 , 3 , 4 ] As such, devising innovative and efficient techniques to selectively eliminate cancer cells while minimizing side effects and tissue damage is of utmost importance.
Increasingly, evidence suggests the importance of dysregulated miRNAs in modulating tumorigenesis, cancer cell survival, and metastasis.[ 5 , 6 , 7 , 8 , 9 , 10 ] Hence, reinstating these miRNAs that suppress tumor growth holds promise in enhancing the current cancer therapies, but attaining tumor‐specific delivery while maintaining safe and effective delivery of exogenous miRNAs in vitro and in vivo remains a major challenge.[ 11 , 12 , 13 , 14 , 15 ] Previous studies have described the role of hsa‐miR‐34a‐5p in the development and oncogenesis of head and neck cancers.[ 13 , 16 , 17 , 18 ] Increased intracellular expression of miR‐34a‐5p, such as through the delivery of synthetic miRNA mimics sharing its sequence, shows significant efficacy among human cancer cell lines in vitro, that suffer from gene‐dysregulation leading to tumor formation in patients.[ 13 , 17 ] Furthermore, hsa‐miR‐34a‐5p has been discovered to have an anti‐proliferative effect on squamous cell carcinoma (head and neck origin) in multiple research studies,[ 13 , 17 , 18 ] and in clinical trials.[ 16 ]
Several strategies have been investigated to modify miRNA activity, including the transport of exogenous miRNA mimics or inhibitors through the use of viruses, polymeric dendrimers, or liposomes.[ 8 , 12 , 16 , 19 , 20 , 21 ] Although cationic or neutral lipid/polymer‐based nanoparticles have been shown to inhibit tumor growth in various xenograft and even immune‐competent mouse cancer models,[ 10 , 22 ] many of them fail to achieve efficient, localized delivery of miRNA with accurate spatiotemporal regulation.[ 13 , 23 ] This is a notable concern as gene silencing off‐target can lead to severe adverse effects.[ 24 ]
Here, we have developed a light‐inducible gold–silver–gold, CSS nanoparticle system for delivering functional miRNA mimics to selectively kill cancer cells. These plasmonic CSS nanoparticles were modified with a furan Diels–Alder (FDA) linker, with the linker being the reaction product of the cycloaddition between 2‐furanmethanethiol and 6‐maleimidohexanoic acid. When exposed to NIR light, the CSS particle generates strong plasmonic fields. These plasmons catalyze the retro‐DA reaction, leading to the release of a miRNA mimic. Unlike previous systems that required higher‐energy blue or green light, this NIR‐responsive vehicle is well‐suited for in vivo applications. NIR light can penetrate deep into tissues, making it useful for esophageal and head and neck cancer treatment. The CSS nucleic acid delivery system offers advantages like predictable photo‐response, stepwise release, high efficiency at low light levels, and reduced toxicity compared to UV‐activated systems. In prior investigations, we showed that several DA compounds made up of distinct diene chemistries could generate a variety of linkers with different and definite cleavage energies.[ 25 , 26 , 27 ] After evaluating the results, we opted for the FDA linker as a covalent DA linker chemistry since these specific linkers exhibit cleavage energetics that create a stable bond under physiological conditions, thereby caging the miRNA mimic to the nanoparticle in a non‐active form with limited non‐specific release, while also ensuring efficient and predictable release of the miRNA mimic upon irradiation.[ 28 , 29 , 30 ]
Our group's research focuses on utilizing photoactivated plasmonic metal nanoparticles to precisely control the delivery of nucleic acids in vitro. Recent development of the CSS nanoparticle vehicle exploits the localized surface plasmon resonance (LSPR) field interacts with a Diels–Alder cycloadduct group, triggering a retro DA cleavage reaction that releases the nucleic acid. This article details the utilization of these functionalized CSS (gold–silver–gold) nanoparticle system that is modified with FDA Diels–Alder molecular linkers as a spatiotemporally controlled delivery system for synthetic miR‐34a mimics (CSS‐DA‐miR34a). This delivery system was evaluated through in vitro and in vivo techniques, using squamous human cancer cells and a TE10 xenograft tumor model of human esophageal cancer cells grown in the mouse flanks. A bioinformatics analysis was also conducted to predict the mRNA targets of miR‐34a‐5p in squamous carcinomas of the esophagus.
2. Results and Discussion
2.1. Bioinformatics
Advances in cancer biology have brought attention to the importance of microRNAs (miRNAs). These are short, single‐stranded nucleotide RNAs, typically consisting of 20 to 23 nucleotides, that negatively regulate mRNA translation and stability in the cell cytosol.[ 31 , 32 , 33 ] MiRNAs play a crucial role in various aspects of cancer, such as tumor growth, angiogenesis, and immune invasion.[ 15 , 34 , 35 , 36 , 37 , 38 ] Previous studies have established that delivery of exogenous synthetic miRNA mimics within cancer cells can trigger selective apoptosis, distinguishing them from healthy cells.[ 22 , 30 , 39 , 40 , 41 , 42 , 43 , 44 , 45 , 46 ]
In nature, miRNAs are encoded for and produced within living cells through a series of enzymatic and chauffeuring events, beginning in the nucleus, and ending with functionally mature miRNAs in the cell cytoplasm.[ 31 , 32 , 33 , 34 , 35 , 36 , 37 , 38 ] This canonical biogenesis begins with the production of the pri‐miRNA transcript in the nucleus.[ 31 , 32 , 33 , 34 , 35 , 36 , 37 , 38 ] The pri‐miRNA is cleaved to produce the pre‐miRNA transcript through interactions with a microprocessor complex consisting of the Drosha and DiGeorge syndrome critical region 8 proteins.[ 34 , 35 , 36 , 37 , 38 ] This newly formed pre‐miRNA is then exported from the nucleus to the cytoplasm through interaction with Exportin5/RanGTP‐dependent functions, which also further process the pre‐miRNA transcript into the mature miRNA duplex strands.[ 31 , 32 , 33 , 34 , 35 , 36 , 37 ] At this stage, either the 5p or 3p strand of the mature miRNA duplex is loaded into one of the Argonaute protein family members, forming what is generally referred to as the RNA‐induced silencing complex (RISC).[ 34 , 35 , 36 , 37 ] This RISC complex, loaded with a single strand (either 5p or 3p) of the mature miRNA product, traverses the cell cytoplasm in search of non‐folded mRNA transcripts of complementary base pair sequence to that of the miRNA strand.[ 32 , 33 , 34 , 35 , 36 , 37 , 38 ] There are a host of non‐canonical pathways for miRNA biogenesis being studied, but ultimately these pathways will lead to a functional miRNA‐RISC complex.[ 34 , 35 , 36 , 37 ] If the miRNA strand loaded within the RISC binds a cytosolic mRNA due to high affinity base pair‐matching that mRNA strand will be targeted for repression through binding‐induced translational inhibition mechanisms.[ 31 , 32 , 33 , 34 , 35 , 36 , 37 , 38 ]
In this study, using similar techniques to previously described methods[ 22 , 30 ] we generated data suggesting that miR‐34a‐5p[ 17 , 18 ] can reduce cancer cell survival and it is frequently cited as dysregulated in squamous cell cancers, such as esophageal cancer. Among multiple target miRNAs that are dysregulated in these squamous cancer cell lines, miR‐34a‐5p stood out as a potential candidate for exogenous delivery as it is known to regulate multiple cancer related pathways and that these pathways respond significantly to changes in intracellular miR‐34a‐5p levels, as shown in Figure 1 (alternate view available in Figure S2, Supporting Information). Among the targets of miR‐34a‐5p depicted in Figure 1, a subset was selected as markers for intracellular knockdown due to activation of the CSS particles in vitro, later shown in the target gene selection results section. Among these pathways, the two most significantly tied to the development of squamous cell carcinoma were the ERK/MAPK signaling pathway, seen in Figure S3A (Supporting Information), and the HOTAIR regulatory pathway, seen in Figure S3B (Supporting Information). These two pathways are known to be responsible for transducing proliferative or apoptotic signals from the cell membrane to the nucleus (ERK/MAPK), as well as for maintaining cellular homeostatic mechanisms (HOTAIR).[ 22 , 30 , 43 , 45 ] These additional bioinformatic analyses support and demonstrate miR‐34a‐5p target specificity within the ERK/MAPK Signaling and HOTAIR Regulatory pathways, and that disruptions in these pathways may significantly, and detrimentally modulate cellular processes that lead to developing squamous cell carcinoma.[ 22 , 30 , 43 , 45 ]
Figure 1.

Targets of miR‐34a‐5p including ROCK1, TGIF2, MYC, and STAT3 in squamous cell cancer, and additional interacting pathways identifying the selection of miR‐34a as a potential therapeutic modulation of carcinogenic gene pathways in esophageal squamous cell carcinomas to drive discriminating apoptosis. Octagonal symbols indicate cascades reported to diminish normal cellular function. Solid and dotted arrows represent protein–protein (or related) interactions, and transcription/regulation (or related) interactions, respectively. Molecular symbols differentiate between the symbol's gene/protein/molecule class (p < 0.00005). Plus (+) symbols indicate positive interaction leading to oncogenesis; Negative (−) symbols indicate negative interactions leading to oncogenesis.
2.2. Production and Analysis of CSS‐FDA‐miR34as
In order to attain effective spatiotemporal control, we developed gold–silver–gold CSS nanoparticles modified with FDA covalent linkers for delivering synthetic miR‐34a‐5p mimics within cancer cells under 850 nm irradiation. Our previous work has tabulated the thermodynamic reaction barrier results for the furan‐based DA linker and other linker compositions.[ 28 ] Linkers made up of pyrrole‐based dienes formed less stable bonds compared to those containing furan, leading to effectual liberation of miRNA mimic cargos using minimal irradiation energies. On the other hand, DA chemistries utilizing thiophene resulted in significantly more stable linkages, with only partial release observed at high energies.[ 28 , 47 ] Here, we synthesized and characterized the CSS‐FDA‐miR34a nanoparticles.[ 28 , 48 ]
Inorganic nanoparticles, particularly noble metal nanoparticles, have proven to be excellent carriers for various therapeutic agents such as small molecules, antisense oligonucleotides, siRNAs, and miRNA mimics.[ 9 , 23 , 25 , 30 , 49 ] Noble metal nanoparticles offer several advantages for drug delivery applications, including the ability to easily control their shape, efficient large‐scale production, a high surface area‐to‐volume ratio, and versatile functionalization options.[ 23 , 25 , 30 , 49 ] They are well‐suited for nucleic acid delivery due to their ability to attach a high density of surface ligands, facilitate easy passage through cell membranes, minimize degradation of therapeutic nucleic acids, and enable controlled release within cells.[ 23 , 25 , 30 , 49 ] These nanoparticles can be easily modified with nucleic acids, making them efficient and biocompatible carriers for antisense oligonucleotides and siRNAs.[ 23 , 25 , 30 , 49 ]
Core gold nanoparticles of 12 nm diameter were synthesized through gold reduction reactions, as previously described.[ 25 , 49 , 50 ] The silver shell deposition was initiated using ascorbic acid as a mild reducing agent that reduces Ag+ to metallic silver to form a shell on the gold core under basic conditions.[ 25 ] The thickness of the silver shell can be controlled through careful calculation of the molarity of the ascorbic acid, silver nitrate, and sodium hydroxide. Finally, gold shell formation occurs through reduction of gold onto this new surface, where sodium citrate reduces Au+ at the surface under oxidizing conditions using hydroquinone.[ 25 , 50 ] The shell thickness is also controlled to red‐shift the LSPR wavelength of the CSS nanoparticle into the NIR region.[ 25 , 50 ] The final size of the nanoparticle was tuned within the 50–200 nm biological window for efficient intracellular uptake.[ 51 , 52 ] These CSS nanoparticles are consistently synthesized within a size range of 80–100 nm and they exhibit an LSPR in the NIR region of the light spectrum.
The surface chemistry of the CSS nanoparticles can then be easily modified to carry bioactive payloads for therapeutic delivery applications using thiolation chemistry.[ 25 , 29 ] To conjugate miR‐34a‐5p mimics to the surfaces of CSS nanoparticles, the particles were first treated with the FDA linker as previously described.[ 25 , 28 , 30 ] Amine‐terminated miR‐34a‐5p mimics were tethered to the carboxy‐group of the FDA molecule using EDC coupling chemistry.[ 25 , 28 , 30 ] Chemical reaction mechanisms for the FDA formation were controlled by maintaining a pH between 4 and 4.5.[ 25 , 28 , 53 ] As previously described, those reactions, including the synthesis of the linker, were performed at room temperature, resulting in high yields.[ 28 , 30 ] Our group has demonstrated that precise temporal control of nucleic acid delivery can be achieved using these CSS nanoparticles. The nucleic acid remains inactive and securely bound to the CSS vehicle inside cells until it is exposed to irradiation at the LSPR. Even low‐intensity NIR light (as little as 20 mW) can trigger a highly efficient, step‐function–like release of nucleic acid from the CSS nanoparticles. Cleavage of the FDA linker via the reverse‐Diels–Alder reaction was initiated by NIR excitation at the nanoparticle's LSPR frequency, at a wavelength of ≈850 nm.[ 25 , 28 ]
The CSS measured an average diameter size of ≈91.3 ± 5.4 nm with a polydispersity of 0.187, as determined by dynamic light scattering (DLS), shown in Figure 2A. TEM analysis, seen in Figure 2B also showed that the CSS nanoparticles were spherical in morphology. Based on our zeta‐potential and DLS measurements, we have shown that when gold–silver–gold nanoparticles were subjected to sequential addition of FDA and miR‐34a‐5p mimics, they had a consistent increase in hydrodynamic radius and increasingly negative zeta potential values. These findings suggest that shell growth formation and linker‐mimic conjugation occurred as a result of the addition. Figure 2A,C illustrates these findings. The resulting CSS‐FDA‐miR34a nanoparticles exhibited a zeta potential of ≈−36 mV and showed excellent colloidal stability in solution. The CSS‐FDA‐miR34a nanoparticles also indicated predictable and mirrored mobility because of size and charge distribution among the various CSS nanoparticle byproducts, as depicted in Figure 2D. The colloidal stability of these CSS‐miR34a nanoparticles was also assessed at various time points and is depicted in Figure 2E. The CSS‐miR34a nanoparticles displayed robust colloidal stability in this serum‐containing physiological solution for more than 9 h under zero‐flow conditions. The CSS‐miR34a nanoparticles began to show minor agglomeration at 3 h and with small increases in agglomeration up to 9 h. These time points bracketed the 6 h post‐dosage activation time point that was used for in vivo experiments.
Figure 2.

A) Nanoparticle size distribution from synthesis of the base, gold‐core seed, through shell formation as measured by DLS. B) Nanoparticle morphology and elemental composition detected using TEM equipped with EDS technology. Scale bar 50 nm. Within the STEM/EDS images, red color represents elemental gold (Au), and green color represents silver (Ag). C) Nanoparticle charge measured through zeta‐potential analysis. D) Nanoparticle mobility measured through zeta‐potential analysis. E) Colloidal stability of CSS‐miR34a nanoparticles in solution at varied times post‐synthesis at 20 °C (room temperature). n = 3 *Significant difference (p < 0.05). **Significant difference (p < 0.01). ***Significant difference (p < 0.001).
2.3. NIR Mediated Release of Therapeutic miRNA Mimics from CSS Surface
We have observed that exposing the system to irradiation at 850 nm wavelength causes the release of miR‐34a‐5p mimic. This release is triggered by the reversal of the Diels–Alder reaction, which occurs due to the localized heat generation at the CSS surface caused by the decay of the excited LSP. This process is depicted in Figure 3 . Schematic representation of the excitation at the CSS nanoparticle surface, generating an LSPR, with light at a wavelength of 850 nm is shown in Figure 3A. The light activation was demonstrated using FAM‐tagged miR‐34a mimics and a step‐like release function was observed after the exposure of 850 nm LED for a total of 10 J (≈1000 W m−2 over 1 cm2 for 100 s), shown in Figure 3B, which is similar to the results of prior studies and is a significant improvement upon absorbance‐mediated heat generation over nanoparticles consisting of gold alone.[ 25 , 50 ] This release of miRNA mimics from the surface of the CSS vehicle was indirectly measured through fluorescence signal tracking of the FAM tag located on the 3′ end of synthetic miRNA mimics. The UV–vis spectra measurements, seen in Figure 3C, showed that the plasmonic nanoparticles exhibit an absorption maxima at 850 ± 3 nm. As demonstrated in Figure 3B, minimal release of the miRNA mimics was observed from the CSS surface in the absence of light irradiation. This indicates that the NIR light‐responsive CSS nanoparticle miRNA mimic delivery system does not exhibit significant leakage of therapeutic payload or instabilities between the particle‐linker interface, and indicates significant release of payload miRNA mimics upon irradiation at the LSPR.
Figure 3.

A) Schematic representation of the CSS nanoparticle, linker surface functionalization, and light activation of the reverse‐Diels–Alder reaction releasing siRNA payloads. B) Energy required for the activation of the reverse‐Diels–Alder reaction at the CSS nanoparticle surface due to plasmonic resonance at 850 nm absorbance. n = 3. *Significant difference (p < 0.05). ****Significant difference (p < 0.0001). C) Surface absorbance of the core, core–shell, and CSS nanoparticle through synthesis, where resonant wavelengths are denoted by the dotted line.
2.4. Intracellular Uptake Analysis of CSS‐FDA‐miR34a and NIR Mediated Release of miRNA Mimics
We analyzed fluorescent confocal images of TE10 human squamous carcinoma cells to confirm the intracellular delivery of CSS‐FDA‐miR34a and to indicate the NIR‐mediated release of miRNA mimics. To validate the cellular uptake and miRNA release, we used FAM‐tagged or PE‐Cy5‐tagged miR‐34a mimics. Prior to light activation, no significant FAM fluorescence can be observed due to metal‐enhanced quenching of the fluorophore at the core–shell–shell nanoparticle surface, as shown in previous studies.[ 29 , 30 ] However, after photoactivation, we expect the miRNA mimic and associated fluorophore to diffuse away from the CSS particle surface,[ 25 , 50 , 54 ] resulting in a reduction of this photo‐quenching effect and increased FAM fluorescence throughout the cytoplasm.
Compared to chemical transfection methods, this core–shell–shell nanoparticle system, exhibits efficient cellular uptake, as seen in Figure 4 .[ 22 , 30 , 55 ] In agreement with previous studies,[ 25 , 30 ] prior to photoactivation, little PE‐Cy5 fluorescence is detected in the cytosol, as shown in Figure 4A. After photoactivation a substantial increase in cytoplasmic PE‐Cy5 fluorescence can be detected post‐photoactivation with NIR light, as shown in Figure 4B. These flow cytometry results indicate greater than 92% uptake within the TE10 cells of the PE‐Cy5‐tagged‐miR34a mimics using these CSS nanoparticles in vitro when compared against non‐treated controls and are supported through qualitative imaging analyses results shown in the underlying panels Figure 4C,D. In addition, after photoactivation, the majority of the increased FAM fluorescence signal from the tagged miRNA mimic was observable within the perinuclear cytoplasm, for cells treated with the CSS‐FDA‐miR34a system, as seen in Figure 4D. These results also indicate successful cleavage of the Diels‐Alder bond, and release of the miR‐34a‐5p mimic under NIR irradiation conditions in vitro. All samples were subject to identical growth, maintenance, and imaging conditions prior to and following treatment with the CSS‐miRNA mimic delivery mechanism. The findings support our previous research on the delivery of small nucleic acids using photoactive nanoparticles. Our earlier investigations had demonstrated that after intracellular release through light activation, oligonucleotides were mainly located within perinuclear regions.[ 22 , 25 , 30 , 48 , 52 , 56 ]
Figure 4.

A) Fluorescent quantification of TE10 cells without PE‐Cy5 tagged CSS‐FDA‐miR34a nanoparticles through Flow Cytometry analysis. B) Fluorescent quantification of TE10 cells treated with PE‐Cy5 tagged CSS‐FDA‐miR34a nanoparticles through flow cytometry analysis. C) Fluorescent images of TE10 cells with CSS‐FDA‐miR34a mimic nanoparticles that received no irradiation at 850 nm, and imaged through confocal microscopy. Scale bar 10 µm. Blue, NucBlue/DAPI; Red, Cell‐Tracker Red, Green, FAM. D) Fluorescent images of TE10 cells treated with FAM‐tagged CSS‐FDA‐miR34a nanoparticles and irradiated with 850 nm for miRNA mimic release and imaged through confocal microscopy. Scale bar 10 µm.
2.5. Efficacy of CSS‐miR34a Mimic Nanoparticles In Vitro
We analyzed the effects of the CSS‐FDA‐miR34a nanoparticle treatment on the esophageal squamous carcinoma TE10 cells in vitro. Cell death was detected through the use of the LIVE/DEAD cell staining kit and the Quant‐iTTM PicoGreen assay kit at 24, 48, and 72 h after treatment of TE10 cells with the CSS‐FDA‐miR34a nanoparticles, as shown in Figure S4 (Supporting Information). The LIVE/DEAD images corresponding to the CSS‐FDA‐miR34a treatments and compared against relevant controls are shown in Figure 5A. A scrambled RNA sequence (non‐coding miRNA oligo—miRNC) was implemented as a negative control to detect the cytotoxicity of light exposure, CSS nanoparticles, and the nucleic acid payloads. The reduction of calcein‐AM signal denotes possible cell senescence or death, and an increase in red fluorescence signal of ethidium homodimer‐1 is detected in CSS‐FDA‐miR34a treated specimens relative to the negative control treatment cohorts also indicates a loss of viable cells. All samples were subject to identical growth, maintenance, and imaging conditions prior to and following treatment with the CSS‐miRNA mimic delivery mechanism.
Figure 5.

A) Cell viability of TE10 cells treated with the CSS‐miRNA treatment groups measured using LIVE|DEAD fluorescent‐based assay for light‐based microscopy. The color green indicates the presence of living cells, while the color red indicates that the cells have died. B) Image quantification analysis of the fluorescent assay images shown in (A). Color‐scaled bars represent decreasing viability, bright green to dark green, respectively, and light pink to deep red respectively. C) Cell viability among TE10 cells treated with CSS‐miRNA mimic nanoparticle groups measured through fluorescent‐based, direct dsDNA quantification. “+L” indicates that NIR irradiation occurred for the corresponding treatment group. n = 3. *Significant difference (p < 0.05). ***Significant difference (p < 0.001). ****Significant difference (p < 0.0001).
The qualitative LIVE/DEAD assay images of Figure 5A were analyzed using ImageJ to quantify the relative green/red intensity as shown in Figure 5B. Additionally, cell numbers corresponding to treatment were quantified through dsDNA quantification using the Quant‐iTTM PicoGreen assay. The results from the picoGreen assay, as shown in Figure 5C, indicate significant death of TE10 cells using CSS‐FDA‐miR34a mimic delivery with light activation. TE10 cell viability was not significantly reduced in the light activated CSS‐miRNC control groups, compared to the live control, indicating the cytocompatibility of nanoparticle delivery system. Cell viability post‐transfection with light activated CSS‐FDA‐miR34a nanoparticles demonstrated dose‐dependent activity and can be viewed in Figure S5 (Supporting Information). The CSS‐FDA‐miR34a nanoparticles treatment and activation in normal oral keratinocyte cells and transformed fibroblast (3T3 cell controls) did not show toxicity, as shown in Figure S6 (Supporting Information), indicating at least some selectivity for TE10 cancer cells compared to non‐cancerous cells from the anatomical region.
2.6. Target Gene Regulation by CSS‐FDA‐miR34a In Vitro
We have shown cellular uptake of silver nanoparticles, gold nanoparticles, and the gold–silver–gold nanoparticles by cells through endocytic mechanisms.[ 25 , 30 , 55 ] Notwithstanding, delivering functional miRNA mimics effectively can encounter several impediments using a nanoparticle system.[ 11 , 12 , 34 ] For instance, subsequent to light stimulation, miRNA mimics need to exit endosomes to engage with RISC and mRNA in the cytosol.[ 11 , 31 , 36 ] Moreover, the decline in intravesicular pH during endosome maturation and the possibility of lysosome fusion may lead to the degradation of miRNA mimics.[ 11 , 31 , 34 , 36 ] Therefore, we monitored for the release of functional miRNA mimics from endosomal compartments, and the efficacy of the RNA‐induced silencing complex, by examining the expression levels of the respective target genes. ROCK1, STAT3, MYC, and TGIF2 were identified as direct target of miR‐34a‐5p based on previous literature and TargetScan results.[ 12 , 17 , 18 , 57 , 58 , 59 , 60 , 61 ] Through RT‐PCR analyses, we confirmed that the expression of these target genes was significantly reduced in the response to the light‐activated CSS‐FDA‐miR34a mimic treatment, shown in Figure 6A. The actCASP‐3 and proCASP‐3 levels among TE10 cells treated with CSS‐FDA‐miR34a mimic nanoparticle treatment groups show significant increase in the active form of this apoptotic signaling protein in the light activated treatment, as seen in Figure 6B, compared to the control treatments.
Figure 6.

Gene expression and target suppression analysis in vitro. A) Quantitative gene expression analysis of bioinformatics‐predicted miR34a targets measured through RT‐PCR to detect targets, ROCK1, TGIF2, MYC, and STAT3. n = 3. **Significant difference (p < 0.01). ****Significant difference (p < 0.0001). B) Qualitative analysis of intracellular levels of caspase‐3, known to direct apoptotic cell signaling pathways, using western blot to detect the presence of proCASP3 (inactive caspase‐3), and actCASP3 (active caspase‐3) in TE10 treatment samples.
2.7. Regression of Subcutaneous Human Esophageal Tumors In Vivo
The ability of CSS‐FDA‐miR34a to induce tumor cell death was assessed in vivo in Foxn1nu athymic mice with bilateral subcutaneous TE10 xenografted tumors grown in the flanks. The biodistribution and pharmacokinetics in our group's prior tumor‐bearing mice studies,[ 30 ] using a congruent miRNA mimic delivery system utilizing silver nanoparticles with surface‐bound FDA linker chemistries, indicated that light irradiation 6 h post‐injection would allow for maximal tumor‐site accumulation of the nanoparticle delivered via retroorbital intravenous injections. Comparable xenografted tumor model demonstrations,[ 62 , 63 , 64 ] indicate that nanoparticles of similar size, morphology, and surface chemistry to these CSS nanoparticles reach peak accumulation in the tumor tissue within 4–6 h post‐injection. These preliminary experiments demonstrated that nanoparticle‐miRNA mimic conjugates chiefly distributed to the spleen, liver, tumor and lungs, agreeing with previous studies using similar systems.[ 65 , 66 ] Most of the nanoparticles during those preliminary experiments were concentrated within organs containing elevated vasculature networks.[ 5 , 7 , 9 , 67 ] It has been shown that higher relative uptake in these organs, like that of the spleen in the animal model, could be due to organ enlargement that may accompany tumor development, according to previous reports.[ 6 , 7 , 24 , 33 , 67 , 68 ]
Additional biodistribution analyses were conducted on the Foxn1nu athymic mice using a similar analysis of the different organ systems for the presence of our CSS nanoparticle system following retro‐orbital injection which is shown in Figure S7 (Supporting Information). The data indicates that CSS nanoparticles were present at varying degrees, in the major organ tissues following retro‐orbital introduction to systemic circulation. This indicates that not only were the CSS nanoparticles transported through the systemic circulation but were translocating into the tumor and other tissues . The enhanced permeability and retention effect may be beneficially affecting CSS‐FDA‐miR34a distribution among these tissues due to abnormal and excessive tumor vasculature, high interstitial pressure, solid stress from tumor growth, and abnormal stromal matrix may all contribute to accumulation in tumors.[ 6 , 69 ]
One tumor on each mouse was irradiated at 6 h post‐injection for ≈6 min using a mounted 850 nm LED for all treatments (40 J, ≈1250 W m−2 over 1 cm2 for 320 s), the contralateral tumor served as a no light control. The treatment of CSS‐FDA‐miR34a with NIR light exposure resulted in considerable tumor volume reduction within 72 h, and no resurgence of tumors was noticed for up to 7 days. In contrast, increases in tumor volume continued for the CSS‐FDA‐miRNC +/− NIR as well as CSS‐FDA‐miR34a‐NIR treated mice. Of significant note, at the 7‐day mark post‐treatment, there were no significant changes observed in the mean body weights of all treatment groups.
When injected into xenografted mice with human cell‐derived tumors, a single dose of CSS nanoparticle‐miRNA mimic conjugates followed by 850 nm LED irradiation led to efficient and sustained reduction in tumor volume of ≈87% as shown in Figure 7A, corresponding well with similar previous studies.[ 22 , 30 , 55 , 59 ] Further, we demonstrate that the delivery of functional, exogenous miR‐34a mimics can be spatiotemporally controlled in the tumor microenvironment through exposure to 850 nm LED light and cause apoptosis and tumor regression in vivo. Non‐light exposed tumors in the same CSS‐FDA‐miR34a treated mouse showed no reduction in the tumor volume.
Figure 7.
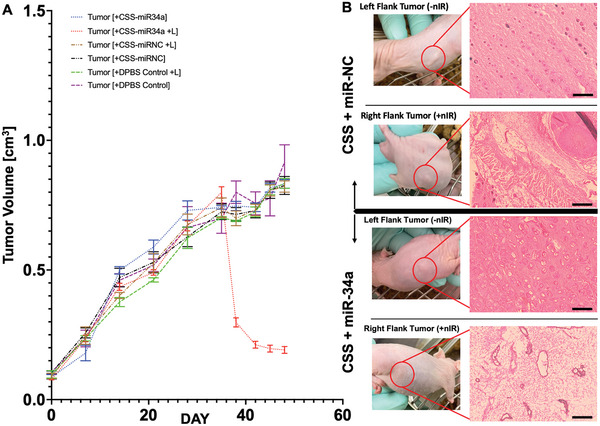
A) Quantification of tumor volume over time before, during, and after treatment with the CSS‐miRNA nanoparticle treatment groups. n = 6. B) Histological analysis of mice treated with the CSS‐miRNA treatment groups. H&E‐stained sections imaged under light‐based microscopy (Scale bar is 2 mm). The extracellular matrices are stained pink, cell nuclei in purple, and empty space in white.
The tumor tissue of mice treated with CSS‐FDA‐miRNC and exposed to +/− 850 nm light radiation displayed regular squamous tumor organization and histology, as demonstrated in Figure 7B, with a well‐defined basal layer. Furthermore, the H&E‐stained sections of tumors showed no noticeable histological variations in the CSS‐FDA‐miR34a NIR− control groups. Conversely, the tumors from mice treated with light‐activated CSS‐FDA‐miR34a NIR+ were severely impaired, exhibiting disrupted tumor architecture and regions of apparent total cell death, as depicted in the right‐hand panel of Figure 7B.
All treatment groups were subject to identical conditions prior to and following injection, where the only difference in treatment is the miRNA mimic being delivered. The rationale behind evaluating tumor growth and treatment in this manner, two tumors per mouse, was to employ an intrasample control for each examination. This allowed us to test the effects of NIR irradiation of the tumor tissue, post‐injection to observe notable differences on tumoral regression within the same mouse. In this fashion, the control experiments were monitored for both the effectiveness of the nanoparticles being delivered to the tumoral site, and for the efficacy of the passenger miRNA mimic that they carried based on NIR mediated release. The overall treatment flowchart is illustrated in Figure S8 (Supporting Information), and throughout the study, the mice's weights and vital signs were monitored every 3 days. Additional histological sample section replicates can also be seen in Figure S9 (Supporting Information).
3. Conclusions
To overcome some of the challenges facing non‐hepatic delivery of small nucleic acid therapeutics, we developed a biocompatible, light‐inducible nanoparticle system capable of intracellularly delivering functional miRNA mimics that selectively induce apoptosis in human esophageal TE10 cancer cells. This CSS nanoparticle efficiently absorbed NIR irradiation generating an LSPR field, which initiated a retro Diels–Alder reaction stemming the release of therapeutic miRNA mimics. These CSS nanoparticles carrying miRNA mimics through reversible Diels–Alder linkers were evaluated in vivo using a xenograft mouse model of esophageal squamous cell carcinomas (TE10 cells), where they demonstrated tumor ablation with spatial specificity. This can ultimately lead to minimized side effects among surrounding, healthy tissue, while maintaining optimal tumor regression post‐treatment. Taken together, these findings demonstrate that this delivery system can effectively transport operational miRNA mimics into cancer cells and that judiciously chosen miRNA mimics can regulate target gene expression to accomplish cell‐specific cytotoxicity.
4. Experimental Section
Materials
Custom‐modified miR34a (5′‐C6‐NH2‐2′‐OMe—UGG CAG UGU CUU AGC UGG UUG U‐FAM/Cy5‐3′) and custom‐modified non‐coding control miRNA oligo mimics (5′‐C6‐NH2‐2′‐OMe—CGG UAC GAU CGC GGC GGG AUA‐FAM/Cy5‐3′) were acquired through Integrated DNA Technologies (Coralville, Iowa). Agarose (95%), 2‐furanmethanethiol (98%), dichloromethane (99.8%), formaldehyde (36.5–38%), gold(iii) chloride (99.98%), hydroquinone (99%), intracellular protein antibodies and primers of Beta‐actin, isopropanol (>99.9%), 6‐maleimidohexanoic acid (90%), methanol (>99.9%), N‐hydroxysuccinimide (NHS) (98%), silver nitrate (99%), sodium citrate (99%), sodium hydroxide (98%, pellets), tris(2‐carboxyethyl)phosphine hydrochloride solution (0.5 m), and dithiothreitol (DTT, 0.5 m) were all purchased and used without alteration from Millipore Sigma (St. Louis, MO). EDC (1‐ethyl‐3‐(3‐dimethylaminopropyl) carbodiimide hydrochloride), Dulbecco's modified Eagle formula (DMEM) 1×, antibiotic/antimycotic solution, LIVE/DEAD viability/cytotoxicity kit, and Quant‐iT PicoGreen dsDNA assay kit were purchased from ThermoFisher Scientific (Waltham, MA). Mounted 850 nm LED was acquired from ThorLabs, Inc. (Newton, NJ). Fetal bovine serum (FBS) and Matrigel (Matrix High Concentration, Phenol‐Red Free, LDEV‐free) were purchased through Corning (Corning, NY). All chemicals were used as received.
Bioinformatic Analyses of miR‐34a‐5p in Head and Neck Cancer
Bioinformatic analyses using the Kyoto Encyclopedia of Genes and Genomes (KEGG) were utilized to elucidate connections relating miR‐34a‐5p and synthetic miR‐34a mimics among canonical pathways in head and neck cancer. These canonical pathways within the KEGG database carry data representing target prediction analyses as well as direct, experimentally reported results measuring interactions among molecules, drugs targets, and gene expression data across a wide range of cell types. These analyses were achieved through the web‐based software known as ingenuity pathway analysis (IPA) from QIAGEN, where cell lines relating to head and neck cancer, esophageal cancer, and normal human keratinocytes were screened through known KEGG database for canonical pathways, small molecules, and gene/protein targets related to head and neck cancer oncogenesis. Specifically, miRNAs that were shown to have high targeting efficacy between TargetScanHuman (release 8.0), KEGG, and miRbase (release 22.1) were prioritized as possible therapeutic candidates. All data represented were for targets and molecular/cellular function associations where p < 0.00005.
CSS Nanoparticles Synthesis and Modification
Gold–silver–gold CSS nanoparticles were synthesized as described in previous literature.[ 25 , 50 ] Briefly, gold was reduced to synthesize 12 nm gold nanoparticle seeds for the gold core by adding 900 µL of sodium citrate (34 mm) to 30 mL of 290 µm gold chloride in water boiled under reflux and subjected to brisk stirring. The reflux was held for 10 min, where the color changed from pale yellow, through deep purple, to a final bright red color, where the mixture was removed from heat and allowed to cool down to the ambient temperature. The subsequent silver shell was grown by adding 200 µL of the newly synthesized gold seeds to 10 mL of ultrapure water and successively adding 60 µL of ascorbic acid (100 mm), 15 µL silver nitrate (100 mm), and 75 µL of sodium hydroxide (100 mm) at room temperature under vigorous stirring. The stable, gold–silver core–shell nanoparticles solution was then centrifuged at 1160 × g for 20 min, redispersed in 10 mL of ultrapure water, repeated three times. The outer gold shell was then grown by adding 100 µL of gold chloride (29 mm), where the 100 µL addition of hydroquinone (30 mm) trailed, plus 25 µL of sodium citrate (34 mm), maintaining stirring conditions at room temperature until no continued color shift was observed. Iterative shell formation thickness could again be controlled through this chemistry to achieve specific nanoparticle size, shell thickness, and absorbance properties.
Synthesis of Diels–Alder Linker and Nanoparticle Modification
The FDA linker (6‐(4‐(mercaptomethyl)–1,3‐dioxo‐1,3,3a,4,7,7a‐hexahydro‐2H‐4,7‐epoxyisoindol‐2‐yl)hexanoic acid) was synthesized as previously described.[ 25 , 28 , 29 , 30 , 47 , 48 , 53 ] Briefly, the linker was prepared at room temperature over 7 days and protected from light, mixing 2‐furanmethanethiol (0.5 g) and 6‐maleimidohexanoic acid (2.11 g) in a solution of dichloromethane and methanol (1:1) brought to a total volume of 20 mL. The linkers were then added to 1 mL aliquots of CSS nanoparticles (240 ppm) for 24 h at room temperature to permit thiol linkage of the linker at the CSS surface to occur. Consequently, aliquots of CSS nanoparticles were centrifuged (1200 × g for 10 min) and washed three times in isopropanol. The CSS nanoparticles were then resuspended in RNAse free water with injection of 100 µL of NHS:EDC (100 mm) mixture at a 1:1 molar ratio, and the respective 5′amine 3′ FAM miRNA mimics (4 µm, 30 µL) to support covalent pairing. Samples were subjected to centrifugation to remove CSS nanoparticles, then resuspended in RNAse‐free ultrapure water to allow ligands remaining to be detected. To determine the quantity of conjugated miRNA, ligands were removed by treating the samples with 10 µL of DTT. Measurement of fluorescence at 485 and 525 nm excitation and emission for FAM in the supernatant sample indicated the miRNA mimic concentration (Spectramax M5 Microplate/Cuvette Reader, Molecular Devices, PA, USA). Inductively coupled plasma atomic emission spectroscopy (ThermoFisher ICAP 7400 ICP‐AES, Waltham, MA, USA) was utilized to determine nanoparticle concentrations. Upon each surface conjugation step, the nanoparticles were measured for hydrodynamic size and zeta potential with a Malvern Zetasizer Nano ZS instrument (United Kingdom). UV–vis absorbance spectra were acquired through a LAMBDA 950 UV–vis–NIR spectrophotometer (Perkin‐Elmer, Waltham, MA, USA). TEM images were visualized using FEI Tecnai G2 Spirit BioTwin (FEI, Hillsboro, OR, USA).
Photothermal Release of 5′ FAM/PE‐Cy5‐miR‐34a Mimics
To measure the release rate of the miRNA molecules from CSS nanoparticle surfaces upon irradiation with 850 nm wavelength light, the nanoparticles were set up in solution as described previously,[ 25 , 28 , 29 , 30 ] where CSS‐miR34a nanoparticles were suspended in DI water, were illuminated at 850 nm at increasing incident light output energies, and collected for fluorescence measurements. The supernatants of the irradiated samples were separated post‐centrifugation (5000 × g, 10 min) and measured at 485/525 and 640/670 nm (excitation/emission) for the FAM fluorescence signal of the tagged miR34a mimic. All numbers were normalized to the DTT treated sample, representative of the total miRNA mimic loading on the CSS nanoparticles.
Cell Culture
Primary human squamous carcinoma cells (TE10) were isolated from human esophageal tissue at the Milton S Hershey Medical Center. These TE10 cells (culture passages 6–12) were cultured in DMEM media containing 10% FBS and 1% penicillin–streptomycin concentrations.
Cell Transfection
All experimental cells were transfected with this CSS‐FDA‐miR‐34a mimic nanoparticle delivery system (50 nm) and compared with miRNC controls (50 nm) as well as lipofectamine RNAiMAx control miR‐34a mimic transfections at equal miRNA mimic concentrations (50 nm) prepared agreeing with the manufacturer suggested protocol (Invitrogen).
Confocal Microscopy to Visualize Cellular Uptake and Release
Zeiss LSM 880 confocal microscope with FLIM (Zeiss, Oberkochen, Germany) was used to take images of the intracellular delivery of CSS nanoparticles. TE10 cells were seeded using Opti‐MEM medium in 35 mm glass‐bottom microwell dishes at 500 000 cells per dish growth density. After 16 h, ≈25 nm of FAM‐tagged CSS‐DA‐miR34a were added to the dish. The cells were allowed to incubate with CSS for 2 h, where they were then activated with 850 nm wavelength light. Following photoactivation, the samples were imaged at FAM (488/518 nm), PE‐Cy5 (640/670 nm), and Alexa Fluor 405 (405/420–480 nm) channels. For the best imaging results in this study, the use of PE‐Cy5 “red” signal was used to indicate the cytoplasmic region within the cell, and FAM “green” signal was used to render location of miR34a mimics released from CSS conjugation.
Intracellular Uptake via Flow Cytometry
Human esophageal squamous cell carcinomas (TE10 cells) were cultured, transfected, stained, and analyzed using methods previously described.[ 22 , 70 , 71 ] Briefly, TE10 cells grown in 35 mm cell culture dishes to 50% confluency (≈0.5 × 10⁶ cells total) were transfected with the CSS‐FDA‐miR34a nanoparticles in OptiMEM for 2 h. Cell samples were irradiated with 850 nm light for 10 J (≈1000 W m−2 over 1 cm2 for 100 s) and further incubated for 2 h in DMEM complete media. Cells were then washed with DPBS and detached from culture plates using Trypsin EDTA (0.25%, 2.21 mm) to remove the adherent cell culture. For the best flow cytometry results in this study, the use of FAM “green” signal was used to indicate the cytoplasmic region within the cell, and PE‐Cy5 “red” signal was used to render location of miR34a mimics released from CSS conjugation.
The suspended cells were centrifuged (250 × g, 5 min) to remove the wash supernatant, followed by direct resuspension in the fixative (4% paraformaldehyde) for 15 min at 4oC. Samples were once again washed and resuspended in DPBS before flow cytometry analysis. The fixed cells were loaded into a 96 well plate (250 µL per well, four wells per sample). Cells were examined with the LSRFortessa cytometer and visualized through the licensed software FlowJo (version 10). DPBS was used to measure the background noise and cells without CSS nanoparticles were used as the negative control. A flow rate of 10 µL min−1 was used; between 7000 and 10 000 events per second were recorded in all samples. The optimal threshold of the FITC and PE‐Cy5 channels was set at 3000.
Cell Viability
Cell viability of TE10 cells and control cell cultures were assessed using both Quant‐iT PicoGreen dsDNA assay kit (Invitrogen), and Live/Dead viability kit (Invitrogen) as previously described.[ 22 , 26 , 30 , 48 ] Briefly, cells were transfected with CSS‐DA‐miR34a/NC overnight for 16 h, followed by mounted 850 nm LED light exposure for ≈2 min at 100 mW (≈1000 W m−2 over 1 cm2 for 120 s). The LIVE/DEAD viability/cytotoxicity cell assay samples were imaged with an Olympus IX73 fluorescence microscope (Olympus, Center Valley, PA). Cells were washed using DPBS and incubated at 37 °C for 30 min with the 2 µm calcein AM and 4 µm EthD‐1 assay kit solutions. ImageJ (NIH, Bethesda, MD) was used for image processing. Proteinase K (from Tritirachium album, ≥30 units per mg protein) at 0.5 mg mL−1 was used to lyse and digest cell culture samples (16 h at 55oC) beginning 24 h following transfection with the CSS‐miRNA mimic nanoparticle treatment groups. Cell proliferation was quantified using direct DNA quantification using the Quant‐iTTM PicoGreen dsDNA fluorescence assay kit to quantify the amount of dsDNA per sample as previously described.[ 22 , 48 , 72 ] Total DNA content was used to determine the cell count. Equal volumes of Quant‐iTTM PicoGreen dsDNA reagent were combined with the volumes of the lysed and digested cell culture samples. The fluorescence intensity was measured at and excitation/emission spectra of 480/520 nm with the Spectramax iD3 Multi‐Mode Microplate Reader (Molecular Devices). Live/Dead images were taken 24, 48, and 72 h after light activation. Cell numbers were measured using the PicoGreen kit 72 h after the treatment.
Gene Expression
Total RNA was isolated with the Trizol isolation kit from harvested cells and the expression levels were measured by RT‐qPCR (Applied Biosystems) using Verso cDNA synthesis kit plus the PowerUp SYBR Green Master Mix together as previously described.[ 22 , 29 , 30 ] The sequences of primers were selected from PrimerBank and analyzed using Primer‐BLAST to make sure of their specificity as previously described.[ 22 , 30 ] The gene expression was normalized against 18S as a housekeeping gene, and data were analyzed using the −ΔΔCt method. The primers used in this study were listed in Figure S1 (Supporting Information).
Western Blot Analysis
The presence of apoptotic signals via analysis of intracellular protein content within the TE10 treatment groups were detected using methods comparable to previously described work.[ 22 , 30 , 70 , 71 ] Cells were washed in chilled DPBS, lysed with RIPA buffer containing the protease/phosphatase inhibitor cocktail mix included in the kit as described. A total of 50 µg protein was separated using 4–8% SDS/PAGE gels and displaced onto a nitrocellulose paper using the Trans‐Blot TURBO transfer system (Bio‐Rad) based on manufacturer‐recommended protocols. Primary antibodies for the active and inactive forms of the caspase‐3 protein, actCASP‐3 and proCASP‐3, respectively, were utilized to detect apoptotic signal among TE10 groups treated with CSS‐FDA‐miRNA mimic nanoparticles. Primary antibodies against the common intracellular protein Beta‐actin were used as the loading control. Images were cut into equal‐pixel area boxes in a grid fashion in ImageJ according to column/lane corresponding to the treatment groups from the post‐western blot images. Rows were determined using equidistant spacing between markers from the Precision Plus Protein Kaleidoscope position marking ladder.
Animal Studies
The studies were conducted according to the US Department of Health and Human Services' Guide for the Care and Use of Laboratory Animals and were approved by The Pennsylvania State University Institutional Animal Care and Use Committee under PRAMS201747826, In Vivo “Efficacy of Therapeutics”. The mice were randomly separated into three groups: DPBS Control, CSS‐FDA‐miRNC, and CSS‐FDA‐miR34a. Each treatment group was divided further into +/− NIR irradiation therapy within each mouse, as each mouse had two tumors growing for treatment (one tumor per flank). Primary human esophageal TE10 cancer cells (3 × 10⁶ cells) in a 1:1 solution with Matrigel were injected subcutaneously into both flanks of adult male and female nude Foxn1nu‐mice. When tumors reached 0.3–0.8 cm3 (0.3–0.8 g), xenografted mice then received CSS nanoparticle treatments by retro‐orbital IV injection (0.3 mg kg−1). In addition, the authors' previously described non‐coding control was found to have no impact on tumor growth or regression and was utilized as a treatment (positive) control. PBS injections served as a non‐treatment (negative) control. At 6–12 h after injection, the tumors were irradiated with 850 nm LED (Thor Labs) for ≈6 min (40J, ≈1250 W m−2 over 1 cm2 for 320 s). After irradiation, tumors were serially analyzed daily for 7 days, and the rate of primary tumor growth or regression was determined by plotting the means of two orthogonal diameters in the volume calculation against time. Tumor‐bearing mice were anesthetized under 5% isoflurane and administered PBS, CSS nanoparticle control CSS‐FDA‐miRNC (3.2 mg kg−1), or CSS‐FDA‐miR34a (3.2 mg kg−1) intravenously via retro‐orbital injection.
Based on prior pharmacokinetic studies, a time point of 6 hours post‐injection was chosen for the 850 nm light exposure.[ 30 ] Using previously described optical properties of murine skin,[ 73 ] the exposure time duration of 850 nm LED was calculated according to in vitro release analysis. Tumor irradiation occurred 6 h post‐injection for a duration of 6 min at 125 mW average power (≈1250 W m−2 over 1 cm2 for 360 s) using a mounted 850 nm LED (THORLABS) and controller. Mice remained anesthetized under 3% isoflurane throughout the procedure on a heating pad set to 37o C to maintain body temperature. At the endpoints, primary tumors were fixed, hematoxylin and eosin (H&E) stained, and paraffin embedded for analysis. All samples for tumor grade and depth of invasion were evaluated in a blinded manner. 20 mice in total were utilized. Mice were euthanized at study end using CO2 narcosis.
Biodistribution Analysis
Foxn1nu athymic mice at an age of 5 weeks were treated with CSS nanoparticles via IV, retro‐orbital injection. The mice were then sacrificed at a time of 6 h post‐injection for tissue analysis indicating the presence of the authors' CSS nanoparticles through ICP‐AES detection of gold and silver, as the constituents of these hybrid CSS nanoparticles. Organs were harvested from the Foxn1nu mice post‐sacrifice through careful dissection and resection of the main bodily organs (brain, heart, lungs, liver, kidney, and spleen) that were commonly examined during biodistribution and toxicity analyses. These organs were collected in vials and dissolved using varying percentages of hydrochloric acid, and similar piranha solutions, to dissolve and remove the organic material. These vials, containing inorganic material leftover from their respective, dissolved organic tissues were then analyzed for increased gold and silver concentration against non‐treated tissues from control Foxn1u mice, through ICP‐AES techniques using the ThermoFisher ICAP 7400 (Waltham, MA, USA).
Histological Analysis
Tissue samples were fixed using a solution of 10% neutral buffered formalin, incubated overnight, and followed by 70% ethanol wash. The samples were embedded in an agarose gel for stability and preservation, and finally further embedded in paraffin blocks prior to sectioning at an 8 µm depth. Tissue sections were stained with a basic H&E staining kit utilized in conjunction with the ST5010 Autostainer XL (Lecia Biosystems).
Statistical Analysis
The significance of the statistical analyses was evaluated using Prism GraphPad, employing either a student's t‐test or a one‐way ANOVA test. A P‐value of less than 0.05 was deemed to indicate a significant difference.
Conflict of Interest
The authors declare no conflict of interest.
Supporting information
Supporting Information
Acknowledgements
This work was supported partially by the National Institute of Dental and Craniofacial Research of the National Institutes of Health under award number (RDE024790A), the Office of the Assistant Secretary of Defense for Health Affairs through the Peer Reviewed Medical Research Program under Award No. W81XWH‐18‐1‐0115, the USDA National Institute of Food and Federal Appropriations under Project PEN04607 with Accession number 1009993, and the Penn State Institute of Energy and the Environment. The authors would like to give thanks to all who were involved in data collection, writing, editing, and mentorship toward publication of this manuscript.
Alden N. A., Yeingst T. J., Pfeiffer H. M., Celik N., Arrizabalaga J. H., Helton A. M., Liu Y., Stairs D. B., Glick A. B., Goyal N., Hayes D. J., Near‐Infrared Induced miR‐34a Delivery from Nanoparticles in Esophageal Cancer Treatment. Adv. Healthcare Mater. 2024, 13, 2303593. 10.1002/adhm.202303593
Data Availability Statement
The data that support the findings of this study are available from the corresponding author upon reasonable request.
References
- 1. Trotti A., Byhardt R., Stetz J., Gwede C., Corn B., Fu K., Gunderson L., McCormick B., Morrisintegral M., Rich T., Shipley W., Curran W., Int J Radiat Oncol Biol Phys 2000, 47, 13. [DOI] [PubMed] [Google Scholar]
- 2. Carelle N., Piotto E., Bellanger A., Germanaud J., Thuillier A., Khayat D., Cancer 2002, 95, 155. [DOI] [PubMed] [Google Scholar]
- 3. Pattabiraman D. R., Weinberg R. A., Nat Rev Drug Discov 2014, 13, 497. [DOI] [PMC free article] [PubMed] [Google Scholar]
- 4. Cancer Facts and Figures 2022, American Cancer Society, 2022, https://www.cancer.org/research/cancer‐facts‐statistics/all‐cancer‐facts‐figures/cancer‐facts‐figures‐2022.html (accessed: Febuary 2023).
- 5. Wang Y., Grainger D. W., Front Chem Sci Eng 2014, 8, 265. [Google Scholar]
- 6. Prabhakar U., Maeda H., Jain R. K., Sevick‐Muraca E. M., Zamboni W., Farokhzad O. C., Barry S. T., Gabizon A., Grodzinski P., Blakey D. C., Cancer Res. 2013, 73, 2412. [DOI] [PMC free article] [PubMed] [Google Scholar]
- 7. Kwon I. K., Lee S. C., Han B., Park K., J. Controlled Release 2012, 164, 108. [DOI] [PMC free article] [PubMed] [Google Scholar]
- 8. Chen Y., Gao D. Y., Huang L., Adv Drug Deliv Rev 2015, 81, 128. [DOI] [PMC free article] [PubMed] [Google Scholar]
- 9. Bae Y. H., Park K., J. Controlled Release 2011, 153, 198. [DOI] [PMC free article] [PubMed] [Google Scholar]
- 10. Bailey M., Christoforidou Z., Lewis M. C., Vet Immunol Immunopathol 2013, 152, 13. [DOI] [PubMed] [Google Scholar]
- 11. Rupaimoole R., Slack F. J., Nat Rev Drug Discov 2017, 16, 203. [DOI] [PubMed] [Google Scholar]
- 12. Pereira D. M., Rodrigues P. M., Borralho P. M., Rodrigues C. M., Drug Discov Today 2013, 18, 282. [DOI] [PubMed] [Google Scholar]
- 13. Deng X., Cao M., Zhang J., Hu K., Yin Z., Zhou Z., Xiao X., Yang Y., Sheng W., Wu Y., Zeng Y., Biomaterials 2014, 35, 4333. [DOI] [PubMed] [Google Scholar]
- 14. Chen N. T., Cheng S. H., Liu C. P., Souris J. S., Chen C. T., Mou C. Y., Lo L. W., Int. J. Mol. Sci. 2012, 13, 16598. [DOI] [PMC free article] [PubMed] [Google Scholar]
- 15. Podolsky M. A., Bailey J. T., Gunderson A. J., Oakes C. J., Breech K., Glick A. B., Cancer Immunol. Res. 2017, 5, 198. [DOI] [PMC free article] [PubMed] [Google Scholar]
- 16. Beg M. S., Brenner A. J., Sachdev J., Borad M., Kang Y. K., Stoudemire J., Smith S., Bader A. G., Kim S., Hong D. S., Cell Death Differ. 2010, 17, 193.19461653 [Google Scholar]
- 17. Hermeking H., Cell Death Differ. 2010, 17, 193. [DOI] [PubMed] [Google Scholar]
- 18. Agostini M., Knight R. A., OncoTargets Ther. 2014, 5, 872. [DOI] [PMC free article] [PubMed] [Google Scholar]
- 19. Pegtel D. M., Cosmopoulos K., Thorley‐Lawson D. A., van Eijndhoven M. A., Hopmans E. S., Lindenberg J. L., de Gruijl T. D., Würdinger T., Middeldorp J. M., Proc Natl Acad Sci U S A 2010, 107, 6328. [DOI] [PMC free article] [PubMed] [Google Scholar]
- 20. Hatakeyama H., Murata M., Sato Y., Takahashi M., Minakawa N., Matsuda A., Harashima H., J. Controlled Release 2014, 173, 43. [PubMed] [Google Scholar]
- 21. Maurisse R., De Semir D., Emamekhoo H., Bedayat B., Abdolmohammadi A., Parsi H., Gruenert D. C., BMC Biotechnol. 2010, 10, 9. [DOI] [PMC free article] [PubMed] [Google Scholar]
- 22. Alden N. A., Arrizabalaga J. H., Liu Y., Amin S., Gowda K., Yao S., Archetti M., Glick A. B., Hayes D. J., Langmuir 2022, 38, 9833. [DOI] [PMC free article] [PubMed] [Google Scholar]
- 23. Yin H., Kanasty R. L., Eltoukhy A. A., Vegas A. J., Dorkin J. R., Anderson D. G., Nat. Rev. Genet. 2014, 15, 541. [DOI] [PubMed] [Google Scholar]
- 24. Singh S., Narang A. S., Mahato R. I., Pharm. Res. 2011, 28, 2996. [DOI] [PubMed] [Google Scholar]
- 25. Kumal R. R., Abu‐Laban M., Hamal P., Kruger B., Smith H. T., Hayes D. J., Haber L. H., J. Phys. Chem. C 2018, 122, 19699. [DOI] [PMC free article] [PubMed] [Google Scholar]
- 26. Arrizabalaga J. H., Smallcomb M., Abu‐Laban M., Liu Y., Yeingst T. J., Dhawan A., Simon J. C., Hayes D. J., ACS Appl Bio Mater 2022, 5, 3212. [DOI] [PMC free article] [PubMed] [Google Scholar]
- 27. Gregoritza M., Brandl F. P., Eur. J. Pharm. Biopharm. 2015, 97, 438. [DOI] [PubMed] [Google Scholar]
- 28. Abu‐Laban M., Kumal R. R., Casey J., Becca J., Lamaster D., Pacheco C. N., Sykes D. G., Jensen L., Haber L. H., Hayes D. J., J. Colloid Interface Sci. 2018, 526, 312. [DOI] [PMC free article] [PubMed] [Google Scholar]
- 29. Abu‐Laban M., Hamal P., Arrizabalaga J. H., Forghani A., Dikkumbura A. S., Kumal R. R., Haber L. H., Hayes D. J., Small 2019, 15, 1902864. [DOI] [PMC free article] [PubMed] [Google Scholar]
- 30. Liu Y., Bailey J. T., Abu‐Laban M., Li S., Chen C., Glick A. B., Hayes D. J., Biomaterials 2020, 256, 120212. [DOI] [PMC free article] [PubMed] [Google Scholar]
- 31. Lim L. P., Glasner M. E., Yekta S., Burge C. B., Bartel D. P., Science 2003, 299, 1540. [DOI] [PubMed] [Google Scholar]
- 32. Lewis B. P., Burge C. B., Bartel D. P., Cell 2005, 120, 15. [DOI] [PubMed] [Google Scholar]
- 33. Grimson A., Farh K. K., Johnston W. K., Garrett‐Engele P., Lim L. P., Bartel D. P., Mol. Cell 2007, 27, 91. [DOI] [PMC free article] [PubMed] [Google Scholar]
- 34. Garzon R., Calin G. A., Annu. Rev. Med. 2009, 60, 167. [DOI] [PubMed] [Google Scholar]
- 35. Esquela‐Kerscher A., Slack F. J., Nat. Rev. Cancer 2006, 6, 259. [DOI] [PubMed] [Google Scholar]
- 36. Croce C. M., Calin G. A., Cell 2005, 122, 6. [DOI] [PubMed] [Google Scholar]
- 37. Roop D. R., Lowy D. R., Tambourin P. E., Strickland J., Harper J. R., Balaschak M., Spangler E. F., Yuspa S. H., Nature 1986, 323, 822. [DOI] [PubMed] [Google Scholar]
- 38. Felix T. F., Lapa R. M. L., de Carvalho M., Bertoni N., Tokar T., Oliveira R. A., Rodrigues M. A. M., Hasimoto C. N., Oliveira W. K., Pelafsky L., Spadella C. T., Llanos J. C., Silva F. G., Lam W. L., Rogatto S. R., Amorim L. S., Drigo S. A., Carvalho R. F., PLoS One 2019, 14, e0217421. [DOI] [PMC free article] [PubMed] [Google Scholar]
- 39. Wang G., Cao X., Lai S., Luo X., Feng Y., Wu J., Ning Q., Xia X., Wang J., Gong J., Hu J., Oncogene 2015, 34, 912. [DOI] [PubMed] [Google Scholar]
- 40. Azizi M., Teimoori‐Toolabi L., Arzanani M. K., Azadmanesh K., Fard‐Esfahani P., Zeinali S., Cancer Biol Ther 2014, 15, 419. [DOI] [PMC free article] [PubMed] [Google Scholar]
- 41. Ge H. L. B., Hu W. X., Li R. J., Jin H., Gao M. M., Ding C. M., Int. J. Clin. Exp. Pathol. 2015, 8, 800. [PMC free article] [PubMed] [Google Scholar]
- 42. Song Y. X., Yue Z. Y., Wang Z. N., Xu Y. Y., Luo Y., Xu H. M., Zhang X., Jiang L., Xing C. Z., Zhang Y., Mol Cancer 2011, 10, 1. [DOI] [PMC free article] [PubMed] [Google Scholar]
- 43. Lu L., Liu Q., Wang P., Wu Y., Liu X., Weng C., Fang X., Li B., Cao X., Mao H., Wang L., Guan M., Wang W., Liu G., BMC Cancer 2019, 19, 209. [DOI] [PMC free article] [PubMed] [Google Scholar]
- 44. Song Y., Xu Y., Wang Z., Chen Y., Yue Z., Gao P., Xing C., Xu H., Int. J. Cancer 2012, 131, 1042. [DOI] [PubMed] [Google Scholar]
- 45. Zhao G., Zhang J. G., Liu Y., Qin Q., Wang B., Tian K., Liu L., Li X., Niu Y., Deng S. C., Wang C. Y., Mol. Cancer Ther. 2013, 12, 83. [DOI] [PubMed] [Google Scholar]
- 46. Zhang J. G., Shi Y., Hong D. F., Song M., Huang D., Wang C. Y., Zhao G., Sci. Rep. 2015, 5, 8087. [DOI] [PMC free article] [PubMed] [Google Scholar]
- 47. Arrizabalaga J. H., Casey J. S., Becca J. C., Jensen L., Hayes D. J., JCIS Open 2021, 4, 100034. [Google Scholar]
- 48. Arrizabalaga J. H., Casey J. S., Becca J. C., Liu Y., Jensen L., Hayes D. J., Biomed. Eng. Adv. 2022, 3, 100031. [Google Scholar]
- 49. Darbha G. K., Ray A., Ray P. C., ACS Nano 2007, 1, 208. [DOI] [PubMed] [Google Scholar]
- 50. Karam T. E., Smith H. T., Haber L. H., J. Phys. Chem. C 2015, 119, 18573. [Google Scholar]
- 51. Jiang W., BY K., Rutka J. T., Chan W. C., Nat. Nanotechnol. 2008, 3, 145. [DOI] [PubMed] [Google Scholar]
- 52. Tomic S., Ethokic J., Vasilijic S., Ogrinc N., Rudolf R., Pelicon P., Vucevic D., Milosavljevic P., Jankovic S., Anzel I., Rajkovic J., Rupnik M. S., Friedrich B., PLoS One 2014, 9, 96584. [DOI] [PMC free article] [PubMed] [Google Scholar]
- 53. Casey J. S., Arrizabalaga J. H., Abu‐Laban M., Becca J. C., Rose B. J., Strickland K. T., Bursavich J. B., McCann J. S., Pacheco C. N., Jensen L., Attaluri A., Hayes D. J., J. Colloid Interface Sci. 2020, 571, 348. [DOI] [PMC free article] [PubMed] [Google Scholar]
- 54. Ghosh D., Chattopadhyay N., J. Lumin. 2015, 160, 223. [Google Scholar]
- 55. Qureshi A. T., Monroe W. T., Lopez M. J., Janes M. E., Dasa V., Park S., Amirsadeghi A., Hayes D. J., J. Appl. Polym. Sci. 2011, 120, 3042. [Google Scholar]
- 56. Brown P. K., Qureshi A. T., Moll A. N., Hayes D. J., Monroe W. T., ACS Nano 2013, 7, 2948. [DOI] [PubMed] [Google Scholar]
- 57. Peter M. E., Cell Cycle 2009, 8, 843. [DOI] [PMC free article] [PubMed] [Google Scholar]
- 58. Hamano R., Miyata H., Yamasaki M., Kurokawa Y., Hara J., Moon J. H., Nakajima K., Takiguchi S., Fujiwara Y., Mori M., Doki Y., Clin. Cancer Res. 2011, 17, 3029. [DOI] [PubMed] [Google Scholar]
- 59. Agarwal V., Bell G. W., Nam J. W., Bartel D. P., Elife 2015, 4, 10.7554/eLife.05005. [DOI] [PMC free article] [PubMed] [Google Scholar]
- 60. Gastebois C., Chanon S., Rome S., Durand C., Pelascini E., Jalabert A., Euthine V., Pialoux V., Blanc S., Simon C., Lefai E., Physiol Rep 2016, 4, 12902. [DOI] [PMC free article] [PubMed] [Google Scholar]
- 61. Cimino D., De Pitta C., Orso F., Zampini M., Casara S., Penna E., Quaglino E., Forni M., Damasco C., Pinatel E., Ponzone R., Romualdi C., Brisken C., De Bortoli M., Biglia N., Provero P., Lanfranchi G., Taverna D., FASEB J. 2013, 27, 1223. [DOI] [PubMed] [Google Scholar]
- 62. Shi J., Wang L., Zhang J., Ma R., Gao J., Liu Y., Zhang C., Zhang Z., Biomaterials 2014, 35, 5847. [DOI] [PubMed] [Google Scholar]
- 63. Ren Y., Wang R., Gao L., Li K., Zhou X., Guo H., Liu C., Han D., Tian J., Ye Q., Hu Y. T., Sun D., Yuan X., Zhang N., J. Controlled Release 2016, 228, 74. [DOI] [PubMed] [Google Scholar]
- 64. Feng L., Xie R., Wang C., Gai S., He F., Yang D., Yang P., Lin J., ACS Nano 2018, 12, 11000. [DOI] [PubMed] [Google Scholar]
- 65. Xue Y., Zhang S., Huang Y., Zhang T., Liu X., Hu Y., Zhang Z., Tang M., J. Appl. Toxicol. 2012, 32, 890. [DOI] [PubMed] [Google Scholar]
- 66. Recordati C., De Maglie M., Bianchessi S., Argentiere S., Cella C., Mattiello S., Cubadda F., Aureli F., D'Amato M., Raggi A., Lenardi C., Milani P., Scanziani E., Part. Fibre Toxicol. 2016, 13, 12. [DOI] [PMC free article] [PubMed] [Google Scholar]
- 67. Gustafson H. H., Holt‐Casper D., Grainger D. W., Ghandehari H., Nano Today 2015, 10, 487. [DOI] [PMC free article] [PubMed] [Google Scholar]
- 68. Day C. P., Merlino G., Van Dyke T., Cell 2015, 163, 39. [DOI] [PMC free article] [PubMed] [Google Scholar]
- 69. Nakamura Y., Mochida A., Choyke P. L., Kobayashi H., Bioconjug Chem 2016, 27, 2225. [DOI] [PMC free article] [PubMed] [Google Scholar]
- 70. Lehman H. L., Kidacki M., Warrick J. I., Stairs D. B., OncoTargets Ther. 2018, 9, 11180. [DOI] [PMC free article] [PubMed] [Google Scholar]
- 71. Nelson A. M., Cong Z., Gettle S. L., Longenecker A. L., Kidacki M., Kirby J. S., Adams D. R., Stairs D. B., Danby F. W., Exp Dermatol 2019, 28, 867. [DOI] [PubMed] [Google Scholar]
- 72. Arrizabalaga J. H., Nollert M. U., J. Mech. Behav. Biomed. Mater. 2020, 106, 103729. [DOI] [PubMed] [Google Scholar]
- 73. Sabino C. P., Deana A. M., Yoshimura T. M., da Silva D. F., Franca C. M., Hamblin M. R., Ribeiro M. S., J Photochem Photobiol B 2016, 160, 72. [DOI] [PMC free article] [PubMed] [Google Scholar]
Associated Data
This section collects any data citations, data availability statements, or supplementary materials included in this article.
Supplementary Materials
Supporting Information
Data Availability Statement
The data that support the findings of this study are available from the corresponding author upon reasonable request.