Abstract
The effects of NAMI-A, [H2im][trans-RuCl4(dmso-S)(Him)], a new metal-based agent for treating tumor metastases, have been investigated in vitro on splenocytes, ConA- or LPS-activated T and B lymphoblasts, and thymocytes. Splenocytes and thymocytes exposed for 1 h to 0.01–0.1-mM NAMI-A do not change their mitochondrial functionality, cell cycle distribution, protein synthesis, and CD44 expression in comparison to untreated control samples. Instead, mitochondrial functionality increased 24 h after treatment in a fraction of splenocytes. The same treatment reduced mitochondrial functionality and S phase of the cell cycle in T and B blasts (already after 1 h treatment) and reduced CD44 expression on B blasts, 24 h after treatment. On cocultures of splenocytes and metastatic cells (metGM) (1:1), NAMI-A induces a selective depolarization of mitochondrial membrane potential of metGM cells, while it stimulates splenocytes (mainly lymphocytes), as shown by the increase of the S phase, nitric oxide production, and adhesion onto metastatic cells. This, in turn, reduces the number of metastatic cells and results in the increased ratio between splenocytes and metGM in favor of diploid cells (doubling from one to two). Rosetting of leukocytes onto metastatic cells correlates with induction of CD54 expression on tumor cells after NAMI-A in vivo treatment, which in turn, might contribute to metastasis recognition by cytotoxic lymphocytes. The overall antimetastatic activity displayed by NAMI-A might therefore be the result of complex interactions with tumor cells, on which it displays selective antitumor activity, and with host immune cells through which it promotes activation of host immune defenses involved in tumor suppression.
Keywords: Cell cycle, Cocultures, Host immune cells, Metastatic cells, Mitochondrial functionality, NAMI-A
Introduction
The growth and metastatic spread of tumor cells depend to a large extent on their ability to escape host immune surveillance and overcome host defenses [10]. Invasion occurs within a tumor-host microenvironment, where stromal and tumor cells exchange enzymes and cytokines that modify the local extracellular matrix, stimulate migration, and promote proliferation and survival [30]. Thus, throughout the entire process of progression and metastasis, the microenvironment of the local host tissue represents an active participant [14]. In this contest, a series of fundamental steps are involved in antitumor immunity and concern (a) extravasation of blood lymphocytes into interstitium, (b) locomotion through extracellular matrix to the site of tumor growth, (c) effector cell recognition of the tumor target with cell/cell contact and binding of adhesion receptors, (d) T-cell receptor binding to histocompatibility and tumor antigens, and (e) tumor cell lysis [1, 13].
Antineoplastic therapy significantly contributes to the immune deficiency observed in cancer patients leading to increased susceptibility to opportunistic infections [15, 19, 30]. In addition to myelosuppression, cytotoxic drugs cause acute and persistent depletion of lymphocytes, often by induction of apoptosis in mature T and B cells [30]. Chemotherapy-induced lymphopenia is primarily related to T-cell depletion, with CD4+ cells generally more involved than the CD8 subset [15]. Restoration of T-cell populations, following cytotoxic antineoplastic therapy, is a complex process that requires thymic-dependent pathways. Since the thymus undergoes an age-dependent decline, lymphopenia induced by T cell–depleting therapy results in prolonged and chronic CD4+ T-cell depletion in adults [15].
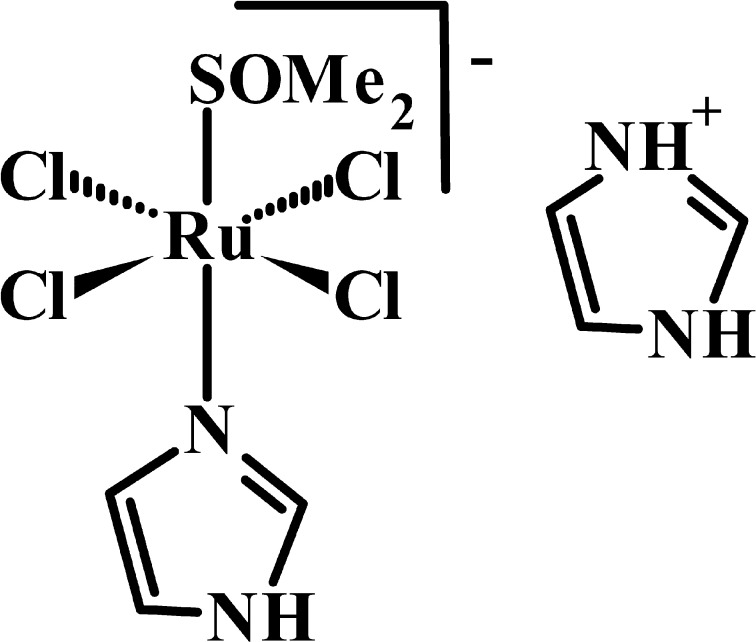
Recent efforts are focused on development of drugs with selective anticancer/antimetastasis activity and with minimal immune suppressive effects. In these terms, NAMI-A, [H2im][trans-RuCl4(dmso-S)(Him)] (Him = imidazole, dmso-S = sulphur bonded dimethylsulfoxide), Fig. 1, showed selective effects on solid tumor metastases with limited host toxicity [5, 26–28]. In CBA mice carrying s.c. and i.m. MCa mammary carcinoma implants, NAMI-A increased CD3+ tumor-infiltrating lymphocytes with a significant increase of the CD8+ over the CD4+ subpopulation [16, 27]. More recently, it was shown that intratumor treatment [11] with NAMI-A increases tumor-infiltrating lymphocytes by up-regulating CD44 on circulating blood lymphocytes [21]. It is well documented that up-regulation of CD44 targets lymphocytes to specific inflammatory sites by mediating lymphocyte adhesion and rolling on endothelium, the first step during lymphocyte extravasation, via hyaluronic acid interactions [8, 12, 18, 29].
Fig. 1.
Chemical structure of NAMI-A, [H2im][trans-RuCl4(dmso-S)(Him)]
Since NAMI-A is the first ruthenium-based complex to undergo clinical trials, and since no specific data are available on its effects on hosts’ immune systems, we thought it worthy of interest to investigate the effects of NAMI-A on host lymphocytes. Our models further focus on the effects of NAMI-A on cocultures of metastatic cells and splenocytes—i.e., the situation in which both cell types are present. In particular, we investigated the effects in two experimental conditions consisting of a pretreatment of metastatic cells and subsequent coculturing with splenocytes or a simultaneous treatment of both cell populations. The study is centered on the differential effects of NAMI-A on immune and on tumor cells by examining changes of mitochondrial functionality, nitric oxide production, CD44 expression, and cell distribution among cell cycle phases.
Materials and methods
Isolation of leukocytes
Leukocytes were isolated from spleen or thymus of healthy CBA male mice and processed to obtain single-cell suspensions. Briefly, organs were placed on a sterile Petri dish with RPMI FBS 5% and processed with a sterile syringe until the complete breaking out of the tissue. Cell suspension was filtered through sterile gauze and centrifuged at 400 g, for 5 min at 4°C. Erythrocytes were lysed by hypotonic solution (0.2% NaCl). T and B lymphoblasts were obtained by in vitro activation of splenocytes with Concanavalin A (ConA, 2.5 μg/ml; Sigma) and lypopolysaccharide (LPS, E. Coli 055:B5 W, 10 μg/ml), respectively, in 25 cm2 culture flasks (1×10⁶/ml) maintained upright for 72 h, at 37°C, in 5% CO2. Cells were maintained in complete medium (CM) consisting of RPMI 1640 (Sigma) added with 10% FBS, L-glutamine (2 mM), penicillin/streptomycin (100 U/100 μg), 1% non-essential amino acids ×100, 50 μg/ml gentamicin, 0.37-mM sodium pyruvate, 25-mM HEPES buffer, 50-nM β-mercaptoethanol (all from EuroClone, Paington, UK).
Splenocytes, lymphoblasts, and thymocytes used for treatment
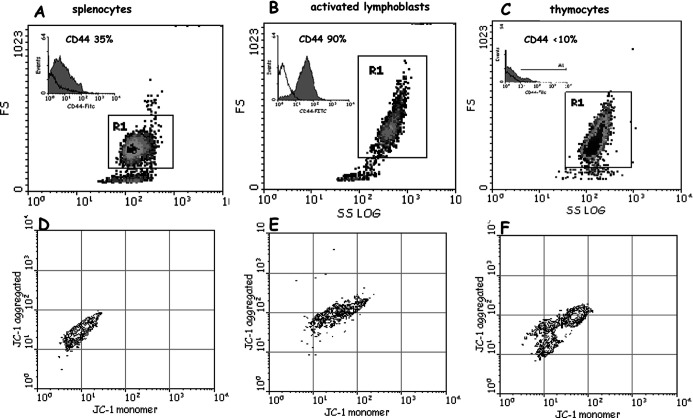
Splenocytes obtained from spleen of healthy CBA male mice (46% CD3+ and 48% CD19+; 95–98% G0/G1 phase, 1–2% S phase ) were used (Fig. 2A). Activation of lymphocytes to T and B blasts (almost entirely positive to CD3 and CD19, respectively) resulted in the increase of cell size and granularity (Fig. 2B), increase of S phase of the cell cycle (from 1 to 20%), and increase of protein synthesis and of mitochondrial functionality (Fig. 2E). Thymocytes were 20% in the S phase of the cell cycle, indicating an active population involved in maturation and generation of mature T cells (Fig. 2C). Besides differences in the activation/maturation state, these cells differed in the expression of CD44, which ranged from 80–90% (activated T and B blasts), to 30–40% (splenocytes,) and to <10% (thymocytes) (see inserts in Fig. 2A–C). Mitochondrial functionality of resting splenocytes, activated lymphoblasts, and thymocytes was analyzed as well (Fig. 2D–F).
Fig. 2A–F.
Dot plots (SSlog/FS side scatter/forward scatter) of splenocytes (A), activated lymphoblasts (B), and thymocytes (C). CD44 expression of each cell population (inserts). D–F Mitochondrial functionality of the same cells determined by the JC-1 probe (see “Methods”)
Tumor cell line
This cell line (metGM cells) was developed in our laboratory [20] starting from metastatic foci that had spontaneously arisen in the lungs of MCa mammary tumor–bearing mice [23]. MetGM cell line is maintained by in vitro passages, it shows a stable phenotype over a number of passages, the ability to grow in vitro after harvesting from liquid nitrogen, and it maintains the tumorigenic activity after in vivo re-inoculation. MetGM cells are aneuploid with a DNA index of 1.64, and they display invasive properties such as the ability to cross ECM-coated membranes, the release of gelatinase (MMP9), and the expression of the invasion marker CD44. For propagation, cells are sown in a tissue culture flask in CM (consisting of RPMI 1640, 10% FBS, 2-mM L-glutamine, penicillin/streptomycin [100 U/100 μg], 1% NE amino acids (×100), 50 μg/ml gentamicin, and 0.37-mM sodium pyruvate) and diluted 1:4 with fresh CM biweekly. For the experiments, cells are collected from the culture flask, washed twice with phosphate-buffered saline (PBS) and counted by trypan blue exclusion test. MetGM cells are then diluted to the opportune concentration with PBS or culture CM.
Cocultures of metGM cells and splenocytes
For (1) treatment (PT) of metGM cells: metGM cells were treated with NAMI-A for 1 h, washed 2×PBS, and then cocultured in CM with fresh splenocytes (1:1) for a further 24 h. And (2) simultaneous treatment (ST) of cocultures: metGM cells and fresh splenocytes (1:1) were simultaneously treated with NAMI-A for 1 h, washed, and then cocultured for a further 24 h. The doses of NAMI-A used were 0.1 and 1 mM. Mitochondrial functionality, cell cycle distribution, NO production, and percentage of cell populations in cocultures were analyzed 1 h and 24 h after NAMI-A treatment.
In vitro treatment with NAMI-A
Samples were treated with NAMI-A (0.01–1 mM) for 1 h, at 37°C, in 5% CO2. NAMI-A was dissolved in PBS immediately before treatment and sterilized by filtration (Sartorius Minisart AG, Göttingen, Germany). Cells (0.5×10⁶) were incubated with 1 ml of the reported concentration of NAMI-A (controls in PBS); after treatment, cells were washed twice with PBS and resuspended in PBS or CM depending on the analysis to be performed. (PBS comprised 8-g NaCl, 0.2-g KCl, 1.15-g Na2HPO4, 0.2-g KH2PO4 for 1 l, pH 7.4).
Monoclonal antibody staining
Cells (0.5×10⁶) were stained with fluorescent monoclonal antibodies (MoAb): CD3-FITC (2 μg/0.5×106 cells), CD19-PE (0.2 μg/106 cells), CD4-FITC (1 μg/106 cells), CD8-PE (0.2 μg/106 cells), and CD44-FITC (4 μg/106 cells) (all from Southern Biotechnology Associates, Birmingham, AL, USA) for 30 min at 4°C in the dark. At the end of the incubation time, unbound antibody was removed by two washes and analyzed with a flow cytometer. Aliquots treated with an irrelevant isotype match and FITC/PE (fluorescein isothiocyanate / phycoerythrin) MoAb, run in parallel, were used to set the gates in the monoparametric histogram to include less than 2% aspecific fluorescence events.
Analysis of DNA/protein content (PI/FITC)
Cells (0.5×10⁶) were fixed in 70% ethanol for at least 4 h, washed twice with PBS, and allowed to balance in PBS for 2 h. Cells were stained overnight with 0.5 ml of a PBS solution containing 10-μg PI, 0.25-ng FITC, and-4 μg RNase (all from Sigma).
Mitochondrial functionality analysis
Mitochondrial functionality was determined by the JC-1 probe (5,5′,6,6′-tetrachloro-1,1′,3,3′-tetraethyl- benzimidazolcarbocyanine iodide; Molecular Probes Europe BV, Leiden, The Netherlands), a lipophilic dye that exhibits potential-dependent accumulation in mitochondria, indicated by a shift of fluorescence emission from green (~525 nm) to red (~590 nm) [6, 7]. Briefly, 0.5×10⁶ cells were suspended in 990-μl RPMI-FBS 10%, added with 10 μl of JC-1 probe (1 mg/1 ml dmso) on vortex and incubated for 15 min at 37°C in 5% CO2 in the dark. At the end of the incubation time, cells were washed twice with PBS (37°C), resuspended in PBS, and immediately analyzed by flow cytometer, acquiring FL1/FL2 on viable cells (those excluding PI, run in parallel). JC-1 monomer was measured at FL1-PMT, JC-1 aggregated at FL2-PMT.
All flow cytometric analyses were performed on a Coulter Epics XL flow cytometer (Coulter, Miami, FL, USA). For each sample, at least 10,000 events were acquired. Data were elaborated with the WinMDI version 2.7 (Scripps Research Institute, La Jolla, CA, USA) and with Multicycle (cell cycle).
Nitric oxide measurement
Nitric oxide (NO) was determined on supernatants of cocultures of metGM cells and splenocytes (1:1) with Griess reagent (Sigma) according to Stuher and Nathan [32]. Briefly, supernatants of cocultures (100 μl) were put in microtiter 96-well plates and added with 100-μl Griess reagent (1% naphtyletylendiamine to 1% sulphanilamide, 1:1). Optical density was measured at 540 nm. NaNO2 was used as standard.
Scanning electron micrographs (SEM)
After treatment with NAMI-A, cocultures were resuspended in PBS and diluted to 20×106 cells/ml. A drop of cell suspension was layered onto slides previously coated with poly-L-lysine solution (0.1 mg/ml; Sigma), and allowed to adhere for 2 h. Cells were then fixed with 2.5% glutaraldehyde in 0.1-M cacodylate buffer overnight. All procedures were at 4°C. Samples were dehydrated in graded ethanol, vacuum dried, and mounted onto aluminium (SEM) mounts. After sputter coating with gold, they were submitted for analysis with a Leica Stereoscan 430i instrument, at the Electronic Microscopy Section, CSPA, University of Trieste, Italy.
Animal studies
Animal studies were carried out according to the guidelines currently in force in Italy and according to the DHHS guide for the care and use of laboratory animals [9].
Statistical analysis
Data were submitted to computer-assisted statistical analysis (Instat II, Graphpad Software, version 2.05) using the Student-Newman-Keuls test for analysis of variance (ANOVA) and t-test for grouped data. Data were considered to be statistically significant for *p<0.05; **p<0.01; and ***p<0.001.
Results
Effects of NAMI-A on splenocytes, thymocytes, and activated lymphoblasts
Mitochondrial functionality
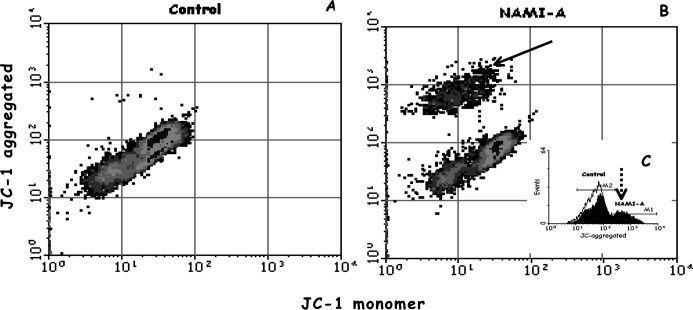
Splenocytes, ConA- or LPS-activated T and B lymphoblasts, and thymocytes (Fig. 2) were treated with 0.01- and 0.1-mM NAMI-A. Mitochondrial functionality was measured immediately after 1 h of treatment and at 24 h (Table 1, data reported as T/C×100). While splenocytes were not affected by NAMI-A, activated T and B blasts showed reduction of mitochondrial functionality (detected as the reduction of mitochondrial membrane potential, ΔΨ), already after 1 h of treatment even at the lowest dose (0.01 mM); thymocytes showed intermediate sensitivity, being affected only at the highest dose used (0.1 mM). Cells cultured for further 24 h after treatment showed no variations of mitochondrial functionality in comparison to controls (Table 1). Obversely, 24 h after treatment, splenocytes formed an activated population characterized by increased mitochondrial functionality (Fig. 3B, arrow), corresponding to an increased mean fluorescence intensity (MFI) of JC-1 aggregated at both doses of NAMI-A used (Fig. 3B, C, dotted arrow; Table 1).
Table 1.
Mitochondrial functionality of splenocytes, thymocytes, T and B blasts immediately after 1 h of treatment, and 24 h after treatment with NAMI-A (0.01, 0.1 mM). Data are expressed as T/C×100. Statistical analysis by Student-Newman-Keuls test
| JC-1 | Splenocytes | Thymocytes | Lymphoblasts | |||||
|---|---|---|---|---|---|---|---|---|
| T blasts | B blasts | |||||||
| 1 h | 24 h | 1 h | 24 h | 1 h | 24 h | 1 h | 24 h | |
| 0.01 (mM) | 78.3±18.5 | 191±10.8* | 93.1±4.47 | 100±5.62 | 86.8±2.20** | 94.2±3.09 | 88.9±1.07*** | 98.9±1.66 |
| 0.1 (mM) | 78.9±7.86 | 200±37.4* | 83.7±1.81** | 92.0±4.99 | 79.7±3.47** | 98.3 ±6.95 | 82.6±1.70*** | 98.3±6.95 |
*p<0.05; **p<0.01; ***p<0.001, vs control
Fig. 3A–C.
NAMI-A–induced activation of splenocytes, shown as the increase of mitochondrial functionality 24 h after treatment (0.01 mM). A Control cells, B NAMI-A treated cells and the activated population (arrow). Insert C shows increased MFI of JC-1 aggregated relative to the activated population (dotted arrow): black line control cells, grey areas NAMI-A treated cells
Cell cycle distribution and protein content
Immune cells in Fig. 2 were double stained with FITC and PI to determine simultaneously their total protein content and cell cycle distribution. No changes of cell cycle distribution were detected in any cell type immediately after 1 h of treatment (data not shown). Twenty-four hours after treatment, B blasts showed a statistically significant reduction of S phase at both doses of NAMI-A (−13% and −17% vs controls, respectively, at 0.1 and 0.01 mM; *p<0.05) whereas splenocytes, thymocytes, and T blasts did not change (data not shown). As for cell cycle distribution, total protein content did not vary immediately after 1 h of treatment (data not shown), but it increased in T blasts 24 h after treatment (Table 2, FITC).
Table 2.
Total protein content (FITC) and CD44 expression of splenocytes, thymocytes, T and B blasts, 24 h after treatment with NAMI-A (0.01, 0.1 mM). Data are expressed T/C×100. Statistical analysis by Student-Newman-Keuls test
| Treatment | 24 h | Splenocytes | Thymocytes | Lymphoblasts | |
|---|---|---|---|---|---|
| T blasts | B blasts | ||||
| 0.01 mM | FITC | 93.2±9.75 | 107±2.43 | 136±9.33* | 102±3.51 |
| CD44 | 111±3.44 | 94±2.55 | 107±2.87 | 95.7±0.54* | |
| 0.1 mM | FITC | 88.0±7.95 | 109±3.57 | 143±4.70* | 106±2.40 |
| CD44 | 100±2.91 | 106±2.93 | 107±2.66 | 84.5±0.30*** | |
*p<0.05; ***p<0.001, vs control
CD44 expression
As mentioned in the “Introduction,” splenocytes, thymocytes, and activated T and B blasts constitutively express the standard isoform of CD44 (see also Fig. 2, CD44 inserts). One hour of treatment with NAMI-A did not modify the constitutive CD44 expression in any cell type analyzed, independently of the dose used (data not shown). A down-regulation of CD44 expression was observed on B blasts only 24 h after treatment (Table 2, CD44).
Effects of NAMI-A on cocultures of metGM metastatic cells and splenocytes
Mitochondrial functionality of cocultures
Treatment of metGM cells with NAMI-A for 1 h (0.1, 1 mM), caused a statistically significant, and dose-dependent, reduction of their mitochondrial membrane potential, detected immediately after treatment (Table 3, metGM [PT] and metGM [ST]). When metGM cells and splenocytes (1:1) were simultaneously treated (ST) with NAMI-A for 1 h, both cell types were affected. Splenocytes showed a marked resistance to NAMI-A, with their mitochondrial membrane potential only reduced at a dose one order of magnitude higher than that for the change in mitochondrial transmembrane potential in metGM cells.
Table 3.
Mitochondrial functionality of cells (metGM and splenocytes) immediately after 1 h of treatment with NAMI-A (0.1, 1 mM), reported as mean values of MFI (mean fluorescence intensity) ± SEM (JC-1 aggregated). PT Treatment of metGM cells alone prior to 24-h coculture with splenocytes, ST simultaneous treatment of metGM cells and splenocytes (1:1). Statistical analysis by Student-Newman-Keuls test
| JC-1 (1 h) | metGM (PT) | metGM (ST) | Splenocytes (ST) |
|---|---|---|---|
| Control | 512±18.6 | 627±13.1 | 43.1±2.69 |
| 0.1 mM | 428±12.6a | 536±21.2a | 44.2±2.68 |
| 1 mM | 318±10.6b | 392±23.3b,c | 33.6±1.01a |
a p<0.01; b p<0.001, vs control; c p<0.001, vs 0.1 mM
Cell distribution among cell cycle phases in cocultures
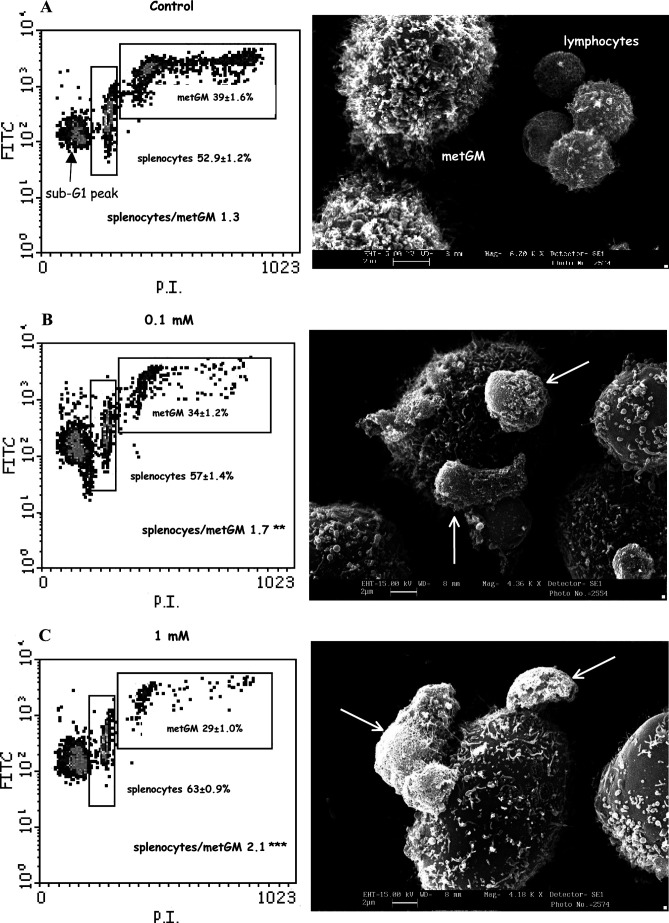
Twenty-four hours after the simultaneous treatment of metGM cells and splenocytes (Table 3, ST) a selective activation of splenocytes was observed, shown by the increase of cells in S phase (11.9±2.1% treated vs 5.8±1.0% controls; p<0.05). In the same conditions, NAMI-A did not modify the cell cycle distribution of metGM cells (S phase 45.1±18.6% controls, 44.9±27.5% NAMI-A–treated samples), but it reduced their number 24 h after treatment, at least resulting in the unbalancing of the original ratio between splenocytes and metGM cells. In fact, the ratio significantly increased from above 1 (controls) to 1.7 (0.1-mM NAMI-A; p<0.05) and to 2.1 (1-mM NAMI-A; p<0.001) (Fig. 4A–C, left). Besides the quite similar effect of NAMI-A on mitochondrial membrane potential of metGM cells, independently on the presence of splenocytes (Table 3) and the imbalance of cells in favor of diploid cells, an increased sub-G1 peak has been observed 24 h after NAMI-A exposure (Fig. 4) uniquely for treatment of both cell types simultaneously (ST). Expressed as % T/C, the sub-G1 peak was 121±4% (p<0.05) and 182±5% (p<0.001), respectively for NAMI-A 0.1 mM and 1 mM; treatment of metGM alone, prior to splenocytes challenge (PT), was not statistically different from controls for either dose used (% T/C of 108±7% and 105±4% for NAMI-A 0.1 and 1 mM, respectively).
Fig. 4A–C.
Density plots (FITC/PI, left) and SEM images (right) of cocultures of splenocytes and metGM cells (1:1) 24 h after treatment with NAMI-A (0.1–1 mM). A Control; B,C cocultures treated with NAMI-A. Percentage referred to cells gated into selected regions (mean values of quintuplicate samples ± SEM). Statistical analysis by Student-Newman-Keuls test: **p<0.01; ***p<0.001, vs control. SEM images show tight adhesion of leukocytes around metGM cells induced by NAMI-A treatment (arrows) on rosetting leukocytes
Nitric oxide determination
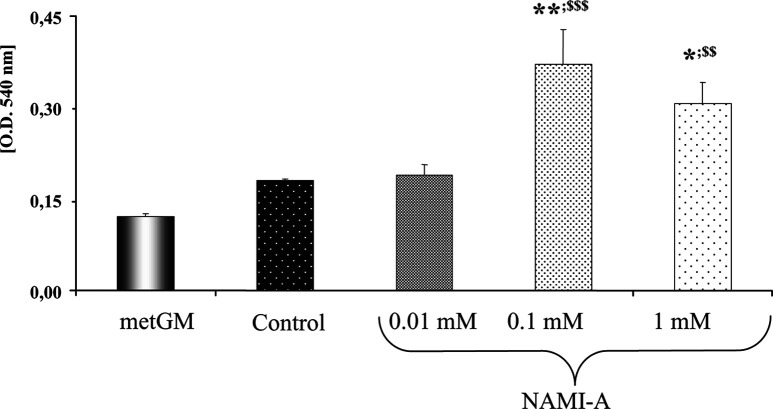
Nitric oxide (NO) was measured on supernatants of cocultures of metGM cells and splenocytes (1:1) 24 h after simultaneous treatment with NAMI-A (0.01–1 mM). As a negative control, NO was measured on supernatants of untreated metGM cells. NAMI-A statistically increased NO production in cocultures, as shown in Fig. 5. Since metGM cells alone produce a low amount of NO (Fig. 5), the overall increase of NO production in cocultures must be attributed to splenocytes.
Fig. 5.
NO determined on supernatants of cocultures of splenocytes and metGM cells (1:1) 24 h after treatment with NAMI-A (0.01–1 mM). Student-Newman-Keuls test: *p<0.05; **p<0.01, vs control; $$ p<0.01; $$$ p<0.001, vs metGM
Scanning electron micrographs
Scanning electron micrographs (SEM) show that splenocytes are randomly distributed in the control group (Fig. 4A, right). Treatment with NAMI-A induced their adhesion (rosetting) around tumor cells (Fig. 4B, C, right [arrows]). In agreement with this observation, comparable results have been obtained by light microscopy (data not shown). Quantification of these interactions (performed by counting five fields of three different slices per group) in the NAMI-A treated group, showed a lower number of metastatic single cells (28.5±1.7% vs 37.4±1.8% of controls) to which corresponded an higher percentage of cells in contact with up to six lymphocytes (17.6±5.6% vs 0.8±0% of untreated controls).
Discussion
NAMI-A is a metal-based compound active against lung metastases in a series of solid murine tumor models [27, 28] without any concomitant reduction of primary tumor growth. NAMI-A is free of cytotoxicity also in vitro in human and murine tumor cell lines up to mM concentration [20]. Recently, NAMI-A has completed a phase I clinical trial at the Netherlands Cancer Institute of Amsterdam (The Netherlands) on 24 patients, without any unexpected toxicity and a MTD at doses compatible with those active on metastases in preclinical models (J.H.M. Schellens, personal communication to G. Sava). These peculiarities indicate NAMI-A as a suitable compound for treating human disseminated tumors with a yet-unknown mechanism of action, different from that of “classical” cytotoxic chemotherapeutic drugs.
Anticancer drugs typically show toxicity in host immune cells, causing rapid and persistent depletion of lymphocytes. The present in vitro study, similar to past in vivo experiments, shows the absence of suppressive effects of NAMI-A on host immune cells.
Since resting and activated lymphocytes are reported to give different responses to chemotherapy [15, 30], the effects of NAMI-A were studied on splenocytes, activated T and B blasts, and thymocytes, these last because the CD4+ T-cell population depends on expansion, differentiation, and selection occurring in the thymus, and because these newly produced cells, bearing a naïve phenotype, are exported from the thymus and subsequently travel throughout the peripheral lymphoid tissues [30]. Mitochondrial functionality was chosen as the index of functional alteration since it is documented that one of the chemotherapy-induced apoptotic pathways can be mediated via the reduction of mitochondrial membrane potential [30].
NAMI-A does not affect cell cycle distribution, protein synthesis, CD44 expression, and mitochondrial functionality on splenocytes up to a dose of 0.1 mM; thus it does not induce damage or apoptotic death on mature T and B cells. Conversely, T and B blasts, generated by nonspecific polyclonal activators (ConA and LPS), are more sensitive to NAMI-A, showing a reduction of mitochondrial functionality already after 1 h of treatment and at relatively low doses (0.01 mM); thymocytes show intermediate sensitivity since they require a dose of one order of magnitude higher than that active on T and B blasts. All these effects are limited to 1 h of treatment, except the reduction of S phase population and CD44 down-regulation on B blasts still evident at 24 h.
NAMI-A selectivity for tumor cells emerges in cocultures of metGM cells and splenocytes, given that mitochondrial functionality of metGM cells is preferentially reduced even if these cells are treated with NAMI-A in presence of splenocytes (ST). In cocultures, NAMI-A stimulates diploid cells to enter S phase and to produce NO. Recent studies demonstrated that long-term exposure to NO might result in oxidative stress and consequent inhibition of various mitochondrial and cytosolic enzymes [2]. Since mitochondrial membrane potential (ΔΨ) of metGM cells is reduced by NAMI-A also in the absence of splenocytes, it is likely that, in coculture conditions, NO produced by splenocytes, might irreversibly damage metGM cells leading to the unbalance of the splenocytes to metGM ratio in favor of immune cells. The presence of splenocytes is crucial to the effects of NAMI-A on metGM cells, also because a significant increase of sub-G1 peak is evident only for ST treatment. Moreover, metGM cells treated with NAMI-A, even displaying mitochondrial membrane depolarization, do not show membrane permeabilization, appearance of subG1 cells, and caspase 3–7 activation; a certain amount of metGM cell death is achieved only after repeated and prolonged exposure to NAMI-A (manuscript in preparation). These data seem to suggest that in vivo, where a prolonged exposure of tumor cells to the compound occurs, the antimetastatic activity of NAMI-A is a combination of multiple events some of which depend on the leukocyte-tumor cell interaction.
NAMI-A–activated lymphocytes may exert cytolytic effects while they rosette around metastatic cells. Lymphocyte adhesion might be attributed to NAMI-A–induced CD54 (ICAM-1) up-regulation on tumor cells observed in a parallel in vivo study [21]. Tumor cell ICAM-1 acts as a ligand for leukocyte function-associated antigen-1 (LFA-1) expressed by all leukocytes [17], and its primary function is to enhance immune recognition of target cells through the LFA-1/ICAM-1 interaction [33]. On in vivo treated tumors, NAMI-A increased tumor-infiltrating lymphocytes leading to unbalance of aneuploid and diploid population in favor of lymphocytes and, similar to in vitro cocultures, promoting tight adhesion between lymphocytes and cancer cells [21].
Globally taken, these data allow us to conclude that, contrary to the widely reported immune-suppressive effects common to almost all metal-based chemotherapeutics [15, 19, 30], NAMI-A is not toxic for host immune mature T and B cells; rather it may participate in their activation in the peripheral blood via the CD44 receptor [21]. Considering that cytotoxic drug-induced depletion of lymphocytes involves proliferative arrest in lymphocyte precursor compartments or direct induction of apoptosis in mature cells, and considering that NAMI-A shows no toxicity for splenocytes, thymocytes, and T blasts, we may conclude that NAMI-A is devoid of immune toxicity at concentrations active on tumor cells.
The higher sensibility of B blasts might derive from specific LPS-activated signaling pathways. Early steps in LPS-induced signal transduction involve tyrosine phosphorylation and activation of a number of kinases of the Src family which are known to closely interact with the cytoplasmic domain of CD44 in epithelial tumor cells [3, 4, 23]. LPS-induced activation also involves the Raf-1 kinase, a key component in mitogenic signal transduction, paralleled by the stimulation of MEK-1 and MAP kinase activity and by the phosphorylation of their nuclear target [24]. In this context, NAMI-A was shown to inhibit MEK/ERK signaling and to down-regulate c-myc gene expression via PKC interactions in a transformed endothelial cell line [22]. The selective down-regulation of CD44 expression on LPS-stimulated B blasts thus might represent the result of the higher sensitivity of B blasts to NAMI-A compared with other lymphoid cell subtypes. Finally, cocultures of metGM cells and splenocytes suggest that the toxicity of NAMI-A toward tumor cells is in part attributable to NO release by activated leukocytes and to its consequent effects on mitochondrial membrane potential leading to tumor cell death.
The overall antimetastatic activity displayed by NAMI-A might therefore be the result of complex interactions with tumor cells, on which it displays selective antitumor activity, and with host immune cells on which it promotes activation of tumor suppression properties.
Acknowledgements
This work was supported by MIUR (prot. 2001053898_004, Pharmacological mechanisms of the antimetastatic activity of metal-based drugs). Fondazione Callerio Onlus is kindly acknowledged for the financial support of the Ph.D. fellowship of M. Bacac and for making the flow cytometry facility available.
References
- 1.Applegate Cancer Res. 1990;22:7153. [PubMed] [Google Scholar]
- 2.Beltran PNAS. 2002;99:8892. doi: 10.1073/pnas.092259799. [DOI] [PMC free article] [PubMed] [Google Scholar]
- 3.Bourguignon J Mammary Gland Biol Neopl. 2001;6:287. doi: 10.1023/A:1011371523994. [DOI] [PubMed] [Google Scholar]
- 4.Bourguignon J Biol Chem. 2001;276:7327. doi: 10.1074/jbc.M006498200. [DOI] [PubMed] [Google Scholar]
- 5.Cocchietto Pharmacol Toxicol. 2000;87:193. doi: 10.1034/j.1600-0773.2000.d01-73.x. [DOI] [PubMed] [Google Scholar]
- 6.Cossarizza Biochem Biophys Res Commun. 1993;197:40. doi: 10.1006/bbrc.1993.2438. [DOI] [PubMed] [Google Scholar]
- 7.Cossarizza Exp Cell Res. 1996;222:84. doi: 10.1006/excr.1996.0011. [DOI] [PubMed] [Google Scholar]
- 8.DeGrendele Science. 1997;278:672. doi: 10.1126/science.278.5338.672. [DOI] [PubMed] [Google Scholar]
- 9.DHHS (1985) Guide for the care and use of laboratory animals. Department of Health and Human Services, National Institutes of Health, Bethesda, MD, p 23
- 10.Foss Semin Oncol. 2002;29:5. doi: 10.1053/sonc.2002.34070. [DOI] [Google Scholar]
- 11.Goldberg J Pharm Pharmacol. 2002;54:159. doi: 10.1211/0022357021778268. [DOI] [PubMed] [Google Scholar]
- 12.Haynes Immunol Today. 1989;10:423. doi: 10.1016/0167-5699(89)90040-6. [DOI] [PubMed] [Google Scholar]
- 13.Hammond J Exp Med. 1993;178:2225. doi: 10.1084/jem.178.6.2225. [DOI] [PMC free article] [PubMed] [Google Scholar]
- 14.Liotta Nature. 2001;411:375. doi: 10.1038/35077241. [DOI] [PubMed] [Google Scholar]
- 15.Mackall Oncologist. 1999;4:370. [PubMed] [Google Scholar]
- 16.Magnarin Anticancer Res. 2000;20:2939. [PubMed] [Google Scholar]
- 17.Marlin Cell. 1987;51:813. doi: 10.1016/0092-8674(87)90104-8. [DOI] [PubMed] [Google Scholar]
- 18.Noble J Clin Invest. 1993;91:2368. [Google Scholar]
- 19.Novak Cancer Res. 2002;62:2353. [PubMed] [Google Scholar]
- 20.Pacor Anticancer Res. 2001;21:2523. [PubMed] [Google Scholar]
- 21.Pacor S, Cocchietto M, Zorzet S, Bacac M, Vadori M, Castellarin A, Turrin C, Sava G (2004) Intra-tumoral NAMI-A treatment triggers metastasis reduction, which correlates to CD44 regulation and TIL recruitment. J PET (in press) [DOI] [PubMed]
- 22.Pintus Eur J Biochem. 2002;269:5861. doi: 10.1046/j.1432-1033.2002.03307.x. [DOI] [PubMed] [Google Scholar]
- 23.Poliak-Blazi Vet Arh. 1986;51:99. [Google Scholar]
- 24.Rafi Blood. 1997;89:2901. [PubMed] [Google Scholar]
- 25.Reimann J Immunol. 1994;153:5740. [PubMed] [Google Scholar]
- 26.Sava Int J Oncol. 2000;17:353. doi: 10.3892/ijo.17.2.353. [DOI] [PubMed] [Google Scholar]
- 27.Sava Clin Exp Met. 1998;16:371. doi: 10.1023/A:1006521715400. [DOI] [PubMed] [Google Scholar]
- 28.Sava Clin Cancer Res. 2003;9:1898. [PubMed] [Google Scholar]
- 29.Sconocchia Blood. 2001;97:3621. doi: 10.1182/blood.V97.11.3621. [DOI] [PubMed] [Google Scholar]
- 30.Stahnke Blood. 2001;98:3066. doi: 10.1182/blood.V98.10.3066. [DOI] [PubMed] [Google Scholar]
- 31.Stamenkovic Seminars in Cancer Biol. 2000;10:415. doi: 10.1006/scbi.2000.0379. [DOI] [PubMed] [Google Scholar]
- 32.Stuehr J Exp Med. 1989;169:1543. doi: 10.1084/jem.169.5.1543. [DOI] [PMC free article] [PubMed] [Google Scholar]
- 33.Teshigawara Clin Immunol Immunopathol. 1994;26:629. [Google Scholar]


