Abstract
Effects of gemcitabine (Gemzar) on immune cells were examined in pancreas cancer patients to determine whether it was immunosuppressive, or potentially could be combined with vaccines or other immunotherapy to enhance patient’s responses to their tumors. Blood was obtained at five time-points, before therapy, 3–4 days after initial gemcitabine infusion and immediately preceding three additional weekly infusions. Effects on T-cell subsets, B-cells, myeloid dendritic cell precursors, antigen presenting cells (APC), activated/memory, and naive cells were examined. Functional activity was measured by intracellular staining for cytokines before and after T-cell activation, and by interferon γ production in EliSpot responses to tumor presentation. Although absolute lymphocyte counts decreased with the initial treatment with gemcitabine infusion, the counts stabilized during subsequent treatments, then returned within normal ranges seven days after the fourth treatment so that the absolute lymphocyte count no longer differed significantly from that prior to treatment. These effects on absolute lymphocyte counts were mirrored by statistically significant decreases in absolute numbers of CD3 and CD20 lymphocytes during these time periods. The proportions of T and B-cells, however did not change significantly with therapy, although significance changes were observed in some specialized subsets. A decrease in the proportions of the major BDCA-1+, CD1b myeloid dendritic cell subset and a reciprocal increase in the minor BDCA-3+ dendritic cell subsets resulted at 3–4 days, then their levels returned to normal. No significant changes in percentages of CD86 and CD80 APCs or CD4+, CD25+T-cells were documented. Increased percentages of CD3+, CD45RO+ memory lymphocytes reached significance at day 7, then declined to statistically significant decrease at days 14 and 21 after the second and third infusions, respectively. Immune T-cells were functional in pancreas cancer patients treated with gemcitabine. The data suggest that gemcitabine therapy may decrease memory T-cells and promote naive T-cell activation. We conclude that gemcitabine therapy (1) is not immunosuppressive and (2) may enhance responses to specific vaccines or immunotherapy administered to activate or support immune responses directed toward driving effector immunity to cancer cells.
Keywords: Gemcitabine, Adenocarcinoma, Pancreas
Introduction
No adequate therapy for pancreas cancer has yet been found and most of 30,000 patients diagnosed annually in the USA die within a year of diagnosis. Gemcitabine is a chemotherapeutic drug (cytidine analogue) that has become the ‘standard of care‘ treatment in these patients because it increases the quality of life, relieves pain, and has some survival benefit, but may be of more use when combined with other forms of therapy. One option that might have potentiality for therapy is a combination of gemcitabine with immunotherapy to boost immune reactivity. Our previous studies revealed substantial immune cell activity in pancreas cancer patients, hence expansion of their anti-tumor immunity may be possible [1, 2]. Other studies undertaken to determine the effects of gemcitabine on NK, CTL or LAK cells in vitro indicated that it markedly inhibited generation of LAK or CTL, but had little effect on previously activated immune cell functions [3]. Others indicated that weekly infusions of gemcitabine had little effect on lymphocyte activities in vivo [4]. On the other hand, studies of immune cell functions in mice demonstrated that while gemcitabine had a depressive effect on B-cells and antibody production, it enabled the development of specific T-cell immunity to established tumors; particularly, when ‘secondary’ signals were nonspecifically activated [5, 6]. Before similar studies could be adapted to human treatment protocols, a more thorough examination of the effects of gemcitabine in human subjects with adenocarcinomas of the pancreas must be undertaken.
Material and methods
Subjects
Ten patients with previously surgically resected, or newly diagnosed, nonresectable metastatic adenocarcinoma of the pancreas were consented to an IRB-approved study. All subjects had a health performance status of 0–1 when they entered the study. No subject had received previous chemotherapy or radiotherapy.
Gemcitabine was administered in a dose of 1,000 mg/m2 over 30 min at days 0, 7, 14, and 21. Blood was drawn immediately before the treatments and on either day 3 or day 4 after the first treatment. Mononuclear cells were isolated from heparinized blood by Ficoll density centrifugation, and immediately frozen in four aliquots and stored at −70°C. All five draw dates were collected and then assays on a given subject were performed at one time. Clinical laboratory tests included were lymphocyte counts on peripheral smear differentials and serum levels of CA-19-9 and CA-15-3. Serum was removed from clotted blood and centrifuged to remove residual red blood cells, then frozen in aliquots and stored at −70°C.
Cell surface markers
A single aliquot from each of the five draw dates was thawed, then mononuclear cells were stained with fluorescence-conjugated antibodies and analyzed with a FacsCalibur LSR flow cytometer. The gating strategies for lymphocytes and monocytes were based upon forward light scatter (size) and 90°, side scatter (granularity) as performed with clinical samples. FITC and PE conjugated mouse IgG1 served as negative controls, while anti-CD3-FITC and anti-CD4-PE served as positive controls for setting quadrants. Data are presented as percent cells staining positively for each respective marker with IgG1 backgrounds subtracted. Antibodies to cytokines were titrated to determine optimum concentrations for maximum detection with low background staining. Antibodies to cell surface markers were used at the manufacturer’s recommended concentrations. All anti-CD fluorescent-conjugated monoclonal antibody reagents, anti-human cytokines; i.e. IL-4, IL-10, IL-12, and IFNγ; and mouse IgG isotype-FITC and isotype-PE conjugated controls were from BD Biosources. The BDCA reagents were from Miltenyl Biotech. Similar strategies were used for gating of cells to measure intracellular staining for cytokine production.
Intracellular staining for cytokine production
Cells were cultured with anti-CD3 and anti-CD28 for 24 h before staining for intracellular expression of cytokines. An aliquot of mononuclear cells from each of the five draw dates was thawed, washed in RPMI 1640 and cultured at 2×10⁶/ml with RPMI 1640 containing 5% FBS and gentamicin in 2 ml wells of a 24-well plate. Two wells served as ‘nonstimulated’ controls while two wells received 2 μg/ml anti-CD3 and 5 μg/ml anti-CD28. Six hours before the cells were harvested, 0.75 μl monensin (GolgiStop, PharMingen) was added/ml to enhance accumulation of cytokines within cells. Harvested cells were processed according to the manufacturer’s protocol for intracellular staining of mononuclear cells (Cytofix/Cytoperm, PharMingen). PE-conjugated antibodies directed against interferon γ (IFNγ) were used to enumerate Th1 cells, IL-4 to enumerate Th2 cells, and IL-12 to enumerate activated monocytes. Intracellular cytokine staining was combined with FITC-conjugated anti-CD3 staining to define T-cell responses. Background staining was determined with PE-conjugated IgG1 and subtracted from the anti-cytokine stained cells.
Antigen presentation
To investigate the effect of gemcitabine therapy on T-cell responses to antigen presentation, elispot assays were performed after stimulation with dendritic cells loaded with pancreatic tumor cell antigens. Dendritic cells were generated from adherent cells isolated in six well plates from 4×10⁶ fresh mononuclear cells in cultures with DMEM/F12 medium plus 20% FBS, 2 mM glutamine, and gentamicin plus 1,000 units/ml GM-CSF (Immunex/Berlex Laboratories) and 500 units/ml IL-4 (R & D Systems). Nonadherent cells from each preparation of dendritic cells were stored for use in cultures following antigen loading of the matured dendritic cells. Six to eight days later, dendritic cells were harvested, washed in serum-free AIM-V (Life Technologies/Invitrogen), and replated with 3 μg/ml RNA isolated from Capan2 or mPanc96 pancreatic tumor cell lines following a modification of published procedures [7–9]. Twenty four hours later, the dendritic cells were harvested, washed and replated with thawed and washed nonadherent cells in AIM-V supplemented with 100 units/ml IL-2 (Immunex) and 100 units/ml IL-7 (R & D Systems). Lymphocytes were stimulated twice before being challenged, in triplicate, in 96-well ImmunoSpot plates containing monoclonal antibodies to IFNγ. Since the generation and antigen loading of dendritic cells required 7–9 days in culture, nonadherent cells from the first (day 0) and third draws (day 7) were plated first with dendritic cells generated from the first draw, restimulated with dendritic cells generated from the third draw, and challenged in the elispot assay with dendritic cells generated from the fourth draw. Likewise, nonadherent cells from the fourth and fifth draws were stimulated first with ‘antigen’ loaded dendritic cells generated from the fourth draw (day 14), restimulated with dendritic cells generated from the fifth draw (day 21), and challenged with dendritic cells generated from a sixth draw (day 28).
Elispot assays
Elispot assays were performed to enumerate cells stimulated to produce IFNγ following published protocols [10]. Anti-IFNγ antibodies for the elispot assays were obtained from Endogen as specified (Pierce). Twice-stimulated lymphocytes were challenged in triplicate with fresh antigen (RNA) loaded dendritic cells in an approximate ratio of 15–20 lymphocytes/dendritic cell. One set of triplicate cultures of twice-stimulated lymphocytes was not challenged in the elispot plates and served as background controls. Concanavalin A (1 μg/ml) was added to another set of triplicate cultures and served as positive controls for the assay. Plates were read using an ImmunoSpot plate reader (ImmunoSpot), and the data standardized as spots (cells producing IFNγ)/106 cells.
Statistical methods
SPSS for Windows (Version 11) was used for data management and statistical analyses. Because histograms of the data showed statistically nonnormal distributions at many of the time points, nonparametric statistical methods were used to analyze the data. The Friedman test was done to compare all of the time points. If the Friedman test was statistically significant, then pairwise Friedman tests were used to compare the time points, two at a time, to determine which time points were different. A 0.05 significance level was used for all statistical tests. No one-sided statistical tests were done.
Results
Cell surface markers
The effects of gemcitabine therapy on subsets of peripheral blood mononuclear cells were investigated by the expression of the following cell surface markers. For T-cells: CD3; for T-cell subsets: CD4 and CD8; for regulatory T-cells: CD4 plus CD25; for B-cells: CD20; for dendritic cells of the myeloid lineage: BDCA-1 (anti-CD1c), and BDCA-3; for activated cells: CD69; for memory versus naïve cells: CD45RO and CD45RA; and for activated antigen presenting cells: CD80 and CD86.
T-cells
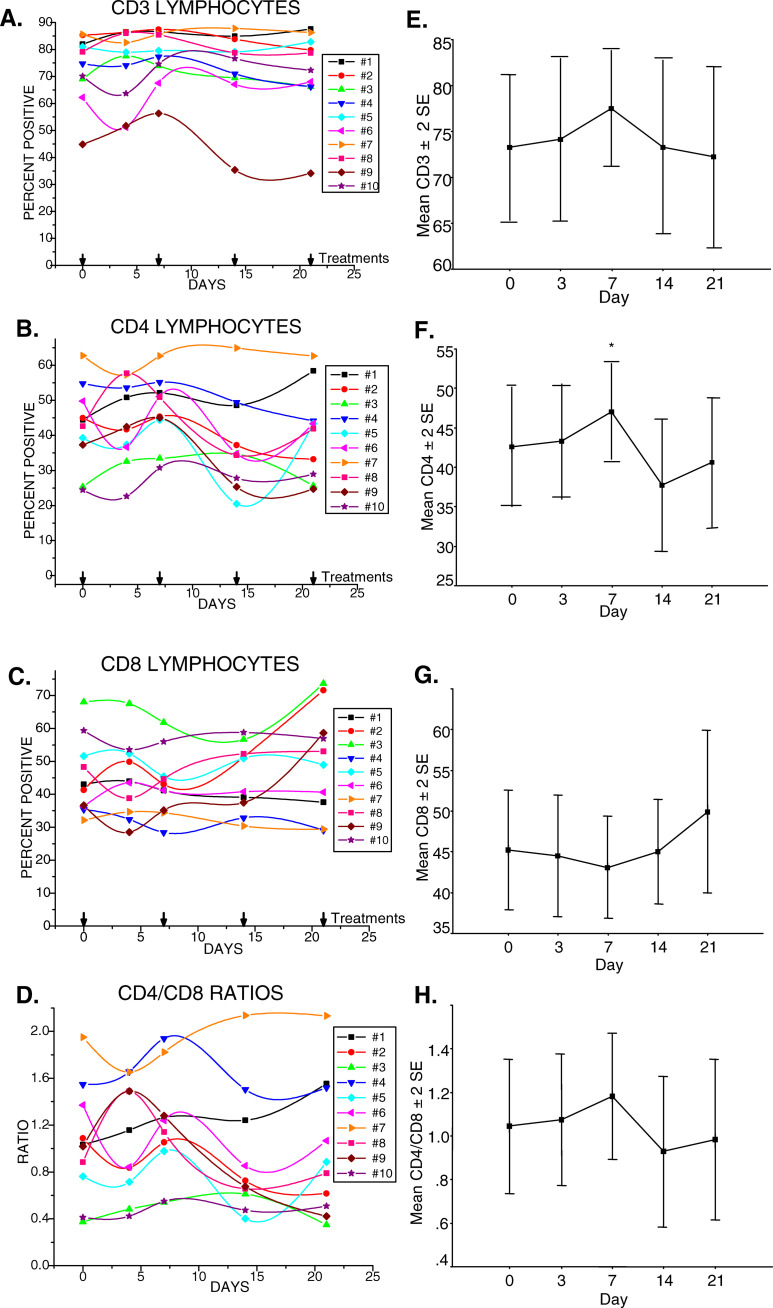
Clinical white blood cell counts (wbc) including differential analyses of neutrophils and lymphocytes indicated a decline in the absolute numbers of cells in most subjects after the initial infusion of gemcitabine. These numbers stabilized thereafter in most subjects and remained within the normal range (Table 1), (Fig.1a). By day 28, after the fourth treatment, the differences in average absolute numbers of lymphocytes were not statistically significant from those prior to treatment (p=0.16). CD3 expression defines the T-cell population. In some cases, the absolute number of T-cells decreased initially as a reflection of a decrease in the numbers of circulating lymphocytes (Fig. 1b). In other subjects, absolute numbers of T-cells were unchanged initially but then declined by the third treatment. In 9/10 subjects tested, percentages of T-cells in the gated lymphocyte population were within the average range set for healthy adults [11] (Fig.2a). No consistent changes in T-cell proportions in relationship to other lymphocyte subsets were noted following gemcitabine therapy. Subject no. 9 whose initial T-cell percentages were below normal exhibited increased T-cells following the first treatment with gemcitabine which then fell precipitously with subsequent treatment. The changes in this subject’s T-cells were reflected in similar changes in CD4 levels (Fig. 2b), and inverse changes in CD8 levels (Fig. 2c) which resulted in substantial decreases in the CD4/CD8 ratios (Fig. 2d). Statistical analyses of the data from the ten subjects revealed no significant changes in percentages of CD3 lymphocytes (Fig. 2e), or the CD8 subset (Fig. 2g), but revealed a significant increase in CD4+ T-cell percentages at day 7 after the initial dose of gemcitabine, p=0.011 (Fig. 2f). This mean increase dropped after the second dose of gemcitabine but did not differ significantly from the initial CD4 percentages observed at days 0, 3, or again at day 21 in the ten patients. Overall, CD4/CD8 ratios did not significantly change during therapy (Fig. 2h).
| Sex | Diagnosisa | Ageb | CA19.9 | CA15.3 | Lymphocyte differential/mc | |
|---|---|---|---|---|---|---|
| Patient #1 | ♂ | Mets | 50 | Yes | − | 3,700 |
| Patient #2 | ♂ | Adjuvant | 69 | No | ± | 4,800 |
| Patient #3 | ♂ | Adjuvant | 80 | Yes | − | 2,900 |
| Patient #4 | ♀ | Mets | 75 | Yes | − | 6,200 |
| Patient #5 | ♂ | Mets | 75 | Yes | ± | 3,400 |
| Patient #6 | ♂ | Adjuvant | 62 | No | − | 5,600 |
| Patient #7 | ♀ | Adjuvant | 68 | No | − | 5,000 |
| Patient #8 | ♀ | Mets | 66 | No | Yes | 7,300 |
| Patient #9 | ♀ | Mets | 71 | Yes | − | 8,800 |
| Patient #10 | ♀ | Mets | 71 | Yes | Yes | 6,300 |
a Adjuvant means 4–5 weeks following excision surgery to remove tumor. No further disease detectable. Mets means the subject was diagnosed with and has metastatic disease
b Age: ♂ (5) Range=50–80. Median: 50, 62, 69, 75, 80=69. ♀ (5) range=66–75, median: 66, 68, 71, 71, 75=71
c Mean lymphocyte differential count/μl prior to (days −4 to −10) and during therapy (days 7, 14, 21 and 28) were performed by Rush Medical Laboratories per usual protocol
Fig. 1.
Absolute lymphocyte numbers decline initially in most subjects, then tend to stabilize during the course of therapy. a Absolute numbers of lymphocytes in each subject. b Absolute numbers of CD3+ lymphocytes in each subject during therapy. c Absolute numbers of CD20+ lymphocytes in each subject during therapy. Please note that day 0 numbers were derived from lymphocyte differentials performed days 4–10 before initial therapy, while CD3 and CD20 percentages were obtained by flow cytometry analyses of the day 0 blood draws
Fig. 2.
Initial therapy with gemcitabine increased the proportion of CD4+T-cells significantly without significant changes overall in T-cells, or CD4/CD8 ratios. a Percentages of CD3+T-cells of each subject studied during the course of therapy. b CD4+T-cells, day 7, *p=0.011. c CD8+T-cells. d CD4/CD8 ratios. e Mean±2 standard errors of CD3+T-cells. f Mean±2 standard errors of CD4+T-cells. g Mean ± 2 standard errors of CD8+T-cells. h Mean±2 standard errors of CD4/CD8 ratios
B-cells
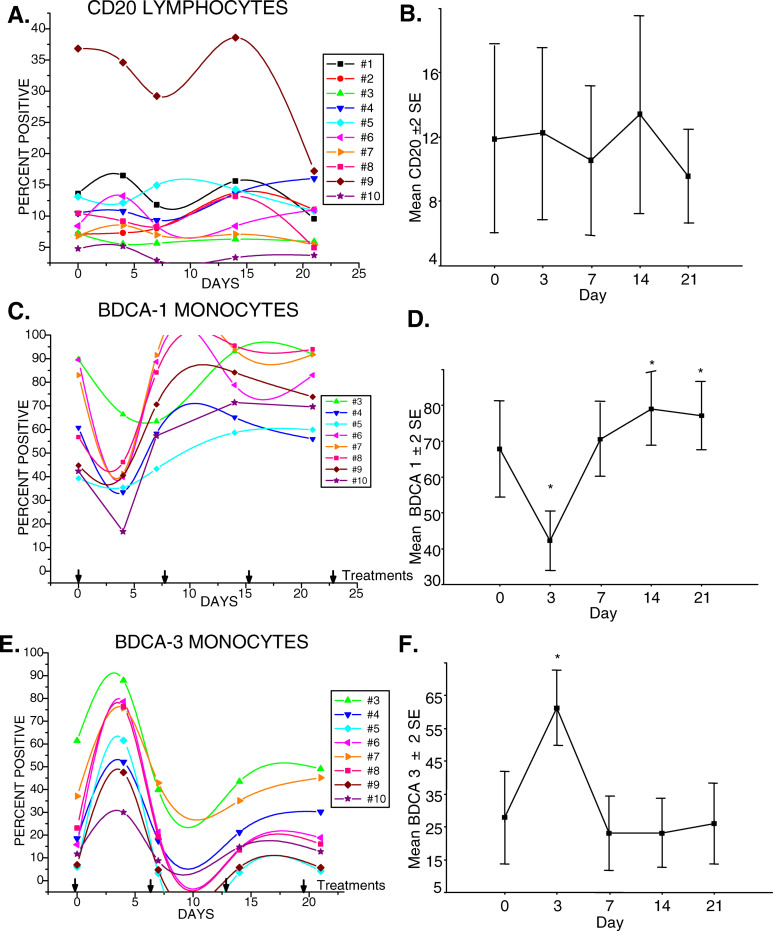
CD20 expression defines lymphocytes of the B-cell lineage. Absolute numbers of B-cells decreased in the majority of subjects after the initial infusion of gemcitabine, then stabilized in most with one dramatic exception (Fig. 1c). The B-cell subsets detected in the lymphocyte gate with anti-CD20 were within the normal proportional range set for healthy adults in 9/10 subjects. Subject no. 9, who had shown below normal proportions of T-cells, had proportionally higher B-cell levels that declined following gemcitabine therapy (Fig. 3a). In seven out of ten subjects, the proportion of B-cells decreased during gemcitabine treatment with an average decline of 32% between pretreatment (day 0) and day 21 (Fig. 3b). The mean decline in B-cell percentages amongst the ten subjects following the treatment with gemcitabine; however, did not reach statistical significance, p=0.19.
Fig. 3.
Gemcitabine had a significant effect on circulating myeloid dendritic cell precursors, but changes in CD20+ B-cell levels did not reach significance. a Percentages of CD20+ B-cells of each of ten subjects during the course of therapy. b Mean±2 SE of CD20+ B-cells. c Percentages of BDCA-1+ circulating cells detected in the monocyte gate. d Mean±2 SE of BDCA-1+ monocytes, day 3 decrease, *p=0.002: days 14, 21 increase, *p=0.002. e Percentages of BDCA-3+ circulating cells detected in the monocyte gate. f Mean±2 SE of BDCA-3+ monocytes, day 3 increase, *p=0.011
Dendritic cell precursors
BDCA-1 or CD1b, expression defines a majority subset of myeloid lineage, dendritic cell precursors. BDCA-1+ cell levels detected in the monocyte gate demonstrated a dramatic decline after the initial gemcitabine infusion, which recovered in most subjects by 7 days and then continued to increase with further treatments (Fig. 3c). The decrease in percentages of BDCA-1 at day 3 was significantly different from levels at day 0, p=0.002, at day 7, p=0.011, and at days 14 and 21, p=0.002 (Fig. 3d). The mean levels at days 0, 7, 14, and 21, however, did not significantly differ. BDCA-3 defines a minor subpopulation of myeloid dendritic cells that have been designated MDC2. BDCA-3+ dendritic cells, also detected in the monocyte gate, demonstrated a significant, reciprocal rise at 3–4 days following the initial gemcitabine treatment, p=0.011, which then declined at days 7, 14, and 21 to levels that were not significantly different from day 0 (Fig. 3e, f).
Functional immune cell subsets
The specific functional and regulatory subsets studied were ones that would likely play a role in immune responses to tumors if immunotherapy were combined with gemcitabine.
Antigen presenting cells
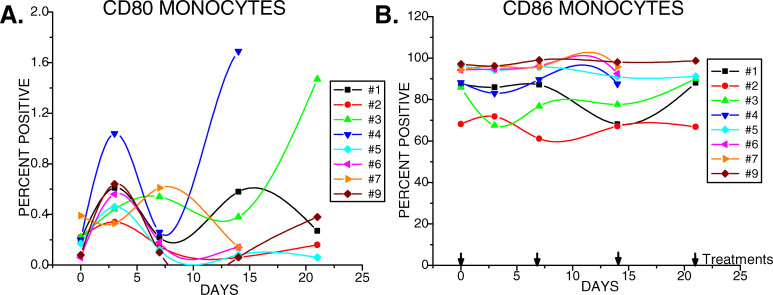
CD86 and CD80 serve as costimulatory molecules on antigen presenting cells. Before gemcitabine treatment CD80 expression appeared normal with less than 0.2% of cells in the monocyte gate expressing CD80. This level consistently increased in 3–4 days following the first treatment, often by several-fold, then decreased to near normal levels, and either remained at this level in five out of eight subjects tested, or became elevated to variable extents in the remaining three subjects after the second treatment (Fig. 4a). CD86 expression was also in normal ranges with 68–97% of monocytes of untreated subjects demonstrating positive expression (Fig. 4b). The percentage of CD86+ cells for each of the eight subjects tested remained stable throughout the therapy without significant changes.
Fig. 4.
Therapy of pancreas cancer patients with gemcitabine had little depressive effect on antigen presenting cells expressing CD80 and CD86. CD80 and CD86 expressions were quantified by flow cytometry in the monocyte gate
Activated/memory cells
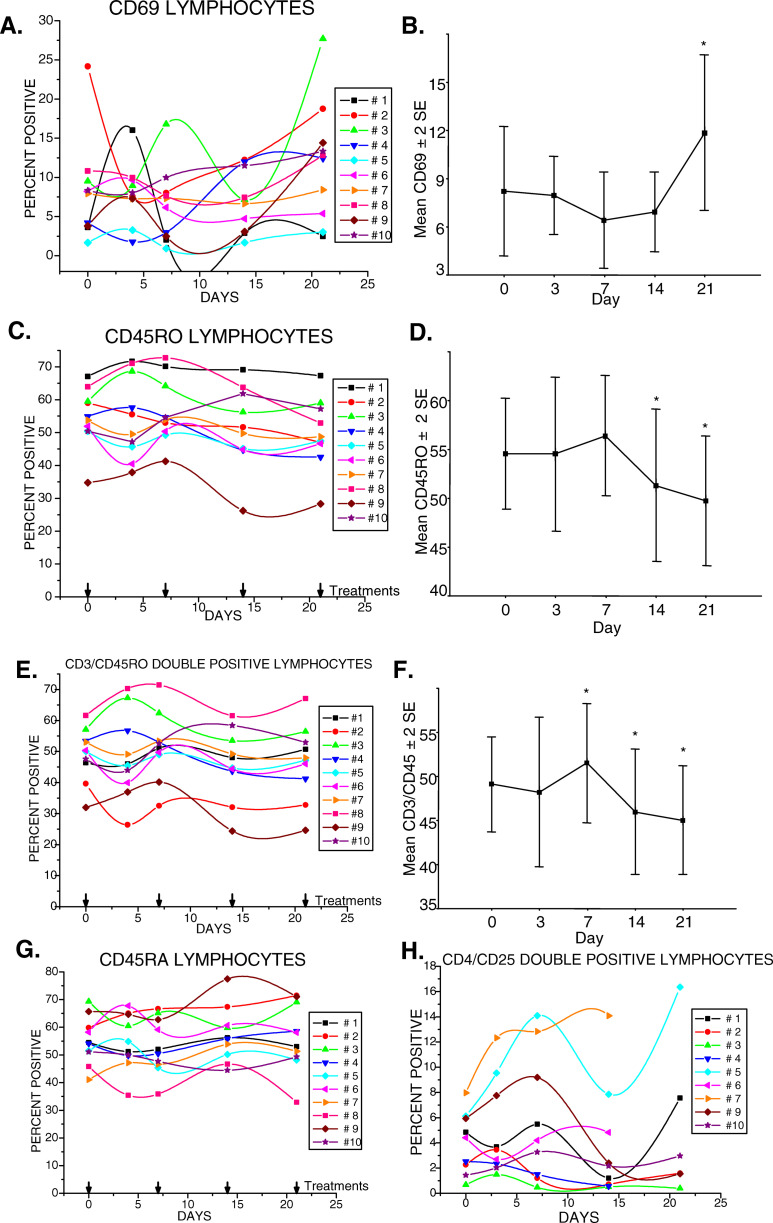
The percentages of CD69 lymphocytes demonstrated varied effects during therapy with gemcitabine at different time points in the different subjects (Fig. 5a). Statistical analyses revealed that a mean increase in the percentage of CD69+ cells at day 21 was significantly different from all earlier draw days, p=0.027, particularly days 7, p=0.011, and 14, p=0.011, (Fig. 5b) suggesting increased cellular activation.
Fig. 5.
Therapy of pancreas cancer patients with gemcitabine had a significant effect on circulating activated, memory lymphocytes. a Expression of CD69 was highly variable in most subjects. b The mean±2 SE of the CD69 expression in the ten subjects revealed a significant increase in CD69+ cells by day 21, 7 days after the third infusion of gemcitabine; *p=0.027. c Total levels of CD45RO+ cells revealed an initial increase after the first infusion of gemcitabine that declined to a level lower than baseline (day 0) in most subjects. d The mean±2 SE of CD45RO expression in the ten subjects revealed a significant decrease in CD45RO+ cells at days 14 and 21, 7 days after the second and third infusions of gemcitabine, respectively; *p=0.011. e Percentages of CD3+, CD45RO+T-cells of each of ten subjects studied during the course of therapy. f Significant changes in the mean±2 SE in CD3+ cells expressing CD45RO of the ten subjects were detected during therapy, with an increase on day 7 after the first infusion; *p=0.033; that subsequently decreased on days 14 and 21 with continued therapy; *day 14, p=0.011; * day 21, p=0.011, g Changes in CD45RA+ cells, or h in CD4+, CD25+T-cells did not reach significance
The CD45RO lymphocyte data revealed an increase in proportions of memory cells at day 7, p=0.033, with a gradual decline which reached significance thereafter at days 14 and 21, p=0.011 (Fig. 5c, d). The possibility that specific subsets of CD45RO cells might be significantly affected by gemcitabine therapy was considered. CD3,CD45RO, CD4,CD45RO, CD8,CD45RO and CD20,CD45RO double-positive subsets were evaluated. Significant changes were found only in the CD3,CD45RO subset with increased percentages at day 7, p=0.033, that declined after the second infusion suggesting that gemcitabine reduces memory T-cells, p=0.011 (Fig. 5e, f). No statistically significant changes were noted in the percentages of the double positive CD45RO subsets, CD4, CD8 or CD20, during gemcitabine therapy (data not presented). Similarly, no significant changes in the percentages of naive CD45RA subset of cells were noted (Fig. 5g), p=0.27.
Regulatory T-cells
The effect of gemcitabine treatment on the CD4,CD25 double-positive T-cell subset was examined as recent studies have demonstrated their regulatory activity [12–15]. The percentage of CD4+ CD25+T-cells in untreated pancreas cancer patients ranged from <2 to 8. In some subjects, CD4+ CD25+T-cells increased by a third to double during the course of treatment. In others, the percentages of CD4+ CD25+T-cell changed little or declined somewhat (Fig. 5h). Overall, there were no statistically significant changes, p=0.36.
Cytokine production following activation of T-cells
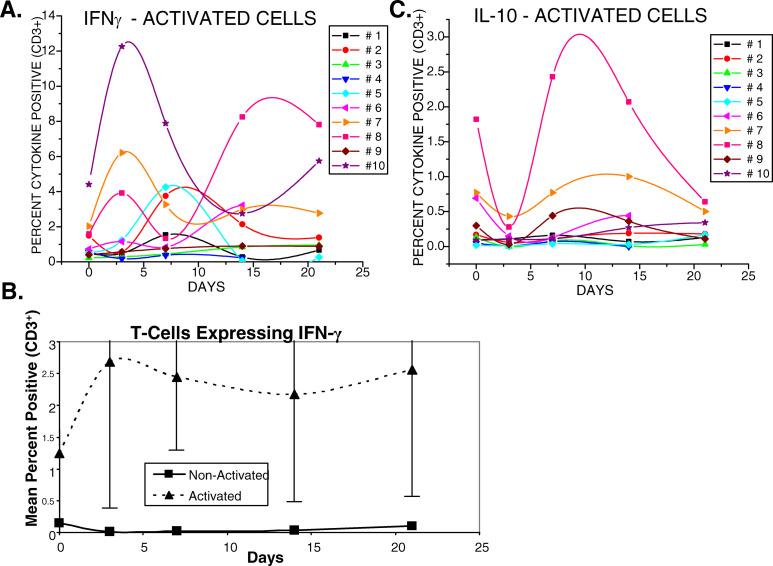
The effects of gemcitabine on existing immune cell functions and on the ability of immune cells to be activated were investigated. Cytokine expression was measured by intracellular staining studies with and without T-cell activation. Anti-CD3 plus anti-CD28 were used to trigger pathways that normally mediate T-cell receptor responses to antigenic stimulation. The numbers of activated cells were enumerated before and during gemcitabine therapy. The numbers of T-cells producing IFNγ were elevated at 3–4 or 7 days after the initial infusion of gemcitabine in the majority of subjects studied (Fig. 6a). The numbers of T-cells producing IFNγ fluctuated over the 3-week course of treatment, but the levels remained slightly elevated in most subjects at 21 days. The mean changes of IFNγ-producing T-cells in the ten subjects, however, were not statistically significant, p=0.19, (Fig. 6b). Without activation, fewer than 1% of T-cells expressed any of the cytokines tested either before or during treatment (data not shown). Although changes in numbers of activated T-cells producing IL-10 and IL-4 were observed, the only consistent findings amongst the subjects with detectable numbers of cells producing IL-10 were depressed levels observed at 3–4 days after the initial injection of gemcitabine (Fig. 6c). These depressed numbers of IL-10 producing cells often rebounded over the next 10 days and generally recovered to approximate pretreatment levels despite continued treatment with gemcitabine.
Fig. 6.
T-cells activated with anti-CD3 plus anti-CD28 demonstrated increased intracellular expression of gamma-interferon in several subjects and apparent reciprocal effects on IL-10 expression following therapy with gemcitabine. a Intracellular detection of activated IFN-γ-expression of T-cells before and during therapy. b Mean±2 SE of IFN-γ expression in activated versus nonactivated T-cells. Mean changes in levels of expressions did not reach significance. c Intracellular detection of IL-10 expression in activated T-cells in the ten subjects. Mean changes also did not reach significance
Cytokine production following tumor cell-derived antigen presentation
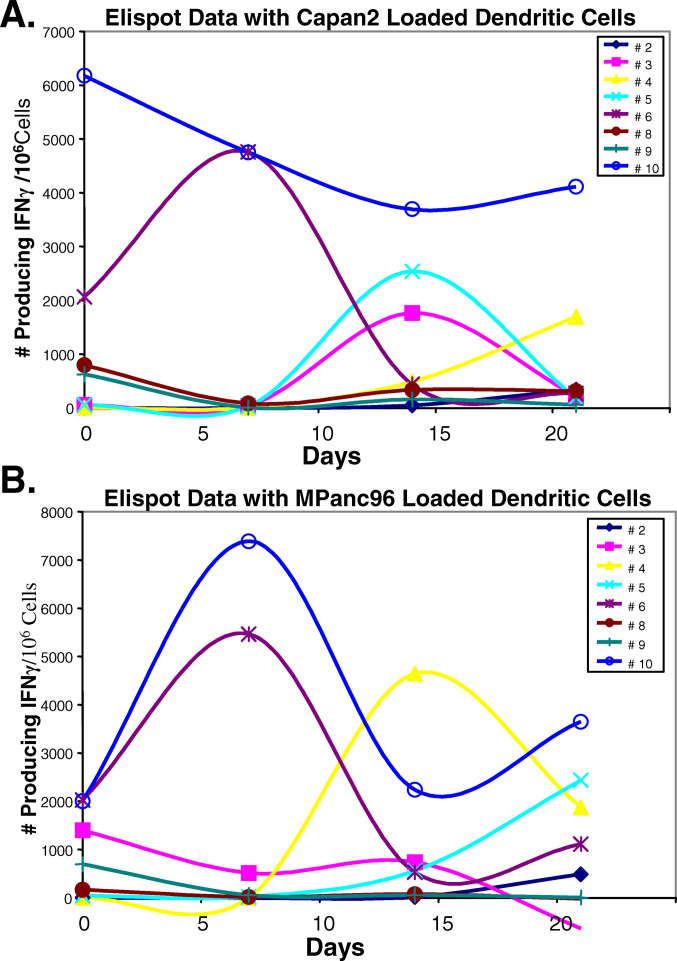
RNA from tumor cells has been demonstrated to provide dendritic cells with sufficient information to enable them to present antigen to activate immune responses [7, 8, 16–19]. Autologous dendritic cells were loaded with RNA from either of two pancreatic tumor cell lines, mpanc96 or Capan2. The numbers of cells producing IFNγ after stimulation were enumerated in elispot assays. Activation of cells producing IFNγ was evident in the majority of patients demonstrating that their cells were successfully primed with RNA-pulsed autologous dendritic cells (Fig. 7a, b). During treatment, different patterns of responses to antigen priming were observed. In some subjects, cells producing IFNγ were enhanced after the first (7 days) or second (14 days) infusion of gemcitabine, and in others enhanced responses were severely reduced after the second treatment.
Fig. 7.
Dendritic cells generated from subjects with pancreas cancer undergoing gemcitabine therapy were capable of activating autologous nonadherent lymphocytes to secrete IFNγ. a IFNγ production by lymphocytes that had been activated with dendritic cells loaded with RNA from the Capan2 pancreatic cancer cell line. b IFNγ production by lymphocytes that had been activated with dendritic cells loaded with RNA from the mPanc96 pancreatic cancer cell line
Discussion
Most chemotherapeutic agents are not specific to tumor cells but affect the growth of proliferating cells whether they are normal or neoplastic. Lymphocytes are affected by these treatments as lymphocytes are activated into a proliferative state when they respond to antigenic stimuli. Pancreatic tumor cells express antigens that can activate lymphocytes. Further, pancreas cancer patients have immune cells capable of responding to tumor antigens (reviewed in [1]). Vaccine therapies thus have been developed in an effort to activate immune responses in these patients to their tumor antigens. Since many chemotherapeutic drugs suppress immune activation, a combination therapy of these drugs and vaccine would not be productive. In pancreas cancer, gemcitabine is one drug that has an effect on disease progression; however, there is little information on the effect of gemcitabine on immune cell functions in human subjects. Animal studies suggest that gemcitabine can boost immune responses to tumors [6]. The current study thus was to determine whether gemcitabine affected immune cell subsets and their functions in pancreas cancer patients. One question posed was whether gemcitabine therapy could benefit or potentially enhance responses to tumor vaccines or induce immune suppression. In these studies therefore, the initial effects of gemcitabine therapy on immune cells of pancreas cancer patients receiving standard doses of this chemotherapeutic drug were studied. An impact of gemcitabine therapy on absolute numbers of white blood cells was noted after the first dose, then cell numbers stabilized during subsequent treatments in most subjects. Specific effects on lymphocyte subsets were observed at day 7 after initial therapy with a significant increase in percentages of CD4+, helper T-cells and CD3+, CD45RO+ double-positive, memory T-cell subset, which then declined after the second treatment. CD45RO marks a late stage of activation and memory cells, while CD69 is an early activation marker [20]. CD69 data revealed a dramatic but variable effect of gemcitabine therapy on this marker. Changes in CD69 may be a reflection of the manner in which its expression is regulated as CD69 expression is not sustained for long periods like many other CD markers. Instead it is upregulated quickly after activation, peaks at 24 h then is downregulated [21, 22]. Alternatively, changes in percentages of cell expressing CD69 may reflect activation of immune cells during therapy. Despite the variations noted between the ten subjects, a significant increase in cells expressing the CD69+ marker was detected at day 21. These data suggest that immune cell activation may have increased during this initial course of treatment with three infusions of gemcitabine. On the other hand, the overall population of CD45RO+ memory cells declined sufficiently after the second and third treatments to reach significance. These data suggest that memory cell functions decline while naïve, activated immune cells may increase during gemcitabine therapy.
Our data differ from studies in mice, where B-cell numbers were reduced [23]. A tendency toward a decrease in B-cells was observed, however, these reductions in B cells did not reach a level of significance. It should be noted that the regimens of treatments were quite different in mice which were treated every third day rather than once a week. The mouse studies revealed an augmentation of immune T-cell functions that resulted in antitumor activity [5]. Our studies also revealed augmentation of T-cell activity in pancreas of cancer patients treated with gemcitabine.
T-cell activity is regulated in part through the CD28 family of proteins. In healthy individuals, the costimulatory ligand, CD86, is constitutively expressed and upregulated upon activation, whereas CD80 is only expressed upon activation. The level of expression of CD80 and CD86 in pancreas of cancer patients was within normal ranges and was not significantly altered during gemcitabine therapy. These costimulator markers bind to the CD28 family of ligands to regulate T-cell activity. Anti-CD28 was used as a surrogate to trigger this costimulator receptor in cells activated with anti-CD3ζ, the TCR-associated signal transducing co-receptor molecule. Intracellular production of cytokine production demonstrated an increase in the numbers of T-cells producing interferon γ in most subjects, which on average remained somewhat elevated. Although the mean data did not reach statistically significant levels, gemcitabine in most subjects did not depress the ability of T-cells to produce IFNγ. On the other hand, IL-10 production was decreased during gemcitabine therapy in the majority of subjects who displayed IL-10 producing cells. These data demonstrate that therapy with gemcitabine does not inhibit Th1-cell activation and the ability to produce Th1 cytokines, but may inhibit Th2-cell activation and their ability to produce Th2 cytokines.
Dendritic cell functions were evident in elispot assays where dendritic cells presented stimuli to autologous nonadherent cells. We had previously determined that multiple stimulations with dendritic cells pulsed with pancreatic tumor cell line derived RNA were required to generate detectable numbers of cells producing IFNγ. Dendritic cells loaded with RNA from these pancreatic tumor cell lines stimulated autologous lymphocytes from subjects with pancreas cancer to produce IFNγ, whereas unstimulated lymphocytes or lymphocytes stimulated with dendritic cells cultured without RNA did not (Plate and Harris, unpublished data). The activated cells required a challenge from RNA-’antigen’ pulsed dendritic cells to trigger release of IFNγ in the elispot plates [24]. In the current studies, the numbers of dendritic cells generated did not appear to decline with sample draws taken during therapy with gemcitabine (data not included). The data revealed that dendritic cells from patients treated with gemcitabine were functional, and that immune activity could be generated to antigens provided from pancreatic tumor cell lines.
This report demonstrates that the regimen of chemotherapy treatment with gemcitabine of 1,000 mg/m2 for 30 min every 7 days for 3 weeks decreased memory T cells but did not deplete immune cells or immune cell functions in pancreas cancer patients. In fact naive immune cell activation may be enhanced, particularly as demonstrated in vitro by intracellular staining of IFNγ production and in vivo by an overall increase in the proportion of activated cells expressing CD69. The immune responses were not affiliated with a particular health-related phenotype in the ten pancreas cancer patients, and no correlations could be drawn based on the treatment outcomes. We conclude that the effects of the first cycle (3 weeks) of gemcitabine therapy on the immune systems of pancreas cancer patients were more positive than negative. This mode of chemotherapy (1) was not immunodepleting and (2) may enable patient responses to be enhanced by specific vaccines or immunotherapy initiated to activate or support immune responses directed toward driving effector responses to their cancer cells.
Acknowledgement
This work was supported in part by the Eli Lilly Research Laboratories, and the Wadsworth Foundation.
Abbreviations
- APC
Antigen presenting cells
- FITC
Fluorescein isothiocyanate
- PE
Phycoerthrin
- wbc
White blood cells
References
- 1.Plate JM, Harris JE. Immune cell functions in pancreatic cancer. Crit Rev Immunol. 2000;20:375. [PubMed] [Google Scholar]
- 2.Plate JM, Shott S, Harris JE. Immunoregulation in pancreatic cancer patients. Cancer Immunol Immunother. 1999;48:270. doi: 10.1007/s002620050575. [DOI] [PMC free article] [PubMed] [Google Scholar]
- 3.Alvino E, Fuggetta MP, Tricarico M, Bonmassar E. 2′-2′-difluorodeoxycytidine: in vitro effects on cell-mediated immune response. Anticancer Res. 1998;18:3597. [PubMed] [Google Scholar]
- 4.Daikeler T, Maas K, Hartmann JT, Kanz L, Bokemeyer C. Weekly short infusions of gemcitabine are not associated with suppression of lymphatic activity in patients with solid tumors. Anticancer Drugs. 1997;8:643. doi: 10.1097/00001813-199707000-00014. [DOI] [PubMed] [Google Scholar]
- 5.Nowak AK, Lake RA, Marzo AL, Scott B, Heath WR, Collins EJ, Frelinger JA, Robinson BW. Induction of tumor cell apoptosis in vivo increases tumor antigen cross-presentation, cross-priming rather than cross-tolerizing host tumor-specific CD8 T cells. J Immunol. 2003;170:4905. doi: 10.4049/jimmunol.170.10.4905. [DOI] [PubMed] [Google Scholar]
- 6.Nowak AK, Robinson BW, Lake RA. Synergy between chemotherapy and immunotherapy in the treatment of established murine solid tumors. Cancer Res. 2003;63:4490. [PubMed] [Google Scholar]
- 7.Heiser A, Dahm P, Yancey DR, Maurice MA, Boczkowski D, Nair SK, Gilboa E, Vieweg J. Human dendritic cells transfected with RNA encoding prostate-specific antigen stimulate prostate-specific CTL responses in vitro. J Immunol. 2000;164:5508. doi: 10.4049/jimmunol.164.10.5508. [DOI] [PubMed] [Google Scholar]
- 8.Heiser A, Maurice MA, Yancey DR, Coleman DM, Dahm P, Vieweg J. Human dendritic cells transfected with renal tumor RNA stimulate polyclonal T-cell responses against antigens expressed by primary and metastatic tumors. Cancer Res. 2001;61:3388. [PubMed] [Google Scholar]
- 9.Plate JM, Petersen KS, Buckingham L, Shahidi H, Schofield CM. Gene expression in chronic lymphocytic leukemia B cells and changes during induction of apoptosis. Exp Hematol. 2000;28:1214. doi: 10.1016/s0301-472x(00)00536-1. [DOI] [PubMed] [Google Scholar]
- 10.Heeger PS, Greenspan NS, Kuhlenschmidt S, Dejelo C, Hricik DE, Schulak JA, Tary-Lehmann M. Pretransplant frequency of donor-specific, IFN-gamma-producing lymphocytes is a manifestation of immunologic memory and correlates with the risk of posttransplant rejection episodes. J Immunol. 1999;163:2267. [PubMed] [Google Scholar]
- 11.McCoy JP, Jr, Overton WR. Quality control in flow cytometry for diagnostic pathology: II A conspectus of reference ranges for lymphocyte immunophenotyping. Cytometry. 1994;18:129. doi: 10.1002/cyto.990180304. [DOI] [PubMed] [Google Scholar]
- 12.Baecher-Allan C, Brown JA, Freeman GJ, Hafler DA. CD4+CD25high regulatory cells in human peripheral blood. J Immunol. 2001;167:1245. doi: 10.4049/jimmunol.167.3.1245. [DOI] [PubMed] [Google Scholar]
- 13.Dieckmann D, Plottner H, Berchtold S, Berger T, Schuler G. Ex vivo isolation and characterization of CD4(+)CD25(+) T cells with regulatory properties from human blood. J Exp Med. 2001;193:1303. doi: 10.1084/jem.193.11.1303. [DOI] [PMC free article] [PubMed] [Google Scholar]
- 14.Jonuleit H, Schmitt E. The regulatory T cell family: distinct subsets and their interrelations. J Immunol. 2003;171:6323. doi: 10.4049/jimmunol.171.12.6323. [DOI] [PubMed] [Google Scholar]
- 15.Jonuleit H, Schmitt E, Stassen M, Tuettenberg A, Knop J, Enk AH. Identification and functional characterization of human CD4(+)CD25(+) T cells with regulatory properties isolated from peripheral blood. J Exp Med. 2001;193:1285. doi: 10.1084/jem.193.11.1285. [DOI] [PMC free article] [PubMed] [Google Scholar]
- 16.Bartido Cancer Immunol Immunother. 2003;53:100. doi: 10.1007/s00262-003-0434-3. [DOI] [PMC free article] [PubMed] [Google Scholar]
- 17.Minami T, Nakanishi Y, Izumi M, Harada T, Hara N. Enhancement of antigen-presenting capacity and antitumor immunity of dendritic cells pulsed with autologous tumor-derived RNA in mice. J Immunother. 2003;26:420. doi: 10.1097/00002371-200309000-00005. [DOI] [PubMed] [Google Scholar]
- 18.Morse MA, Nair SK, Mosca PJ, Hobeika AC, Clay TM, Deng Y, Boczkowski D, Proia A, Neidzwiecki D, Clavien PA, Hurwitz HI, Schlom J, Gilboa E, Lyerly HK. Immunotherapy with autologous, human dendritic cells transfected with carcinoembryonic antigen mRNA. Cancer Invest. 2003;21:341. doi: 10.1081/CNV-120018224. [DOI] [PubMed] [Google Scholar]
- 19.Nair S, Boczkowski D. RNA-transfected dendritic cells. Expert Rev Vaccines. 2002;1:507. doi: 10.1586/14760584.1.4.507. [DOI] [PubMed] [Google Scholar]
- 20.Amlot PL, Tahami F, Chinn D, Rawlings E. Activation antigen expression on human T cells. I. Analysis by two-colour flow cytometry of umbilical cord blood, adult blood and lymphoid tissue. Clin Exp Immunol. 1996;105:176. doi: 10.1046/j.1365-2249.1996.d01-722.x. [DOI] [PMC free article] [PubMed] [Google Scholar]
- 21.Biselli R, Matricardi PM, D’Amelio R, Fattorossi A. Multiparametric flow cytometric analysis of the kinetics of surface molecule expression after polyclonal activation of human peripheral blood T lymphocytes. Scand J Immunol. 1992;35:439. doi: 10.1111/j.1365-3083.1992.tb02879.x. [DOI] [PubMed] [Google Scholar]
- 22.Ziegler SF, Ramsdell F, Alderson MR. The activation antigen CD69. Stem Cells. 1994;12:456. doi: 10.1002/stem.5530120502. [DOI] [PubMed] [Google Scholar]
- 23.Nowak AK, Robinson BW, Lake RA. Gemcitabine exerts a selective effect on the humoral immune response: implications for combination chemo-immunotherapy. Cancer Res. 2002;62:2353. [PubMed] [Google Scholar]
- 24.Plate Proc Am Assoc Cancer Res. 2004;45:500. [Google Scholar]


