

Abstract
Purpose: Albuleukin fusion protein is a recombinant human interleukin-2 (rIL-2) genetically fused to recombinant human serum albumin (rHSA). The pharmacokinetics and pharmacologic activity of Albuleukin were examined in mice to determine whether the fusion protein had the immunomodulatory and anti-tumor properties of rIL-2 as well as a prolonged serum half-life due to the rHSA. Methods: The effect of Albuleukin on lymphocyte proliferation, IL-2 receptor binding, and release of IFN-γ from human NK cells were examined in vitro. For the pharmacokinetic analysis, Albuleukin and rIL-2 were administered intravenously (i.v.) and subcutaneously (s.c.) to BALB/c mice, both at a single dose of 500 μg/kg. The anti-tumor properties of Albuleukin were evaluated in a Renca tumor model in BALB/c mice and in a metastatic liver model of B16F10 melanoma in C57B1/6 mice. In the Renca tumor model, BALB/c mice were dosed intraperitoneally (i.p.) and s.c. with Albuleukin on days 12, 14, 16, 19, 21, and 23 and i.p. with rIL-2 daily for two periods of 5 days (days 10–14 and 17–21). In the B16 melanoma model, C57B1/6 mice were dosed s.c. with rIL-2 twice daily or Albuleukin every 48 h for 14 days. Results: In vitro, Albuleukin induced the proliferation of primary human and mouse T cells and B cells and primary human NK cells, competed with rIL-2 for binding to the IL-2 receptors, and induced the production of IFN-γ from primary human NK cells. The s.c. bioavailability of Albuleukin was about 45% relative to the i.v. dose. Plasma half-life was prolonged and ranged from 6 to 8 h with Albuleukin, compared to 19–57 min with rIL-2. Total clearance of Albuleukin was about 50-fold slower than that of rIL-2 after i.v. dosing. In vivo, Albuleukin suppressed the growth of Renca tumors and induced a dense infiltration of CD4+ and CD8+ T cells. Both Albuleukin and rIL-2 significantly reduced the tumor burden in mice with hepatic B16F10 metastases. Albuleukin significantly reduced the incidence of residual macroscopic hepatic tumors, resulting in improved survival relative to controls and rIL-2. Conclusion: Results from these studies suggest that the therapeutic efficacy of rIL-2 is improved in mice by prolonging its in vivo half-life through genetic fusion to albumin. Albuleukin, the fusion protein, had pronounced anti-tumor effects in Renca and hepatic melanoma tumor models without an increase in mortality. On the basis of its preclinical effects, Albuleukin was brought to the clinic to assess its therapeutic benefit in a variety of cancers.
Keywords: Albumin, Tumor growth, Interleukin-2, Fusion protein, Pharmacokinetics, Albuleukin
Introduction
Since the initial descriptions of interleukin-2 (IL-2) activity [17], and the subsequent description of the protein [23] and gene [32], the immunomodulatory properties of IL-2 have been well characterized. Recombinant IL-2 (rIL-2) is thought to mediate anti-tumor cellular immune responses through lymphocyte activation and is currently an approved therapy for melanoma and renal cell carcinoma [24] and an experimental treatment for other malignancies and infectious diseases such as AIDS [22]. However, the short half-life of rIL-2 and its systemic toxicity continue to limit the clinical usefulness of this protein [14, 31].
Albuleukin is a genetic fusion protein of recombinant human serum albumin (rHSA) and rIL-2 genes and is based on a novel strategy for developing long-acting proteins. Albumin fusion technology potentially provides the advantageous pharmacokinetic properties of albumin to a fusion partner, resulting in a new protein with improved therapeutic potential. Numerous studies have described albumin kinetics and compartmental distribution [2, 3, 21, 30]. The half-life of albumin in humans has been estimated to approximately 19 days (3.7% loss per day) [21]. Albumin is distributed between vascular and extravascular compartments by several mechanisms [3, 21] depending upon the tissue, usually through endothelial junctions and active transcytotic transport [15, 21, 29]. Consequently, albumin can be found in most fluids and tissues of the body [30] with a large recirculating fraction returning to the vascular pool via the lymphatics and other routes [19, 26]. A recent biodistribution study [35] showed that Albuleukin had a longer circulation, lower uptake in kidneys, and much higher uptake in liver, spleen, and lymph nodes compared with rIL-2. The higher exposure of Albuleukin to lymphatic tissues may lead to a more pronounced anti-tumor effect, mediated by increased immune stimulation.
This study was undertaken to evaluate the stimulatory properties of Albuleukin in vitro in human and murine cell lines and the pharmacokinetics and anti-tumor effects of Albuleukin in mice in vivo. Specifically, Albuleukin was compared with rIL-2 in vitro on proliferation of human and mouse T cells and B cells and human NK cells, induction of IFN-gamma (IFN-γ) production from human NK cells, and binding to the IL-2 receptors. In vivo, the anti-tumor effect of Albuleukin was compared with rIL-2 in a BALB/c mouse Renca tumor model and a B16F10 hepatic melanoma model in C57B1/6 mice.
Materials and methods
Animals and housing conditions
Female BALB/c mice (Ace Animals, Boyertown, PA, USA), 10-week old (about 19–21 g) were used in the PK studies. Female BALB/c mice (Charles River Laboratories, Wilmington, MA, USA), 8- to 12-week old (about 18–23 g) were used in the Renca tumor model. Inbred, 7- to 9-week old (about 18–20 g) male C57Bl/6 mice (Taconic, Germantown, NY, USA) were used for all tumor and drug exposure studies in the B16F10 melanoma model. The mice were housed in an air conditioned, specific pathogen-free facility, under controlled humidity and temperature. Mice were housed in polyethylene cages on a ventilated rack and were provided free access to pelleted rodent feed and sterilized, acidified water. Animal experimentation was conducted in accordance with the Animal Welfare Act, the Guide for the Care and Use of Laboratory Animals (NIH publication No. 85-23, revised 1985), and under the supervision and approval of the Institutional Animal Care and Use Committee.
Protein production
Albuleukin, produced at Human Genome Sciences Inc., is recombinant human native IL-2 genetically fused to rHSA. Albuleukin has a molecular mass of approximately 81.8 kDa. Albuleukin was produced in Saccharomyces cerevisiae, in a manner similar to a previously described method [36] and stored frozen at −20°C. Stock protein concentrations of 1 mg/ml were diluted in phosphate-buffered saline (PBS) for injection. Proleukin (rIL-2), used for some comparisons, was purchased from Chiron Inc. (Emeryville, CA, USA).
Cell proliferation assays
The CTLL-2 cell lines were grown in a complete medium (RPMI-1640 containing 10% fetal calf serum [FCS] [Biofluids, Rockville, MD, USA]) and 5×10⁻⁵ M β-mercaptoethanol (Sigma, St.Louis, MO, USA) and 5 ng/ml IL-2 (R&D Systems, Minneapolis, MN, USA). The cells were washed twice in PBS prior to the assay. Each well was seeded with 1×10⁴ cells in complete medium, 5×10⁻⁵ M β-mercaptoethanol, and varying concentrations of Albuleukin or rIL-2 up to 10 ng/ml in a total volume of 200 μl per well. The cells were incubated for 40 h, then 20 μl per well of Alamar Blue was added and the cells were again incubated for 8 h. Absorbance at 530/590 nm was used as a measure of cell proliferation.
Lymphocytes obtained from human whole blood were separated by Ficoll (ICN Biotechnologies, Costa Mesa, CA, USA) gradient centrifugation and the mononuclear cells were cultured overnight in complete medium. Next morning, peripheral blood lymphocytes (PBL) were collected from non-adherent cells, and the T cells were separated using the MACS PanT separation kit (Milteny Biotech, Auburn, CA, USA). The T-cell purity achieved was usually higher that 90%. For preactivated T cells, the cells were activated with 2 μg/ml phytohemagglutinin (PHA) (Sigma) for 72 h, then grown in 5 ng/ml IL-2 for 48 h. The cells were washed and rested in low FCS medium (RPMI containing 1% FCS) for 24 h prior to the proliferation assay. Each well was seeded with 2×10⁴ cells in complete medium containing Albuleukin (up to 50 μg/ml) or rIL-2 (up to 1 μg/ml) in a total volume of 200 μl per well. For costimulated T cells, the cells were seeded on anti-CD3 and anti-CD28 coated plates at 2×10⁴ cells per well in complete medium containing Albuleukin (up to 50 μg/ml) or rIL-2 (up to 1 μg/ml) in a total volume of 200 μl per well, and pulsed with 1 μCi of 3H-thymidine (NEN) after 72 h. Cells were incubated for another 24 h and incorporation of 3H-thymidine was used as a measure of proliferation. Results are expressed as an average of triplicate samples plus or minus standard error. Assays of the proliferation of human and murine B cells by Albuleukin or rIL-2 in the presence of Staphylococcus aureus cells (SAC) were performed as previously described [16]. For the murine T-cell responses, the assay was performed as described for the costimulated human T cells on anti-CD3 and anti-CD28 coated plates, but 1×10⁵ cells per well were used.
Receptor binding assays
NK cells were prepared from a 10-day co-culture of PBMC isolated from the peripheral blood of healthy volunteers with an irradiated RPMI 8866 lymphoblastoid cell line as previously described [20]. The purity of the NK cell population was ~90% as determined by flow cytometry (CD16+/CD56+/CD3− cells). Preparation of preactivated T cells was performed as described for the proliferation assays. The cells were washed and rested in low FCS medium for 24 h prior to the binding assay.
Competitive binding assays were performed with 0.75×10⁶ NK cells in 200 μl of binding buffer (Ham’s F12 media containing 0.5% BSA and 0.1% sodium azide) and 0.1 nM 125I-labeled rIL-2 (NEN, Boston, MA, USA) in the absence or presence of various concentrations of unlabeled rIL-2 or Albuleukin as indicated. The binding reaction was carried out at room temperature for 2 h. Cell bound 125I-IL-2 was separated from unbound material by centrifugation through 200 μl of 1.5 dibutylphthlate/1.0 bis(2-ethyl-hexyl) phthalate oil mixture in polyethylene microfuge tubes (Bio-Rad, Hercules, CA, USA) for 20 s at 12,000 rpm. The microfuge tubes were then frozen quickly in liquid nitrogen and the bottom tips of the tubes were cut off using a tube cutter. Radioactivity in the bottom of the tubes containing the cell pellet (bound fraction) was counted with a gamma counter. The binding data were analyzed using Prism Software (GraphPad Software, San Diego, CA, USA).
Determination of IFN-γ production
An amount of 2×10⁵ human NK cells in 200 μl of complete medium were treated with different doses of rIL-2 or Albuleukin. After 24 h at 37°C, the plates were centrifuged and the medium was assayed by ELISA using a microplate sandwich assay comprising a capture monoclonal IFN-γ antibody (MAB285, R&D Systems, Minneapolis, MN, USA) and a biotinylated goat, anti-IFN-γ polyclonal detection antibody (BAF285, R&D Systems) followed by streptavidin-peroxidase. The ELISA data were analyzed by a four-parameter logistic model using the Prism Software (GraphPad Software).
Single-dose pharmacokinetic studies
The pharmacokinetic behavior of Albuleukin and rIL-2 following single i.v. and s.c. doses was evaluated in BALB/c mice. Groups of three female BALB/c mice were injected i.v. (tail vein) or s.c. (midscapular region) with Albuleukin or rIL-2 at a dose of 500 μg/kg. Three samples (one mouse per sample) for plasma drug concentrations were obtained at each, up to nine time points, ranging from 0 to 54 h for Albuleukin and 0–6 h for rIL-2. The Albuleukin i.v. data were fit with a one-compartment model assuming bolus input using WinNonlin (version 3.1, Pharsight Corp., Mountain View, CA, USA). The s.c. data were fit using a one-compartment model with equal absorption and elimination rates. Data from the mice dosed i.v. with rIL-2 were best modeled as a two-compartment model assuming bolus input. The data from s.c. dosing with rIL-2 was modeled as a one-compartment model with first-order input and elimination. In modeling the data, plasma concentrations were weighted as 1/C2pred.
Plasma samples were assayed using a commercially available IL-2 capture IL-2 detection sandwich ELISA (Biosource, Camrillo, CA, USA). Concentrations of Albuleukin or rIL-2 in the plasma samples were determined from a standard curve for each drug. The lower limit of quantification of the assay was 800 pg/ml.
Inhibition of Renca tumor growth
Renca tumor cells used in this experiment were obtained from the ATCC (Manassas, VA, USA) and maintained by i.p. passage in normal BALB/c mice. On the day of inoculation, a single-cell suspension in Hanks Balanced Salt Solution (HBSS) (Invitrogen, Carlsbad, CA, USA) was prepared and used to inoculate all mice. Female BALB/c mice were inoculated with 105 Renca cells s.c. in the midflank region (day 0). Mice those did not develop the tumor at study initiation were eliminated and the remaining mice were randomly divided into four groups of 10 or 16 mice. Groups of ten mice were used to monitor tumor growth and survival. In studies using s.c. administration of agents, some groups contained 16 mice, so that the remaining six mice could be used for histological evaluation.
Initially, tumor response to Albuleukin and rIL-2 treatment was examined following i.p. injection and at a dosage of rIL-2 that was previously shown to produce inhibition of Renca growth [33]. Mice received daily i.p. injections of 0.9 mg/kg of rIL-2 on days 10–14 and 17–21. Control mice received daily i.p. injections of placebo (PBS) on the same days. The effect of Albuleukin was evaluated by i.p. injection on days 12, 14, 16, 19, 21, and 23 at a dose of 0.6 mg/kg. Tumor volume was measured on day 28 post-Renca inoculation. Subsequent studies examined the Renca response to s.c. administration of HSA (Baxter Bioscience, Deerfield, IL, USA) (0.6 mg/kg) or Albuleukin at 0.1, 0.3, 0.6, and 0.9 mg/kg on days 12, 14, 16, 19, 21, and 23. Tumor volume was evaluated on day 31 post-Renca inoculation.
Tumor length (L) and width (W) were measured with millimeter-calibrated calipers. Tumor volume was calculated using the following formula: 0.5×(L×W2), expressed in mm3. The average tumor volume for each treatment group was statistically compared against all other treatment groups resulting in all pairwise comparisons. These comparisons were performed in the context of a one-way analysis of variance (ANOVA) or with a two-sample t test if the variance was unequal.
Mice were monitored for survival on a daily basis for up to 40 days post-inoculation. The survival data following s.c. administration were analyzed by logrank test comparing the Kaplan–Meier survival curves. In both analyses, values of p<0.05 were considered statistically significant.
Immunohistochemical evaluation of the Renca tumor
Tumors from mice receiving s.c. Albuleukin (0.9 mg/kg) or HSA (0.6 mg/kg) were also examined for the presence of infiltrating lymphocytes 2 weeks after the start of treatment. Acetone-fixed cryosections of each tumor were stained with anti-CD4, CD8, and CD3 antibodies using standard immunohistochemical techniques. Cryosections of normal mouse spleen were used as reagent controls. Sections of tumors from all mice were examined microscopically and scored for the presence of lymphocytes.
Briefly, 6 μm sections were cut of each tumor and thaw mounted onto Superfrost-Plus slides (Fischer Scientific, Pittsburgh, PA, USA), air-dried for 1 h, fixed in cold acetone for 15 min and air-dried for 15 min then hydrated and washed in PBS. Endogenous peroxidases were blocked with 0.3% H2O2 in methanol, and treated with avidin/biotin blocking solutions (Biotin/Avidin blocking kit; Vector, Burlingame, CA, USA), followed by an incubation in 0.01 M PBS per 0.1% and BSA per 5% rabbit serum to block non-specific protein binding. The following primary antibodies, diluted in PBS/BSA/rabbit serum were incubated over tissue sections overnight: rat-anti-mouse/human CD3 (Serotec UK/Harlan Bioproducts for Science, Indianapolis, IN, USA) 1:75; rat-anti-mouse CD4 (Pharmingen-BD, San Diego, CA, USA), 1:200; rat-anti-mouse CD8 (Pharmingen-BD), 1:200; and rat IgG (Sigma, St. Louis, MO, USA), 2–5 μg/ml. Specific binding of each antibody was detected by serial incubations in biotinylated, mouse-adsorbed rabbit anti-rat secondary antibody (Vector), ABC Elite horseradish peroxidase (HRP) detection kit reagents (Vector), and diaminobenzidine (Sigma) for visualization. Sections were rinsed, coverslipped, and examined microscopically.
Hepatic B16F10 melanoma tumor model
B16F10 cells obtained from the American Type Culture Collection (Manassas, VA, USA) were cultured in complete Dulbecco’s Modified Eagle Medium (D-MEM) (Gibco) with 10% FBS. Cells were collected by mild trypsinization and washed in medium prior to use. The cells were suspended in PBS immediately prior to injection and then held at 4°C. The liver metastasis model was performed by first shaving and disinfecting the left lateral abdomen of the recipient mouse. While under anesthesia, a small incision was made and the spleen was gently exteriorized. The spleen was injected with 3×10⁵ B16F10 cells in 150 μl of PBS and 2 min after the injection, the spleen was removed and the skin incision was closed with a metal wound clip. The clips were removed after wound closure and treatment with therapeutic agents was initiated 3 days after the tumor cell implantation. Mice were monitored daily during the studies.
Evaluation of the comparative lethality of Albuleukin and rIL-2 in the B16F10 melanoma model
Mice (n=12 per dose group) were injected with B16F10 melanoma and 3 days later with a 2-week regimen of Albuleukin or rIL-2 administered s.c. Doses of Albuleukin ranged from 0 to 4.0 mg/kg every 48 h. Doses of rIL-2 ranged from 0 to 5.0 mg/kg daily (doses were divided into two doses 8 h apart). Mice were observed daily for toxicity or tumor growth and euthanized if found moribund. The livers of mice were observed for gross indication of tumor growth at the time of death. The dose of Albuleukin and rIL-2 selected for further evaluation was approximated between a dose that induced any lethality and the next lower, non-lethal, dose.
Inhibition of hepatic metastases with B16F10 melanoma
Implantation of hepatic tumors was performed on four groups (n=12 per group) of mice that were randomized prior to treatment. The treatment groups included the following: Albuleukin dosed every other day at 1.75 mg/kg, rIL-2 dosed at 1.0 mg/kg/day as two divided doses 8 h apart, and placebo (PBS) and HSA (1.75 mg/kg) as appropriate control groups. Treatment was initiated for 3 days following tumor implantation and continued for 14 days. All surviving mice were sacrificed following completion of treatment and the livers removed for quantification of metastases. Each liver was weighed to compare net tumor burden. Statistical differences in liver weights were evaluated by one-way ANOVA. Images of each liver were analyzed by the IPLab Spectrum Program (Scanalytics Inc., Fairfax, VA, USA) and the surface area of the metastases in each liver was tabulated. Statistical differences in tumor area were evaluated by an unpaired t test and comparisons of residual disease were evaluated by the chi-square test. Values of p<0.05 were considered statistically significant.
Survival of tumor-bearing mice with B16F10 melanoma
Mice were treated in the same way as for the hepatic melanoma inhibition study except that an additional group (n=12) was treated with 2.0 mg/kg rIL-2 administered s.c. daily (split into two doses 8 h apart). Mice were observed for up to 46 days following tumor implantation and survival of each group determined. Any mice that were moribund or in any other distress were sacrificed and counted as a death on the day of termination. The survival data following s.c. administration were analyzed by logrank test comparing the Kaplan–Meier survival curves. Values of p<0.05 were considered statistically significant.
Comparative drug exposures of Albuleukin and rIL-2 in the B16F10 melanoma model
Each drug was delivered s.c. in the mid-scapular region, while the animal was restrained. Mice were treated with two doses of Albuleukin (1.75 mg/kg) at 0 and 48 h and killed 0.5, 1, 2, 3, 16, 24, 34, 48, 48.5, 55, 72, 82, and 96 h following the first injection. Mice were treated with four doses of rIL-2 (0.5 mg/kg) at 0, 8, 24, and 32 h and killed 0.5, 1, 8, 9, 24, 25, 27, 32, 33, and 48 h following the first injection. Three mice were sampled at each time point. The AUC was determined using the non-compartmental analysis module in WinNonlin, version 3.3 (Pharsight Inc., Mountain View, CA, USA) with curve stripping disabled to limit pharmacokinetic parameter calculation. A linear up/log down trapezoidal method was used to determine the AUC. In order to estimate a comparable 0–96 h AUC, the AUC calculated for the mice given rIL-2 was multiplied by 2.
Results
Albuleukin induces the proliferation of primary lymphocytes and T-cell lines
To determine the activity of Albuleukin on primary human cells and to compare it with rIL-2, proliferation assays were performed on cell types that express different IL-2 receptor complexes (Table 1). Both rIL-2 and Albuleukin induced cell proliferation in a dose-dependent fashion in all of the primary human cell types tested. In vitro, rIL-2 was more potent than Albuleukin, although the difference in potency was dependent on the cell type and donor. Albuleukin and rIL-2 were also compared for their ability to induce proliferation of murine splenocytes (Table 1). Splenocytes were either treated with SAC to analyze the response of the activated B cells to rIL-2 and Albuleukin, or with anti-CD3 and anti-CD28, to analyze the response of activated T cells. In both cases, the populations examined are known to express a combination of high- and intermediate-affinity IL-2 receptors [8]. Although the maximum cpm reached in the presence of rIL-2 was slightly higher than that observed with Albuleukin, both agents were able to efficiently induce cellular proliferation in a dose-dependent fashion in the murine splenocyte proliferation assays. In these in vitro comparisons across all cell types, the potency of Albuleukin on a mass basis ranged from equivalent to rIL-2 to 360-fold lower than rIL-2. We also determined the specific activity of Albuleukin (EC50) using the CTLL-2 proliferation assay. The specific activity of Albuleukin was 2.3×10⁶ IU/mg and was about 10 times less potent than rIL-2 (data not shown). The activity of WHO IL-2 in this assay (EC50=0.8751) was found to be comparable with the standard WHO-defined EC50 of 1 IU/ml.
Table 1.
Summary of primary cell proliferation studies
| Cell typea | IL-2 receptor affinity | EC50 ± SEM (ng/ml) rIL-2b | EC50 ± SEM (ng/ml) Albuleukinb |
|---|---|---|---|
| Human preactivated T cells | High | 2.91±1.27 | 257.87±102.06 |
| Human costimulated T cells | High/intermediate | 6.25±3.74 | 410.73±168.31 |
| Human NK cells | Intermediate | 0.25±0.09 | 36.37±8.74 |
| Human tonsillar B cells | High/intermediate | 0.14±0.01 | 50.48±13.95 |
| Murine B cells | High/intermediate | 15.42±6.48 | 12.58±4.47 |
| Murine T cells | High/intermediate | 0.08±0.10 | 1.83±1.59 |
aEach assay was performed on at least three donors and a representative donor was chosen
bEC50 values were based upon mass units and were not adjusted for the relative molar concentration of rIL-2 and Albuleukin
Albuleukin binding to IL-2 receptors is reduced relative to rIL-2 but produces functional lymphocyte activation
The IL-2 receptor is a complex of three chains, α, β, and γ [8]. IL-2 binds to the high affinity (α, β, and γ) complex with a Kd of 10–80 pM, to the intermediate affinity (β and α) complex with a Kd of 0.5–2 nM and to the low affinity α-chain with a Kd of 10–20 nM. The biological activity of rIL-2 on different cell types depends on the affinity and levels of expression of the IL-2 receptor complex. Since Albuleukin has been shown to induce proliferation of lymphocytes with high- and intermediate-affinity IL-2 receptor complexes, but with a different potency compared with rIL-2, we examined whether the biological activity of Albuleukin is due to its specific binding to IL-2 receptors. To address this question, competitive binding assays were performed using 125I-labeled rIL-2 in the absence or presence of various concentrations of unlabeled Albuleukin or rIL-2.
Competitive binding data demonstrate that Albuleukin specifically binds to T cells expressing the high affinity IL-2 receptor complex (Fig. 1a) and NK cells expressing the intermediate affinity receptor (Fig. 1b), as indicated by the displacement of radiolabeled rIL-2. Analysis of competitive binding data of Albuleukin with activated T cells revealed that Albuleukin (IC50=1.03±0.16 nM) had a somewhat lower affinity than rIL-2 (IC50=0.29±0.06 nM), as indicated by a higher IC50 (Fig. 1a). In a similar manner, the binding affinity of Albuleukin to expanded NK cells (IC50=4.62±1.14 nM) (Fig. 1b) was lower than that of rIL-2 (IC50=0.77±0.17 nM). The differences in the observed binding characteristics of these proteins were consistent with the differences in T-cell proliferative activity. Since NK cells are the major producer of IFN-γ in response to IL-2 [4, 8], primary NK cell cytokine production was used to verify the relationship between the relative binding affinity of Albuleukin and its ability to mediate immune activation. A dose-dependent increase in IFN-γ secretion by NK cells treated for 24 h with rIL-2 or Albuleukin was observed as shown in Fig. 2. The EC50 values of Albuleukin and rIL-2 were 10.4 and 1.73 ng/ml, respectively, indicating approximately a fivefold difference in potency on a mass basis.
Fig. 1.

Binding affinity of Albuleukin to the IL-2 receptors expressed on T and NK cells. A competitive binding assay was performed with 125I-rIL-2 (0.1 nM) in order to compare binding affinity of Albuleukin and rIL-2 to IL-2 receptors on expressed activated T cells (high affinity) and NK (intermediate affinity) cells. T cells and NK cells were generated from peripheral blood cells as described in Materials and methods. The indicated number of cells in a 96-well plate were incubated with 0.1 nM 125I-rIL-2 in the various concentrations of unlabeled rIL-2 or Albuleukin for 2 h at room temperature. Cell bound radioactivity was separated from free inbound 125I-rIL-2 and counted using a gamma counter. Dose-dependent inhibition of 125I-rIL-2 binding to T cells (a) and NK cells (b) by Albuleukin and rIL-2 was observed
Fig. 2.

Dose-dependent induction of IFN-γ production by rIL-2 or Albuleukin. Induction of IFN-γ production in NK cells (prepared from a 10-day co-culture as described in Materials and methods) by Albuleukin and rIL-2 was compared. 2×10⁵ NK cells/200 μl in a 96-well plate, were incubated with various concentrations of Albuleukin or rIL-2 for 24 h at 37°C. IFN-γ secreted in the medium was determined by ELISA. The EC50 values for IFN-γ production by Albuleukin and rIL-2 were 10.4 and 1.73 ng/ml, respectively.
Albuleukin has an extended half-life relative to rIL-2
To determine if Albuleukin had a favorable pharmacokinetic profile compared with rIL-2, these drugs were tested in a BALB/c mouse model. The predicted fit and the actual data for Albuleukin and rIL-2 following i.v. or s.c. injection of 500 μg/kg are shown in Fig. 3a (i.v.) and b (s.c.). The calculated pharmacokinetic parameters are summarized in Table 2. Following i.v. injection, the clearance (CL) of Albuleukin was 6.65±0.84 ml/h/kg. The volume of distribution at steady state (Vss) was 74.4±12 ml/kg, which is ~80% larger than the plasma volume and may indicate distribution of Albuleukin to tissues. The terminal half-life (t1/2,term) was 7.75±0.49 h with a maximum plasma concentration (Cmax) of 6.72±1.1 μg/ml. After s.c. injection, Albuleukin was ~45% bioavailable relative to the i.v. dose. Absorption after s.c. dosing was relatively slow, and the Cmax of 1.43±0.08 μg/ml was reached at 8.6±0.54 h after dosing (Tmax). The absorption half-life of both (t1/2,abs) and t1/2,term were approximately 6 h.
Fig. 3.

Comparison of the pharmacokinetic profile of rIL-2 and Albuleukin following s.c. and i.v. administration of 500 μg/kg in BALB/c mice. The observed concentrations are represented by symbols, and the lines represent the model predicted concentrations
Table 2.
Calculated pharmacokinetic parameters following i.v. and s.c. dosing with Albuleukin in BALB/c mice
| Parameter | Albuleukin parameters (mean ± SEM) | rIL-2 parameters (mean ± SEM) | ||
|---|---|---|---|---|
| Route of administration | i.v. | s.c. | i.v. | s.c. |
| Dose (μg/kg) | 500 | 500 | 500 | 500 |
| AUC (h×μg/ml) | 75.2±9.5 | 33.5±2.8 | 1.51±0.05 | 1.59±0.11 |
| CL or CL/F (ml/h/kg) | 6.65±0.84 | 14.9±1.2 | 330±12.0 | 314±21 |
| Vss or Vss/F (ml/kg) | 74.4±12 | 128±6.8 | 86.8±5.5 | 429±48 |
| Vi (ml/kg) | NA | NA | 38.5±0.8 | NA |
| t1/2,term (h) | 7.75±0.49 | 5.96±0.38 | 0.32±0.03 | 0.95±0.06 |
| t1/2,abs (h) | NA | 5.96±0.38 | NA | 0.20±0.04 |
| t1/2,α (h) | NA | NA | 0.047±0.005 | NA |
| % AUCα | NA | NA | 49.9 | NA |
| Cmax (μg/ml) | 6.72±1.1 | 1.43±0.08 | 13.0±0.28 | 0.77±0.06 |
| Tmax (h) | 0 | 8.60±0.54 | 0 | 0.57±0.07 |
| s.c. Bioavailability (%) | 45 | 105 | ||
AUC area under the plasma concentration curve, CL clearance, Vss volume of distribution at steady state, Vi initial volume of distribution, F bioavailable fraction, t1/2,term terminal half-life, t1/2,abs absorption half-life, t1/2,α initial phase half-life, Cmax maximal plasma concentration, Tmax time to maximal plasma concentration, NA not applicable
In contrast, rIL-2 was cleared about 50-fold more quickly at 330±12.0 ml/h/kg after i.v. injection. The initial volume of distribution (Vi) was ~39 ml/kg indicating that the drug is initially distributed in the plasma. The Vss was 87 ml/kg indicating distribution to tissues after i.v. injection. The Cmax was 13.0±0.28 μg/ml and the Tmax was 0.57±0.07 h after i.v. injection and the Cmax was 0.77±0.60 μg/ml after s.c. injection. Following s.c. dosing, rIL-2 was about 100% bioavailable relative to i.v. dosing. After i.v. dosing, the initial phase half-life (t1/2α) was approximately 3 min and the t1/2,term was 19 min with 50% of the drug clearance occurring in the α-phase. These studies indicate that following i.v. injection, rIL-2 is cleared from the plasma approximately 50 times faster than that of Albuleukin, permitting sustained circulating levels of the fusion protein for approximately 2 days following i.v. or s.c. injection.
Albuleukin inhibits tumor growth and promotes dense lymphocytic infiltration of the Renca tumor
Tumor volume was significantly reduced in mice administered by Albuleukin i.p. compared with mice administered by placebo i.p., 28 days post-inoculation (Fig. 4a). In addition, three of ten mice treated with Albuleukin were either tumor-free or had minimally detectable tumor (<1 mm3) by day 28 (data not shown) compared with zero of ten mice in the placebo group. Only four of ten placebo-treated mice survived until day 28 while all mice receiving Albuleukin survived. The survival benefit (90%) after treatment with i.p. rIL-2 (0.6 mg/kg) was similar to that of Albuleukin and consistent with responses previously observed for rIL-2.
Fig. 4.
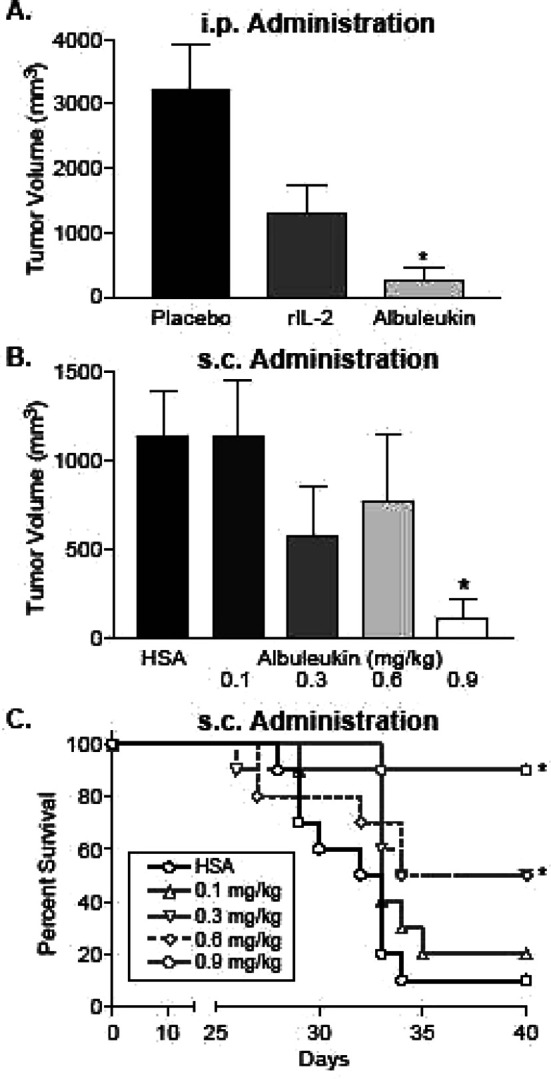
Albuleukin suppresses Renca tumor growth and improves survival in BALB/c mice. Mean values ± SEM of each group (n=10) are shown. a Albuleukin (0.6 mg/kg) was administered i.p. on days 12, 14, 16, 19, 21, and 23. rIL-2 (0.9 mg/kg) and placebo were administered i.p. on days 10–14 and 17–21. Tumor volume was measured 28 days post-inoculation. b Albuleukin (0.1–0.9 mg/kg) and human serum albumin (HSA) (0.6 mg/kg) were administered s.c. on days 12, 14, 16, 19, 21, and 23. Tumor volume was measured 31 days post-inoculation. c Survival rate of Albuleukin- and HSA-treated mice following s.c. administration up to 40 days post-inoculation. The asterisks designate statistical significance between each treatment group and its control using a two-sampled t test for tumor volumes and the logrank test for the comparison of the Kaplan–Meier survival curves. Values of p<0.05 were considered statistically significant
Subsequent studies were performed with s.c. administration of Albuleukin to simulate one possible route of administration in the clinic for the fusion protein. On day 31 of tumor growth, the 0.9 mg/kg Albuleukin treatment group exhibited a statistically significant reduction in tumor volume compared with the HSA-treated group (Fig. 4b), and the 0.3, 0.6, and 0.9 mg/kg Albuleukin dose levels resulted in significantly improved survival (Fig. 4c). In addition, eight of ten mice treated with 0.9 mg/kg Albuleukin had no macroscopic indication of tumor at the conclusion of the study (data not shown).
Tumors from mice receiving s.c. administration of Albuleukin were also examined for the presence of infiltrating lymphocytes. Two weeks after the start of Albuleukin treatment (0.9 mg/kg), there was a marked increase in tumor associated T cells compared with tumors from mice treated with HSA (0.6 mg/kg) (Fig. 5a–h). The Albuleukin-treated mice had small tumors that were partial to completely circumscribed by a dense lymphocytic infiltrate. Strong CD3 staining indicates that these cells were predominately T-lymphocytes, and the majority were CD8+ T cells, although numerous CD4+ T cells were also observed around and infiltrating the tumor mass. In contrast, the tumors from mice treated with HSA alone were larger in cross-section and had only scattered individual CD3+, CD4+, or CD8+ T cells at the tumor margins and rare individual CD3+ or CD8+ T cells within the tumor mass. Thus, administration of Albuleukin at 48-h intervals produced vigorous lymphocyte infiltration of the tumor, suppression of tumor growth and regression of the tumor in some mice.
Fig. 5.

Albuleukin induces tumor infiltrating T-lymphocytes in Renca tumors. Serial sections of Renca tumors from mice treated with Albuleukin (a–d), or HSA (control, e–h). Albuleukin (0.9 mg/kg) and HSA (0.6 mg/kg) were administered s.c. on days 12, 14, 16, 19, 21, and 23 and tumors were excised on day 26. Sections were stained by imunohistochemistry for the presence of the CD3/pan-T-cell antigen (a and e), CD4/helper T-cell antigen (b and f), or CD8/cytotoxic T-cell antigen (c and g). Panels D and H were stained with an IgG control antibody; bar=200 μm (d and h)
Comparative lethality of Albuleukin and rIL-2 in the B16F10 melanoma model
The survival of each treatment group at the conclusion of the 14-day treatment interval is shown in Fig. 6a, b. The dose of Albuleukin that was approximated to be between a dose that induced any lethality and the next lower, non-lethal, dose was 1.75 mg/kg every other day. For rIL-2, this dose was 1.0 mg/kg/day (divided into two injections 8 h apart). Each liver was also examined for tumor growth. Mortality observed in the control groups was associated with hepatic tumor growth. Some degree of inhibition of tumor growth by macroscopic assessment could be observed at all doses of Albuleukin and rIL-2. Tumor growth was absent or minimal in high-dose groups in which mortality was observed.
Fig. 6.

Evaluation of the comparative lethality of Albuleukin and rIL-2 in the B16F10 melanoma model. Mice (n=12 per dose group) were injected with B16F10 melanoma and 3 days later with a 2-week regimen of Albuleukin or rIL-2 administered s.c. Doses of Albuleukin ranged from 0 to 4.0 mg/kg every 48 h. Doses of rIL-2 ranged from 0 to 5.0 mg/kg daily (doses were divided into two doses 8 h apart). Survival of each group at the conclusion of the 14-day treatment interval is shown. The dose of Albuleukin and rIL-2 selected for further evaluation was approximated between a dose that induced any lethality and the next lower, non-lethal, dose. This dose was about 1.75 mg/kg every other day for Albuleukin and 1.0 mg/kg/day kg (divided into two injections 8 h apart) for rIL-2. BID—twice a day, QOD—every other day. a Albuleukin. b rIL-2
Inhibition of hepatic metastases in C57B1/6 mice
A comparison of liver weights between each group is shown in Fig. 7. The results demonstrated that both rIL-2 and Albuleukin strongly inhibited bulk tumor growth relative to the placebo and HSA control groups, respectively. However, no significant difference in liver weight was found between the rIL-2 and Albuleukin treatment groups.
Fig. 7.
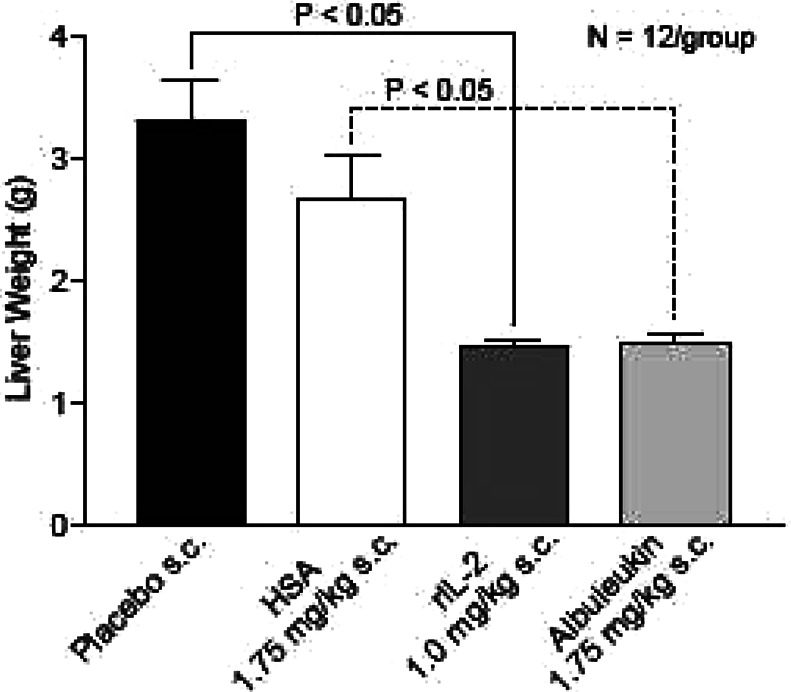
Albuleukin and rIL-2 inhibit hepatic tumor burden in C57B1/6 mice. Comparison of liver weights between groups demonstrated that both rIL-2 and Albuleukin strongly inhibited bulk tumor growth relative to the placebo and HSA control groups, respectively (p<0.05). No significant difference in liver weight was found between the Albuleukin and rIL-2 treatment groups. Mean ± SE are shown, n=12 mice per group. Statistical differences in liver weights between all groups were evaluated by one-way ANOVA. Individual t tests were conducted for pairwise comparisons
Comparison of total area of metastases observed between groups demonstrated a significantly greater reduction in tumor area in the Albuleukin treatment group than in the rIL-2 group (Fig. 8). Careful observation of each liver (Fig. 9) further indicated that many mice in the Albuleukin group were free of macroscopic disease. Tabulation of residual macroscopic disease (Fig. 10) revealed that Albuleukin significantly reduced the incidence of residual disease when compared with rIL-2.
Fig. 8.

Comparison of total metastatic area between treatment and control groups in C57B1/6 mice. Comparison of total area of metastases between groups demonstrated a significantly greater reduction in tumor area in the Albuleukin treatment group than observed in the rIL-2 group. Both rIL-2 and Albuleukin reduced the area of tumor involvement when compared to the placebo and HSA controls (p<0.05). Each point reflects the total tumor area on the liver surface for a single mouse. The group means are shown with a bar, n=12 mice per group. Statistical differences in tumor area were evaluated by an unpaired t test. Values of p<0.05 were considered statistically significant
Fig. 9.

B16F10 melanoma-bearing livers in the treatment and control groups. Livers from C57B1/6 mice in the placebo and HSA groups were highly involved with tumor. In contrast, the Albuleukin and rIL-2 groups had decreased macroscopic tumor involvement. The majority of the livers from mice in the Albuleukin group were free of macroscopic disease
Fig. 10.
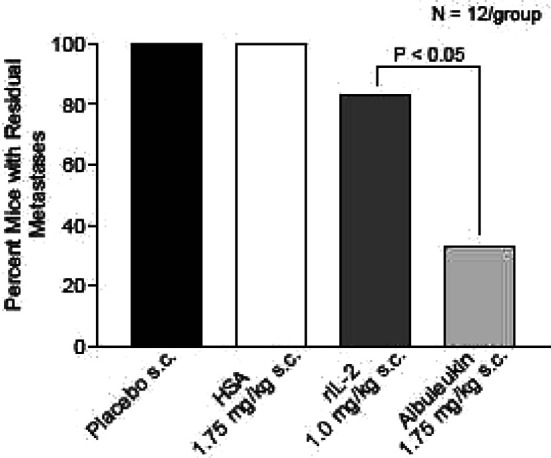
Comparison of residual macroscopic disease in the treatment and control groups. Tabulation of residual macroscopic disease demonstrated that Albuleukin significantly reduced the incidence of residual disease when compared with rIL-2 in C57B1/6 mice. Comparisons of residual disease were evaluated by the chi-square test. Values of p<0.05 were considered statistically significant
Survival of hepatic melanoma tumor-bearing mice
While both rIL-2 and Albuleukin increased survival relative to the control groups, Albuleukin (1.75 mg/kg) significantly improved survival when compared with rIL-2 administered at 1.0 mg/kg or at a higher dose of 2.0 mg/kg (Fig. 11). However, a 2-week course of treatment with either agent was insufficient to cure the mice of hepatic melanoma.
Fig. 11.

Survival of C57B1/6 mice bearing hepatic B16F10 melanoma. Mice (12 per dose group) were treated s.c. with 1.75 mg/kg Albuleukin every 48 h or with 1.0 and 2.0 mg/kg rIL-2 daily (split into two doses, 8 h apart). Placebo and HSA (1.75 mg/kg) were used as controls for rIL-2 and Albuleukin, respectively. Treatment was initiated 3 days following tumor implantation and continued for 14 days. Quantification of survival following treatment with rIL-2 and Albuleukin demonstrated that while both drugs increased survival relative to the control groups, Albuleukin significantly improved survival when compared with either dose of rIL-2. The survival data were analyzed by the logrank test comparing the Kaplan–Meier survival curves. Values of p<0.05 were considered statistically significant
Comparative drug exposures of Albuleukin and rIL-2 in the B16F10 melanoma model
Albuleukin administered to mice s.c. at 1.75 mg/kg every other day resulted in an AUC0-96 of 242,081 h × ng/mL (data not shown). The rIL-2, given to mice s.c. at 0.5 mg/kg twice each day, resulted in a plasma AUC0-48 of 3,896 h × ng/ml or estimated AUC0-96 of 7,792 h × ng/ml. Albuleukin thus provided approximately a 31-fold greater total drug exposure than rIL-2 (i.e., approximately sevenfold greater on a molar basis).
Discussion
The in vitro results from this study showed that Albuleukin (1) promotes the proliferation of primary human and mouse T cells and B cells and primary human NK cells, (2) binds to the known IL-2 receptors and competes with rIL-2 for binding to those receptors, and (3) induces the production of IFN-β from primary human NK cells. In vitro, the specific activity of Albuleukin is about 10 times less potent than rIL-2 in the CTLL assay. rIL-2 consistently appeared to be more potent than Albuleukin in inducing cell proliferation. However, if the fivefold greater molecular weight of Albuleukin compared to rIL-2 is considered, the difference in potency between the two agents is not as pronounced. Furthermore, the decreased in vitro potency of Albuleukin may be far outweighed by the predicted increase in exposure to circulating drug in vivo, potentially yielding a greater biological response.
The striking differences in the pharmacokinetic characteristics of Albuleukin and rIL-2 can be well appreciated by the 50-fold difference in the total exposure to the circulating drug or area under the curve (AUC) and the approximately 24-fold difference in the elimination half-life following i.v. injection. The lower Vss of Albuleukin compared with rIL-2 after s.c. dosing suggests that its movement into extravascular compartments may be slower. Since HSA is known to have a transcapillary escape rate of 4–5% per hour [21], it is not surprising that Albuleukin may be initially contained within the vascular compartment. In contrast, pharmacokinetic modeling indicates that rIL-2 has a greater distribution volume at steady state, indicating a relatively rapid movement into extravascular compartments, consistent with established descriptions of rIL-2 [31]. A recent study of the biodistribution of rIL-2 and Albuleukin confirmed these findings and showed that rIL-2 was rapidly cleared from the blood and accumulated in the kidney [35]. In contrast, Albuleukin had a more prolonged circulation in blood, lower kidney uptake, and higher localization in liver, spleen, and lymph nodes, suggesting that it may achieve greater activation of target T cells. The similar peak plasma concentrations of both proteins following i.v. injection suggest that any differences in transport characteristics are not likely to involve concentration gradient differences between plasma and tissue. Given the relatively high permeability of tumor vasculature to albumin [37, 38], a high sustained concentration of Albuleukin is possible in tumor interstitial fluid, although this must still be confirmed.
In vivo, the anti-Renca tumor activity of Albuleukin is similar to the previously described inhibition of Renca tumors with rIL-2 treatment [27, 33]. The heavy tumor infiltration by CD4+ and CD8+ lymphocytes is also consistent with previous studies with rIL-2 [24, 25] and supports the involvement of a specific anti-tumor cellular response and may indicate Albuleukin-mediated expansion of relevant T-cell populations. The complete regression of several Renca tumors following s.c. Albuleukin administration is encouraging. The question remains, however, whether Albuleukin presents an advantage in efficacy or toxicity over rIL-2 and additional studies will be needed to further address this issue.
Hepatic metastasis of melanoma continues to present a significant clinical challenge, especially in uveal melanoma [1, 28, 34]. Local chemotherapy and immunotherapy of hepatic melanoma has shown some success [28] although there remains a need for new treatment strategies. Mouse models of hepatic B16 melanoma have provided some insight into melanoma therapy in this setting [6, 7] and consequently such a model was selected to evaluate the potential utility of Albuleukin. A comparison of Albuleukin and rIL-2 at a dose approximated between a dose that induced any lethality and the next lower, non-lethal, dose was selected in order to estimate the relative ability of Albuleukin to control tumor growth compared with rIL-2. In this study, these doses were 1.0 mg/kg/day and 1.75 mg/kg/2 days for rIL-2 and Albuleukin, respectively. While such dosing results in considerably more rIL-2 administration on a molar basis, such a schedule facilitates the best possible exposure to each drug, without accumulation, that may be practically achieved due to the rapid elimination of rIL-2 in mice relative to Albuleukin [5].
Albuleukin and rIL-2 both significantly reduced the tumor burden in mice with hepatic B16 metastases at the selected doses. However, Albuleukin was significantly more effective in reducing the size and incidence of the residual hepatic metastases. While the precise mechanism of this action by Albuleukin has not been defined in this model, we suggest that a sustained exposure of lymphocyte populations to this protein may mediate more effective elimination of residual metastases than seen with rIL-2. Interleukin-2 based gene-therapy [10, 13] and formulations of IL-2 in liposomal preparations [11, 18] or in biodegradable polymers [9] have also demonstrated control of B16 melanoma through extended release of drug into the appropriate target tissue, although these strategies may be more appropriate for a highly localized disease, and may be more difficult to implement where widely distributed metastases are present. Studies utilizing these approaches have suggested that extended exposure to IL-2 facilitated the expansion of tumor-specific lymphocyte populations in response to tumor cells or vaccines [9, 12]. Such a mechanism is consistent with our observation of improved survival in mice receiving Albuleukin compared with rIL-2.
In summary, the in vivo and in vitro pharmacological properties of Albuleukin suggest that it acts in a similar manner to rIL-2, promoting the activation and expansion of anti-tumor lymphocytes, thus generating cellular- and cytokine-mediated anti-tumor cytotoxicity. The pharmacologic profile of Albuleukin indicates a longer plasma half-life than rIL-2 with activity exerted over a longer period of time following a single injection. This permits the selection of doses and schedules providing continuous immunostimulation to support an anti-tumor effect. The pharmacokinetic advantage of Albuleukin over rIL-2 is reflected by a pharmacodynamic advantage on a molar basis that dominates the apparent difference of in vitro potency, and may be a generalized characteristic of albumin fusion proteins [36]. Albuleukin provided improved inhibition of Renca tumors and hepatic B16 melanoma in mice when compared with rIL-2. While both agents inhibit the formation of bulk disease in the liver, Albuleukin provides more effective elimination of macroscopic metastases and improved survival while requiring less frequent administration and less administered drug than required for successful rIL-2 therapy. The clinical benefit of fusion proteins like Albuleukin may be realized if they are able to exert therapeutic activity with greater safety and convenience, thus creating a new class of therapeutic proteins. On the basis of the preclinical effects shown in this study as well as other preclinical results, Albuleukin was advanced to phase I clinical studies in patients with solid tumors.
Acknowledgements
The authors thank Saran Bao, Evelyn Good, Jonathan Hirsch, Clint Lincoln, Jiamo Lu, Kathy McCormick, and Renee Micili for their expert technical assistance. The authors also thank Dr. Jessie Wolfe for assistance in writing and editing this manuscript.
References
- 1.Becker JC, Terheyden P, Kampgen E, Wagner S, Neumann C, Schadendorf D, Steinmann A, Wittenberg G, Lieb W, Brocker EB. Treatment of disseminated ocular melanoma with sequential fotemustine, interferon alpha, and interleukin 2. Br J Cancer. 2002;87:840. doi: 10.1038/sj.bjc.6600521. [DOI] [PMC free article] [PubMed] [Google Scholar]
- 2.Bent-Hansen L. Initial plasma disappearance and tissue uptake of 131I-albumin in normal rabbits. Microvasc Res. 1991;41:345. doi: 10.1016/0026-2862(91)90033-8. [DOI] [PubMed] [Google Scholar]
- 3.Bent-Hansen L. Whole body capillary exchange of albumin. Acta Physiol Scand Suppl. 1991;603:5. [PubMed] [Google Scholar]
- 4.Biron CA, Nguyen KB, Pien GC, Cousens LP, Salazar-Mather TP. Natural killer cells in antiviral defense: function and regulation by innate cytokines. Annu Rev Immunol. 1999;17:189. doi: 10.1146/annurev.immunol.17.1.189. [DOI] [PubMed] [Google Scholar]
- 5.Chang AE, Hyatt CL, Rosenberg SA. Systemic administration of recombinant human interleukin-2 in mice. J Biol Response Mod. 1984;3:561. [PubMed] [Google Scholar]
- 6.Eisenthal A, Cameron RB, Rosenberg SA. Induction of antibody-dependent cellular cytotoxicity in vivo by IFN-alpha and its antitumor efficacy against established B16 melanoma liver metastases when combined with specific anti-B16 monoclonal antibody. J Immunol. 1990;144:4463. [PubMed] [Google Scholar]
- 7.Eisenthal A, Lafreniere R, Lefor AT, Rosenberg SA. Effect of anti-B16 melanoma monoclonal antibody on established murine B16 melanoma liver metastases. Cancer Res. 1987;47:2771. [PubMed] [Google Scholar]
- 8.Gaffen SL, Goldsmith MA, Greene WC (1998) Interleukin-2 and the interleukin-2 receptor. The cytokine handbook. Academic, San Diego
- 9.Hanes J, Sills A, Zhao Z, Suh KW, Tyler B, DiMeco F, Brat DJ, Choti MA, Leong KW, Pardoll DM, Brem H. Controlled local delivery of interleukin-2 by biodegradable polymers protects animals from experimental brain tumors and liver tumors. Pharm Res. 2001;18:899. doi: 10.1023/a:1010963307097. [DOI] [PubMed] [Google Scholar]
- 10.Kim TS, Xu WS, Sun T, Cohen EP. Immunization with interleukin-2/interferon-gamma double cytokine-secreting allogeneic fibroblasts prolongs the survival of mice with melanoma. Melanoma Res. 1995;5:217. doi: 10.1097/00008390-199508000-00003. [DOI] [PubMed] [Google Scholar]
- 11.Koppenhagen FJ, Kupcu Z, Wallner G, Crommelin DJ, Wagner E, Storm G, Kircheis R. Sustained cytokine delivery for anticancer vaccination: liposomes as alternative for gene-transfected tumor cells. Clin Cancer Res. 1998;4:1881. [PubMed] [Google Scholar]
- 12.Krup OC, Kroll I, Bose G, Falkenberg FW. Cytokine depot formulations as adjuvants for tumor vaccines. I. Liposome-encapsulated IL-2 as a depot formulation. J Immunother. 1999;22:525. doi: 10.1097/00002371-199911000-00007. [DOI] [PubMed] [Google Scholar]
- 13.Lohr F, Lo DY, Zaharoff DA, Hu K, Zhang X, Li Y, Zhao Y, Dewhirst MW, Yuan F, Li CY. Effective tumor therapy with plasmid-encoded cytokines combined with in vivo electroporation. Cancer Res. 2001;61:3281. [PubMed] [Google Scholar]
- 14.Lotze MT, Matory YL, Ettinghausen SE, Rayner AA, Sharrow SO, Seipp CA, Custer MC, Rosenberg SA. In vivo administration of purified human interleukin 2. II. Half life, immunologic effects, and expansion of peripheral lymphoid cells in vivo with recombinant IL 2. J Immunol. 1985;135:2865. [PubMed] [Google Scholar]
- 15.Milici AJ, Watrous NE, Stukenbrok H, Palade GE. Transcytosis of albumin in capillary endothelium. J Cell Biol. 1987;105:2603. doi: 10.1083/jcb.105.6.2603. [DOI] [PMC free article] [PubMed] [Google Scholar]
- 16.Moore PA, Belvedere O, Orr A, Pieri K, LaFleur DW, Feng P, Soppet D, Charters M, Gentz R, Parmelee D, Li Y, Galperina O, Giri J, Roschke V, Nardelli B, Carrell J, Sosnovtseva S, Greenfield W, Ruben SM, Olsen HS, Fikes J, Hilbert DM. BLyS: member of the tumor necrosis factor family and B lymphocyte stimulator. Science. 1999;285:260. doi: 10.1126/science.285.5425.260. [DOI] [PubMed] [Google Scholar]
- 17.Morgan DA, Ruscetti FW, Gallo R. Selective in vitro growth of T lymphocytes from normal bone marrows. Science. 1976;193:1007. doi: 10.1126/science.181845. [DOI] [PubMed] [Google Scholar]
- 18.Neville ME, Robb RJ, Popescu MC. In situ vaccination against a non-immunogenic tumour using intratumoural injections of liposomal interleukin 2. Cytokine. 2001;16:239. doi: 10.1006/cyto.2001.0963. [DOI] [PubMed] [Google Scholar]
- 19.Parker JC, Ryan J, Taylor AE. Plasma-lymph albumin kinetics, total lymph flow, and tissue hematocrit in normally hydrated dog lungs. Microvasc Res. 1984;28:254. doi: 10.1016/0026-2862(84)90021-9. [DOI] [PubMed] [Google Scholar]
- 20.Perussia B, Ramoni C, Anegon I, Cuturi MC, Faust J, Trinchieri G. Preferential proliferation of natural killer cells among peripheral blood mononuclear cells cocultured with B lymphoblastoid cell lines. Nat Immun Cell Growth Regul. 1987;6:171. [PubMed] [Google Scholar]
- 21.Peters T., Jr . All about albumin; biochemistry, genetics, and medical applications. San Diego: Academic; 1996. [Google Scholar]
- 22.Piscitelli SC, Bhat N, Pau A. A risk-benefit assessment of interleukin-2 as an adjunct to antiviral therapy in HIV infection. Drug Safety. 2000;22:19. doi: 10.2165/00002018-200022010-00003. [DOI] [PubMed] [Google Scholar]
- 23.Robb RJ, Smith KA. Heterogeneity of human T cell growth factor(s) due to variable glycosylation. Mol Immunol. 1981;18:1087. doi: 10.1016/0161-5890(81)90024-9. [DOI] [PubMed] [Google Scholar]
- 24.Rosenberg SA. Progress in human tumour immunology and immunotherapy. Nature. 2001;411:380. doi: 10.1038/35077246. [DOI] [PubMed] [Google Scholar]
- 25.Rubin JT, Elwood LJ, Rosenberg SA, Lotze MT. Immunohistochemical correlates of response to recombinant interleukin-2-based immunotherapy in humans. Cancer Res. 1989;49:7086. [PubMed] [Google Scholar]
- 26.Rutili G, Arfors KE. Protein concentration in interstitial and lymphatic fluids from the subcutaneous tissue. Acta Physiol Scand. 1977;99:1. doi: 10.1111/j.1748-1716.1977.tb10345.x. [DOI] [PubMed] [Google Scholar]
- 27.Salup RR, Herberman RB, Chirigos MA, Back T, Wiltrout RH. Therapy of peritoneal murine cancer with biological response modifiers. J Immunopharmacol. 1985;7:417. doi: 10.3109/08923978509026485. [DOI] [PubMed] [Google Scholar]
- 28.Sato T. Locoregional immuno(bio)therapy for liver metastases. Semin Oncol. 2002;29:160. doi: 10.1053/sonc.2002.31716. [DOI] [PubMed] [Google Scholar]
- 29.Schnitzer JE, Oh P. Albondin-mediated capillary permeability to albumin. Differential role of receptors in endothelial transcytosis and endocytosis of native and modified albumins. J Biol Chem. 1994;269:6072. [PubMed] [Google Scholar]
- 30.Schultze HE, Heremans JF. Molecular biology of human proteins, with special reference to plasma proteins. Amsterdam: Elsevier; 1966. [Google Scholar]
- 31.Smith KA. IL-2. In: Oppenheim JJ, Feldman M, editors. Cytokine reference: a compendium of cytokines and other mediators of host defense. New York: Academic; 2000. [Google Scholar]
- 32.Taniguchi T, Matsui H, Fujita T, Takaoka C, Kashima N, Yoshimoto R, Hamuro J. Structure and expression of a cloned cDNA for human interleukin-2. Nature. 1983;302:305. doi: 10.1038/302305a0. [DOI] [PubMed] [Google Scholar]
- 33.Wigginton JM, Komschlies KL, Back TC, Franco JL, Brunda MJ, Wiltrout RH. Administration of interleukin 12 with pulse interleukin 2 and the rapid and complete eradication of murine renal carcinoma. J Natl Cancer Inst. 1996;88:38. doi: 10.1093/jnci/88.1.38. [DOI] [PubMed] [Google Scholar]
- 34.Woll E, Bedikian A, Legha SS. Uveal melanoma: natural history and treatment options for metastatic disease. Melanoma Res. 1999;9:575. [PubMed] [Google Scholar]
- 35.Yao Z, Dai W, Perry J, Brechbiel MW, Sung C. Effect of albumin fusion on the biodistribution of inter-leukin-2. Cancer Immunol Immunother. 2004;53:404. doi: 10.1007/s00262-003-0454-z. [DOI] [PMC free article] [PubMed] [Google Scholar]
- 36.Yeh P, Landais D, Lemaitre M, Maury I, Crenne JY, Becquart J, Murry-Brelier A, Boucher F, Montay G, Fleer R, et al. Design of yeast-secreted albumin derivatives for human therapy: biological and antiviral properties of a serum albumin-CD4 genetic conjugate. Proc Natl Acad Sci USA. 1992;89:1904. doi: 10.1073/pnas.89.5.1904. [DOI] [PMC free article] [PubMed] [Google Scholar]
- 37.Yuan F. Transvascular drug delivery in solid tumors. Semin Radiat Oncol. 1998;8:164. doi: 10.1016/s1053-4296(98)80042-8. [DOI] [PubMed] [Google Scholar]
- 38.Yuan F, Dellian M, Fukumura D, Leunig M, Berk DA, Torchilin VP, Jain RK. Vascular permeability in a human tumor xenograft: molecular size dependence and cutoff size. Cancer Res. 1995;55:3752. [PubMed] [Google Scholar]