

Abstract
BACKGROUND & AIMS:
Incapacitated regulatory T cells (Tregs) contribute to immune-mediated diseases. Inflammatory Tregs are evident during human inflammatory bowel disease (IBD); however, mechanisms driving the development of these cells and their function are not well understood. Therefore, we investigated the role of cellular metabolism in Tregs relevant to gut homeostasis.
METHODS:
Using human Tregs, we performed mitochondrial ultrastructural studies via electron microscopy and confocal imaging, biochemical and protein analyses using proximity ligation assay, immunoblotting, mass cytometry and fluorescence-activated cell sorting, metabolomics, gene expression analysis, and real-time metabolic profiling utilizing Seahorse XF analyzer. We utilized Crohn’s disease single-cell RNA sequencing dataset to infer therapeutic relevance of targeting metabolic pathways in inflammatory Tregs. We examined the superior functionality of genetically-modified Tregs in CD4+ T cell-induced murine colitis models.
RESULTS:
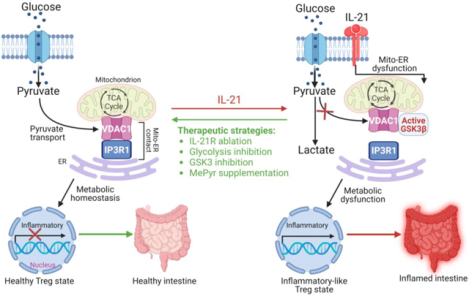
Mitochondria-endoplasmic reticulum (ER) appositions, known to mediate pyruvate entry into mitochondria via VDAC1, are abundant in Tregs. VDAC1 inhibition perturbed pyruvate metabolism, eliciting sensitization to other inflammatory signals reversible by membrane-permeable methyl pyruvate (MePyr) supplementation. Notably, IL-21 diminished mitochondria-ER appositions, resulting in enhanced enzymatic function of glycogen synthase kinase 3 β (GSK3β), a putative negative regulator of VDAC1, and a hypermetabolic state that amplified Treg inflammatory response. MePyr and GSK3β pharmacologic inhibitor (LY2090314) reversed IL-21-induced metabolic rewiring and inflammatory state. Moreover, IL-21-induced metabolic genes in Tregs in vitro were enriched in human Crohn’s disease intestinal Tregs. Adoptively transferred Il21r−/− Tregs efficiently rescued murine colitis in contrast to wild-type Tregs.
CONCLUSIONS:
IL-21 triggers metabolic dysfunction associated with Treg inflammatory response. Inhibiting IL-21-induced metabolism in Tregs may mitigate CD4+ T cell-driven chronic intestinal inflammation.
Keywords: Inflammatory Bowel Disease, Regulatory T cells, Mitochondria-ER appositions, Pyruvate, Interleukins
Graphical Abstract
Introduction
Persistent activation of diverse cytokine pathways in adaptive immune cells, such as CD4+ T cell subsets, is a hallmark of immune-mediated diseases, including human inflammatory bowel disease (IBD)1. IBD, mainly Crohn’s disease (CD) and ulcerative colitis (UC), is a relapsing disorder characterized by gastrointestinal tissue damage and extraintestinal manifestations, with a high rate of surgical interventions2. Despite the therapeutic success of biologics against T cells, such as anti-tumor necrosis factor α (TNF-α), anti-p40 subunit shared by interleukin-12 (IL-12) and IL-23, and anti-integrin, inconsistent patient response remains a clinical concern3. Thus, our understanding of IBD is incomplete, highlighting the need to investigate critical drivers of inflammatory CD4+ T cells to uncover resistance mechanisms and maximize responsiveness.
Upon antigen-induced activation, naïve CD4+ T cells consume glucose, proliferate, and differentiate into functionally distinct regulatory and effector T helper (Th) cell lineages, as evidenced by unique transcription factor expression, metabolic programs, and cytokine expression4. In regulatory T cells (Tregs), transforming growth factor-beta 1 (TGF-β1) sustains the expression of Treg-defining forkhead domain-containing protein 3 (FOXP3) transcription factor necessary to subdue effector T cell-driven diseases5, 6. Indeed, patients and mice lacking functional TGF-β1 develop multiorgan inflammation including IBD7, 8.
The recent discovery of the interface between the immune system and metabolism is contributing immensely to our understanding of the complexity of immune cell regulation. Metabolic pathways differentially govern T cell differentiation and immune response, such as intracellular cytokine production and cell trafficking9. For instance, activated CD4+ T cells favor glycolysis (conversion of glucose-derived pyruvate to lactate) and glutaminolysis, with decreased entry of pyruvate into mitochondria10, 11. Pyruvate lies at the intersection between glycolysis and mitochondrial tricarboxylic acid (TCA) cycle, where immunometabolic hubs controlled by mitochondria-associated membranes (MAMs) are present12. However, how micro-environmental cues control pyruvate metabolism in human Tregs is unclear. Metabolites not only promote the activity of the electron transport chain (ETC) but also enhance the generation of mitochondrial reactive oxygen species (mtROS) and mitochondrial DNA linked to signaling events and cellular function13. While several metabolic pathways, including glycolysis, underlie effector CD4+ T cell-mediated pathologies14, it is unresolved whether metabolic dysfunction is associated with Treg abnormality reported during human IBD pathogenesis15–18. Extracellular cues, such as TGF-β1, IL-6, IL-12, IL-21, and IL-23, are known to control the balance between Treg and effector T cell response1, 19. Yet how Tregs sense extracellular cues and integrate signals by fine-tuning MAMs to reshape extra- and intra-cellular metabolites, intracellular cytokines, cell migration, and immune response in healthy and inflammatory conditions are poorly understood. Thus, we explored the possible role of MAMs, such as those enriched with the endoplasmic reticulum (ER), in responding to cues that control metabolic signaling events relevant to Treg immune-suppressive function.
Here, we showed that inhibition of pyruvate transport at mitochondria-associated ER membranes or the inner mitochondrial membrane (IMM) in induced Tregs (iTregs) triggered metabolic changes that resulted in sensitization to the acquisition of an effector T cell phenotype. Moreover, we identified IL-21 as the cytokine that uncoupled mitochondria from ER, resulting in enhanced glycogen synthase kinase 3 β (GSK3β) function, metabolic rewiring including glycolysis, pyruvate accumulation and exacerbation of IL-12-induced inflammatory response. Like GSK3β pharmacologic inhibition, supplementation of iTregs with mitochondria membrane-permeable methyl pyruvate impaired glycolysis and inflammatory response triggered by IL-21 and IL-12. Overall, IL-21 exploited GSK3β, a metabolic checkpoint, to promote intracellular rewiring of iTregs. Notably, we found that IL-21-induced metabolic genes in iTregs were significantly enriched in intestinal Tregs of refractory IBD patients. In naïve CD4+ T cell-induced murine colitis, IL-21 receptor (IL-21R)-deficient Tregs were more efficient in alleviating disease severity than wild-type Tregs.
Materials and Methods
Please see Supplementary Materials and Methods Section.
Results
Mitochondria-ER Appositions are Present in Human Tregs
Mitochondria and ER membranes can serve as immunometabolic hubs involved in facilitating pyruvate metabolism and mitochondrial respiration20, 21. At mitochondria-ER junctions, voltage-dependent anion channel 1 (VDAC1) on the outer mitochondrial membrane (OMM) and inositol triphosphate receptor 1 (IP3R1) on the ER tethers mitochondria and ER membranes to facilitate mitochondrial influx of pyruvate12, 22, 23. Yet limited data exist about how mitochondria-ER actively transform its ultrastructure to regulate Treg immune response. We therefore performed fundamental characterization of human Tregs to identify mitochondrial-ER appositions.
Induced Tregs (iTregs), well established to function in vitro and in vivo24, were derived from naïve CD4+ T cells isolated from healthy human peripheral blood mononuclear cell (PBMC) donors (Figure 1A). Human iTregs and naïve control cells were subjected to transmission electron microscopy (TEM) to visualize mitochondria. Electron microscopy images showed that iTregs displayed a higher percentage of mitochondria in close association with ER than naïve cells where these interactions were minimal (59.04% vs. 3.27%, P < 0.0001, Figure 1B, C). Thus, electron-dense zones between the OMM and ER at contact sites in iTregs indicated that these were distinct subcellular structures (Figure 1B bottom panels – black arrows). TEM also revealed disparities in mitochondrial morphology. Human iTregs displayed long, tubular mitochondria associated with mitochondrial respiration25, while mitochondria in naïve cells were rounded (mitochondrial aspect ratio per cell: 3.11 vs. 1.67, P < 0.0001, and aspect ratio per mitochondrion: 3.25 vs. 1.68, P < 0.0001, Supplementary Figure 1A–C). We substantiated our EM ultrastructural assessment with fluorescent-based organelle tracking in live cells. Imaging data showed higher mitochondria-ER co-localization in iTregs than in naïve cells (Pearson’s coefficient of 0.58 vs. 0.39, P < 0.001, and 0.56 vs. 0.44, P < 0.01, using two different MitoTracker dyes, Supplementary Figure 1D, E). Fixed iTregs and CD4+ CD25+ CD127dim/− T cells (human natural Tregs) were stained with VDAC1 and IP3R1 monoclonal antibodies, then subjected to proximity ligation assay (PLA) to biochemically quantify mitochondria-ER interactions. PLA can reliably detect protein-protein interactions of ≤ 30 nm distance in situ with high specificity and sensitivity. The discrete red PLA signals suggested that mitochondria-ER appositions were present in iTregs (Figure 1D, E) and natural Tregs (Supplementary Figure 1F).
Figure 1. Mitochondria-ER Appositions are Present in Human Tregs.
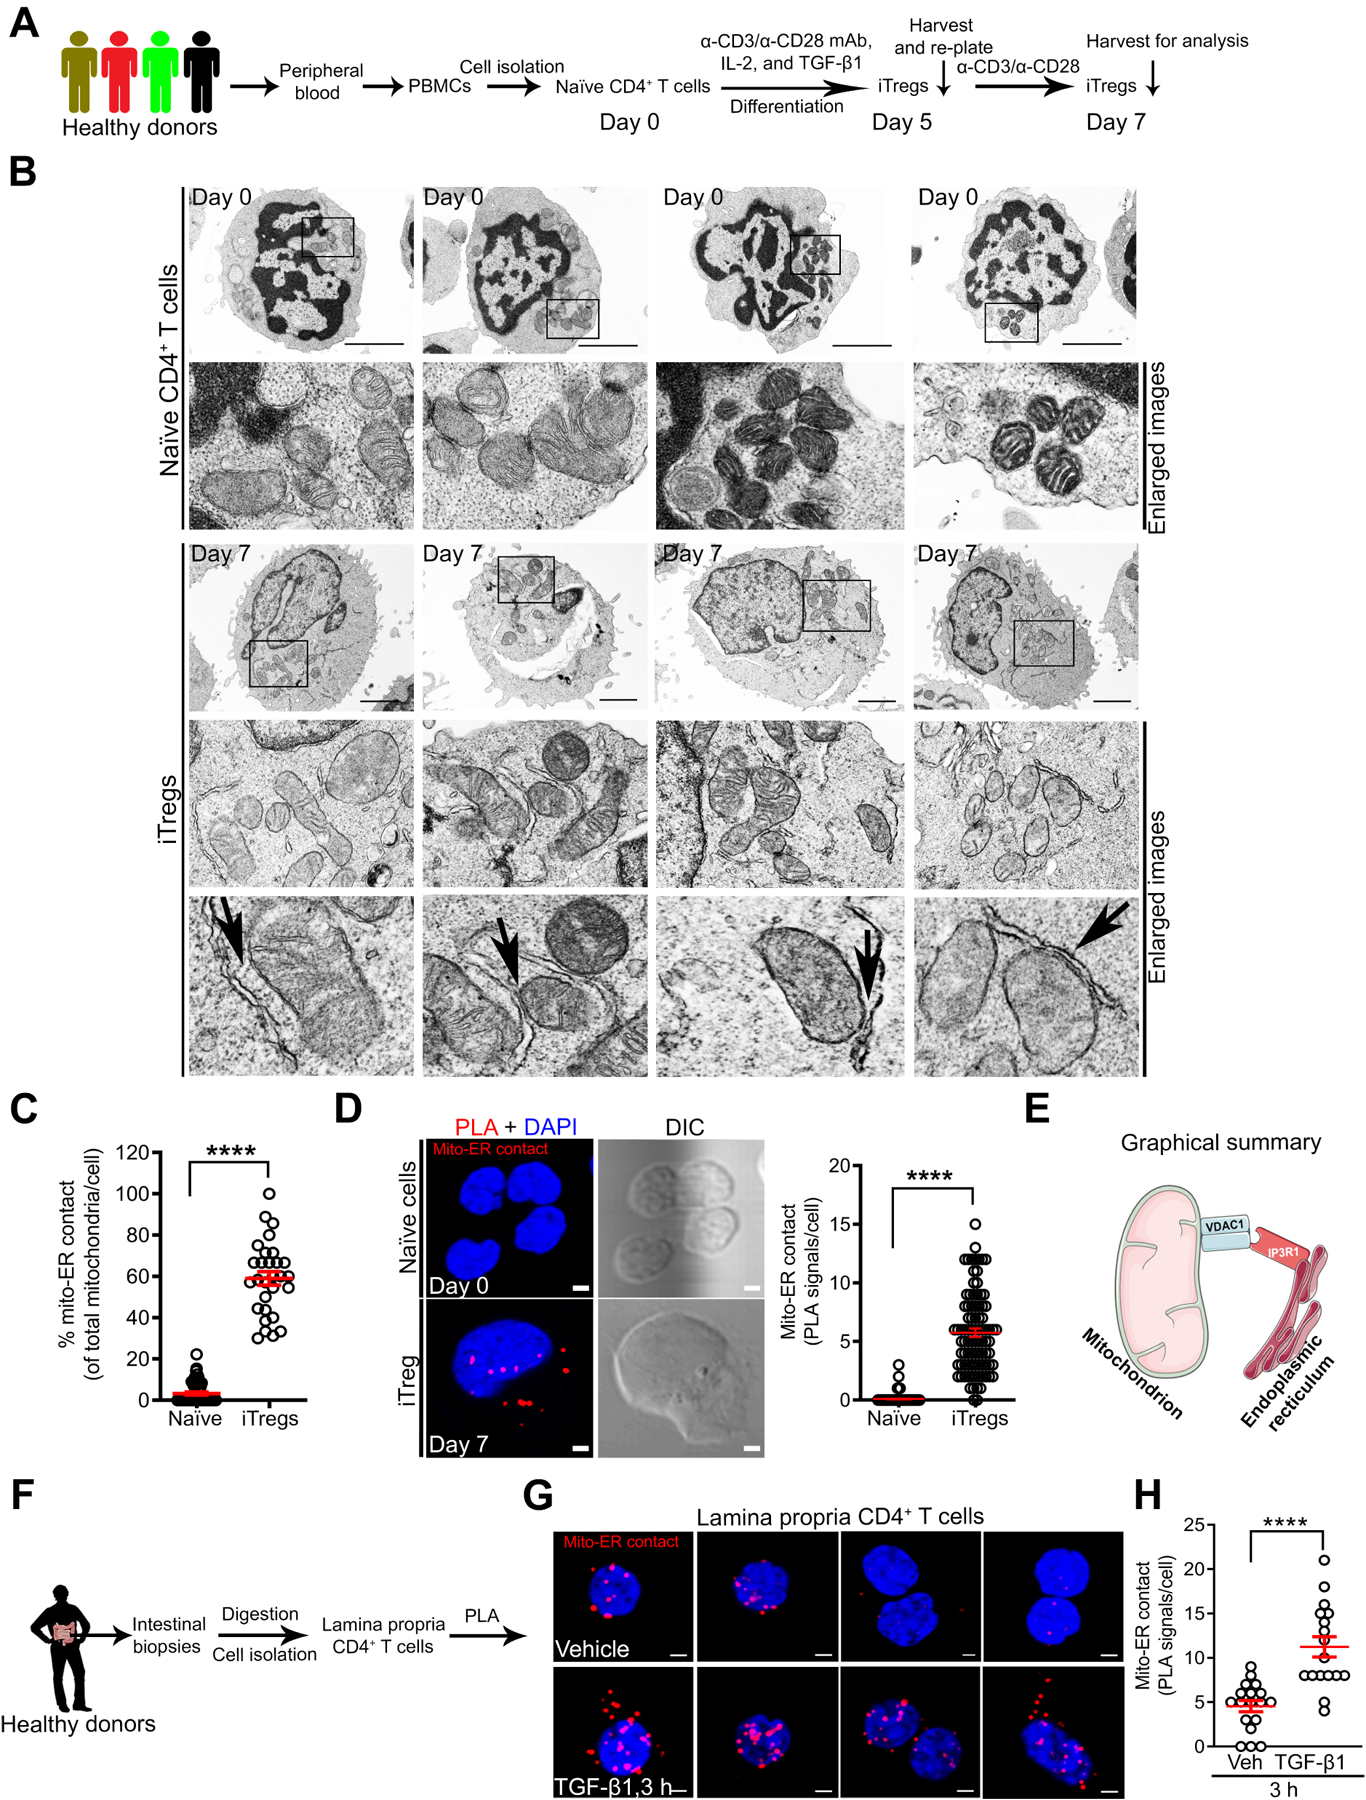
(A) Experimental workflow for naïve CD4+ T cell isolation from PBMCs and differentiation into iTregs.
(B and C) Transmission electron microscopy (TEM) images of naïve cells (top panels) vs. iTregs (bottom panels) with enlarged images of mitochondria (mito)-ER contact. Black arrows indicate electron-dense regions; scale bars, 2 μm (B). Graph shows mitochondria in contact with ER per cell in TEM images; naïve cells (n = 51) and iTregs (n = 29) (C).
(D) Representative images show mito-ER contact in red after PLA, cell structure in differential interference contrast (DIC), and nucleus stained with 4’,6’-diamidino-2-phenylinode (DAPI) (DNA, blue); scale bar, 2 μm. Graph shows the number of PLA signals (mito-ER contact) per cell (n = 239 iTregs, n = 90 naïve cells).
(E) Graphical summary of mitochondria-ER interaction detected via VDAC1-IP3R1 binding in human Tregs.
(F) Experimental workflow for lamina propria (LP) CD4+ T cell isolation and PLA.
(G) Representative images show mito-ER contact in red, DAPI in LP CD4+ T cells in the presence (bottom panels) or absence (top panels) of (±) TGF-β1 (25 ng/ml) stimulation; scale bar, 2 μm.
(H) Graph shows quantitation of mito-ER contact (PLA signals) per LP CD4+ T cell; vehicle-stimulated cells (n = 17) and TGF-β1-stimulated cells (n = 18).
Data represents mean ± SEM from 2–3 independent experiments or biological replicates. **** p < 0.0001, using two-tailed Student’s t-test.
Healthy lamina propria (LP) CD4+ T cells known to exhibit Treg-like phenotype and respond to TGF-β126, 27 were isolated from human intestinal biopsies and examined for mitochondria-ER interaction via PLA (Figure 1F). We found mitochondria-ER interactions in a subset of LP CD4+ T cells (Figure 1G top panels), and these interactions were enhanced by TGF-β1 (4 vs. 11 PLA signals per cell, P < 0.0001, Figure 1G, H). IP3R1 interaction was specific to VDAC1 in contrast to translocase of the outer mitochondrial membrane 20 (TOM20) where TOM20-IP3R1 binding was minimal (98% vs. 5% PLA+ LP CD4+ T cells, P < 0.0001, Supplementary Figure 1G), which supports the specificity of this interaction. Using complementary approaches in human samples, mitochondria-ER interactions – detected via VDAC1-IP3R1 binding – are present in human Tregs.
VDAC1 Inhibition Alters iTreg Metabolic State and Sensitizes to IL-12-induced Inflammatory Response
Previous study has demonstrated the capacity to generate functional iTregs in the absence of TGF-β128. We showed VDAC1-IP3R1 interactions, i.e., mitochondria-ER appositions, were more abundant in iTregs generated in the presence of TGF-β1 than iTregs derived in the absence of TGF-β1 on day 5 (P < 0.001) and 7 (P < 0.001) as shown Figure 2A–C. As controls, we showed successful development of FOXP3+ cells in both cell types (Supplementary Figure 2A), while TGF-β1-induced CD103 (αE) integrin29 confirmed cellular responsiveness to TGF-β1 (Supplementary Figure 2B). Mitochondria-ER interaction has been linked to mitochondrial pyruvate transport and oxidative phosphorylation (OXPHOS)12, 20. Consistent with these reports, oxygen consumption rate (OCR) was higher in iTregs generated in the presence of TGF-β1 than iTregs derived in the absence of TGF-β1, as evidenced by increased basal, ATP-coupled, and FCCP-induced OCR (Figure 2D). In summary, abundant mitochondria-ER interactions correlate with higher OCR, which we found to be less enriched in effector Th1, Th2, and Th17 cells (Figure 2E and Supplementary Figure 2C). We then explored whether perturbing mitochondria-ER function, i.e., pyruvate transport, would impact OCR and Treg immune response.
Figure 2. VDAC1 Inhibition Alters iTreg Metabolic State and Sensitizes to IL-12-induced Inflammatory Response.
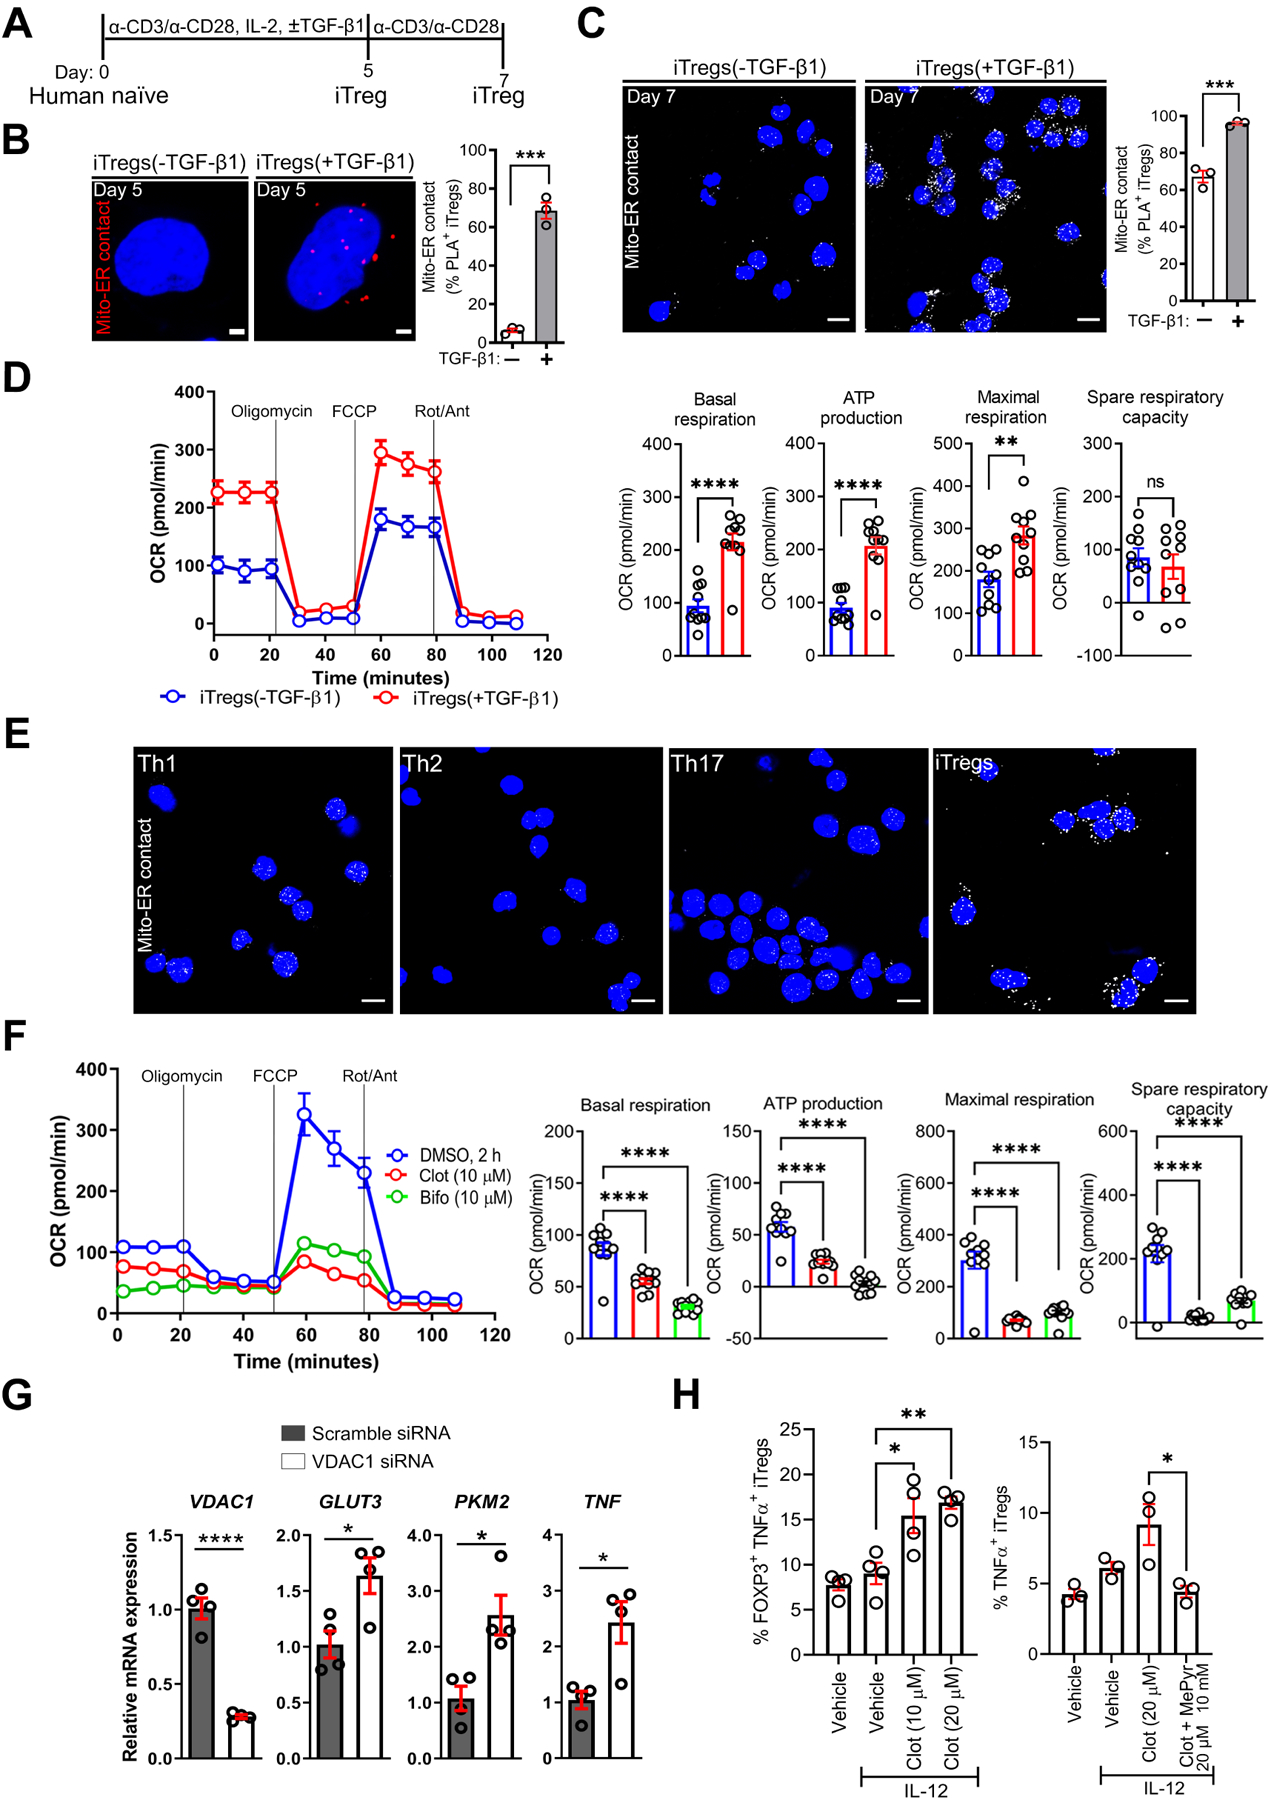
(A) Experimental workflow for the generation of human iTregs in the absence or presence of TGF-β1.
(B and C) Representative PLA images of iTregs ± TGF-β1 show mito-ER contacts in red on day 5 (B) or in white on day 7 (C); scale bars, 2 μm and 10 μm. Graphs show PLA+ cells on day 5 (n = 257 vs. n = 200) (B) and on day 7 (n = 129 vs. n = 119) (C).
(D) Representative oxygen consumption rate (OCR) profile of iTreg cell types before and after mitochondrial perturbation (n = 3). Bar graphs show calculated basal respiration, ATP production, maximal respiration, and spare respiratory capacity; mean ± SEM from 10–12 technical replicates.
(E) Representative PLA images show mito-ER contact in iTregs vs. effector T helper cells (n = 3 biological donors); scale bar, 10 μm.
(F) Representative OCR profile of iTregs ± clotrimazole (clot), bifonazole (bifo) or UK5099 (n = 3). Bar graphs show calculated basal respiration, ATP production, maximal respiration, and spare respiratory capacity; mean ± SEM from 12 technical replicates.
(G) Relative mRNA expression in transfected iTregs via RT-qPCR (n = 3).
(H) Percentage of TNF-α+ in iTregs, as determined by flow cytometry (n = 3–4).
Data represents mean ± SEM. * p < 0.05, ** p < 0.01, *** p < 0.001, and **** p < 0.0001, using two-tailed Student’s t-test or one-way ANOVA followed by Bonferroni test for multiple comparisons.
At the OMM, mitochondria-ER interactions stabilize hexokinase (HK)-I localization, thereby activating VDAC1 and directing pyruvate into the IMM via the mitochondrial pyruvate carrier (MPC)12, 30, 31. Thus, we reasoned that VDAC1 inhibition in iTregs would diminish pyruvate transport and OCR. Consistent with our hypothesis, acute inhibition (2 h) of HK-I-mediated activation of VDAC1 with clotrimazole or bifonazole32, herein referred to as clot and bifo (10–20 μM), reduced OCR (basal OCR, ATP-linked OCR, FCCP-induced maximal OCR, space respiratory capacity: P < 0.0001, Figure 2F). Similarly, UK5099 (2–20 μM, 2 h)-mediated destabilization of MPC protein complexes decreased OCR (ATP-linked OCR: P < 0.05, FCCP-induced maximal OCR: P < 0.0001, spare respiratory capacity: P < 0.0001) Supplementary Figure 2D). Of note, siRNA-mediated depletion of VDAC1 increased the mRNA expression of TNF (P < 0.05) and glycolysis genes, such as glucose transporter 3 (GLUT3; SLC2A3, P < 0.0001) and pyruvate kinase M 2 (PKM2, P < 0.05) (Figure 2G). In agreement with VDAC1 depletion, clotrimazole treatment sensitized cells to IL-12, a known activator of signal transducer and activator of transcription 4 (STAT4) and Th1 signature TNF-α and IFN-γ cytokines, as evidenced by increased percentage of TNF-α+ iTregs (Figure 2H left). Mechanistically tying this inflammatory response to impaired mitochondrial pyruvate transport, supplementation with methyl pyruvate (MePyr, 10 mM), a mitochondria membrane-permeable metabolite (Figure 2H right), reversed clotrimazole-mediated TNF-α production. Like the VDAC1 inhibitor, UK5099 increased the percentage of IL-12-induced IFN-γ+ iTregs, with IFN-γ+ iTregs enriched in T cell homing CD49D (α4) integrin (Supplementary Figure 2E). By utilizing various approaches, we inferred that interfering with pyruvate transport at the OMM or IMM induced metabolic rewiring that sensitized iTregs to acquiring an effector T cell-like phenotype (Supplementary Figure 2F). These experiments mechanistically linked pyruvate transport to metabolic homeostasis that limits iTreg inflammatory response. We then explored whether extracellular cues could trigger metabolic alterations and inflammatory responses by altering mitochondria-ER ultrastructure.
IL-21 Stimulation of Human iTregs Promotes a Hypermetabolic State
IL-21 can enhance IFN-γ and IL-17 expression in LP T cells from human IBD subjects33, 34, mirroring MPC inhibition. We then hypothesized that exposure of iTregs to IL-21 would induce metabolic alterations linked to inflammatory response. Indeed, Central Metabolism PCR Array and RT-qPCR demonstrated that IL-21 independently upregulated transcripts of rate-limiting enzymes associated with glycolysis and effector T cell response14 (Figure 3 and Supplementary Figure 3). These include SLC2A3 (GLUT3), hexokinase 2 (HK2), glucose phosphate isomerase (GPI), enolase 1/2 (ENO1/2), glyceraldehyde 3-phosphate dehydrogenase (GAPDH), PKM2, monocarboxylate transporter 4 (MCT4, also known as SLC16A3), and hypoxia-inducible factor 1 alpha (HIF1A) (Figure 3A–C, 3F). IL-21 also amplified the citrate-to-acetyl-CoA shuttle system previously associated with glycolytic-lipogenic metabolism in Th17 cells35. These include citrate synthase (CS), citrate transporter (SLC25A1), ATP citrate lyase (ACYL), acetyl-CoA carboxylase 1 (ACC1; ACACA), and fatty acid synthase (FASN) (Figure 3A, D, E). IL-21 transcriptionally activated fatty acid oxidation (FAO) and glutaminolysis that are known to support the TCA cycle, OXPHOS, and anabolic demands (Figure 3A, B), including glutamate oxaloacetate transaminase 1 (GOT1) previously linked to 2-hydroxyglutarate (2-HG) generation and Th17 cell commitment36. IL-21 did not have a significant effect on FOXP3 and TGFB1 mRNA (Figure 3F, 3G). In summary, profiling of IL-21-stimulated iTregs suggests a metabolic rewiring to glycolysis and other compensatory pathways (Figure 3H). IL-21-induced metabolism was associated with inflammatory response, as evidenced by elevated IFNG, IL17A, and IL17F (P < 0.05, Figure 3I) while there was no reduction in the percentage of cells expressing FOXP3 and other markers (Figure 3J).
Figure 3. IL-21 Stimulation of Human iTregs Promotes a Hypermetabolic State.
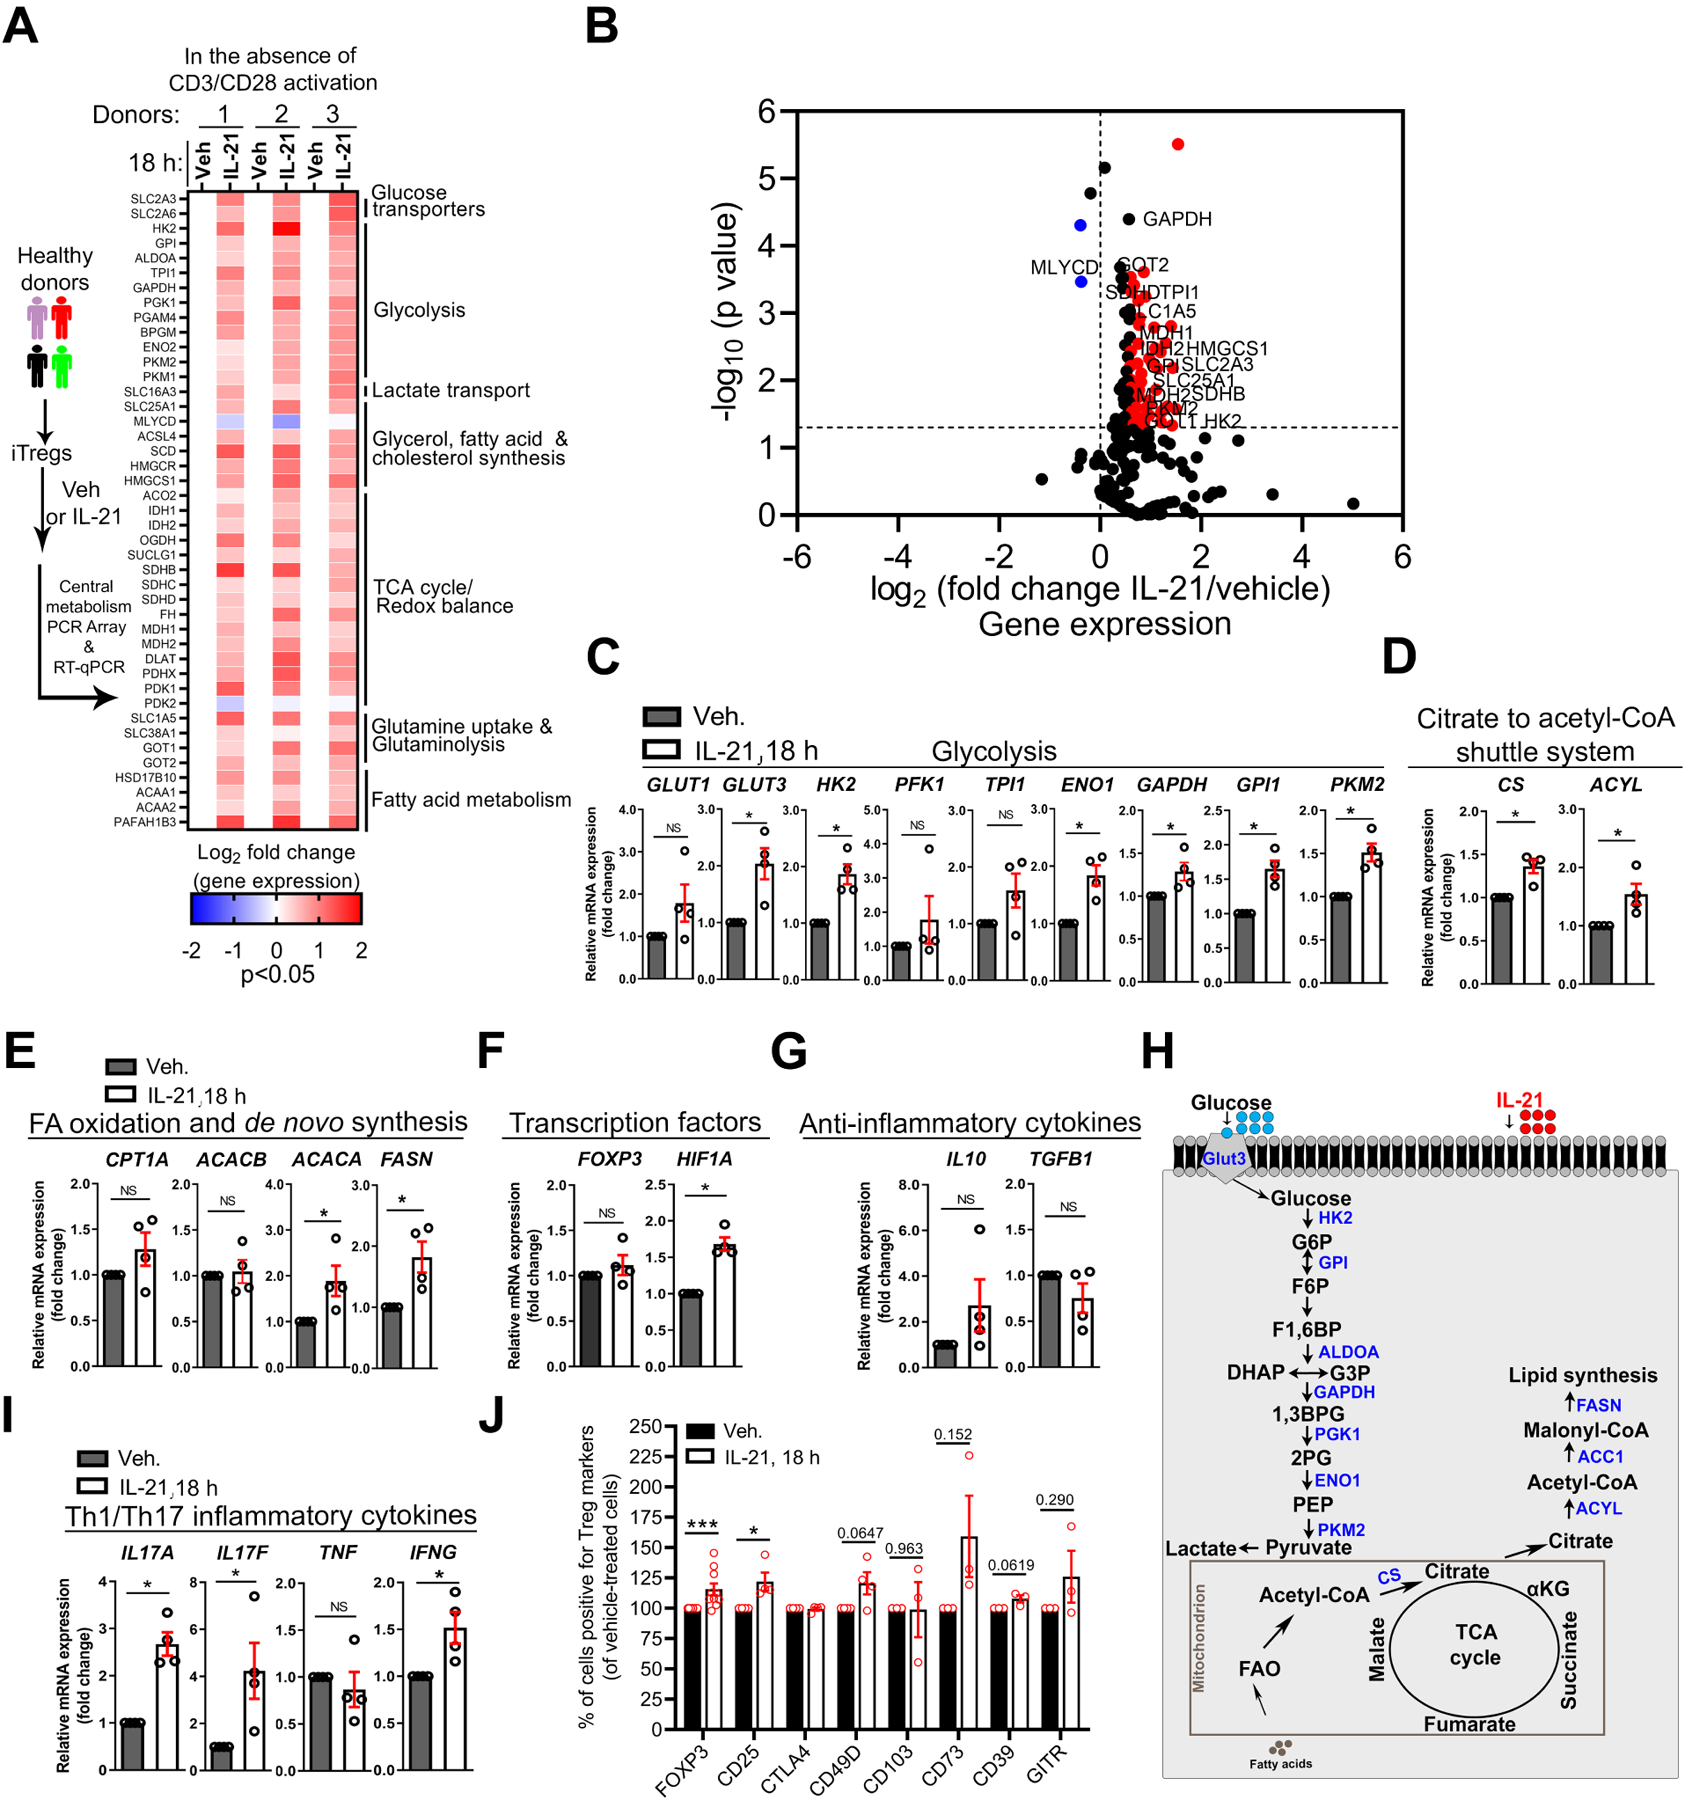
(A–I) Transcriptional profiling of human iTregs ± IL-21 (100 ng/ml) in serum-free media in the absence of TCR and CD28 activation.
(A) Left, experimental workflow for the metabolic transcriptional profiling of iTregs. Right, heatmap of 43 metabolic transcripts (IL-21/vehicle, p < 0.05) and the associated metabolic processes (n = 3).
(B) Volcano plot illustrates all detected 211 metabolic genes (IL-21/vehicle, n = 3). Red dots denote genes with >1.5-fold change and p-value of <0.05 while blue dots denote <−1.0-fold change and p-value of <0.05.
(C–G) Relative mRNA expression via RT-qPCR in iTregs ± IL-21 (n = 4). Expression of metabolic genes
(C–E), transcription factors (F), and anti-inflammatory cytokines (G); Mann-Whitney U test.
(H) Schematic illustrates metabolic genes (shown in blue) upregulated in IL-21-stimulated iTregs.
(I) Relative mRNA of inflammatory genes in iTregs via RT-qPCR ± IL-21 (n = 4); Mann-Whitney U test.
(J) Percentage of iTregs positive for FOXP3 and surface markers, as determined by FACS (n = 3–9).
Data represents mean ± SEM. * p < 0.05 and *** p < 0.001, using a two-tailed Student’s t-test. NS (not significant).
IL-21 Dissociates Mitochondria from ER, Resulting in Pyruvate Imbalance and Sensitization to IL-12-induced Inflammatory Response
Addressing a mechanism by which IL-21 induced these transcriptional changes, we found that Tregs exposed to IL-21 (2 h) displayed reduced mitochondria-ER appositions, with altered mitochondrial morphology and volume, as determined by PLA, TEM, live-cell imaging, and serial block-face scanning EM (SEM) (Figure 4A–C and Supplementary Figure 4A, B). Glucose-regulated protein 75 (GRP75) tethers VDAC1 to IP3R112, 37, and in agreement, IL-21 reduced GRP75 co-localization with mitochondria (Supplementary Figure 4C). Unlike IL-21, other control cytokines IL-6, IL-23, and IL-12 failed to disrupt mitochondria-ER interaction within the time point evaluated (Figure 4A, Supplementary Figure 4D), indicating IL-21 as a potential negative regulator of mitochondria-ER coupling. Mitochondria-ER interaction is functionally coupled to GSK3β inactivation (via phosphorylation), and subsequent VDAC1 activation and pyruvate entry into mitochondria12, 31, 38. We found that IL-21 reduced phosphorylated GSK3β (pSer9-GSK3β), the inactive form (P < 0.01 by immunoblot, P < 0.05 by FACS, Figure 4D and Supplementary Figure 4E). We and others interpret this loss of inactive form as a gain in GSK3β enzymatic activity, given the unspecific nature of antibodies raised against GSK3β active moiety. Increased pTyr705-STAT3 indicated cellular responsiveness to cytokines (Figure 4D), and IL-21 did not impact the β-catenin pathway (Supplementary Figure 4E bottom). We then speculated that IL-21-induced mitochondria-ER defect would decrease intracellular ATP, due to impaired mitochondrial pyruvate metabolism, and indeed, ATP was expectedly reduced (P < 0.05, Figure 4E). Thus, our data suggest that IL-21 uncouples mitochondria from ER, resulting in GSK3β activation and disruption of ATP production.
Figure 4. IL-21 Dissociates Mitochondria from ER, Resulting in Pyruvate Imbalance and Sensitization to IL-12-induced Inflammatory Response.
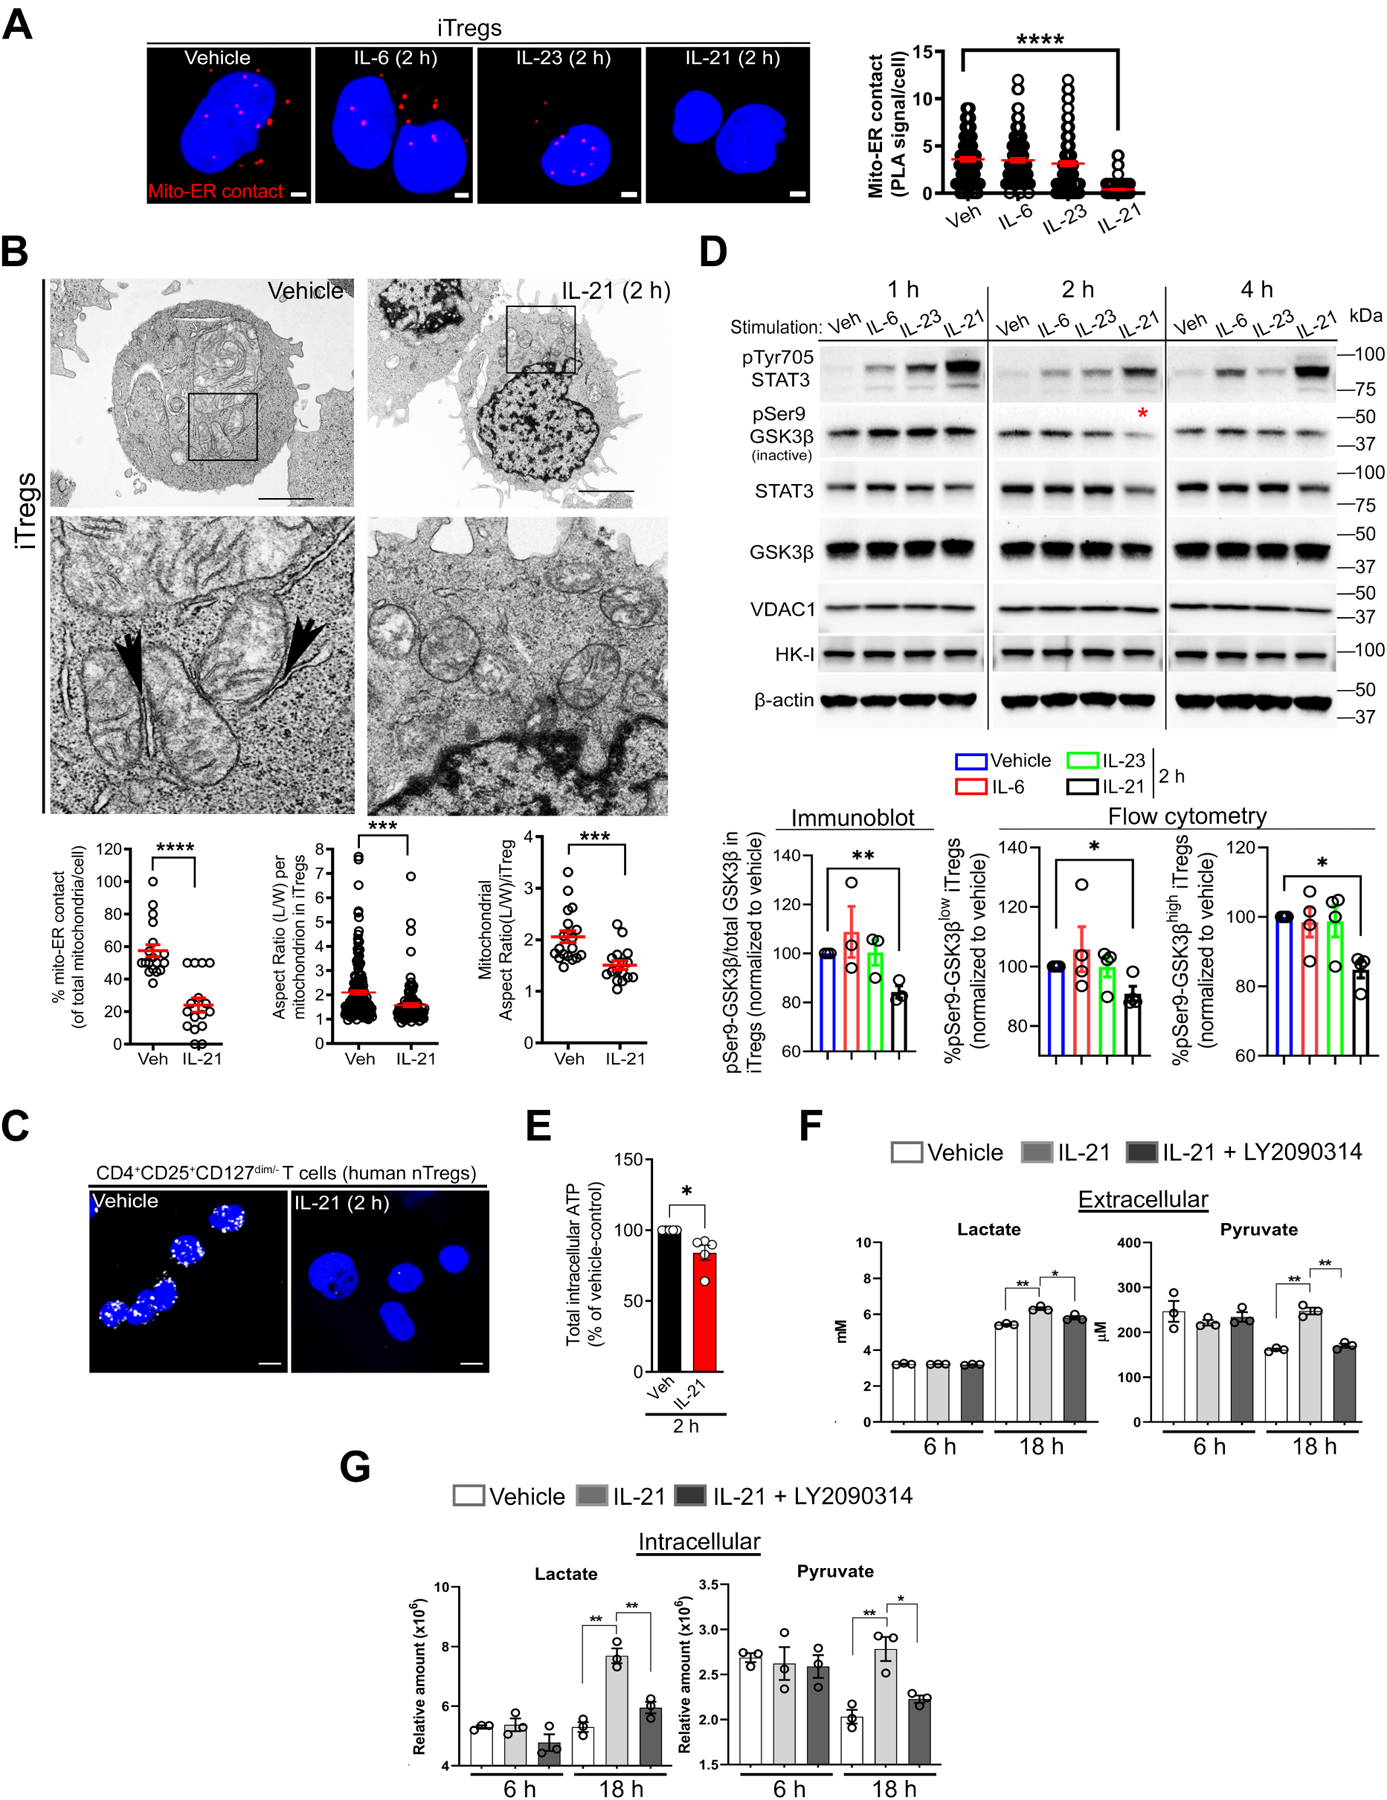
(A) Representative PLA images of mito-ER contact in iTregs ± 50 ng/ml of IL-6 (n = 113 cells), IL-23 (n = 131 cells), or IL-21 (n = 221 cells) vs. vehicle (n = 115 cells); scale bar, 2 μm. Graph shows mito-ER contact (red PLA signals) per cell (n = 2 independent experiments).
(B) Representative TEM images of iTregs ± IL-21, with black arrows indicating electron-dense regions; scale bar, 2 μm. Graphs show quantitation of mito-ER contact (n = 19 vs. n = 16 cells) (left), aspect ratio per mitochondrion (n = 167 vs. n = 101 mitochondria) (middle), and mitochondrial aspect ratio per cell (n = 19 vs. n = 16 cells) (right).
(C) Representative PLA images show mito-ER contact in human nTregs treated with vehicle or IL-21 after activation and TGF-β1 stimulation for 24 h; scale bar, 5 μm (n = 2 independent experiments).
(D) Representative immunoblots from iTregs ± cytokines (100 ng/ml). The red asterisk shows a reduction in GSK3β inactive form (top) (n = 3). Bar graphs show pSer9-GSK3β levels by immunoblot (n = 3) and the percentage of pSer9-GSK3β-expressing cells by FACS (n = 4).
(E) Intracellular ATP levels in iTregs ± IL-21 (50 ng/ml) (n = 5); Mann-Whitney U test.
(F and G) Extra- and intra-cellular lactate and pyruvate abundance in iTregs cultured in normal conditions ± IL-21 (100 ng/ml), LY2090314 GSK3 inhibitor (0.025 μM), or both (n = 3).
Data represents mean ± SEM. * p < 0.05, ** p < 0.01, *** p < 0.001, and **** p < 0.0001, using two-tailed Student’s t-test or one-way ANOVA followed by Bonferroni test for multiple comparisons.
To understand how GSK3β enzymatic activity is linked to IL-21-induced nutrient metabolism, we quantified the abundance of metabolites under standard culturing conditions. Extracellular pyruvate and lactate were more abundant in the media collected from IL-21-stimulated iTregs (6–18 h) than in vehicle-treated cells (Figure 4F); however, excreted glutamine-derived glutamate was less abundant at the 6 h early time point (Supplementary Figure 4F). IL-21 increased intracellular lactate and pyruvate levels (Figure 4G) as well as glycolysis intermediates and TCA cycle metabolites (Supplementary Figure 4G), which is consistent with data in Figure 3A. In summary, IL-21-induced mitochondria-ER defect is associated with dysregulation of extra- and intra-cellular lactate and pyruvate.
To mechanistically link GSK3β activity and pyruvate-lactate imbalance to inflammatory cytokine expression, we hypothesized that pharmacologic inhibition of active GSK3β would restore metabolite levels and consequently suppress inflammatory cytokine expression. Consistent with our hypothesis, treatment with a pharmacologic inhibitor of GSK3α and GSK3β isoforms (LY2090314)39, herein referred to as LY (0.025–0.1 μM), reversed IL-21-induced metabolite imbalance, including lactate and pyruvate levels (Figure 4F, G, and Supplementary Figure 4F, G). We then examined the anti-inflammatory effect of LY2090314 in the same experimental context as our VDAC1 and MPC inhibition studies by utilizing iTregs exposed to IL-21 and IL-12 as our model system, given that IL-21 also sensitized cells to IL-12-induced IFN-γ production (Supplementary Figure 4H). LY2090314 and the inhibitor of the rate-limiting step in glycolysis (2-deoxy-d-glucose, 2-DG, 10 μM, Supplementary Figure 4I) reduced the percentage of IFN-γ+ and TNF-α+ iTregs (Supplementary Figure 4J), which is consistent with Figure 3A and 4F, G. Using established pharmacological inhibitors14, we examined the contribution of other impacted metabolic pathways to inflammatory cytokine production (Supplementary Figure 4I). ETC complex I and III inhibitors (rotenone and antimycin A, respectively) and ATP uncoupler (FCCP) diminished the percentage of IFN-γ+ and or TNF-α+ iTregs to various extents (Supplementary Figure 4J), which is consistent with the emerging role of mitochondria in mediating T cell effector response40. On the contrary, PKM2 activator (TEPP-46) and FAO, ACYL, ACC1, TCA cycle enzyme, ETC complex II and V inhibitors had no significant effect on the percentage of IFN-γ+ and TNF-α+ iTregs (Supplementary Figure 4J, K). Collectively, IL-21 disrupts mitochondria-ER interaction and potentiates GSK3β function, resulting in metabolic alterations that promote IL-12-induced IFN-γ and TNF-α.
Methyl Pyruvate Supplementation Mirrors LY2090314 Treatment and Suppresses the Metabolic Basis of Inflammatory iTregs
We then comprehensively measured changes in OCR and ECAR (extracellular acidification rate due to lactate production, i.e., rate of glycolysis) to mechanistically investigate metabolic adaptations occurring in real-time in response to IL-21 stimulation (1–48 h). As verified in glucose concentrations (1–10 mM), IL-21 (1 h) reduced OCR (Figure 5A, B), coinciding with mitochondria-ER decoupling and GSK3β activation (Figure 3A–D). Consistent with data in Figure 3A, carnitine palmitoyltransferase 1A (CPT1A)-mediated initiation of long-chain FAO potentially contributed to IL-21-induced OCR (3–18 h) (Figure 5C, D), as CPT1A inhibitor, etomoxir (ETO, 50 μM, 3 h), restored OCR (Figure 5D). Thus, IL-21 induces OCR fluctuations, mirroring Th17 cells in which OXPHOS supports IL-17 production41, 42.
Figure 5. Methyl Pyruvate Supplementation Mirrors LY2090314 Treatment and Suppresses the Metabolic Basis of Inflammatory iTregs.
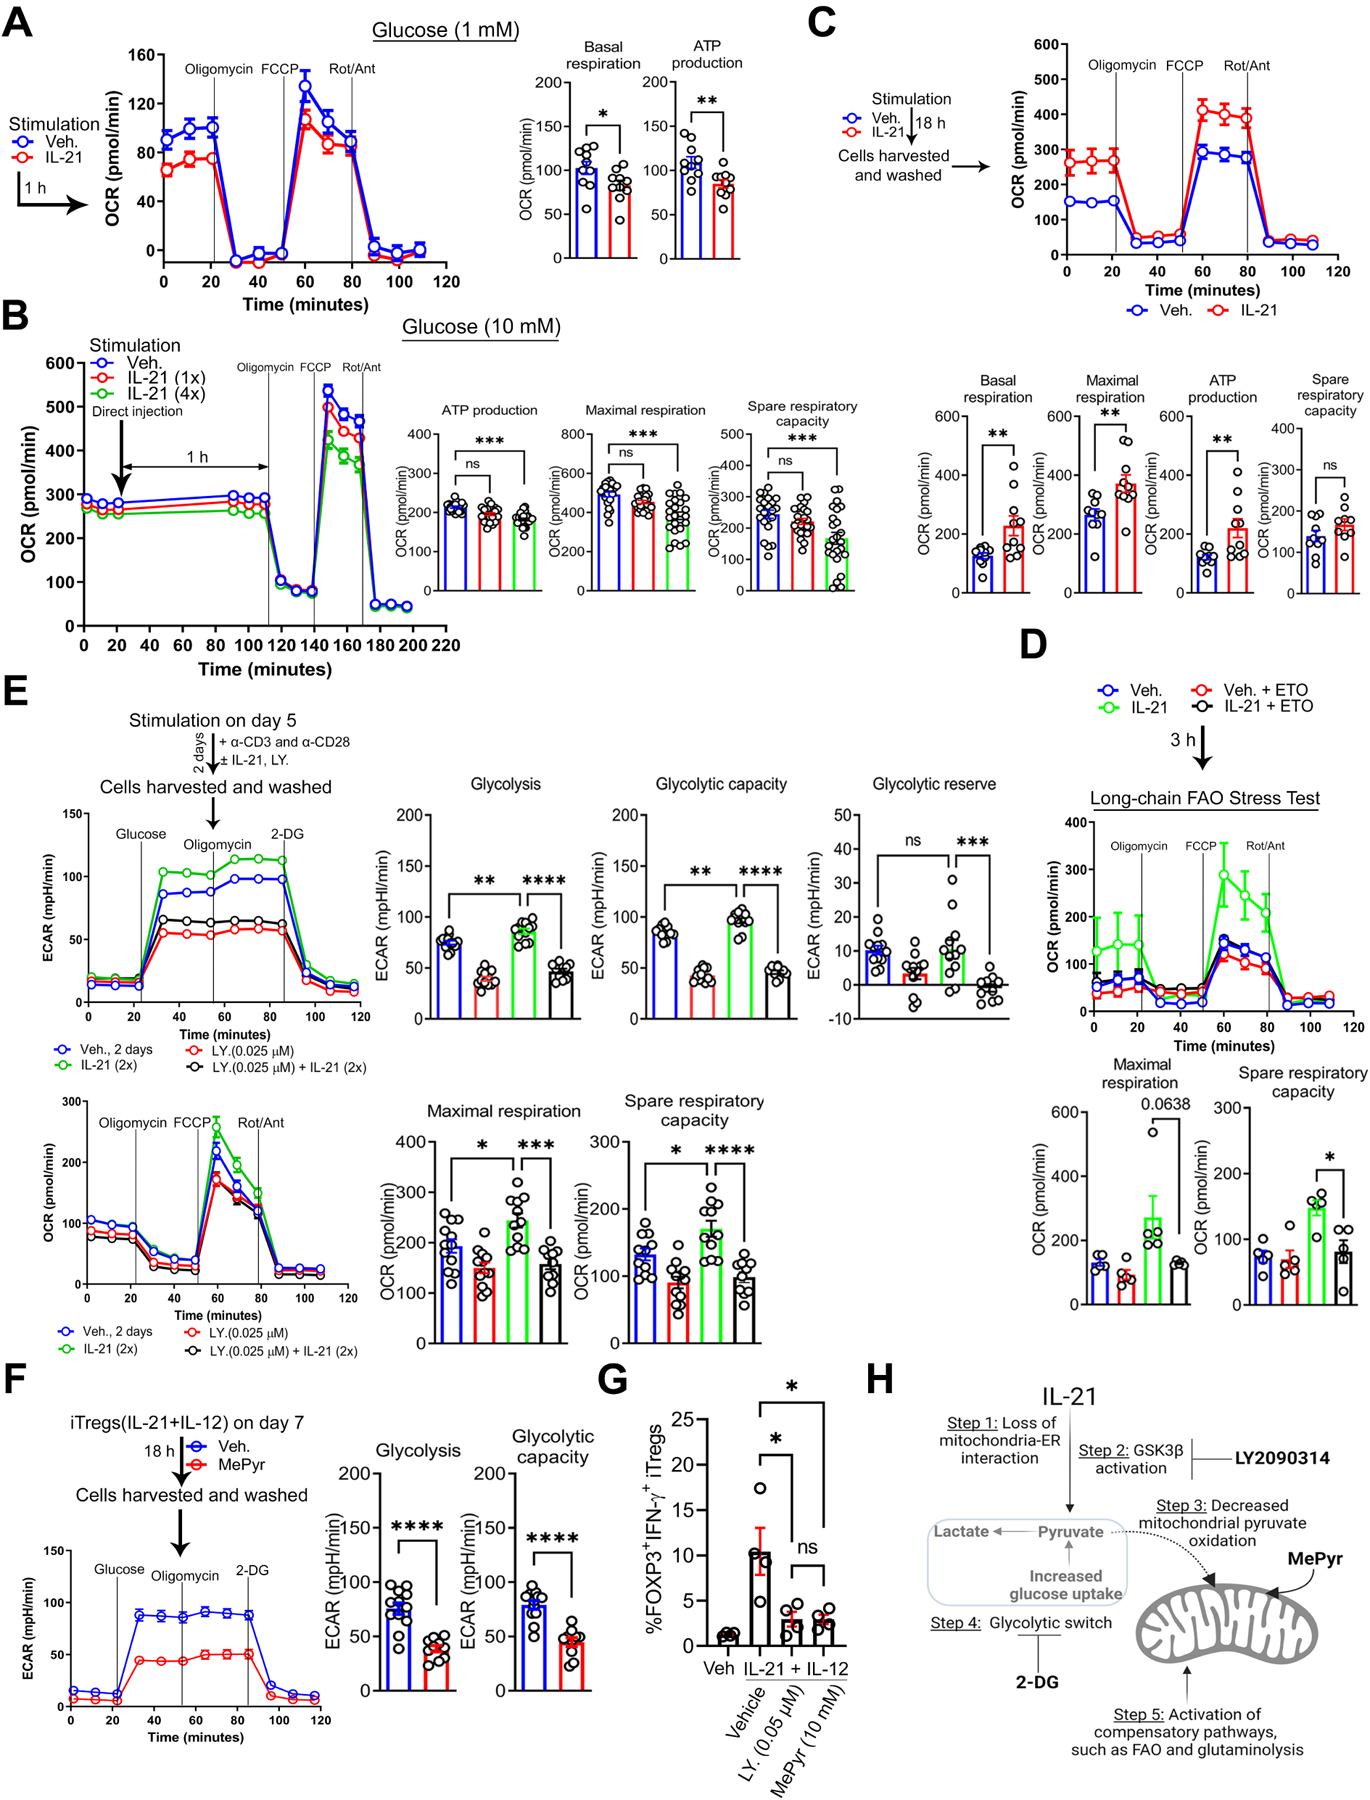
(A) Representative OCR profile of iTregs in 1 mM glucose ± IL-21 (100 ng/ml) (n = 3). Bar graphs show calculated basal respiration and ATP production; mean ± SEM from 10 technical replicates.
(B) Representative OCR profile of iTregs in 10 mM glucose ± IL-21 (100–400 ng/ml) (n = 3). Bar graphs show calculated basal respiration, ATP production, maximal respiration, and spare respiratory capacity; mean ± SEM from 10–24 technical replicates.
(C) Representative OCR profile of iTregs ± IL-21 (100 ng/ml) in the presence of TCR and CD28 activation (n = 3). Bar graphs show calculated basal respiration, maximal respiration, ATP production, and spare respiratory capacity; mean ± SEM from 10 technical replicates.
(D) Representative OCR profile of iTregs ± IL-21 (100 ng/ml), etomoxir (ETO, 50 μM), or both (n = 3). Bar graphs show calculated basal respiration, maximal respiration, ATP production, and spare respiratory capacity; mean ± SEM from 5 technical replicates.
(E) Representative ECAR (top) and OCR (bottom) profiles of iTregs ± IL-21, LY2090314, or both (n = 3). Bar graphs show calculated glycolysis, glycolytic capacity, and glycolytic reserve (top) and maximal respiration and spare respiratory capacity (bottom); mean ± SEM from 10–12 technical replicates.
(F) Representative ECAR profile of IL-21 and IL-12-stimulated iTregs ± methyl pyruvate (MePyr, 10 mM) (n = 3). Graphs show calculated glycolysis and glycolytic capacity; mean ± SEM from 10–12 technical replicates.
(G) Graph shows percentage of IL-21 and IL-12-induced FOXP3+ IFN-γ+ iTregs ± LY2090314 or MePyr (n = 4).
(H) The schematic diagram illustrates IL-21-mediated metabolite imbalance in iTregs. Diagram was created with biorender.com
Data represents mean ± SEM. * p < 0.05., *** p < 0.001 and **** p < 0.0001, using two-tailed Student’s t-test or one-way ANOVA followed by Bonferroni test for multiple comparisons.
Notably, LY2090314 reversed ECAR and OCR induced by IL-21 (Figure 5E). Consistent with data in Figure 4J, mass cytometry by Time of Flight (CyTOF) showed that LY2090314 reduced IL-21 and IL-12-induced IFN-γ, TNF-α, and IL-17A across CD49D subpopulations (Supplementary Figure 5A, B). LY2090314 also reversed ECAR and or OCR induced by IL-6, IL-23, and UK5099 (Supplementary Figure 5C, D). These notable findings suggest that several proinflammatory cytokines can induce glycolysis, potentially via distinct mechanisms. Furthermore, GSK3β, by shuttling between its active and inactive forms, may act as a central metabolic checkpoint, which in turn dictates pyruvate localization (cytosolic vs. mitochondria) as supported by evidence from other cell types12, 31.
Collectively, these mechanistic observations led us to hypothesize that circumventing mitochondria-ER defect or requirement by merely supplementing IL-21 and IL-12-stimulated Tregs with membrane-permeable MePyr would reduce ECAR and inflammatory response, mirroring GSK3β inhibition. Indeed, MePyr diminished ECAR of IL-21 and IL-12-stimulated iTregs (basal glycolysis, glycolytic capacity: P < 0.0001, Figure 5F), and it reduced the percentage of IFN-γ+ iTregs, mirroring LY2090314 treatment (P < 0.05, Figure 5G). Overall, our work suggests that enforced mitochondrial pyruvate entry via MePyr supplementation or LY2093014 treatment suppresses the metabolic phenotype of inflammatory iTregs (Figure 5H), resulting in reduced inflammatory response. Next, we examined the immune-suppressive capacity of IL-21R-deficient (Il21r−/−) Tregs in alleviating murine colitis in comparison to wild-type (WT) Tregs.
IL-21-induced Metabolic Genes are Enriched in Refractory Human IBD, and IL-21R-deficient Tregs Effectively Lessen CD4+ T Cell-induced Colitis in Mice
We first examined whether IL-21-induced metabolic genes enriched in our in vitro iTregs (Figure 3A) were represented in Tregs from severe lesions of human IBD. We analyzed single-cell RNA-sequencing (scRNA-seq) dataset from human CD ileal lesions (Martin et. al), in which a pathogenic cell-cell landscape consisting of IgG plasma cells, inflammatory mononuclear phagocytes, activated T cells, and stromal cells (termed GIMATShigh module) predicts patient resistance to anti-TNF therapy18. Notably, in Treg clusters from inflamed tissues of GIMATShigh patients, we found higher expression of genes associated with glycolysis (GAPDH, ENO1, ALDOA, LDHB, and TPI1), nucleotide metabolism (CMPK1, GUK1, and APRT), FAO (PAFAH1B3), and glutaminolysis (glutamine transporter SLC38A1) than that of GIMATSlow patients (Figure 6A). Furthermore, some of these metabolic genes were also upregulated in Treg clusters from inflamed CD tissues than that of adjacent uninflamed tissues from the same patients (Figure 6B). In summary, IL-21-induced metabolic genes, such as GAPDH, in our iTregs are enriched in intestinal Tregs derived from refractory IBD patients. The expression of inflammatory cytokines in glycolytic immune cells has been reported to rely on GAPDH14. Like the MePyr control, GAPDH enzymatic inhibition with dimethyl fumarate (DMF, 25–100 μM) and heptelidic acid (HA, 0.05 μM) reduced the percentage of IL-21 and IL-12-induced IFN-γ+ iTregs (Supplementary Figure 6A, B). Furthermore, IL-21 and IL-12 stimulation of iTregs increased GAPDH enzyme activity, and this outcome was reversed by MePyr, 2-DG, and LY2090314 (Supplementary Figure 6C). This suggests that IL-21 and IL-12-induced glycolysis linked to IFN-γ production in iTregs involves enhanced GAPDH function in a manner reversible by MePyr.
Figure 6. IL-21-induced Metabolic Genes are Enriched in Refractory Human IBD, and IL-21R-deficient Tregs Effectively Lessen CD4+ T Cell-induced Colitis in Mice.
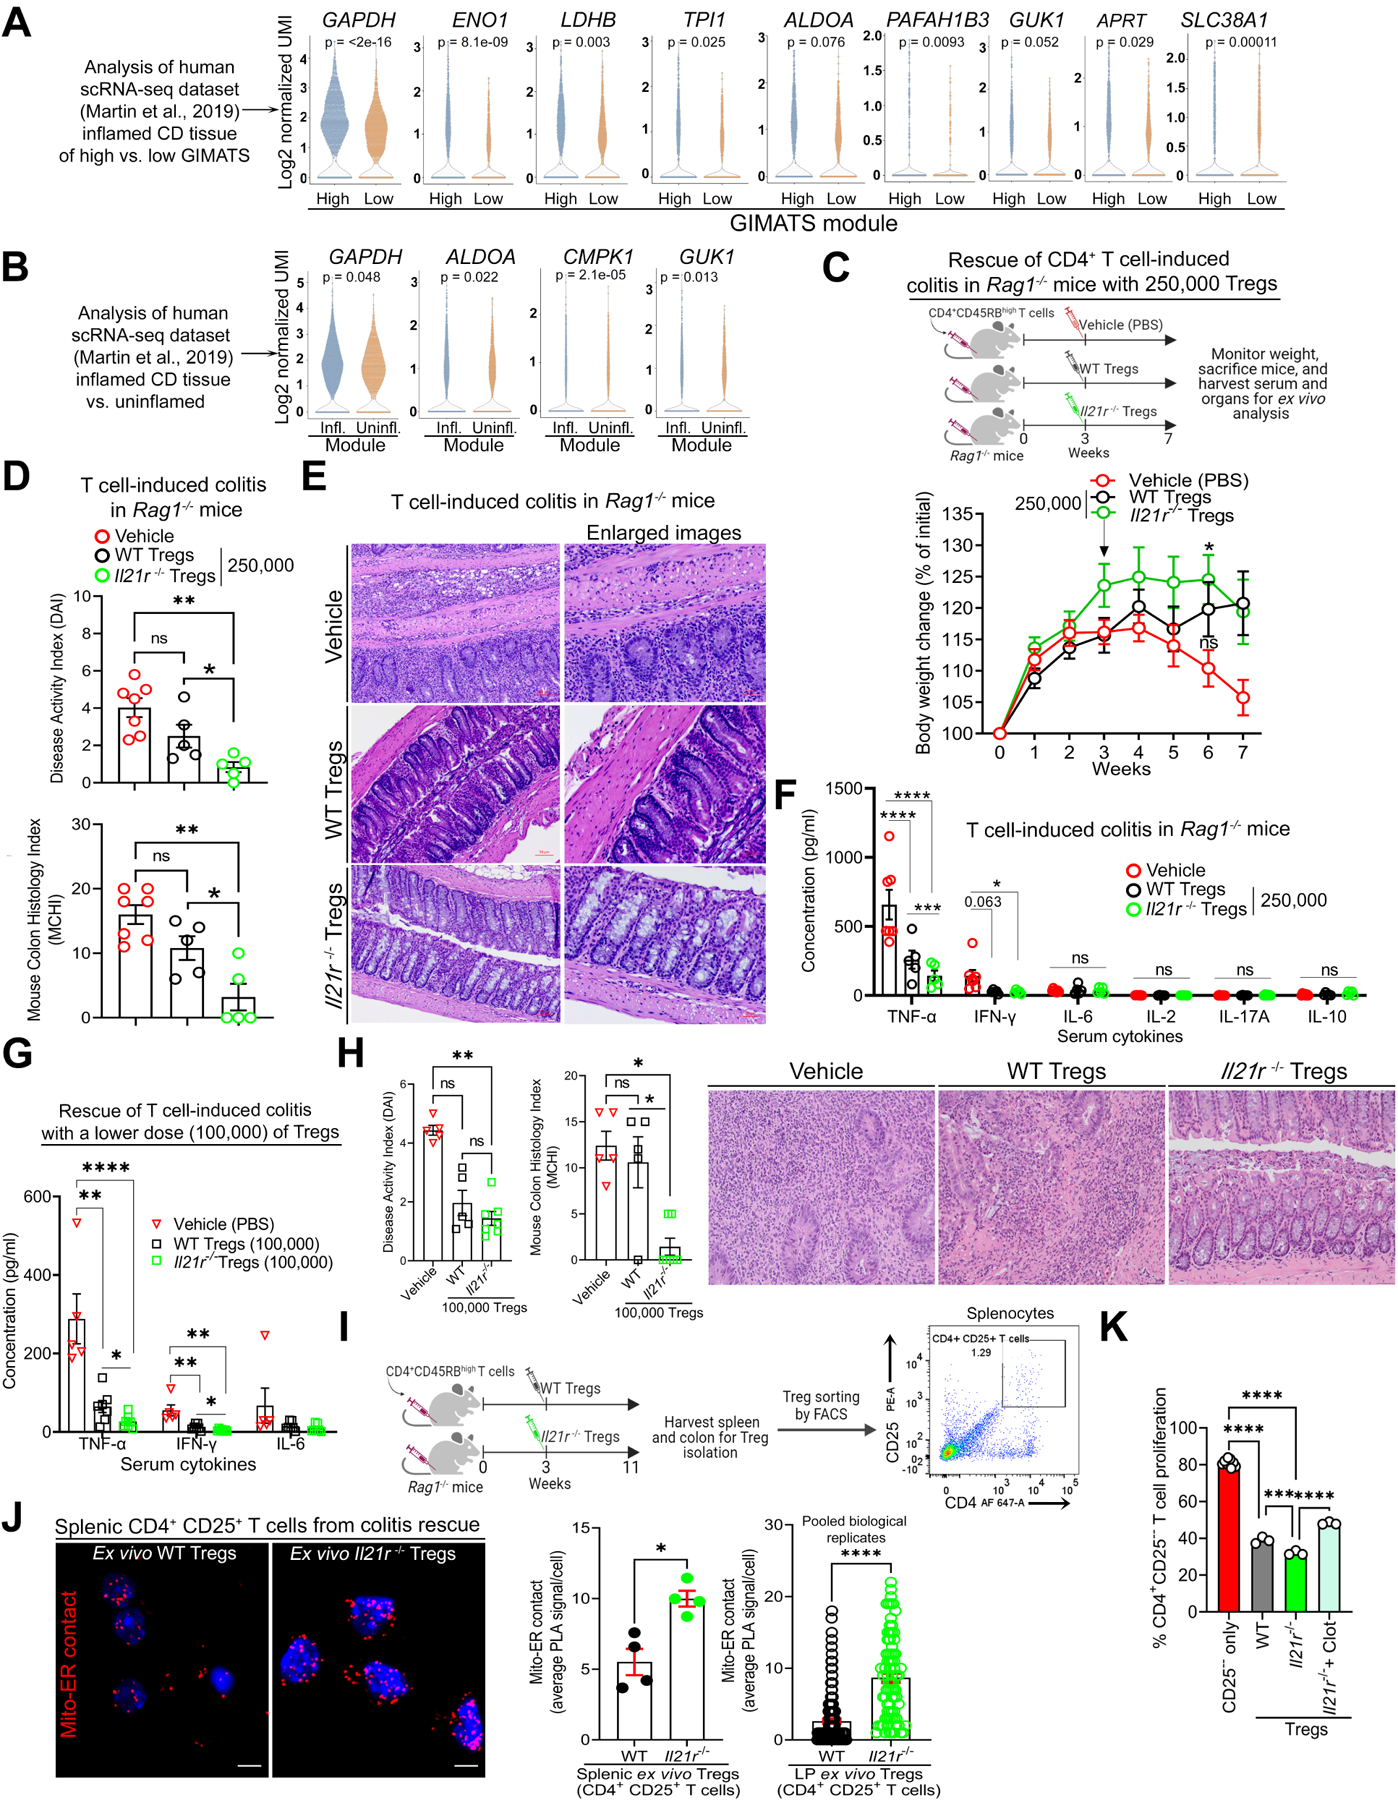
(A) Violin plots show the log2 normalized UMI of metabolic genes in human Treg clusters from Crohn’s disease (CD) inflamed tissues of GIMATS (IgG plasma cells, inflammatory MNP, and activated T and stromal cells) module (Wilcoxon test; P); n = 5 for GIMATShigh patients and n = 4 for GIMATSlow patients.
(B) Violin plots show the log2 normalized UMI of metabolic genes in human Treg clusters from CD inflamed vs. adjacent non-inflamed tissues from the same patients (n = 9 patients) (Wilcoxon test; P).
(C) The schematic diagram illustrates colitis induction with pathogenic T cells and rescue approach with adoptive Treg transfer. Change in body weight of mice during CD4+ T cell-induced colitis rescue (n = 5–7 mice per group).
(D) DAI and MCHI of colitis mice on week 7. MCHI was assessed by a blinded pathologist.
(E) Hematoxylin and eosin (H&E) staining of colon sections of colitis mice on week 7; scale bar, 50 μm.
(F) Serum cytokine levels in colitis mice on week 7.
(G) Serum cytokine levels in colitis mice on week 11.
(H) DAI and MCHI of colitis mice as well as H&E staining of colon sections on week 11.
(I) Experimental workflow and dot plot of sorted splenic CD4+ CD25+ T cells (Tregs) from colitis mice.
(J) Representative images of mito-ER contact in splenic ex vivo Tregs; scale bar, 2 μm. Graph shows the average number of mito-ER contact per mouse or cell.
(K) Suppression of CD4+ CD25−− T cell proliferation in vitro by Tregs.
Data represents mean ± SEM. * p < 0.05, ** p < 0.01, and **** p < 0.0001, using two-way ANOVA followed by Tukey for multiple comparisons (C), non-parametric Kruskal-Wallis test followed by Dunn’s multiple comparisons (vehicle vs. Tregs) and two-tailed Student’s t-test (WT vs. il21r−/− Tregs) (D, H), multiple unpaired t tests (F, G), two-tailed Student’s t-test (J), using one-way ANOVA followed by Tukey for multiple comparisons (K)
Next, we hypothesized that Il21r−/− Tregs would resolve colitis more efficiently than WT Tregs. We adoptively transferred naïve CD4+ CD45RBhigh T cells into recombinase activating gene-1 (Rag1)−/− mice to induce colitis, followed by injection with vehicle or Tregs (WT versus Il21r−/− Tregs) on day 0 to prevent disease or on week 3 with varied numbers of cells to rescue disease. Colitis mice injected with vehicle expectedly lost their body weight, displayed increased disease activity index (DAI), and developed colitis based on blinded histology assessment (mouse colitis histology index (MCHI) scoring). In the colitis prevention approach, although both WT and Il21r−/− Tregs improved weight gain (Supplementary Figure 6D) and reduced DAI (Supplementary Figure 6E), WT Tregs failed to efficiently restrain tissue inflammation and damage (MCHI, P > 0.05, Supplementary Figure 6F) as well as serum IL-6 com (P > 0.05, Supplementary Figure 6G). In the colitis rescue approach, Il21r−/− Tregs (250,000) successfully stabilized mice weight (P < 0.05, Figure 6C), reduced DAI, MCHI (P < 0.05, Figure 6D, E), and serum TNF-α (P < 0.001) compared to the same number of WT Tregs (Figure 6F). Consistently, this enhanced colitis-suppressive effect was replicated by a lower number of Il21r−/− Tregs (100,000) in comparison to WT Tregs, as evidenced by increased weight gain (Supplementary Figure 6H, I) and decreased serum TNF-α, IFN-γ as well as reduction in MCHI (Figure 6G, H). Taken together, using these complementary approaches, IL-21R-deficient Tregs exhibit enhanced capacity in suppressing colitis induced by pathogenic CD4+ T cells compared to WT Tregs. To link the improved functionality of Il21r−/− Tregs to mitochondria-ER function, we assayed for mitochondria-ER appositions in CD4+ CD25+ T cells (FOXP3+ Tregs) sorted from spleens and intestinal lamina propria of treated colitis mice, as confirmed in Supplementary Figure 6H, and expectedly found that ex vivo Il21r−/− Tregs displayed increased VDAC1-IP3R1 binding compared to ex vivo WT Tregs (Figure 6I, J and Supplementary Figure 6J). Moreover, the in vitro suppressive function of Il21r−/− Tregs was reversed by VDAC1 inhibition with clotrimazole pre-treatment (Figure 6K), thus supporting the potential role of mitochondria-ER function in maintaining Treg phenotype and immunosuppressive function.
Discussion
Although intestinal Tregs expressing inflammatory cytokines in CD and UC patients have been described16–18, the mechanism responsible for this inflammatory phenotype and its contribution to disease are poorly understood. Our prominent findings include the identification of mitochondria-ER appositions in human Tregs, which we believe facilitate pyruvate transport and its metabolism in the mitochondria. Impairing mitochondrial pyruvate entry by targeting mitochondria-ER architecture induces metabolic dysfunction and renders iTregs susceptible to acquiring an effector T cell-like phenotype. IL-21 uniquely perturbs mitochondria-ER ultrastructure and exploits GSK3β to promote Treg metabolism that favors inflammatory immune response. GSK3β inhibition or MePyr supplementation potentially bypasses mitochondria-ER requirement to suppress iTreg inflammatory response and its metabolic basis. Perturbations to mitochondria-associated membranes and the resulting regulatory immune cell defects could therefore be a generalizable mechanism pertinent to other chronic inflammatory conditions and gut pathophysiology, such as celiac disease characterized by elevated serum IL-21 and gluten-specific CD4+ T cells secreting IL-21 in the blood and lamina propria. Our study indicates that GSK3β is perhaps constitutively active – acting as a central metabolic checkpoint at the pyruvate bifurcation point – given that its pharmacologic inhibition affected basal TNF-α, ECAR, and OCR in normal iTregs. Adoptive transfer of IL-21R-deficient Tregs more efficiently ameliorates disease onset and progression, which mechanistically supports the relevance of IL-21-IL-21R axis in vivo. Overall, our study suggests that the ability of pathogenic cues to instigate metabolic alterations that result in Treg dysfunction might induce resistance to current monotherapies.
We showed that TGF-β1 and IL-21 had opposing effects on mitochondria-ER interaction. We suspect this may involve the re-organization of actin and microtubule networks, with subsequent changes to the subcellular localization of chaperones such as GRP75. IL-21 stimulation activated several metabolic pathways, including pathways supportive of OXPHOS. Although mitochondrial metabolism is important for Treg function under steady-state conditions43, mtROS and consequent DNA damage have been linked to Treg cell death and autoimmune pathogenesis44. However, in our study, IL-21-induced mitochondrial alterations were associated with IFN-γ and TNF-α production. Presumably, diseasespecific microenvironmental factors control metabolic rewiring and Treg cell fate decisions (inflammatory vs. cell death). Along this line, mitochondrial abnormality in intestinal epithelial cells has been associated with IBD45. Our study raises the possibility that IL-21 may broadly instigate mitochondrial dysfunction in multiple cell types, leading to metabolic alterations culminating in chronic inflammation.
We found that the prototypical glycolysis inhibitor (2-DG) significantly decreased IL-21 and IL-12-induced IFN-γ and TNF-α production by iTregs; however, the precise glycolytic mechanisms are not understood. It might involve proteins, such as HIF1α, GAPDH, mechanistic target of rapamycin, GLUTs, and MCTs previously linked to effector T cell function4. Furthermore, the contribution of metabolic pathways, such as one carbon and nucleotide metabolism, to Treg biology warrants to be investigated. Paradoxically, we found an upward trend in IL-10 expression in iTregs in response to IL-21 and IL-12, perhaps due to enhanced cholesterol biosynthesis previously linked to IL-10 induction46. Of note, our inflammatory iTreg in vitro model mirrors data from inflamed tissues of UC patients in which FOXP3+ IL10+ T cells were also the primary source of TNF-α17. We speculate that IL-21-induced IL-10 is an attempt to dampen IL-17 expression, given that IL-10 signaling can suppress IL-17 expression. Thus, our inflammatory iTregs in vitro resemble FOXP3+ T cells reported in IBD patients17, 18. Elucidating how IL-21-induced inflammatory cytokines act in an autocrine manner to further compromise Treg function might reveal mechanisms pertinent to IBD. IL-21 reduced CD49D (α4), nevertheless, CD49Dhigh iTregs maintained TNF-α expression, consistent with the notion that highly inflammatory T cells possess gut-infiltrating capability. IL-21 may regulate Treg trafficking, with implications in intestinal tissue damage and extraintestinal manifestations; however, experiments are needed to substantiate this speculation. Interestingly, a higher percentage of α4β7low Tregs was observed in CD patients15, and the restoration of α4β7 in expanded ex vivo Tregs is being explored for autologous transplant to treat CD patients (NCT03185000). This implies that human Tregs, supported by evidence in murine models, also require α4β7 for selective homing to the gut for immunosuppressive function.
Overall, our studies uncovered a link between IL-21 and mitochondria-ER dysfunction, which results in enhanced GSK3β function, hypermetabolic state, and iTreg inflammatory response. We also provided several therapeutic strategies for halting Treg’s inflammatory state. Repurposing GSK3 inhibitor (LY2090314) for pharmacological intervention or generation of autologous Tregs might be beneficial. Remarkably, LY2090314 was well tolerated in a Phase 2 study for cancer treatment39. Our findings provide the basis for future characterization of inflammatory Tregs that may inspire the development of immunomodulatory therapies.
Supplementary Material
Key Resources Table
| REAGENT or RESOURCE | SOURCE | IDENTIFIER |
|---|---|---|
| Antibodies | ||
| Anti-human/mouse/rat VDAC1 (Lot #3507477001) | ORIGENE | Cat#TA326858 |
| Anti-human/mouse/rat/monkey GRP75 | Abcam | Cat#ab2799 |
| Anti-human/mouse/rat/monkey TOM20 | Cell Signaling | Cat#42406S |
| Anti-human/mouse/rat IP3R-I | Santa Cruz | Cat#sc-271197 |
| Anti-human/mouse/rat phospho β-catenin-Serine 37 | PetroTech | Cat#28776-1-AP |
| Anti-human/mouse/rat phospho β-catenin-Serine 33 | PetroTech | Cat#80067-1-RR |
| Anti-human/mouse/rat β-catenin | PetroTech | Cat#66379-1-Ig |
| Alexa Fluor 488 Anti-human FOXP3 (clone 259D) | BioLegend | Cat#320212 |
| Alexa Fluor 488 Anti-human CD25 (clone BC96) | BioLegend | Cat#302616 |
| PE anti-human CD39 (clone A1) | BioLegend | Cat#328208 |
| PerCP/Cy5.5 anti-human CD152 (CTLA4) (clone BNI3) | BioLegend | Cat#369608 |
| Anti-human/mouse/rat/monkey phospho-Serine 9 GSK3β (D85E12) | Cell Signaling | Cat#5558S |
| Anti-human/mouse/rat/monkey GSK3β (27C10) | Cell Signaling | Cat#9315 |
| Anti-human/mouse/rat/monkey β-actin (8H10D10) | Cell Signaling | Cat#3700S |
| Anti-human/mouse/rat/monkey STAT3 (124H6) | Cell Signaling | Cat#9139S |
| Anti-human/mouse/rat HK-I | Invitrogen | Cat#MA5-15680 |
| APC anti-human CD49D (α4) (clone 9F10) | BioLegend | Cat#304308 |
| PE anti-human CD103 (integrin αE) (clone Ber-ACT8) | BioLegend | Cat#350206 |
| APC/Cyanine7 anti-human IFN-γ (4S.B3) | BioLegend | Cat#502530 |
| PE anti-human TNF-α (MAb11) | BioLegend | Cat#502909 |
| Alexa Fluor 488 anti-human CD4 (clone RPA-T4) | BioLegend | Cat#300519 |
| PE anti-mouse CD45RB (clone c363-16A) | BioLegend | Cat#103308 |
| Alexa Fluor 488 CD25 (clone PC61) | BioLegend | Cat#102017 |
| Alexa Fluor 647 anti-human phospho-Serine 9 GSK3β | R&D SYSTEMS | Cat# IC25062R |
| Alexa Fluor 488 Mouse IgG1, k (clone MOPC-21) | BioLegend | Cat#400134 |
| APC Mouse IgG1, k (clone MOPC-21) | BioLegend | Cat#400119 |
| PE Mouse IgG1, k (clone MOPC-21) | BioLegend | Cat#400114 |
| APC/Cyanine 7 Mouse IgG1, k (clone MOPC-21) | BioLegend | Cat#400128 |
| Brilliant Violet 421 Mouse IgG1, k (clone MOPC-21) | BioLegend | Cat#400157 |
| PE/Cy7 Mouse IgG1, k (clone MOPC-21) | BioLegend | Cat#400125 |
| PercP/Cy5.5 Mouse IgG1, k (clone MOPC-21) | BioLegend | Cat#400150 |
| Human TruStain FcX™ | BioLegend | Cat#422302 |
| CellTak | Corning | Cat#354242 |
| Chemicals, Peptides, and Recombinant Proteins | ||
| LY2090314 | Selleckchem | Cat#S7063 |
| TCS 2002 | TOCRIS | Cat#3869 |
| Methyl Pyruvate | Sigma-Aldrich | Cat#371173 |
| MOXTM Regent | Thermo Fisher Scientific | Cat#TS-45950 |
| MSTFA+1% TMCS | Thermo Fisher Scientific | Cat#TS-48915 |
| Methanol CHROMASOLV®, for HPLC | Sigma-Aldrich | Cat#34860 |
| Water for HPLC | Sigma-Aldrich | Cat#270733 |
| TSP-d4 | Sigma-Aldrich | Cat#269913 |
| MitoTracker RedCMXRos | Thermo Fisher Scientific | Cat#M7512 |
| ER-Tracker™ Blue-White DPX | Thermo Fisher Scientific | Cat#E12353 |
| Oligomycin | Abcam | Cat#ab141829 |
| FCCP | Abcam | Cat#ab120081 |
| Rotenone | Abcam | Cat#ab143135 |
| Antimycin A | Abcam | Cat#ab141904 |
| 2-deoxyglucose (2-DG) | APEXBIO | Cat#B1027 |
| Seahorse XF 1.0 M Glucose solution | Agilent Technologies | Cat#103577-100 |
| Seahorse XF 200 mM Glutamine solution | Agilent Technologies | Cat#103579-100 |
| Seahorse XF 100 mM Pyruvate solution | Agilent Technologies | Cat#103578-100 |
| XF RPMI Medium | Agilent Technologies | Cat#103576-100 |
| Purified NA/LE Mouse Anti-human CD3 | BD Pharmingen | Cat#555329 |
| Purified NA/LE Mouse Anti-human CD28 | BD Pharmingen | Cat#555725 |
| Recombinant human IL-2 | PetroTech | Cat#200-02 |
| Recombinant human TGF-β1 | PetroTech | Cat#100-21C |
| Recombinant human IL-12 p70 | PetroTech | Cat#200-12 |
| Recombinant human IL-1β | PetroTech | Cat#200-01B |
| Recombinant human IL-6 | PetroTech | Cat#200-06 |
| Recombinant human IL-21 | PetroTech | Cat#200-21 |
| Recombinant human IL-23 | PetroTech | Cat#200-23 |
| Recombinant human IL-4 | PetroTech | Cat#200-04 |
| Purified anti-human IFN-γ (clone B27) | BioLegend | Cat#506502 |
| Purified anti-human IL-4 (clone 8D4-8) | BioLegend | Cat#500702 |
| Clotrimazole | TOCRIS | Cat#4096 |
| Bifonazole | Sigma-Aldrich | Cat#B3563 |
| UK5099 | EMD Millipore | Cat#5.04817.0001 |
| TEPP-46 (ML265, CID-44246499, NCGC001186528) | Selleckchem | Cat#S7302 |
| BMS-303141 | Sigma-Aldrich | Cat#SML0784 |
| Calyculin A | Abcam | Cat#141784 |
| Heptelidic acid (HA) | Abcam | Cat#ab144269 |
| Dimethyl fumarate (DMF) | Sigma-Aldrich | Cat#S2596 |
| Cpd9, ACC1 inhibitor | EMD Millipore | Cat#5.34335.0001 |
| 2-Thenoyltrifluoroacetone (TTFA) | Sigma-Aldrich | Cat#T27006 |
| Sodium Fluoroacetate | MP, Biochemicals, LLC | Cat#201080 |
| Etomoxir sodium salt hydrate | Sigma-Aldrich | Cat#E1905 |
| Fibronectin Human, Natural | Corning | Cat#354008 |
| MitoTracker Green | Thermo Fisher Scientific | Cat#M7514 |
| NE-PER™ Nuclear and Cytoplasmic Extraction Reagents | Thermo Fisher Scientific | REF#78833 |
| Cell Trace Violet Cell Proliferation Kit | Thermo Fisher Scientific | Cat#C34751 |
| Purified NA/LE Hamster Anti-mouse CD3e (clone145-2C11) | BD Pharmingen | Cat#553057 |
| Purified NA/LE Hamster Anti-mouse CD328 (clone145-2C11) | BD Pharmingen | Cat#553294 |
| Recombinant mouse IL-12 p70 | PetroTech | Cat#210-12 |
| Recombinant mouse IL-1β | PetroTech | Cat#211-11B |
| Recombinant mouse IL-6 | PetroTech | Cat#210-16 |
| Recombinant mouse IL-21 | PetroTech | Cat#210-21 |
| Recombinant mouse IL-23 p40 | R&D SYSTEMS | Cat#1887-ML-010 |
| LEAF™ Purified anti-mouse IFN-γ (clone XMG1.2) | BioLegend | Cat#505812 |
| Purified anti-mouse IL-4 (clone 11B11) | BioLegend | Cat#504102 |
| Mouse Dynabeads CD3/CD28 | Gibco | Cat#11452D |
| Biological samples and Experimental Models | ||
| Healthy adult – peripheral blood mononuclear cells (males) | Mayo Clinic | N/A |
| Healthy adult – intestinal biopsies (male) | Mayo Clinic | N/A |
| C57BL/6J mice (males) | The Jackson Laboratory | Stock no:000664 |
| C57BL/6J Rag1−/− mice (males) | The Jackson Laboratory | Stock no: 002216 |
| C57BL/6NJ wildtype (one male and one female) | The Jackson Laboratory | Stock no: 005304 |
| Total body Il21r−/− (one male and one female) | The Jackson Laboratory | Stock no: 019115 |
| Software and Algorithms | ||
| FlowJo version10.2 | FlowJo, LLC | https://www.flowjo.com |
| Zen 3.0 (blue edition) | Zen | https://www.zeiss.com |
| Bio-Rad Image Lab | Bio-Rad | https://www.bio-rad.com |
| GraphPadPrism 8 | GraphPad software | https://www.graphpad.com |
| Seahorse Bioscience Wave Desktop | Agilent Technologies | https://www.agilent.com |
| ImageJ | NIH | https://imagej.nih.gov |
| Photoshop Adobe | Adobe | https://www.adobe.com |
| Critical Commercial Assays | ||
| BD™ Cytometric Bead Array (CBA) Mouse Th1/Th2/Th17 Cytokine Kit | BD Biosciences | Cat#560485 |
| ENLITEN ATP Assay System | Promega | Cat#FF2000 |
| GAPDH Activity Assay Kit (Colorimetric) | Abcam | Cat #ab204732 |
| Human Treg Phenotyping Panel Kit | Fluidigm | Cat#201060 |
| RNeasy Plus Mini Kit | QIAGEN | Cat#74134 |
| Seahorse XF24 Flux/Pak | Agilent Technologies | Cat#100850-001 |
| Seahorse XFe96 Flux/Pak | Agilent Technologies | Cat#102416-100 |
| Arraystar SYBR Green qPCR Mater Mix | ARRAYSTAR INC | Cat#AS-MR-006-5 |
| NuRNA™ Human Central Metabolism PCR Array (Roche Light Cycler 480) | ARRAYSTARINC | Cat#AS-NM-004-1-R |
| Spike-in RNA | ARRAYSTARINC | Cat#AS-SP-001-1 |
| Duolink™ In Situ PLA Anti-Mouse PLUS | Sigma-Aldrich | Cat#DUO92001 |
| Duolink™ In Situ PLA Anti-Rabbit MINUS | Sigma-Aldrich | Cat#DUO92005 |
| Duolink™ In Situ Detection Reagents Red | Sigma-Aldrich | Cat#DUO92008 |
| CD4+ T cell isolation kit, mouse | Miltenyi Biotec | Cat#130-104-454 |
| CD4+ CD62L+ (naive) T cell isolation kit, mouse | Miltenyi Biotec | Cat#130-106-643 |
| CD4+ CD25+ (Treg) T cell isolation kit, mouse | Miltenyi Biotec | Cat#130-091-041 |
| CD4+ T cell isolation kit, human | Miltenyi Biotec | Cat#130-096-533 |
| Accell Human VDAC1 siRNA SMARTPool | Dharmacon™ | Cat ID: E-019764-00-0050 |
| Accell Non-targeting Control Pool | Dharmacon™ | Cat ID: D-001910-10-50 |
| CD45RA+ (naive) cell isolation kit, human | Miltenyi Biotec | Cat#130-045-901 |
| CD4+ CD127dim T cell isolation kit, human | Miltenyi Biotec | Cat#130-094-775 |
| Others | ||
| RPMI Medium 1640 (1X) [+] L-Glutamine | Gibco | REF#11875-093 |
BACKGROUND AND CONTEXT
Mechanisms governing the metabolic basis of Tregs and their resulting immunosuppressive activity in the intestine are poorly defined. The role of interleukin 21 in instigating metabolic reprogramming and consequent incapacitation of Tregs is uncharacterized.
NEW FINDINGS
Interleukin 21 impairs mitochondrial pyruvate metabolism and promotes inflammatory response in Tregs by disrupting mitochondria-endoplasmic reticulum function and instigating glycogen synthase kinase 3β-driven metabolic program. Methyl pyruvate supplementation or pharmacologic inhibition of glycogen synthase kinase 3β restores Treg metabolic state and phenotype, and interleukin 21 receptor-deficient Tregs efficiently treat colitis.
LIMITATIONS
The contribution of other metabolic pathways activated by interleukin 21 to Treg biology needs further evaluation.
CLINICAL RESEARCH RELEVANCE
The metabolic transcriptional landscape of Tregs exposed to an inflammatory milieu is altered in vitro and in vivo, suggesting potential metabolic vulnerabilities. Our work provides proof-of-concept preclinical studies for generating highly immunosuppressive Tregs by improving cellular metabolic fitness to treat immune-mediated diseases, such as inflammatory bowel disease and celiac disease.
BASIC RESEARCH RELEVANCE
Tregs are preferentially enriched with mitochondria-endoplasmic reticulum appositions, which are required for pyruvate transport into the mitochondria to promote metabolic homeostasis. Inhibition of mitochondrial pyruvate transport or stimulation with interleukin 21 induces a hypermetabolic state with enhanced glycolysis, which contributes to inflammatory response, cellular defect, and poor resolution of chronic intestinal inflammation.
LAY SUMMARY
Interleukin 21 induces metabolic alterations and acquisition of an inflammatory-like phenotype by perturbing mitochondria-endoplasmic reticulum crosstalk, thereby diminishing the capacity of Tregs in suppressing inflammatory bowel disease.
Acknowledgments
We thank the Mayo Clinic Microscopy and Cell Analysis Core (Trace Christensen) and Mayo Clinic Immune Monitoring Core for their experimental and technical assistance. Grateful to Dr. Tamas Ordog for the critical review of the manuscript.
Grant support
This work was supported by the National Institute of Diabetes and Digestive and Kidney Diseases (NIDDK) K01DK124358, the Pilot & Feasibility Award by the Center for Cell Signaling in Gastroenterology (P30DK084567), the Kenneth Rainin Foundation (20220024), and the Mayo Clinic Center for Biomedical Discovery Career Development Award (to AOB), David F. and Margaret T. Grohne Cancer Immunology and Immunotherapy Award and NIDDK grant R01DK130884 (to PH), and NIAID grant R01AI089714 and the Leona Helmsley Charitable Trust (to WAF).
Abbreviations
- FOXP3
forkhead domain–containing protein 3
- IMM
inner mitochondrial membrane
- OMM
outer mitochondrial membrane
- MAM
mitochondria-associated membranes
- VDAC1
voltage-dependent anion channel 1
- IP3R1
inositol triphosphate receptor 1
- MPC
mitochondrial pyruvate carrier
- Mito-ER
mitochondria-endoplasmic reticulum
- EM
electron microscopy
- MePyr
methyl pyruvate
- GSK3β
glycogen synthase kinase 3 beta
- 2-DG
2-deoxy-d-glucose
- GAPDH
glyceraldehyde 3-phosphate dehydrogenase
- IBD
inflammatory bowel disease
- CD
Crohn’s disease
- UC
ulcerative colitis
- IL
interleukin
- IP
intraperitoneally
- mRNA
messenger RNA
- OXPHOS
oxidative phosphorylation
- FCCP
carbonyl cyanide-p-trifluoromethoxy phenylhydrazone
- FAO
fatty acid oxidation
- TCA
tricarboxylic acid
- ECAR
extracellular acidification rate
- OCR
oxygen consumption rate
- ETC
electron transport chain
- PBMC
peripheral blood mononuclear cell
- LP
lamina propria
- PLA
proximity ligation assay
- PBS
phosphate-buffered saline
- RNA-seq
RNA sequencing
- TCR
T cell receptor
- CD3
cluster of differentiation 3
- CD28
cluster of differentiation 28
- CD49D
integrin alpha 4
- GLUT3
glucose transporter 3
- PKM2
pyruvate kinase M2 isoform
- TGF-β1
transforming growth factor beta 1
- Th
T helper
- TNF-α
tumor necrosis factor alpha
- IFN-γ
interferon gamma
- iTreg
induced regulatory T cell
- nTreg
natural regulatory T cell
- WT
wild-type
Footnotes
Publisher's Disclaimer: This is a PDF file of an unedited manuscript that has been accepted for publication. As a service to our customers we are providing this early version of the manuscript. The manuscript will undergo copyediting, typesetting, and review of the resulting proof before it is published in its final form. Please note that during the production process errors may be discovered which could affect the content, and all legal disclaimers that apply to the journal pertain.
Disclosures
The authors declare no conflicts of interest.
Transcript Profiling
GEO database under accession code GSE224033 (https://www.ncbi.nlm.nih.gov/geo/query/acc.cgi?acc=GSE224033)
References
- 1.Friedrich M, Pohin M, Powrie F. Cytokine Networks in the Pathophysiology of Inflammatory Bowel Disease. Immunity 2019;50:992–1006. [DOI] [PubMed] [Google Scholar]
- 2.Ng SC, Shi HY, Hamidi N, et al. Worldwide incidence and prevalence of inflammatory bowel disease in the 21st century: a systematic review of population-based studies. Lancet 2018;390:2769–2778. [DOI] [PubMed] [Google Scholar]
- 3.Hirten RP, Iacucci M, Shah S, et al. Combining Biologics in Inflammatory Bowel Disease and Other Immune Mediated Inflammatory Disorders. Clin Gastroenterol Hepatol 2018;16:1374–1384. [DOI] [PubMed] [Google Scholar]
- 4.O’Neill LA, Kishton RJ, Rathmell J. A guide to immunometabolism for immunologists. Nat Rev Immunol 2016;16:553–65. [DOI] [PMC free article] [PubMed] [Google Scholar]
- 5.Josefowicz SZ, Lu LF, Rudensky AY. Regulatory T cells: mechanisms of differentiation and function. Annual review of immunology 2012;30:531–64. [DOI] [PMC free article] [PubMed] [Google Scholar]
- 6.Whibley N, Tucci A, Powrie F. Regulatory T cell adaptation in the intestine and skin. Nat Immunol 2019;20:386–396. [DOI] [PubMed] [Google Scholar]
- 7.Gorelik L, Flavell RA. Abrogation of TGFbeta signaling in T cells leads to spontaneous T cell differentiation and autoimmune disease. Immunity 2000;12:171–81. [DOI] [PubMed] [Google Scholar]
- 8.Kotlarz D, Marquardt B, Baroy T, et al. Human TGF-beta1 deficiency causes severe inflammatory bowel disease and encephalopathy. Nat Genet 2018;50:344–348. [DOI] [PMC free article] [PubMed] [Google Scholar]
- 9.MacIver NJ, Michalek RD, Rathmell JC. Metabolic regulation of T lymphocytes. Annu Rev Immunol 2013;31:259–83. [DOI] [PMC free article] [PubMed] [Google Scholar]
- 10.Chang CH, Curtis JD, Maggi LB Jr., et al. Posttranscriptional control of T cell effector function by aerobic glycolysis. Cell 2013;153:1239–51. [DOI] [PMC free article] [PubMed] [Google Scholar]
- 11.Wang R, Dillon CP, Shi LZ, et al. The transcription factor Myc controls metabolic reprogramming upon T lymphocyte activation. Immunity 2011;35:871–82. [DOI] [PMC free article] [PubMed] [Google Scholar]
- 12.Bantug GR, Fischer M, Grahlert J, et al. Mitochondria-Endoplasmic Reticulum Contact Sites Function as Immunometabolic Hubs that Orchestrate the Rapid Recall Response of Memory CD8(+) T Cells. Immunity 2018;48:542-+. [DOI] [PMC free article] [PubMed] [Google Scholar]
- 13.Mehta MM, Weinberg SE, Chandel NS. Mitochondrial control of immunity: beyond ATP. Nat Rev Immunol 2017;17:608–620. [DOI] [PubMed] [Google Scholar]
- 14.Patel CH, Leone RD, Horton MR, et al. Targeting metabolism to regulate immune responses in autoimmunity and cancer. Nat Rev Drug Discov 2019;18:669–688. [DOI] [PubMed] [Google Scholar]
- 15.Goldberg R, Scotta C, Cooper D, et al. Correction of Defective T-regulatory Cells From Patients With Crohn’s Disease by Ex Vivo Ligation of Retinoic Acid Receptor Alpha. Gastroenterology 2019. [DOI] [PubMed] [Google Scholar]
- 16.Mitsialis V, Wall S, Liu P, et al. Single-Cell Analyses of Colon and Blood Reveal Distinct Immune Cell Signatures of Ulcerative Colitis and Crohn’s Disease. Gastroenterology 2020;159:591–608 e10. [DOI] [PMC free article] [PubMed] [Google Scholar]
- 17.Smillie CS, Biton M, Ordovas-Montanes J, et al. Intra- and Inter-cellular Rewiring of the Human Colon during Ulcerative Colitis. Cell 2019;178:714–730 e22. [DOI] [PMC free article] [PubMed] [Google Scholar]
- 18.Martin JC, Chang C, Boschetti G, et al. Single-Cell Analysis of Crohn’s Disease Lesions Identifies a Pathogenic Cellular Module Associated with Resistance to Anti-TNF Therapy. Cell 2019;178:1493–1508 e20. [DOI] [PMC free article] [PubMed] [Google Scholar]
- 19.Zhou L, Ivanov II, Spolski R, et al. IL-6 programs T(H)-17 cell differentiation by promoting sequential engagement of the IL-21 and IL-23 pathways. Nat Immunol 2007;8:967–74. [DOI] [PubMed] [Google Scholar]
- 20.Theurey P, Rieusset J. Mitochondria-Associated Membranes Response to Nutrient Availability and Role in Metabolic Diseases. Trends Endocrinol Metab 2017;28:32–45. [DOI] [PubMed] [Google Scholar]
- 21.Murley A, Nunnari J. The Emerging Network of Mitochondria-Organelle Contacts. Mol Cell 2016;61:648–653. [DOI] [PMC free article] [PubMed] [Google Scholar]
- 22.Raturi A, Simmen T. Where the endoplasmic reticulum and the mitochondrion tie the knot: the mitochondria-associated membrane (MAM). Biochim Biophys Acta 2013;1833:213–24. [DOI] [PubMed] [Google Scholar]
- 23.Szabadkai G, Bianchi K, Varnai P, et al. Chaperone-mediated coupling of endoplasmic reticulum and mitochondrial Ca2+ channels. J Cell Biol 2006;175:901–11. [DOI] [PMC free article] [PubMed] [Google Scholar]
- 24.Clough JN, Omer OS, Tasker S, et al. Regulatory T-cell therapy in Crohn’s disease: challenges and advances. Gut 2020;69:942–952. [DOI] [PMC free article] [PubMed] [Google Scholar]
- 25.Rambold AS, Pearce EL. Mitochondrial Dynamics at the Interface of Immune Cell Metabolism and Function. Trends in Immunology 2018;39:6–18. [DOI] [PubMed] [Google Scholar]
- 26.Sarmento OF, Svingen PA, Xiong Y, et al. The Role of the Histone Methyltransferase Enhancer of Zeste Homolog 2 (EZH2) in the Pathobiological Mechanisms Underlying Inflammatory Bowel Disease (IBD). J Biol Chem 2017;292:706–722. [DOI] [PMC free article] [PubMed] [Google Scholar]
- 27.Monteleone G, Kumberova A, Croft NM, et al. Blocking Smad7 restores TGF-beta1 signaling in chronic inflammatory bowel disease. J Clin Invest 2001;108:601–9. [DOI] [PMC free article] [PubMed] [Google Scholar]
- 28.De Rosa V, Galgani M, Porcellini A, et al. Glycolysis controls the induction of human regulatory T cells by modulating the expression of FOXP3 exon 2 splicing variants. Nat Immunol 2015;16:1174–84. [DOI] [PMC free article] [PubMed] [Google Scholar]
- 29.Konkel JE, Zhang D, Zanvit P, et al. Transforming Growth Factor-beta Signaling in Regulatory T Cells Controls T Helper-17 Cells and Tissue-Specific Immune Responses. Immunity 2017;46:660–674. [DOI] [PMC free article] [PubMed] [Google Scholar]
- 30.Shoshan-Barmatz V, Zakar M, Rosenthal K, et al. Key regions of VDAC1 functioning in apoptosis induction and regulation by hexokinase. Biochim Biophys Acta 2009;1787:421–30. [DOI] [PubMed] [Google Scholar]
- 31.Rossi A, Rigotto G, Valente G, et al. Defective Mitochondrial Pyruvate Flux Affects Cell Bioenergetics in Alzheimer’s Disease-Related Models. Cell Rep 2020;30:2332–2348 e10. [DOI] [PubMed] [Google Scholar]
- 32.Penso J, Beitner R. Clotrimazole and bifonazole detach hexokinase from mitochondria of melanoma cells. Eur J Pharmacol 1998;342:113–7. [DOI] [PubMed] [Google Scholar]
- 33.Monteleone G, Monteleone I, Fina D, et al. Interleukin-21 enhances T-helper cell type I signaling and interferon-gamma production in Crohn’s disease. Gastroenterology 2005;128:687–94. [DOI] [PubMed] [Google Scholar]
- 34.Fina D, Sarra M, Fantini MC, et al. Regulation of gut inflammation and th17 cell response by interleukin-21. Gastroenterology 2008;134:1038–48. [DOI] [PubMed] [Google Scholar]
- 35.Berod L, Friedrich C, Nandan A, et al. De novo fatty acid synthesis controls the fate between regulatory T and T helper 17 cells (vol 20, pg 1327, 2014). Nature Medicine 2015;21:414–414. [DOI] [PubMed] [Google Scholar]
- 36.Xu T, Stewart KM, Wang X, et al. Metabolic control of TH17 and induced Treg cell balance by an epigenetic mechanism. Nature 2017;548:228–233. [DOI] [PMC free article] [PubMed] [Google Scholar]
- 37.D’Eletto M, Rossin F, Occhigrossi L, et al. Transglutaminase Type 2 Regulates ER-Mitochondria Contact Sites by Interacting with GRP75. Cell Rep 2018;25:3573–3581 e4. [DOI] [PubMed] [Google Scholar]
- 38.Pastorino JG, Hoek JB, Shulga N. Activation of glycogen synthase kinase 3beta disrupts the binding of hexokinase II to mitochondria by phosphorylating voltage-dependent anion channel and potentiates chemotherapy-induced cytotoxicity. Cancer Res 2005;65:10545–54. [DOI] [PubMed] [Google Scholar]
- 39.Rizzieri DA, Cooley S, Odenike O, et al. An open-label phase 2 study of glycogen synthase kinase-3 inhibitor LY2090314 in patients with acute leukemia. Leuk Lymphoma 2016;57:1800–6. [DOI] [PubMed] [Google Scholar]
- 40.Almeida L, Dhillon-LaBrooy A, Castro CN, et al. Ribosome-Targeting Antibiotics Impair T Cell Effector Function and Ameliorate Autoimmunity by Blocking Mitochondrial Protein Synthesis. Immunity 2020. [DOI] [PMC free article] [PubMed] [Google Scholar]
- 41.Shin B, Benavides GA, Geng J, et al. Mitochondrial Oxidative Phosphorylation Regulates the Fate Decision between Pathogenic Th17 and Regulatory T Cells. Cell Rep 2020;30:1898–1909 e4. [DOI] [PMC free article] [PubMed] [Google Scholar]
- 42.Franchi L, Monteleone I, Hao LY, et al. Inhibiting Oxidative Phosphorylation In Vivo Restrains Th17 Effector Responses and Ameliorates Murine Colitis. J Immunol 2017;198:2735–2746. [DOI] [PMC free article] [PubMed] [Google Scholar]
- 43.Weinberg SE, Singer BD, Steinert EM, et al. Mitochondrial complex III is essential for suppressive function of regulatory T cells. Nature 2019;565:495-+. [DOI] [PMC free article] [PubMed] [Google Scholar]
- 44.Alissafi T, Kalafati L, Lazari M, et al. Mitochondrial Oxidative Damage Underlies Regulatory T Cell Defects in Autoimmunity. Cell Metab 2020;32:591–604 e7. [DOI] [PMC free article] [PubMed] [Google Scholar]
- 45.Mancini NL, Goudie L, Xu W, et al. Perturbed Mitochondrial Dynamics Is a Novel Feature of Colitis That Can Be Targeted to Lessen Disease. Cellular and Molecular Gastroenterology and Hepatology 2020;10:287–307. [DOI] [PMC free article] [PubMed] [Google Scholar]
- 46.Perucha E, Melchiotti R, Bibby JA, et al. The cholesterol biosynthesis pathway regulates IL-10 expression in human Th1 cells. Nat Commun 2019;10:498. [DOI] [PMC free article] [PubMed] [Google Scholar]
Associated Data
This section collects any data citations, data availability statements, or supplementary materials included in this article.