

Abstract
Objective.
To compare the efficacy of 6 tumor necrosis factor–α inhibitors (TNFi) in treatment of ankylosing spondylitis (AS) at 12 weeks and 24 weeks.
Methods.
We performed a systematic literature review of randomized controlled trials of TNFi in patients with active AS. We included trials that reported efficacy at 10 to 14 weeks (12–week analysis) and at 24 to 30 weeks (24-week analysis). We used Bayesian network metaanalysis (NMA) to compare their relative efficacy to improve the Bath Ankylosing Spondylitis Disease Activity Index (BASDAI), Bath Ankylosing Spondylitis Functional Index (BASFI), and C-reactive protein (CRP) level.
Results.
We included 20 trials of 6 TNFi, with 43 treatment arms and 3220 participants. All TNFi were significantly better than placebo in reducing BASDAI and BASFI at 12 weeks and 24 weeks; all but certolizumab pegol (CZP) were statistically better than placebo in reducing CRP at 12 weeks; all but CZP and infliximab-dyyb (IFX biosimilar) were significantly better than placebo in reducing CRP at 24 weeks. IFX was superior to the other TNFi in decreasing BASDAI at 12 weeks, but not at 24 weeks. Excluding 1 open-label trial, there were no differences among TNFi.
Conclusion.
Based on this NMA of clinical trials, IFX was superior to other TNFi in reducing BASDAI at 12 weeks, but sensitive to inclusion of an open-label trial, and its efficacy was diminished at 24 weeks. The analysis was limited by few direct comparison trials. Further study of relative safety and longterm effectiveness will help inform the choice of TNFi in treating active AS.
Key Indexing Terms: ANKYLOSING SPONDYLITIS, TUMOR NECROSIS FACTOR-A, COMPARATIVE EFFECTIVENESS RESEARCH, NETWORK METAANALYSIS
Tumor necrosis factor-α inhibitors (TNFi) have been widely used as a second-line therapy when patients with ankylosing spondylitis (AS) have persistent symptoms despite treatment with nonsteroidal antiinflammatory drugs (NSAID)1. Six different TNFi have been approved for the treatment of AS, including adalimumab (ADA), certolizumab pegol (CZP), etanercept (ETN), golimumab (GOL), infliximab (IFX), and IFX-dyyb (IFX biosimilar). Although they share the same mechanism of action, they are structurally different and have varying efficacy in other conditions in the spondyloarthritis family, including uveitis and inflammatory bowel disease2. It remains unclear whether all TNFi are equally efficacious in relieving the symptoms and signs of active AS. In clinical practice, physicians and patients may favor a particular TNFi over others based on convenience, comorbidities, or cost, rather than a comparison of relative efficacy.
To date, only 2 head-to-head trials of TNFi in AS have been conducted: 1 of ETN versus IFX, and the other of IFX versus IFX-dyyb3,4. In the absence of direct comparisons, indirect comparisons of ≥ 2 medications can be made through a common comparator using network metaanalysis (NMA). Previous NMA that used the Assessments in Ankylosing Spondylitis 20% response criteria (ASAS20) as the outcome did not detect any difference in efficacy among TNFi5,6,7,8. However, dichotomous measures such as the ASAS20 are less sensitive than continuous measures in detecting a difference among medications, in part because such measures ignore any differences in efficacy beyond the ASAS20 threshold9. In our study, we used 3 continuous measures: Bath Ankylosing Spondylitis Disease Activity Index (BASDAI)10, Bath Ankylosing Spondylitis Functional Index (BASFI)11, and C-reactive protein (CRP) level as primary outcomes to compare the relative efficacy of 6 TNFi in treatment of active AS.
MATERIALS AND METHODS
Literature search.
The study protocol was registered at PROSPERO (registration number CRD42014014228). We searched PubMed, EMBASE, Scopus, and the Cochrane Database for published randomized controlled trials (RCT) of TNFi in AS through March 31, 2016, in all languages. Searches were performed by a medical informatician, and search terms are summarized in Supplementary Table 1 (available with the online version of this article). We further manually searched reference lists of review articles. Two authors (RW and MMW) reviewed the search results for eligible studies based on selection criteria. Disagreement was resolved by discussion.
Our study was exempted from ethics review by the US National Institutes of Health Office of Human Subjects Research.
Selection criteria.
We included RCT that evaluated the efficacy of TNFi in adult patients with AS, compared to placebo or to a different TNFi, at 10 to 16 weeks, or at 24 to 30 weeks. AS was defined in the trials by the modified New York criteria12. To enhance homogeneity, we excluded studies of axial spondyloarthritis, unless a subgroup analysis of patients with AS was reported. TNFi include ADA, CZP, ETN, GOL, IFX, and IFX-dyyb. We included studies irrespective of whether they allowed concomitant use of NSAID, corticosteroids, and disease-modifying antirheumatic drugs (DMARD). We excluded studies that were reported only as an abstract.
Data extraction and assessment of bias.
Data extraction was performed independently by 2 reviewers (RW and MMW). Any discrepancies were resolved by discussion. We extracted features of the study design, characteristics of participants, and relevant outcome measures. The primary efficacy measures were changes from baseline in the BASDAI, BASFI, and CRP. We extracted the mean change score and its SD, or calculated the change from baseline and final scores. When only medians and ranges were reported, we imputed means and SD using standard methods13. Authors of the original articles or study sponsors were contacted for additional data when needed. Missing SD were imputed using SD of other included studies13. Intention-to-treat data were collected whenever available.
To assess study quality, we used the Cochrane Collaboration tool for assessment of risk of bias13. Each study was evaluated on 6 domains (i.e., sequence generation, allocation concealment, blinding, incomplete outcome data, selective reporting, and other sources of bias), and rated as low, unclear, or high risk.
Statistical analysis.
We performed Bayesian NMA to quantify the relative efficacy of each drug using a random effects model under the assumption of consistency. Bayesian NMA allows the indirect comparison of 2 drugs based on the observed direct effects. For example, the relative effect of drug A and B is the difference of the relative effects of drug A and C and the relative effects of drug B and C, if these direct comparisons are available. We grouped studies that reported outcomes at 10 to 16 weeks for the 12-week analysis, and studies that reported outcomes at 24 to 30 weeks for the 24-week analysis. Bayesian NMA was performed for each outcome at these 2 timepoints. The relative effect size was presented as the mean difference (MD) with 95% credible intervals (CrI). Outcomes of open-label trials may differ from those of blinded trials; on the other hand, open-label trials closely mimic the real-life experience. Therefore, we performed 2 analyses: the first included a single open-label study, and a second analysis excluded this single open-label study.
We assessed the absolute model fit by the overall residual deviance (Dbar)14. Dbar of each drug should approximate the total number of trial arms included in the metaanalysis when the model fits the data well. We assessed heterogeneity among the trial results using Higgins I2, which measures the percent of variability in effect estimates that is a result of heterogeneity rather than sampling error15. Lower I2 indicates less heterogeneity. To estimate the effect of heterogeneity as a result of differences in initial AS activity among trial participants, we performed metaregression that adjusted for the weighted mean baseline value of each outcome; the BASDAI and BASFI analyses were also adjusted for mean baseline CRP. Because TNFi trials were performed over a span of 15 years, we examined whether there was a drift in placebo responses over time (owing to possibly greater expectations of benefit in later trials), which could affect the direct and indirect comparisons among TNFi.
All analyses were performed using R (version 3.3.1), the R package gemtc (version 0.8.1), and the Markov Chain Monte Carlo engine JAGS (version 4.2)16,17,18.
RESULTS
Literature review.
We identified 402 articles through a systematic literature search, and 3 additional articles from the reference lists of previous reviews. There were 20 studies included after applying the inclusion and exclusion criteria, consisting of 18 placebo controlled trials and 2 head-to-head comparison trials. A flow diagram that illustrates the study selection process is in Supplementary Figure 1 (available with the online version of this article). A total of 43 trial arms and 3220 patients were included. A summary of study characteristics is presented in Table 13,4,15–32. The sample sizes ranged from 40 to 356. Mean age of study participants ranged from 27.4 to 48.0 years, and the mean durations of AS were from 6.8 to 23.0 years. The range of patients who were HLA-B27–positive was 72%–96.2%. Mean baseline BASDAI scores ranged from 5.5 to 6.9 cm (possible range 0–10) on the visual analog scale, mean baseline BASFI scores ranged from 3.2 to 6.7 cm (possible range 0–10) on the visual analog scale, and mean baseline CRP values were from 11 mg/l to 33 mg/l. Fourteen studies reported concomitant use of DMARD, including methotrexate (MTX). Five studies did not permit concomitant use of DMARD, all of which were trials of IFX. One study did not report information on use of DMARD.
Table 1.
Characteristics of included studies. Values are mean (SD) unless otherwise specified.
| First Author | Year | Drug and Dose | Enrollees, n | Length, wks | Age, yrs | Male, % | HLA-B27, % | Disease Duration, yrs | Baseline BASDAI, cm | Baseline BASFI, cm | Baseline CRP, mg/l | MTX use. n |
|---|---|---|---|---|---|---|---|---|---|---|---|---|
| Placebo-controlled trials | ||||||||||||
| Van der Heijde20 | 2006 | ADA 40 mg QOW | 208 | 24 | 41.7 (11.7) | 75.5 | 78.4 | 11.3 (10.0) | 6.3 (1.7) | 5.2 (2.2) | 18 (22) | 20 |
| PBO | 107 | 24 | 43.4 (11.3) | 73.8 | 79.4 | 10.0 (8.3) | 6.3 (1.7) | 5.6 (2.2) | 22 (29) | 8 | ||
| Maksymowych21 | 2008 | ADA 40 mg QOW | 38 | 24 | 41.9 (11.1) | 76.3 | 86.8 | 14.5 (9.0) | 6.2 (1.7) | 5.3 (2.0) | 18 (17) | 4 |
| PBO | 44 | 24 | 40.0 (10.9) | 81.8 | 81.8 | 12.1 (8.7) | 6.5 (1.6) | 5.6 (2.2) | 23 (26) | 4 | ||
| Hu22 | 2012 | ADA 40 mg QOW | 26 | 12 | 28.2 (6.9) | 92.3 | 96.2 | 7.4 (5.7) | 5.9 (1.4) | 3.7 (2.1) | 25 (23) | MTX |
| PBO | 20 | 12 | 27.4 (7.2) | 100 | 95.0 | 7.6 (4.6) | 6.2 (1.1) | 3.9 (2.0) | 32 (29) | MTX | ||
| Huang23 | 2014 | ADA 40 mg QOW | 229 | 12 | 30.1 (8.7) | 80.8 | 95.6 | 8.1 (6.0) | 6.0 (1.4) | 4.3 (2.3) | 22 (24) | 52 |
| PBO | 115 | 12 | 29.6 (7.5) | 82.6 | 94.8 | 7.7 (4.7) | 6.2 (1.4) | 4.4 (2.3) | 23 (30) | 25 | ||
| Landewe24 | 2014 | CZP 200 mg Q2W | 65 | 24 | 41.0 (10.8) | 72.3 | 81.5 | 8.8 (5.4) | 6.5 (1.7) | 5.6 (2.3) | 23 (30) | NR |
| CZP 400 mg Q4W | 56 | 24 | 41.9 (11.5) | 73.2 | 78.6 | 8.8 (7.4) | 6.2 (1.3) | 5.7 (2.3) | 21 (22) | NR | ||
| PBO | 57 | 24 | 41.6 (12.8) | 71.9 | 84.2 | 10.2 (8.4) | 6.4 (1.9) | 6.0 (2.0) | 22 (17) | NR | ||
| Gorman25 | 2002 | ETN 25 mg twice weekly | 20 | 12 | 38.0 (10.0) | 65.0 | 95.0 | 15.0 (10.0) | N/A | 4.5 (2.1) | 20 (18) | 8 (DMARD) |
| PBO | 20 | 12 | 39.0 (10.0) | 90.0 | 90.0 | 12.0 (9.0) | N/A | 3.2 (2.5) | 15 (12) | 7 (DMARD) | ||
| Davis26 | 2003 | ETN 25 mg twice weekly | 138 | 24 | 42.1 (11.5) | 76.0 | 84.0 | 10.1 (7.7) | 5.8 (1.8) | 5.2 (2.3) | 19 (24) | 15 |
| PBO | 139 | 24 | 41.9 (11.8) | 76.0 | 84.0 | 10.5 (8.8) | 6.0 (1.7) | 5.6 (2.1) | 20 (24) | 17 | ||
| Calin27 | 2004 | ETN 25 mg twice weekly | 45 | 12 | 45.3 (9.5) | 80.0 | N/A | 15.0 (8.8) | 6.1 (1.6) | 6.0 (2.1) | 19 (16) | 6 |
| PBO | 39 | 12 | 40.7 (11.4) | 77.0 | N/A | 9.7 (8.2) | 5.9 (1.3) | 5.7 (1.6) | 24 (42) | 5 | ||
| Van der Heijde28 | 2006 | ETN 50 mg once weekly | 155 | 12 | 41.5 (11.0) | 69.7 | N/A | 9.0 (8.7) | 6.2 (1.7) | 6.1 (2.0) | 22 (25) | 65 (DMARD) |
| ETN 25 mg twice weekly | 150 | 12 | 39.8 (10.7) | 76.0 | N/A | 10.0 (9.1) | 5.9 (1.7) | 5.8 (2.0) | 20 (21) | 55 (DMARD) | ||
| PBO | 51 | 12 | 40.1 (10.9) | 78.4 | N/A | 8.5 (6.8) | 6.1 (1.4) | 6.0 (1.9) | 22 (23) | 17 (DMARD) | ||
| Barkham29 | 2010 | ETN 25 mg twice weekly | 20 | 12 | 40.8 (9.7) | 75.0 | N/A | 11.0 (7.2) | 6.0 (1.7) | 5.6 (2.0) | N/A | MTX |
| PBO | 20 | 12 | 39.4 (10.1) | 85.0 | N/A | 20.0 (4.9) | 5.5 (1.7) | 5.3 (1.8) | N/A | MTX | ||
| Dougados30 | 2011 | ETN 50 mg once weekly | 39 | 12 | 46.0 (11.0) | 95.0 | 79.0 | 19.0 (10.0) | 6.4 (1.2) | 6.3 (2.0) | 25 (31) | MTX |
| PBO | 43 | 12 | 48.0 (10.0) | 91.0 | 86.0 | 23.0 (11.0) | 5.8 (1.5) | 5.7 (1.9) | 17 (19) | MTX | ||
| Inman31 | 2008 | GOL 50 mg Q4W | 138 | 24 | 38.0 (12.6) | 73.9 | 81.8 | 11.0 (9.6) | 6.5 (1.6) | 5.0 (2.4) | 18 (18) | 29 |
| GOL 100 mg Q4W | 140 | 24 | 38.0 (12.6) | 70.0 | 84.3 | 11.0 (10.0) | 6.9 (1.5) | 5.2 (2.6) | 18 (21) | 28 | ||
| PBO | 78 | 24 | 41.0 (14.1) | 70.5 | 84.6 | 16.0 (13.3) | 6.6 (1.5) | 5.1 (2.3) | 19 (23) | 15 | ||
| Tam32 | 2014 | GOL 50 mg Qmonth | 20 | 24 | 35.6 (9.9) | 90.0 | N/A | 8.0 (10.4) | 6.2 (1.0) | 4.6 (1.9) | 24 (19) | 3 |
| PBO | 21 | 24 | 34.2 (10.0) | 90.0 | N/A | 11.0 (8.5) | 6.2 (1.5) | 4.1 (2.3) | 20 (14) | 3 | ||
| Bao33 | 2014 | GOL 50 mg Q4W | 108 | 24 | 30.5 (10.3) | 83.3 | N/A | 6.8 (6.4) | 6.6 (1.3) | 5.0 (2.4) | 21 (21) | 21 |
| PBO | 105 | 24 | 30.6 (8.6) | 82.9 | N/A | 7.5 (6.1) | 6.5 (1.5) | 5.0 (2.4) | 19 (20) | 23 | ||
| Braun34 | 2002 | IFX 5 mg/kg | 34 | 12 | 40.6 (8.0) | 68.0 | 91.0 | 16.4 (8.3) | 6.5 (1.2) | 5.4 (1.8) | 24 (21) | Not allowed |
| PBO | 35 | 12 | 39.0 (9.1) | 63.0 | 88.0 | 14.9 (9.3) | 6.3 (1.4) | 5.1 (2.2) | 18 (12) | Not allowed | ||
| Marzo-Ortega35 | 2005 | IFX 5 mg/kg | 28 | 24 | 41.0 (7.7) | 82.1 | 96.0 | 8.0 (6.8) | 6.5 (1.9) | 6.7 (1.3) | 30 (9) | Not allowed |
| PBO | 14 | 24 | 39.0 (4.3) | 78.6 | 86.0 | 13.8 (10.3) | 6.6 (2.1) | 6.5 (1.8) | 33 (13) | Not allowed | ||
| Van der Heijde36 | 2005 | IFX 5 mg/kg | 201 | 24 | 40.0 (11.1) | 78.1 | 86.5 | 7.7 (8.6) | 6.6 (1.7) | 5.7 (1.9) | 15 (19) | Not allowed |
| PBO | 78 | 24 | 41.0 (9.6) | 87.2 | 88.5 | 13.2 (10.5) | 6.5 (1.4) | 6.0 (2.3) | 17 (19) | Not allowed | ||
| Inman37 | 2010 | IFX 3 mg/kg | 39 | 12 | 42.9 (10.4) | 82.0 | 72.0 | 18.7 (11.3) | 6.6 (1.2) | 6.0 (2.3) | 13 (11) | MTX |
| PBO | 37 | 12 | 39.3 (9.0) | 78.0 | 73.0 | 18.6 (9.8) | 6.7 (1.4) | 5.9 (2.3) | 23 (21) | MTX | ||
| Head-to-head comparison trials | ||||||||||||
| Giardina3 | 2010 | IFX 5 mg/kg Q6W | 25 | 24 | 31.9 (9.2) | 76.0 | 92.0 | 15.4 (10.6) | 6.5 (1.2) | 6.1 (0.9) | 25 (12) | Not allowed |
| ETN 50 mg QW | 25 | 24 | 32.6 (6.8) | 80.0 | 96.0 | 15.7 (6.5) | 6.6 (1.1) | 6.5 (1.1) | 23 (11) | Not allowed | ||
| Park4 | 2013 | IFX-dyyb 5 mg/kg | 125 | 24 | 38.0 (12.8) | 79.2 | N/A | N/A | 6.8 (1.7) | 6.3 (2.3) | 11 (33) | Not allowed |
| IFX 5 mg/kg | 125 | 24 | 38.0 (12.0) | 82.4 | N/A | N/A | 6.6 (2.1) | 6.3 (2.5) | 14 (44) | Not allowed | ||
BASDAI: Bath Ankylosing Spondylitis Disease Activity Index; BASFI: Bath Ankylosing Spondylitis Functional Index; CRP: C-reactive protein; ADA: adalimumab; CZP: certolizumab; ETN: etanercept; GOL: golimumab; IFX: infliximab; IFX-dyyb: infliximab-dyyb (IFX biosimilar); MTX: methotrexate; DMARD: disease-modifying antirheumatic drugs; PBO: placebo; N/A: not available; NR: not reported; QOW: every other week; QW: once per week; Q2W: every 2 weeks; Q4W: every 4 weeks; Q6W: every 6 weeks; Qmonth: once per month.
The overall study quality was moderate to high (Supplementary Figure 2, available with the online version of this article). One study (5%) was an open-label trial, and therefore was graded as high risk for bias in blinding of participants, personnel, and outcome assessment. Five studies (25%) had high risk of bias as a result of selective reporting because of missing data, but most were provided by trial investigators or sponsors on inquiry. One study (5%) reported covariate-adjusted mean values instead of raw means, and was considered unclear risk for other bias.
Networks of evidence and comparison to placebo.
Eighteen trials (including 39 arms, 2900 participants) were included in the analysis of relative efficacy at 12 weeks. The networks of comparisons for the BASDAI, BASFI, and CRP are presented in Figure 1A–C. Model fit was good (Supplementary Table 2, available with the online version of this article). All TNFi were significantly more efficacious than placebo in reducing BASDAI and BASFI scores [relative effect size for BASDAI reduction range from −2.66 to −1.45 mean difference (MD); for BASFI reduction from −1.99 to −1.05 MD], and all but CZP were significantly better than placebo in decreasing CRP (relative effect size from −1.57 to −0.71 MD; Figure 2). CRP results were not available for IFX-dyyb at 12 weeks. I2 values were 2.25, 4.53, and 7.46 for the BASDAI, BASFI, and CRP models, respectively, indicating low heterogeneity.
Figure 1.
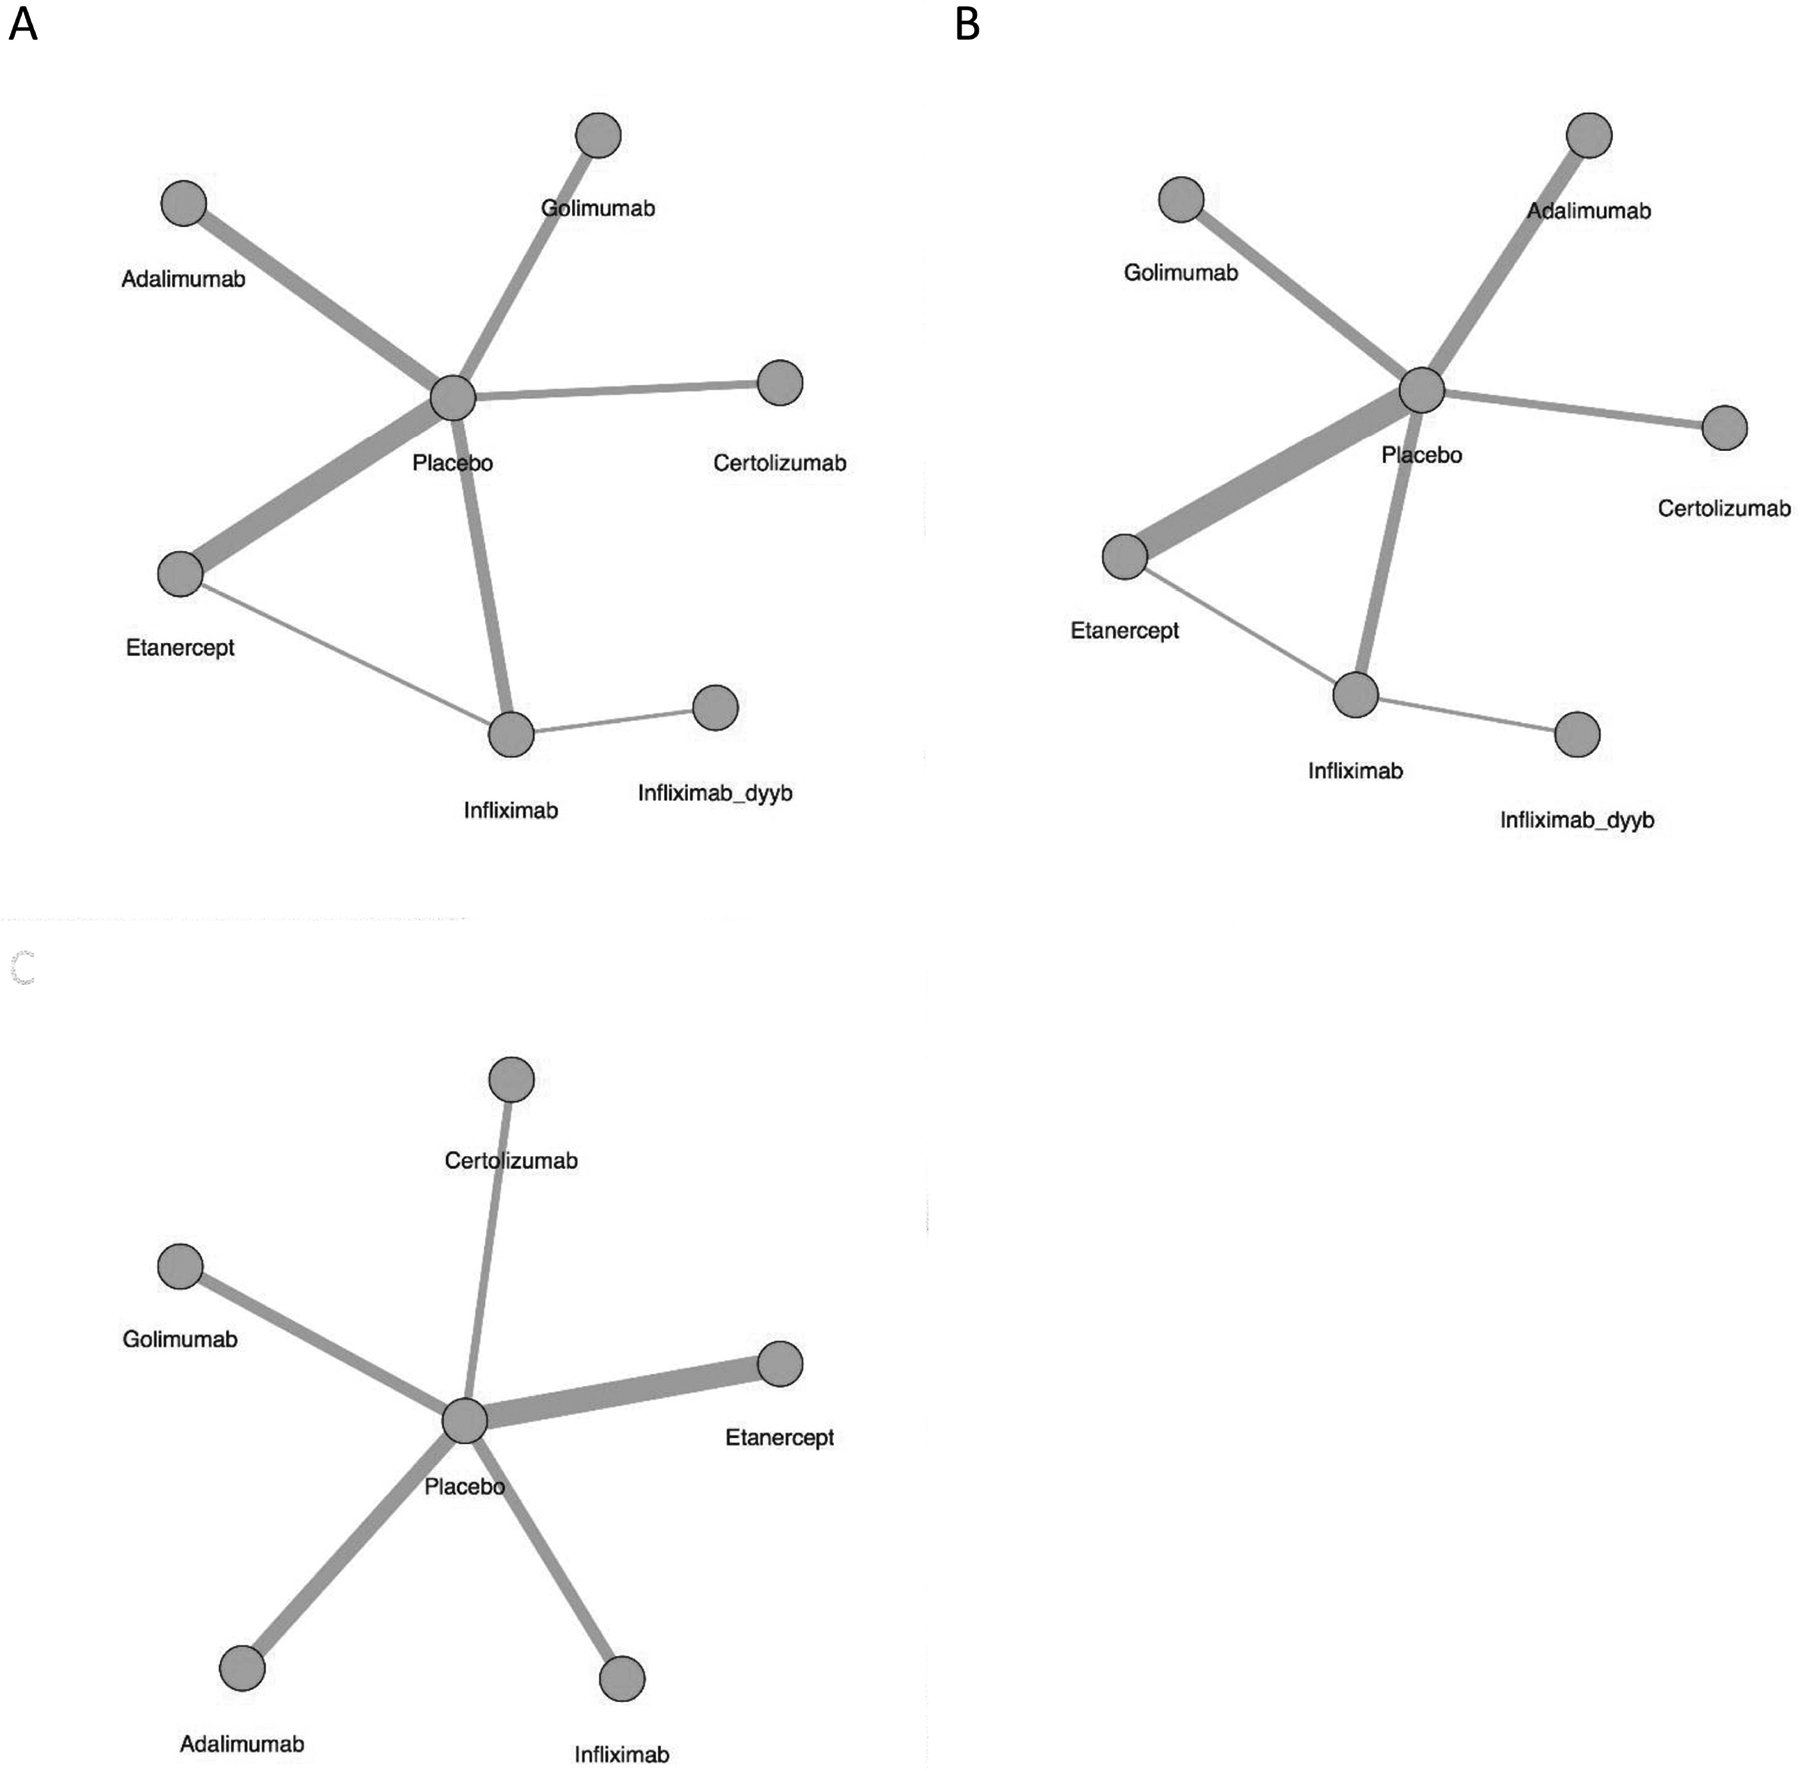
Network of treatment comparison at 12 weeks for (A) BASDAI, (B) BASFI, and (C) CRP. The size of the node corresponds to the number of total trial participants. Direct comparisons are linked with a line; the line thickness is proportional to the number of trials that assessed the comparison. BASDAI: Bath Ankylosing Spondylitis Disease Activity Index; BASFI: Bath Ankylosing Spondylitis Functional Index; CRP: C-reactive protein.
Figure 2.
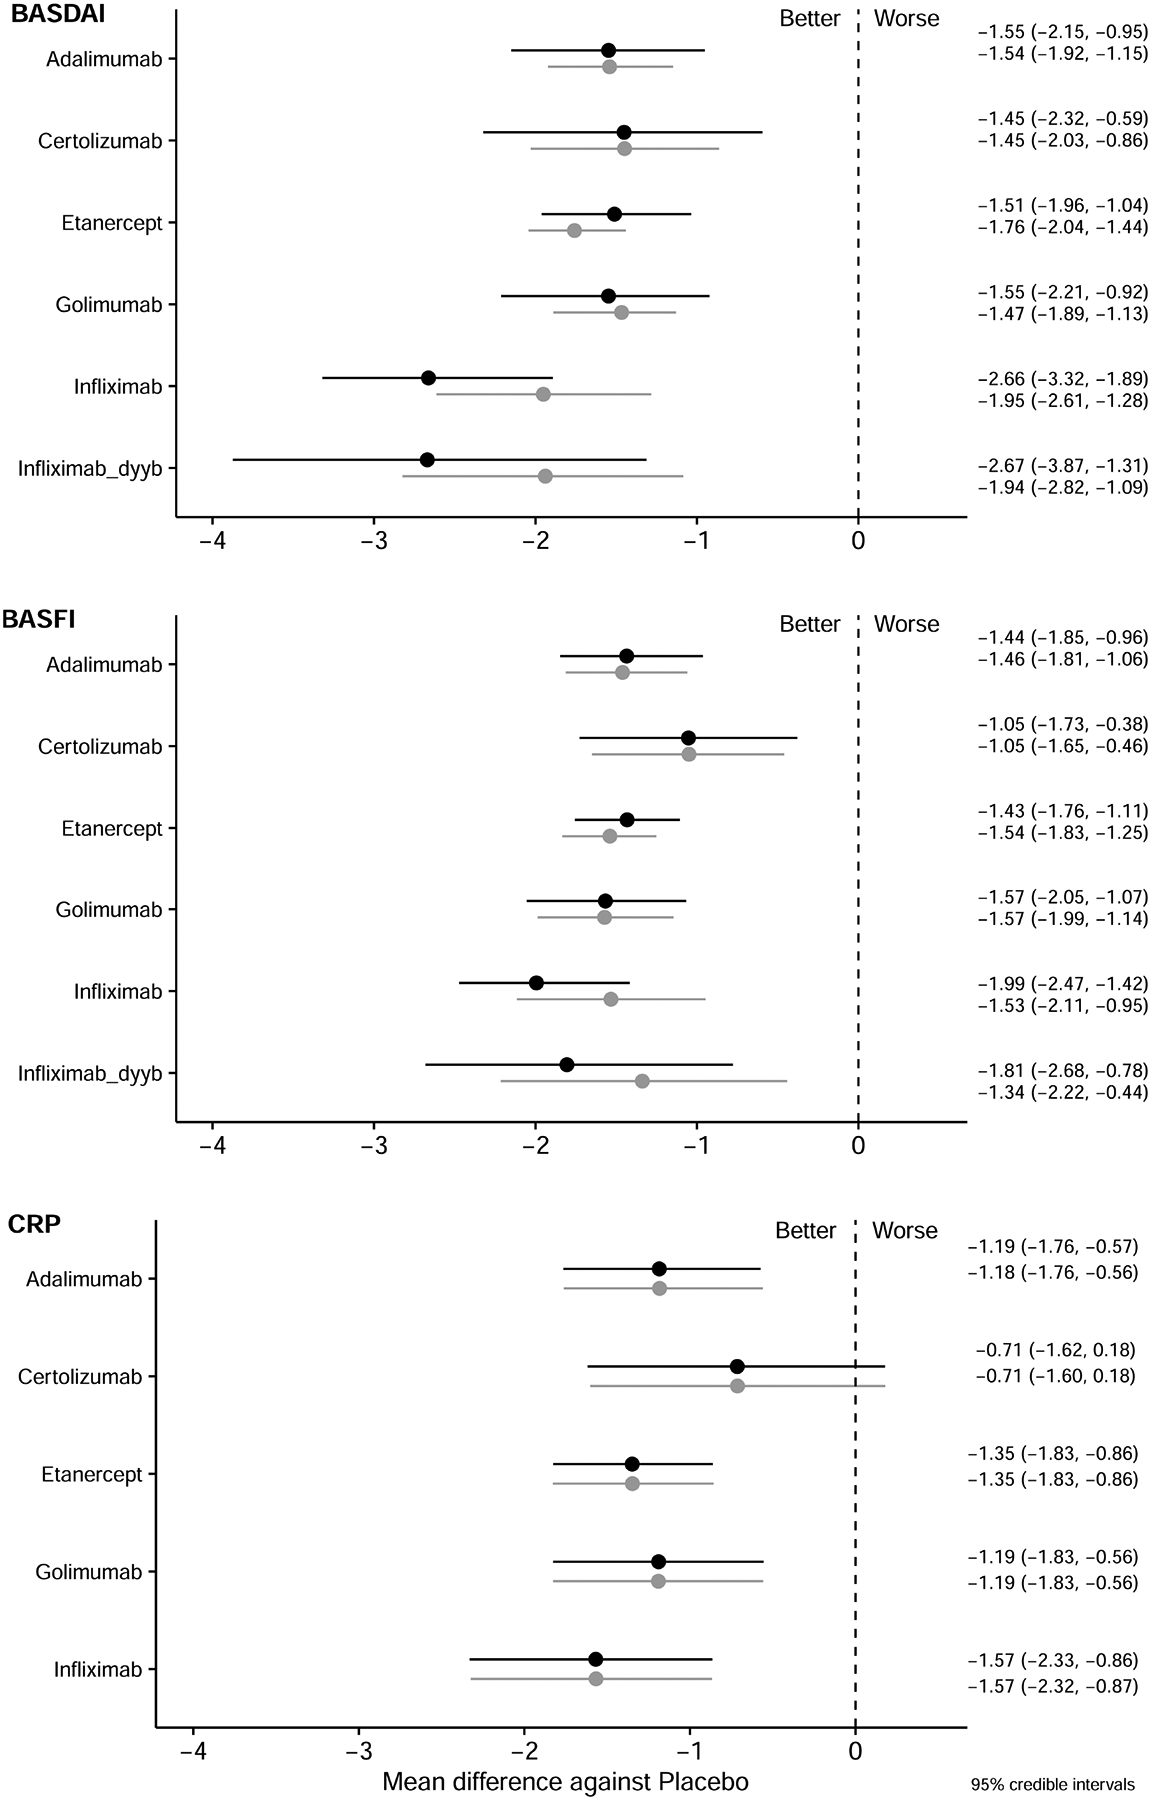
Relative effect sizes compared to placebo at 12 weeks for BASDAI, BASFI, and CRP. Relative efficacies are represented as MD with 95% CrI, and are listed in the right column. Black lines represent the analysis with an open-label trial; grey lines represent the analysis without the open-label trial. A negative value means greater reduction compared with placebo. BASDAI: Bath Ankylosing Spondylitis Disease Activity Index; BASFI: Bath Ankylosing Spondylitis Functional Index; CrI: credible interval; CRP: C-reactive protein; MD: mean difference.
Eleven trials (including 24 arms, 2083 participants) were included in the analysis of relative efficacy at 24 weeks. The network of each comparison is presented in Supplementary Figure 3A–C (available with the online version of this article). The fit of the 24-week models was also good (Supplementary Table 2). All TNFi were significantly more efficacious than placebo in reducing BASDAI and BASFI scores (relative effect sizes for BASDAI range from −3.04 to −1.48 MD, for BASFI from −1.96 to −1.23 MD), and all TNFi except CZP and IFX-dyyb were superior to placebo in decreasing CRP (relative effect size from −1.30 to −0.69 MD; Figure 3). I2 values were 7.39, 2.64, and 2.35 for the BASDAI, BASFI, and CRP models, respectively, again indicating low heterogeneity.
Figure 3.
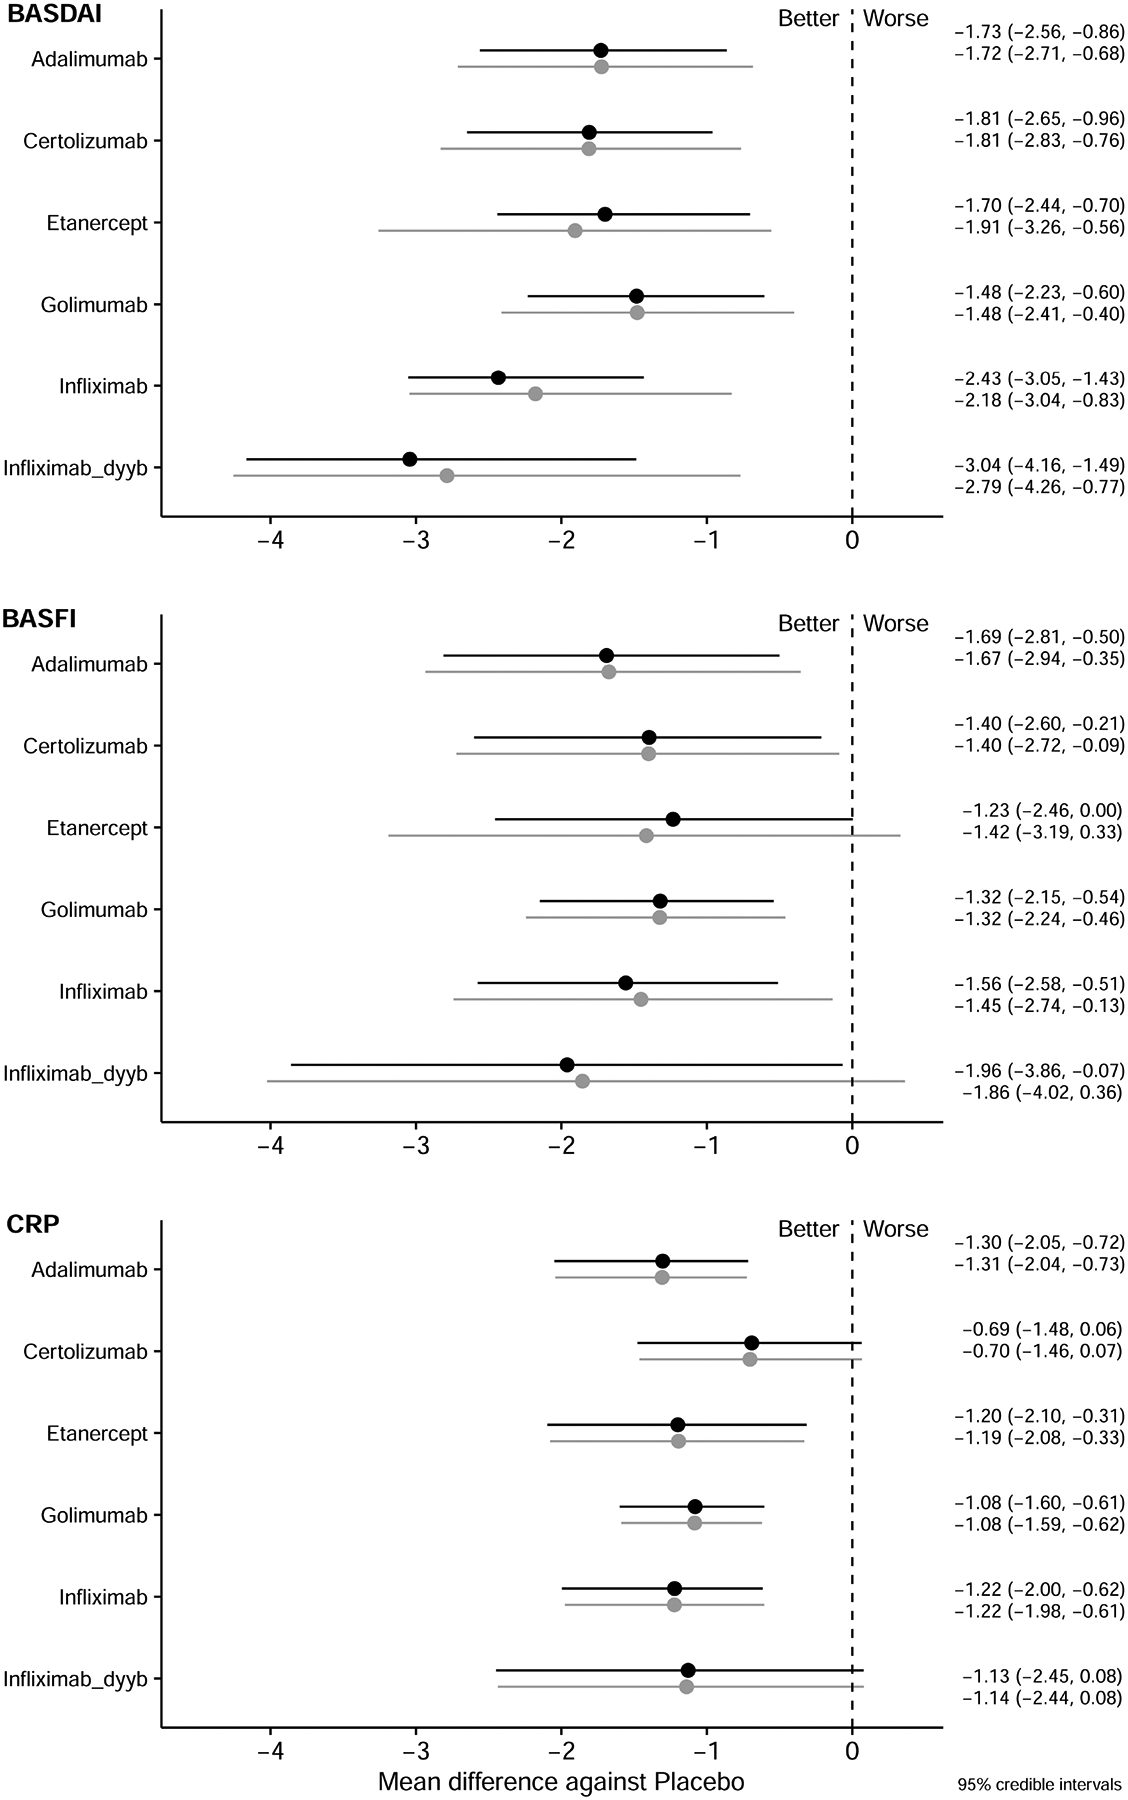
Relative effect sizes compared to placebo at 24 weeks for BASDAI, BASFI, and CRP. Relative efficacies are represented as MD with 95% CrI, and are listed in the right column. Black lines represent the analysis with an open-label trial; grey lines represent the analysis without the open-label trial. A negative value means greater reduction compared with placebo. BASDAI: Bath Ankylosing Spondylitis Disease Activity Index; BASFI: Bath Ankylosing Spondylitis Functional Index; CrI: credible interval; CRP: C-reactive protein; MD: mean difference.
There was no evidence of substantial drift in placebo responses over calendar time (data not shown).
Comparisons among TNFi at 12 weeks.
We conducted 2 analyses for paired comparison between TNFi at 12 weeks: 1 that included a single open-label study, and a second analysis that excluded this single open-label study. In the analysis that included the open-label study, IFX was significantly more efficacious in reducing BASDAI than ADA (relative effect size −1.1 MD 95% CrI −2 to −0.1), CZP (relative effect size −1.2 MD 95% CrI −2.3 to −0.02), ETN (relative effect size −1.2 MD 95% CrI −1.8 to −0.4), and GOL (relative effect size −1.1 MD 95% CrI −2 to −0.1; Table 2A, below diagonal). IFX was also significantly better in reducing BASFI than CZP (relative effect size −1.0 MD 95% CrI −1.7 to −0.03; Table 2B, below diagonal). However, there were no significant differences among TNFi in the paired comparison of changes in CRP at 12 weeks (Table 2C, below diagonal). Biosimilar IFX-dyyb had MD similar to that of IFX in reducing BASDAI, consistent with the result of the head-to-head trial between the 2 drugs. However, it had wider CrI, likely because it was assessed in only 1 trial.
Table 2A.
Comparative efficacy of BASDAI changes at 12 weeks. The relative effect size is presented as mean difference with 95% CrI.
| Drug | ADA | CZP | ETN | GOL | IFX | IFX-dyyb | PBO |
|---|---|---|---|---|---|---|---|
| ADA | – | −0.09 (−0.8 to 0.6) | 0.2 (−0.3 to 0.7) | −0.08 (−0.6 to 0.5) | 0.4 (−0.4 to 1.2) | 0.4 (−0.5 to 1.4) | −1.5 (−1.9 to −1.1) |
| CZP | 0.10 (−1.0 to 1.1) | – | 0.3 (−0.4 to 1.0) | 0.03 (−0.6 to 0.7) | 0.5 (−0.4 to 1.4) | 1.2 (−0.4 to 2.7) | −1.4 (−2 to −0.9) |
| ETN | 0.04 (−0.7 to 0.8) | −0.10 (−1 to 0.9) | – | −0.3 (−0.7 to 0.3) | 0.2 (−0.5 to 0.9) | 1.2 (−0.2 to 2.4) | −1.8 (−2 to −1.4) |
| GOL | 0.0 (−0.9 to 0.9) | −0.10 (−1.2 to 1.0) | −0.04 (−0.9 to 0.7) | – | 0.5 (−0.3 to 1.2) | 1.1 (−0.4 to 2.5) | −1.5 (−1.9 to −1.1) |
| IFX | −1.1 (−2 to −0.1) | −1.2 (−2.3 to −0.02) | −1.2 (−1.8 to −0.4) | −1.1 (−2 to −0.1) | – | 0.0 (−1.1 to 1.1) | −2 (−2.6 to −1.3) |
| IFX-dyyb | −1.1 (−2.5 to 0.4) | −0.5 (−1.5 to 0.5) | −0.2 (−1.1 to 0.7) | −0.5 (−1.4 to 0.5) | 0.01 (−0.6 to 0.6) | – | −1.9 (−2.8 to −1.1) |
| PBO | 1.5 (1.0–2.1) | 1.5 (0.6–2.3) | 1.5 (1–2) | 1.5 (0.9–2.2) | 2.7 (1.9–3.3) | 2.7 (1.3–3.9) | – |
Table 2B.
Comparative efficacy of BASFI changes at 12 weeks. The relative effect size is presented as mean difference with 95% CrI.
| Drug | ADA | CZP | ETN | GOL | IFX | IFX-dyyb | PBO |
|---|---|---|---|---|---|---|---|
| ADA | – | −0.4 (−1.1 to 0.3) | 0.08 (−0.4 to 0.6) | 0.1 (−0.4 to 0.7) | 0.08 (−0.6 to 0.8) | −0.1 (−1.1 to 0.9) | −1.5 (−1.8 to −1.1) |
| CZP | 0.4 (−0.5 to 1.2) | – | 0.5 (−0.2 to 1.2) | 0.5 (−0.2 to 1.2) | 0.5 (−0.4 to 1.3) | 0.8 (−0.5 to 1.8) | −1 (−1.6 to −0.5) |
| ETN | 0.00 (−0.6 to 0.5) | −0.4 (−1.1 to 0.4) | – | 0.03 (−0.5 to 0.5) | −0.00 (−0.7 to 0.6) | 0.4 (−0.7 to 1.3) | −1.5 (−1.8 to −1.3) |
| GOL | −0.1 (−0.8 to 0.5) | −0.5 (−1.3 to 0.3) | −0.1 (−0.7 to 0.5) | – | −0.03 (−0.8 to 0.7) | 0.2 (−0.9 to 1.2) | −1.6 (−2 to −1.1) |
| IFX | −0.6 (−1.2 to 0.1) | −1.0 (−1.7 to −0.03) | −0.6 (−1.1 to 0.05) | −0.4 (−1.1 to 0.4) | – | −0.2 (−1.0 to 0.6) | −1.5 (−2.1 to −1.0) |
| IFX-dyyb | −0.4 (−1.4 to 0.7) | −0.3 (−1.3 to 0.8) | 0.2 (−0.7 to 1.1) | 0.2 (−0.7 to 1.2) | 0.2 (−0.5 to 0.9) | – | −1.3 (−2.2 to −0.4) |
| PBO | 1.4 (1.0–1.8) | 1.1 (0.4–1.7) | 1.4 (1.1–1.8) | 1.6 (1.1–2.1) | 2 (1.4–2.5) | 1.8 (0.8–2.7) | – |
Table 2C.
Comparative efficacy of CRP changes at 12 weeks. The relative effect size is presented as mean difference with 95% CrI.
| Drug | ADA | CZP | ETN | GOL | IFX | IFX-dyyb | PBO |
|---|---|---|---|---|---|---|---|
| ADA | – | −0.45 (−1.5 to 0.6) | 0.2 (−0.6 to 1.0) | 0.01 (−0.9 to 0.9) | 0.4 (−0.5 to 1.4) | NA | −1.2 (−1.8 to −0.6) |
| CZP | 0.5 (−0.6 to 1.5) | – | 0.6 (−0.4 to 1.6) | 0.5 (−0.6 to 1.6) | 0.9 (−0.3 to 2) | NA | −0.7 (−1.6 to 0.2) |
| ETN | −0.2 (−0.9 to 0.6) | −0.6 (−1.6 to 0.4) | – | −0.2 (−1.0 to 0.7) | 0.2 (−0.6 to 1.1) | NA | −1.3 (−1.8 to −0.9) |
| GOL | −0.00 (−0.9 to 0.8) | −0.5 (−1.6 to 0.6) | 0.2 (−0.7 to 1.0) | – | 0.4 (−0.6 to 1.4) | NA | −1.2 (−1.8 to −0.6) |
| IFX | −0.4 (−1.4 to 0.5) | −0.9 (−2 to 0.3) | −0.2 (−1.1 to 0.6) | −0.4 (−1.4 to 0.6) | – | NA | −1.6 (−2.3 to −0.9) |
| IFX-dyyb | NA | NA | NA | NA | NA | – | NA |
| PBO | 1.2 (0.6–1.8) | 0.7 (−0.2 to 1.6) | 1.3 (0.9–1.8) | 1.2 (0.6–1.8) | 1.6 (0.9–2.3) | NA | – |
Values below the diagonal represent the analysis with 1 open-label trial. Values above the diagonal represent the analysis without the open-label trial. Each cell represents a paired comparison. The columns represent the reference medication for each comparison, and the rows represent the comparators. A negative value means greater improvement by the comparator, indicating the comparator is more efficacious than the reference drug. A positive value means less improvement by the comparator, indicating the reference drug is more efficacious than the comparator. Cells in bold are statistically significant comparisons at p < 0.05. BASDAI: Bath Ankylosing Spondylitis Disease Activity Score; BASFI: Bath Ankylosing Spondylitis Functional Index; CrI: credible interval; CRP: C-reactive protein; ADA: adalimumab; CZP: certolizumab; ETN: etanercept; GOL: golimumab; IFX: infliximab; IFX-dyyb: infliximab-dyyb (IFX biosimilar); PBO: placebo.
In the analysis that excluded the open-label trial, IFX was not more efficacious than other TNFi in decreasing BASDAI (Table 2A–C, above diagonals).
In the metaregression model, when adjusted for baseline BASDAI and baseline CRP, IFX remained superior to CZP, ADA, and ETN in reducing BASDAI (Supplementary Table 3, available with the online version of this article). In addition, IFX-dyyb was significantly more efficacious than ETN in reducing BASDAI. When adjusted for baseline BASFI and baseline CRP, IFX was superior to CZP and ETN in BASFI reduction. No significant difference was detected in CRP changes.
Comparisons among TNFi at 24 weeks.
The advantage of IFX seen at 12 weeks was not present in the 24-week analysis. At 24 weeks, no TNFi was significantly more efficacious than others in reducing BASDAI, BASFI, or CRP (Tables 3A–C). IFX-dyyb had numerically a higher reduction in BASDAI and BASFI compared to other TNFi, and ADA had a numerically higher reduction in CRP compared to other TNFi. However, these comparisons were not statistically significant.
Table 3A.
Comparative efficacy of BASDAI changes at 24 weeks. The relative effect size is presented as mean difference with 95% CrI.
| Drug | ADA | CZP | ETN | GOL | IFX | IFX-dyyb | PBO |
|---|---|---|---|---|---|---|---|
| ADA | – | 0.08 (−1.3 to 1.5) | 0.2 (−1.5 to 1.9) | −0.3 (−1.7 to 1.1) | 0.5 (−1.3 to 1.7) | 1.1 (−1.2 to 2.8) | −1.7 (−2.7 to −0.7) |
| CZP | −0.08 (−1.3 to 1.1) | – | 0.1 (−1.6 to 1.8) | −0.3 (−1.8 to 1) | 0.4 (−1.4 to 1.7) | 1.2 (−0.6 to 2.6) | −1.8 (−2.8 to −0.8) |
| ETN | 0.03 (−1.1 to 1.4) | 0.1 (−1.0 to 1.4) | – | −0.4 (−2.2 to 1.2) | 0.3 (−1.7 to 1.8) | 1.3 (−0.1 to 2.6) | −1.9 (−3.3 to −0.6) |
| GOL | 0.3 (−0.9 to 1.5) | 0.3 (−0.8 to 1.6) | 0.2 (−1 to 1.3) | – | 0.7 (−1.0 to 2) | 1.6 (−0.1 to 3) | −1.5 (−2.4 to −0.4) |
| IFX | −0.7 (−1.7 to 0.6) | −0.6 (−1.6 to 0.7) | −0.7 (−1.5 to 0.2) | −1.0 (−2 to 0.3) | – | 0.6 (−0.5 to 1.7) | −2.2 (−3 to −0.83) |
| IFX-dyyb | −1.3 (−2.7 to 0.5) | −1.0 (−2.8 to 1.3) | −0.9 (−2.8 to 1.6) | −1.3 (−3.1 to 0.9) | −0.6 (−1.9 to 0.7) | – | −2.8 (−4.3 to −0.8) |
| PBO | 1.7 (0.9–2.6) | 1.8 (1.0–2.6) | 1.7 (0.7–2.4) | 1.5 (0.6–2.2) | 2.4 (1.4–3.1) | 3 (1.5–4.2) | – |
Table 3C.
Comparative efficacy of CRP changes at 24 weeks. The relative effect size is presented as mean difference with 95% CrI.
| Drug | ADA | CZP | ETN | GOL | IFX | IFX-dyyb | PBO |
|---|---|---|---|---|---|---|---|
| ADA | – | −0.6 (−1.7 to 0.3) | −0.1 (−1.3 to 0.9) | −0.2 (−1.1 to 0.5) | −0.1 (−1 to 0.9) | −0.2 (−1.6 to 1.2) | −1.3 (−2 to −0.7) |
| CZP | 0.6 (−0.3 to 1.7) | – | 0.5 (−0.7 to 1.6) | 0.4 (−0.5 to 1.3) | 0.5 (−0.5 to 1.6) | 0.4 (−1 to 2) | −0.7 (−1.5 to 0.1) |
| ETN | 0.1 (−0.9 to 1.3) | −0.5 (−1.7 to 0.7) | – | −0.1 (−1.1 to 0.9) | 0.0 (−1 to 1.2) | −0.1 (−1.5 to 1.6) | −1.2 (−2.1 to −0.3) |
| GOL | 0.2 (−0.6 to 1.1) | −0.4 (−1.3 to 0.5) | 0.1 (−0.9 to 1.1) | – | 0.1 (−0.65 to 1) | 0.0 (−1.3 to 1.5) | −1.1 (−1.6 to −0.6) |
| IFX | 0.1 (−0.9 to 1) | −0.5 (−1.6 to 0.5) | −0.0 (−1.2 to 1) | −0.2 (−1.1 to 0.6) | – | −0.1 (−1.2 to 1.0) | −1.2 (−2 to −0.6) |
| IFX-dyyb | 0.2 (−1.2 to 1.6) | −0.4 (−1.9 to 1) | 0.1 (−1.5 to 1.5) | −0.1 (−1.4 to 1.3) | 0.1 (−1.0 to 1.1) | – | −1.1 (−2.4 to 0.1) |
| PBO | 1.3 (0.7–2) | 0.7 (−0.1 to 1.5) | 1.2 (0.3–2.1) | 1.1 (0.6–1.6) | 1.2 (0.6–2) | 1.1 (−0.1–2.4) | – |
Values below the diagonal represent the analysis with 1 open-label trial. Values above the diagonal represent the analysis without the open-label trial. Each cell represents a paired comparison. The columns represent the reference medication for each comparison, and the rows represent the comparators. A negative value means greater improvement by the comparator, indicating the comparator is more efficacious than the reference drug. A positive value means less improvement by the comparator, indicating the reference medication is more efficacious than the comparator. Cells in bold are statistically significant comparisons at p <0.05. BASDAI: Bath Ankylosing Spondylitis Disease Activity Score; BASFI: Bath Ankylosing Spondylitis Functional Index; CrI: credible interval; CRP: C-reactive protein; ADA: adalimumab; CZP: certolizumab; ETN: etanercept; GOL: golimumab; IFX: infliximab; IFX-dyyb: infliximab-dyyb (IFX biosimilar); PBO: placebo.
In the metaregression model, when adjusted for baseline BASDAI and CRP, IFX-dyyb remained numerically better than other TNFi in reducing BASDAI (Supplementary Table 4, available with the online version of this article). When adjusted for baseline BASFI and baseline CRP, ADA was numerically better than other TNFi in BASFI and CRP reduction. None of these differences were statistically significant.
DISCUSSION
In our systematic review and Bayesian NMA, we compared the relative efficacy of 6 different TNFi in the treatment of active AS, using BASDAI, BASFI, and CRP as outcome measures. We found that at 12 weeks, IFX was superior to ADA, CZP, ETN, and GOL in reducing BASDAI, and superior to CZP in reducing BASFI. These differences persisted in analyses that adjusted for baseline values of BASDAI, BASFI, and CRP, indicating that differences among trials in the activity of AS at enrollment did not account for this association. Qualitatively similar results were present for IFX-dyyb. We did not find differences among TNFi other than IFX in these outcomes, and found no differences among TNFi in reducing CRP levels. Responses were not different among TNFi in the 24-week analysis. We did not find differences among TNFi when we excluded an open-label trial.
The apparent earlier response to IFX and IFX-dyyb than to other TNFi may relate to the use of loading doses or to their intravenous method of administration, both of which are unique to these 2 medications. However, the advantage of IFX at 12 weeks in BASDAI responses should be interpreted cautiously. A statistically significant difference does not necessarily translate into a clinically important difference. Further, given that AS is a chronic condition, the early symptom improvement may not be viewed as important as intermediate or longterm effects. Additionally, this early advantage was not evident in the analyses that excluded an open-label study, indicating sensitivity of this association to the results of Giardina, et al3, which directly compared IFX and ETN. This sensitivity reflects the influence of trials with direct head-to-head comparisons in NMA. However, these results may assist in the choice of TNFi in clinical situations when prompt symptom responses are needed, although these situations are rare in AS. A report on comparisons of biological agents in treatment of severely active ulcerative colitis also concluded that IFX was more effective than ADA in induction therapy14.
We attempted to address many potential biases. First, we chose continuous outcome measures rather than dichotomous outcomes, to maximize the potential to differentiate effects among medications. Second, in the process of data extraction, we contacted principal investigators and/or study sponsors for additional data, increasing the completeness of the dataset and decreasing the risk of bias as a result of incomplete reporting of data. Third, to address the heterogeneity among the studies, we tested several factors that could potentially influence the relative effects of different TNFi, including examination of changes in placebo responses over time, and estimation of associations with metaregression using baseline disease activity measures as covariates. In the analysis that excluded the open-label trial, IFX was numerically (but not statistically) more efficacious than other TNFi in reducing BASDAI, indicating that this aspect of study design may influence treatment effects on patient-reported outcomes. Given its low use in these trials, concomitant MTX was unlikely to influence the comparisons among TNFi.
The major limitation of our study is the small number of head-to-head trials. Two such trials were identified, and we could construct only 1 closed loop in the evidence network with both direct and indirect comparisons of 2 drugs available (IFX vs ETN). The other TNFi were compared either to placebo directly or through another TNFi, forming a star network. Because of this, we had to assume consistency in the analysis, which reduces confidence in the estimation19.
Our study showed that IFX was somewhat more efficacious in reducing the BASDAI than several other TNFi in the short term, but this advantage was sensitive to the inclusion of an open-label trial and diminished at 24 weeks. IFX (or IFX-dyyb, which had similar effects) may therefore be conditionally preferred in the uncommon case in which a prompt symptom response is needed. The choice of TNFi in patients with AS may also be guided by the presence of specific comorbid conditions, such as inflammatory bowel disease or recurrent iritis. Without these considerations, more information on the relative safety and longterm effectiveness of TNFi will provide critical guidance on the choice of TNFi in the treatment of AS in clinical practice.
Supplementary Material
Table 3B.
Comparative efficacy of BASFI changes at 24 weeks. The relative effect size is presented as mean difference with 95% CrI.
| Drug | ADA | CZP | ETN | GOL | IFX | IFX-dyyb | PBO |
|---|---|---|---|---|---|---|---|
| ADA | – | −0.3 (−2.1 to 1.6) | −0.3 (−2.4 to 2) | −0.4 (−1.9 to 1.3) | −0.2 (−2 to 1.6) | 0.2 (−2.3 to 2.8) | −1.7 (−2.9 to −0.4) |
| CZP | 0.3 (−1.4 to 1.9) | – | 0.01 (−2.2 to 2.2) | −0.1 (−1.6 to 1.5) | 0.05 (−1.8 to 1.9) | 0.6 (−1.7 to 2.8) | −1.4 (−2.7 to −0.10) |
| ETN | 0.5 (−1.3 to 2.1) | 0.2 (−1.5 to 1.9) | – | −0.1 (−2.1 to 1.9) | 0.03 (−2.2 to 2.2) | 0.7 (−1.3 to 2.7) | −1.4 (−3.2 to 0.3) |
| GOL | 0.4 (−1.1 to 1.7) | 0.08 (−1.4 to 1.5) | −0.1 (−1.6 to 1.4) | – | 0.1 (−1.5 to 1.7) | 0.6 (−1.5 to 2.7) | −1.3 (−2.2 to −0.5) |
| IFX | 0.1 (−1.4 to 1.7) | −0.2 (−1.7 to 1.4) | −0.3 (−1.5 to 0.92) | −0.2 (−1.5 to 1.1) | – | 0.4 (−1.2 to 2) | −1.5 (−2.7 to −0.1) |
| IFX-dyyb | −0.3 (−2.5 to 1.9) | −0.5 (−3 to 2.1) | −0.4 (−3.2 to 2.4) | −0.5 (−2.9 to 1.9) | −0.4 (−2.2 to 1.4) | – | −1.9 (−4 to 0.4) |
| PBO | 1.7 (0.5–2.8) | 1.4 (0.2–2.6) | 1.2 (0.0–2.5) | 1.3 (0.5–2.1) | 1.6 (0.5–2.6) | 2 (0.10–3.9) | – |
ACKNOWLEDGMENT
The authors thank study investigators, Amgen, Pfizer, and UCB for providing additional data upon request.
Funding provided by Intramural Research Program, NIAMS, and NIH. RW is a recipient of the Rheumatology Research Foundation Scientist Development Award. The content is the responsibility of the authors and does not necessarily represent the official views of the NIH. Portions of the data were obtained from the Pfizer Clinical Data Set through a data-use agreement, and from Amgen Inc. through a data-sharing agreement. In addition, the study, carried out under YODA Project #2014-0291, used data obtained from the Yale University Open Data Access Project, which has an agreement with Janssen Research & Development LLC. The interpretation and reporting of research using these data are solely the responsibility of the authors and do not necessarily represent the official views of the Yale University Open Data Access Project or Janssen Research & Development LLC. Amgen Inc., Pfizer Inc., and the Yale Open Data Access Project were provided copies of the manuscript before submission.
Footnotes
ONLINE SUPPLEMENT
Supplementary material accompanies the online version of this article.
REFERENCES
- 1.Ward MM, Deodhar A, Akl EA, Lui A, Ermann J, Gensler LS, et al. American College of Rheumatology/Spondylitis Association of America/Spondyloarthritis Research and Treatment Network 2015 Recommendations for the Treatment of Ankylosing Spondylitis and Nonradiographic Axial Spondyloarthritis. Arthritis Rheumatol 2016;68:282–98. [DOI] [PMC free article] [PubMed] [Google Scholar]
- 2.Bell GM, Reynolds G, Isaacs JD. Biologic therapies in non-rheumatic diseases: lessons for rheumatologists? Nat Rev Rheumatol 2011;7:507–16. [DOI] [PubMed] [Google Scholar]
- 3.Giardina AR, Ferrante A, Ciccia F, Impastato R, Miceli MC,Principato A, et al. A 2-year comparative open label randomized study of efficacy and safety of etanercept and infliximab in patients with ankylosing spondylitis. Rheumatol Int 2010;30:1437–40. [DOI] [PubMed] [Google Scholar]
- 4.Park W, Hrycaj P, Jeka S, Kovalenko V, Lysenko G, Miranda P, et al. A randomised, double-blind, multicentre, parallel-group, prospective study comparing the pharmacokinetics, safety, and efficacy of CT-P13 and innovator infliximab in patients with ankylosing spondylitis: the PLANETAS study. Ann Rheum Dis 2013;72:1605–12. [DOI] [PMC free article] [PubMed] [Google Scholar]
- 5.Migliore A, Bizzi E, Bernardi M, Picchianti Diamanti A, Laganà B, Petrella L. Indirect comparison between subcutaneous biologic agents in ankylosing spondylitis. Clin Drug Investig 2015;35:23–9. [DOI] [PubMed] [Google Scholar]
- 6.Shu T, Chen GH, Rong L, Feng F, Yang B, Chen R, et al. Indirect comparison of anti-TNF-α agents for active ankylosing spondylitis: mixed treatment comparison of randomized controlled trials. Clin Exp Rheumatol 2013;31:717–22. [PubMed] [Google Scholar]
- 7.Chen C, Zhang X, Xiao L, Zhang X, Ma X. Comparative effectiveness of biologic therapy regimens for ankylosing spondylitis: a systematic review and a network meta-analysis. Medicine 2016;95:e3060. [DOI] [PMC free article] [PubMed] [Google Scholar]
- 8.Maxwell LJ, Zochling J, Boonen A, Singh JA, Veras MMS, Tanjong Ghogomu E, et al. TNF-alpha inhibitors for ankylosing spondylitis. Cochrane Database Syst Rev 2015;CD005468. [DOI] [PMC free article] [PubMed] [Google Scholar]
- 9.Schmitz S, Adams R, Walsh C. The use of continuous data versus binary data in MTC models: a case study in rheumatoid arthritis. BMC Med Res Methodol 2012;12:167. [DOI] [PMC free article] [PubMed] [Google Scholar]
- 10.Garrett S, Jenkinson T, Kennedy LG, Whitelock H, Gaisford P, Calin A. A new approach to defining disease status in ankylosing spondylitis: the Bath Ankylosing Spondylitis Disease Activity Index. J Rheumatol 1994;21:2286–91. [PubMed] [Google Scholar]
- 11.Calin A, Garrett S, Whitelock H, Kennedy LG, O’Hea J, Mallorie P, et al. A new approach to defining functional ability in ankylosing spondylitis: the development of the Bath Ankylosing Spondylitis Functional Index. J Rheumatol 1994;21:2281–5. [PubMed] [Google Scholar]
- 12.van der Linden S, Valkenburg HA, Cats A. Evaluation of diagnostic criteria for ankylosing spondylitis. A proposal for modification of the New York criteria. Arthritis Rheum 1984;27:361–8. [DOI] [PubMed] [Google Scholar]
- 13.Cochrane Handbook for Systematic Reviews of Interventions Version 5.1.0. [Internet. Accessed November 16, 2017.] Available from: handbook-5-1.cochrane.org
- 14.Dias S, Sutton AJ, Ades AE, Welton NJ. Evidence synthesis for decision making 2: a generalized linear modeling framework for pairwise and network meta-analysis of randomized controlled trials. Med Decis Making 2013;33:607–17. [DOI] [PMC free article] [PubMed] [Google Scholar]
- 15.Higgins JPT, Thompson SG. Quantifying heterogeneity in a meta-analysis. Stat Med 2002;21:1539–58. [DOI] [PubMed] [Google Scholar]
- 16.R core team. R: A Language and Environment for StatisticalComputing. [Internet. Accessed November 16, 2017.] Available from: www.R-project.org
- 17.van Valkenhoef G, Kuiper J, van Valkenhoef MG. Package ‘gemtc.’[Internet. Accessed November 16, 2017.] Available from: cran.r-project.org/web/packages/gemtc/gemtc.pdf
- 18.Plummer M JAGS: A program for analysis of Bayesian graphical models using Gibbs sampling. [Internet. Accessed November 16, 2017.] Available from: www.r-project.org/conferences/DSC-2003/Proceedings/Plummer.pdf
- 19.Salanti G, Kavvoura FK, Ioannidis JP. Exploring the geometry of treatment networks. Ann Intern Med 2008;148:544–53. [DOI] [PubMed] [Google Scholar]
- 20.van der Heijde D, Kivitz A, Schiff MH, Sieper J, Dijkmans BA, Braun J, et al. Efficacy and safety of adalimumab in patients with ankylosing spondylitis: results of a multicenter, randomized, double-blind, placebo-controlled trial. Arthritis Rheum 2006;54:2136–46. [DOI] [PubMed] [Google Scholar]
- 21.Maksymowych WP, Rahman P, Shojania K, Olszynski WP,Thomson GT, Ballal S, et al. Beneficial effects of adalimumab on biomarkers reflecting structural damage in patients with ankylosing spondylitis. J Rheumatol 2008;35:2030–7. [PubMed] [Google Scholar]
- 22.Hu Z, Xu M, Li Q, Lin Z, Liao Z, Cao S, et al. Adalimumab significantly reduces inflammation and serum DKK-1 level but increases fatty deposition in lumbar spine in active ankylosing spondylitis. Int J Rheum Dis 2012;15:358–65. [DOI] [PubMed] [Google Scholar]
- 23.Huang F, Gu J, Zhu P, Bao C, Xu J, Xu H, et al. Efficacy and safety of adalimumab in Chinese adults with active ankylosing spondylitis: results of a randomised, controlled trial. Ann Rheum Dis 2014;73:587–94. [DOI] [PubMed] [Google Scholar]
- 24.Landewe R, Braun J, Deodhar A, Dougados M, Maksymowych WP, Mease PJ, et al. Efficacy of certolizumab pegol on signs and symptoms of axial spondyloarthritis including ankylosing spondylitis: 24-week results of a double-blind randomised placebo-controlled Phase 3 study. Ann Rheum Dis 2014;73:39–47. [DOI] [PMC free article] [PubMed] [Google Scholar]
- 25.Gorman JD, Sack KE, Davis JC Jr. Treatment of ankylosing spondylitis by inhibition of tumor necrosis factor alpha. N Engl J Med 2002;346:1349–56. [DOI] [PubMed] [Google Scholar]
- 26.Davis JC Jr, Van Der Heijde D, Braun J, Dougados M, Cush J,Clegg DO, et al. Recombinant human tumor necrosis factor receptor (etanercept) for treating ankylosing spondylitis: a randomized, controlled trial. Arthritis Rheum 2003;48:3230–6. [DOI] [PubMed] [Google Scholar]
- 27.Calin A, Dijkmans BA, Emery P, Hakala M, Kalden J, Leirisalo-Repo M, et al. Outcomes of a multicentre randomised clinical trial of etanercept to treat ankylosing spondylitis. Ann Rheum Dis 2004;63:1594–600. [DOI] [PMC free article] [PubMed] [Google Scholar]
- 28.van der Heijde D, Da Silva JC, Dougados M, Geher P, van derHorst-Bruinsma I, Juanola X, et al. Etanercept 50 mg once weekly is as effective as 25 mg twice weekly in patients with ankylosing spondylitis. Ann Rheum Dis 2006;65:1572–7. [DOI] [PMC free article] [PubMed] [Google Scholar]
- 29.Barkham N, Coates LC, Keen H, Hensor E, Fraser A, Redmond A, et al. Double-blind placebo-controlled trial of etanercept in the prevention of work disability in ankylosing spondylitis. Ann Rheum Dis 2010;69:1926–8. [DOI] [PubMed] [Google Scholar]
- 30.Dougados M, Braun J, Szanto S, Combe B, Elbaz M, Geher P, et al. Efficacy of etanercept on rheumatic signs and pulmonary function tests in advanced ankylosing spondylitis: results of a randomised double-blind placebo-controlled study (SPINE). Ann Rheum Dis 2011;70:799–804. [DOI] [PMC free article] [PubMed] [Google Scholar]
- 31.Inman RD, Davis JC Jr, Heijde D, Diekman L, Sieper J, Kim SI, et al. Efficacy and safety of golimumab in patients with ankylosing spondylitis: results of a randomized, double-blind, placebo-controlled, phase III trial. Arthritis Rheum 2008; 58:3402–12. [DOI] [PubMed] [Google Scholar]
- 32.Tam LS, Shang Q, Kun EW, Lee KL, Yip ML, Li M, et al. The effects of golimumab on subclinical atherosclerosis and arterial stiffness in ankylosing spondylitis a randomized, placebo-controlled pilot trial. Rheumatology 2014;53:1065–74. [DOI] [PubMed] [Google Scholar]
- 33.Bao C, Huang F, Khan MA, Fei K, Wu Z, Han C, et al. Safety and efficacy of golimumab in Chinese patients with active ankylosing spondylitis: 1-year results of a multicentre, randomized, double-blind, placebo-controlled phase III trial. Rheumatology 2014;53:1654–63. [DOI] [PubMed] [Google Scholar]
- 34.Braun J, Brandt J, Listing J, Zink A, Alten R, Golder W, et al. Treatment of active ankylosing spondylitis with infliximab: a randomised controlled multicentre trial. Lancet 2002;359:1187–93. [DOI] [PubMed] [Google Scholar]
- 35.Marzo-Ortega H, McGonagle D, Jarrett S, Haugeberg G, Hensor E, O’Connor P, et al. Infliximab in combination with methotrexate in active ankylosing spondylitis: a clinical and imaging study. Ann Rheum Dis 2005;64:1568–75. [DOI] [PMC free article] [PubMed] [Google Scholar]
- 36.van der Heijde D, Dijkmans B, Geusens P, Sieper J, DeWoody K, Williamson P, et al. Efficacy and safety of infliximab in patients with ankylosing spondylitis: results of a randomized, placebo-controlled trial (ASSERT). Arthritis Rheum 2005; 52:582–91. [DOI] [PubMed] [Google Scholar]
- 37.Inman RD, Maksymowych WP; CANDLE Study Group. A double-blind, placebo-controlled trial of low dose infliximab in ankylosing spondylitis. J Rheumatol 2010;37:1203–10. [DOI] [PubMed] [Google Scholar]
Associated Data
This section collects any data citations, data availability statements, or supplementary materials included in this article.