

Abstract
Behavior-environment functional relations are the units of explanation in applied behavior analysis (ABA). Whether hypothesized experimentally or descriptively, quantification of putative functional relations improves our ability to predict and influence behavior. Risk ratios are an accessible, straightforward quantitative analysis that can serve this purpose. They have been employed to great effect in other fields (e.g., medicine, public health), but are rarely used within ABA. In this tutorial, we describe risk ratios and how they are calculated, discuss why risk ratios are well suited for quantifying behavior–environment relations, and illustrate their utility and applicability across five demonstrations from real clinical cases. Recommendations for the use of risk ratios in research and practice are discussed.
Keywords: Data analysis, Functional relations, Quantitative analysis, Risk ratios, Tutorial
Prediction and control are the goals of any scientific endeavor. The more precisely and extensively we document the relation between an independent and dependent variable, the greater our prediction and control of the dependent variable become. In behavior analysis, identification and description of functional relations between the environment (i.e., independent variables) and behavior (i.e., dependent variables) are the units through which we pursue and accrue the ability to predict and influence the occurrence of behaviors of interest (Skinner, 1953, 1972; see Delprato & Midgley, 1992, for a synopsis). Such functional relations can be identified and described with the most certainty through rigorous experimentation, which involves the systematic manipulation of environmental variables (e.g., a behavioral intervention) and detailed documentation of their effects on behavior. However, sometimes, especially in applied behavior analysis (ABA), systematic manipulation of environmental variables of interest and/or observation of their effects on behavior may not be feasible. In these cases, we may still develop hypotheses about functional relations through observation of the natural occurrence of environmental variables of interest and recording their effect on behavior.
Whether they are identified through experimentation or observation alone, the more quantitatively we describe behavior–environment relations, the more precise and robust our ability to predict and influence behavior becomes (Dallery & Soto, 2013). Although there are accumulating examples to the contrary (e.g., Costello et al., 2022; Falligant et al., 2020; Kranak & Hall, 2022), functional relations are often only subjected to visual analysis within ABA and, as a result, are typically summarized in qualitative terms. Thus, straightforward methods of quantifying behavior–environment relations that are suitable for routine use in research and practice are needed. One such method that has received little attention within the behavior-analytic literature is calculating risk ratios.
What are Risk Ratios?
Risk ratios are a measure of the relative likelihood of a certain outcome happening in one group relative to another, with the groups usually differing in some characteristic or history (National Cancer Institute, 2021; Tenny & Hoffman, 2022). Risk ratios are typically calculated by dividing the proportion of a group with the potential risk factor (i.e., characteristic or history) for whom the outcome of interest was obtained by the proportion of a group without the potential risk factor for whom the outcome was obtained. This yields a ratio which quantifies the relative likelihood that the outcome will be obtained given the presence of the potential risk factor. Risk ratios are frequently used in medical or health-related research to quantify how certain characteristics (e.g., the presence of genetic mutations), histories (e.g., exposure to lead), or behaviors (e.g., smoking) can increase the risk of disease; such variables are deemed risk factors. Risk ratios are also used to quantify the effects of variables (e.g., higher levels of education, frequent exercise) that decrease the risk of disease; such variables are deemed protective factors. Given that risk ratios have historically been employed in contexts where disease or death were outcomes of interest, the label risk ratio is appropriate. However, risk ratios may also be described as relative probability or rate, when the outcome of interest is not deleterious (Motulsky, 2018). In the current article, we call these analyses risk ratios throughout for the sake of clarity and consistency.
Three examples from the behavioral medicine literature illustrate the utility of risk ratios. First, Khera et al. (2016) found that the relative risk of a coronary event was 91% higher for those with a high number of genetic markers related to coronary heart disease, relative to those with a lower number of genetic markers. However, for those with a high number of genetic markers, the presence of three out of four healthy lifestyle indicators (e.g., no smoking, no obesity, frequent physical activity, healthy diet) decreased the relative risk of a coronary event by 46% compared to those with one or zero healthy lifestyle indicators. Second, Hacksaw et al. (2018) found that the relative risk of stroke was 46% and 142% higher for women that smoked 1 or 20 cigarettes per day, respectively, relative to those who did not smoke. Finally, Senn et al. (2015) examined the effectiveness of sexual assault resistance education for female college students by analyzing differences in relative risk over time for treatment (who received a 12-hr training) and control (who received information pamphlets) groups. They found that the treatment group had a 46% lower risk of being sexually assaulted than the control group.
Risk ratios are an effective, concise method of quantifying how different variables may affect the occurrence and development of a disease and can also be a useful method of quantifying how different variables affect the occurrence and development of behavior. In behavior analysis, the outcomes of interest are typically behavioral and the variables used to predict or influence behavior are typically measurable, manipulable characteristics of the environment. As a result, the definition and calculation of risk ratios require slight adjustment from those discussed above. Applied to behavior, risk ratios are a measure of the relative risk or likelihood of responding given the presence of some variable (e.g., event, behavioral characteristic, or history). Risk ratios can be calculated by dividing the probability (i.e., proportion of opportunities) or rate of behavior given some variable (i.e., conditional probability or rate) by the overall probability or rate of behavior (i.e., unconditional probability or rate; also known as background probability or rate). Thus, to calculate risk ratios, one must know the unconditional probability or rate as well as the conditional probability or rate of the target behavior. Risk ratios greater than one indicate that behavior was more likely given the variable than it was in general (i.e., the event is a risk factor). Risk ratios equal to one indicate that behavior was equally likely given the variable as it was in general. Risk ratios less than one indicate that behavior was less likely given the variable than it was in general (i.e., the event is a protective factor).
A brief examination of articles published in Perspectives on Behavior Science (PoBS) and the Journal of Applied Behavior Analysis (JABA) suggests that risk ratios have rarely been employed within the behavior-analytic literature and researchers have only recently begun to conduct such analyses. To date, in PoBS, risk ratios have not been employed; however, some recent studies have cited research in which relative risk or risk ratios were primary dependent variables (Dallery et al., 2019; Higgins et al., 2019). In JABA, risk ratios have been applied to evaluate the impact of appropriate versus inappropriate urinations on the occurrence of problem behavior during toilet training (Perez et al., 2021) and to evaluate the effect of changes in the availability of social interaction on social approach and avoidance during assessments of sociability (Morris & Vollmer, 2020, 2022a, b). It is unclear why risk ratios have not been utilized more frequently, given that they may be useful in many other areas of behavior-analytic research and practice. Potential explanations are that researchers and practitioners are unfamiliar with risk ratios, unsure how to calculate them in different contexts, or unaware of how they may be useful in addition to more common methods of data analysis. Thus, the purpose of this tutorial is to describe and demonstrate how we can and why we should utilize risk ratios to aide in the identification and quantification of behavior–environment relations.
How are Risk Ratios Useful?
Risk ratios are applicable across the continuum of experimental and descriptive analysis. In experimental analyses, risk ratios may be an effective method of quantifying the effect that environmental manipulations have on behavior and can supplement other methods of analyzing data. However, in some contexts, experimental analysis may be infeasible due to resource, training, safety, or ethical constraints. As a result, clinicians or researchers may have to rely on descriptive analysis in which behaviors and environmental events of interests are simply observed and recorded. The benefits of risk ratios may be especially pronounced in the context of descriptive analysis because fewer methods of quantifying behavior are available. Clinicians and researchers may rely on narrative description (e.g., Bijou et al., 1968) or conditional probability alone (e.g., Thompson & Iwata, 2001) to quantify potential behavior–environment relations. These descriptive methods can be complex to interpret (more on this below), and risk ratios are a concise, accessible method for analyzing and disseminating these data.
Below, we elaborate on the unique advantages of risk ratios. An attempt to provide an exhaustive list is not practical, so we will focus on three primary areas in which risk ratios are beneficial: (1) data analysis; (2) concise dissemination; and (3) overcoming limitations of traditional assessment methods.
Data Analysis
Risk ratios can aid data analysis in at least two ways. First, risk ratios may correspond to and corroborate what behavior analysts conclude based on visual analysis. Figure 1 includes hypothetical data for four distinct cases to illustrate this point. In each panel, the probability of behavior is shown across bins of time and the bins of time are centered around the point in time at which an event occurs. The behavior could be a child’s disruptive behavior or functional communication response or the behavior of a clinician, parent, or teacher. The bins of time could be 10-s intervals, 5-min sessions, or successive days. The event line could represent a momentary change in the environment (e.g., a toy is removed, a peer approaches) or a more molar, but temporary, change (e.g., a lapse in intervention implementation, a change in routine or schedule, exposure to extra-experimental contingencies). In any case, one conclusion of interest will be whether the event in question exerted affected behavior.
Fig. 1.
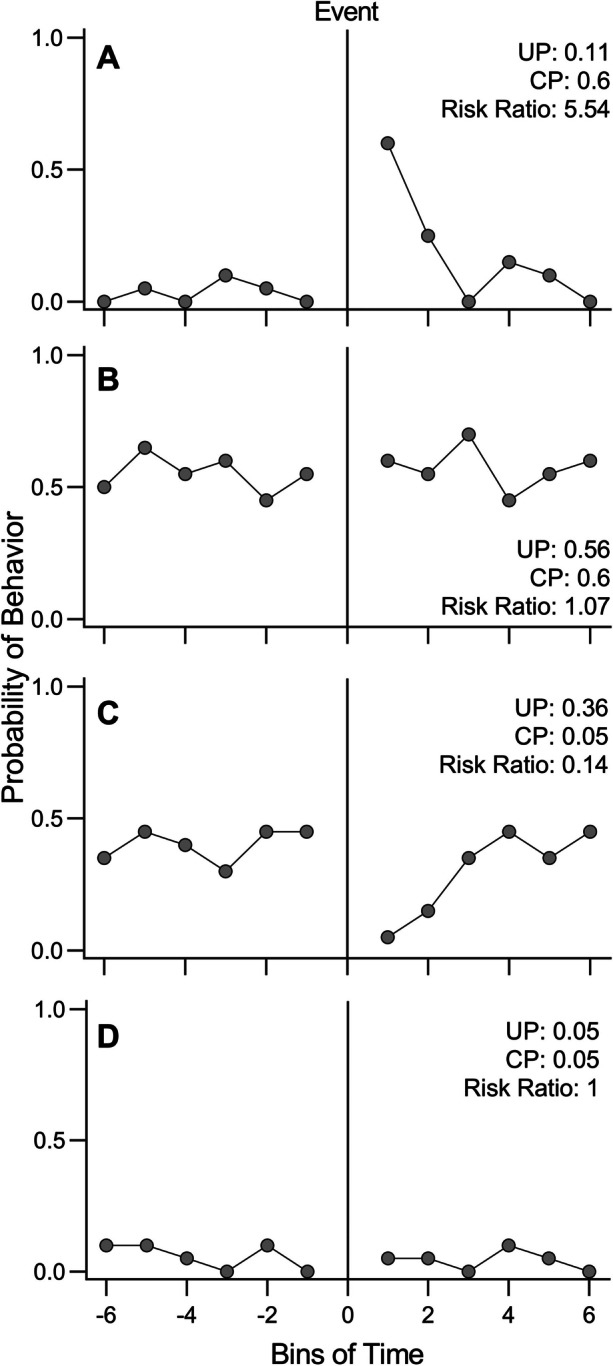
Hypothetical data to illustrate the utility of risk ratios
With the data in Fig. 1 available, visual analysis may lead a behavior analyst to conclude that the event made behavior more likely for Case A, less likely for Case C, and exerted no discernable effect for Cases B and D. Unconditional probability (UP) alone fails to make these discriminations and only provides the average probability across all bins of time. Conditional probability (CP) of behavior within the bin of time immediately following the event differentiates between Cases A and C, but fails to differentiate between cases A and B or between C and D. In contrast, risk ratios concur with visual analysis. A risk ratio greater than one for Case A indicates that the event made behavior more likely than it was in general. A risk ratio less than one for Case C indicates that the event made behavior less likely than it was in general. A risk ratio at or near one for Cases B and D indicates that the effect had little effect on behavior. Although risk ratios do not demonstrate functional relations or replace all elements of visual analysis (e.g., examination of trends) they can provide valuable information about the correlation between events and behavior.
Second, risk ratios can also quantify the magnitude of an effect on behavior that may otherwise only be described in subjective, qualitative terms (e.g., a large, significant effect). Continuing to use Fig. 1 for the purpose of illustration, behavior analysts may agree that the event had an effect for Cases A and C but disagree about the magnitude of the effect. Although they do not displace visual analysis, RRs can help to avoid issues of variance in interpretation because they provide a precise, quantitative description of the magnitude of effect. For Case A behavior was 5.54 times as likely or 454% more likely given the event, whereas for Case C behavior was 0.14 times as likely or 86% less likely given the event.
Concise Dissemination
Risk ratios can facilitate the summary, synthesis, and dissemination of assessment and treatment outcomes. They are an ideal measure for dissemination because they constitute a single value to interpret instead of multiple values or repeated measures of behavior across time and/or conditions. They can also be interpreted in simple, everyday language (e.g., behavior was 3.1 times or 210% more likely following the event) and are more easily interpreted than other measures of relative occurrence or likelihood (e.g., odds or hazard ratios; Cummings, 2009).
In the context of descriptive assessment, narrative description and conditional probability are often exclusively relied upon. A recent review of research on using descriptive assessments to identify the function of problem behavior (Contreras et al., 2023) suggests that 76% of articles specifying a method of data analysis relied on conditional probability alone. However, as Fig. 1 illustrates, conditional probability alone may by misleading, whereas risk ratios may provide a clearer and more accurate description of potential behavior–environment relations by accounting for all available descriptive data. Some researchers have improved upon using conditional probability alone by graphically depicting both conditional and unconditional probabilities (e.g., Pence et al., 2009; Borrero et al., 2016); however, the graphical depiction of these values separately necessitates an interpretation of difference in height or length, which may decrease clarity and increase difficulty of and errors in interpretation (Cleveland & McGill, 1984).
In addition, and perhaps most important, risk ratios can summarize large amounts of behavioral data and quantify behavior-environment relations. Thus, utilizing risk ratios may facilitate the synthesis of research in systematic reviews and meta-analyses as well as the implementation of larger-scale analyses which compare outcomes across individuals (e.g., the identification of predictive or prognostic behavioral markers; Hagopian et al., 2018; Falligant & Hagopian, 2020). Moreover, given that risk ratios are relatively simple to calculate and easy to interpret, they are unique among other methods of quantifying behavior-environment relations in their practicality and suitability for routine use in research and practice.
Overcoming Limitations of Traditional Assessment Methods
Risk ratios are well-suited to examine behavior that presents challenges for traditional experimental and descriptive assessment methods. Behavior that is dangerous, infrequent, covert (occurring only in the presence of the individual), or difficult to evoke in assessment contexts may not be amenable to these methods. For example, in assessing extremely dangerous behavior (e.g., severe aggression requiring hospitalization) that occurs infrequently (e.g., once or twice per month) and only in the presence of the individual and their target, it is difficult to systematically observe or manipulate the stimuli that evoke behavior and infeasible to contrive analogous evocative situations. However, utilizing risk ratios to evaluate the correlation of environmental variables surrounding each occurrence of behavior can provide valuable information about relevant antecedents and consequences or elucidate behavior patterns that are predictive of the recurrence of dangerous behavior that would otherwise go unnoticed. One may be unable to observe or manipulate antecedents and consequences, but after an instance of aggression occurs other potentially relevant information is available (e.g., time, location, presence of staff members and other students). Perhaps aggression is frequently occurring during the reduced supervision caused by a staff shift change in a particular location. This makes risk ratios a particularly valuable tool for researchers and clinicians working with individuals who engage in behavior that is dangerous or difficult to monitor effectively.
Risk ratios are also often applicable to existing data for individuals or groups, allowing retrospective analysis where other assessment methods may require additional, time-consuming data collection to provide useful information. Practitioners consistently report time and resource constraints as a barrier to completing functional assessment despite procedural modifications designed to improve efficiency (Hanley, 2012; Roscoe et al., 2015). In some settings (e.g., a resource-constrained school), it can take substantial time and effort to gather resources, schedule, and complete a functional analysis or to obtain enough descriptive assessment data to hypothesize a behavior function. For example, if a middle-school student is referred for assessment and intervention for aggression in a public school, any kind of functional assessment would require time to conduct. However, a risk ratio analysis of the environmental events surrounding his aggression could be conducted based on information obtained from referrals or other documentation of aggressive episodes. Perhaps the aggression reliably occurs at a certain time, in the presence of a particular staff member, or during specific activities. Making quick changes to the environment based on these findings can improve safety by reducing the likelihood of aggression while a functional assessment and behavior intervention plan are completed.
The Current Tutorial
In summary, risk ratios can be used to enhance data analysis, facilitate data synthesis and dissemination, and address limitations of traditional functional assessment methods. These benefits of risk ratios are evident across the range of contexts to which they are applicable and variety of functions that they may serve. In subsequent sections, we illustrate the utility and applicability of risk ratios by providing a technological description of how they can be calculated across diverse scenarios. Below, we first provide an explanation of the risk ratio formula and how its components are calculated. Then, we provide five demonstrations of risk ratios being used to (1) identify days of the week when behavior is most likely; (2) hypothesize functional relations between antecedents and behavior; (3) hypothesize functional relations between behavior and consequences; (4) evaluate and quantify stimulus function; and (5) predict the trajectory or development of behavior. For each demonstration, we describe the behavioral and environmental measures that are included, details of the procedures and clinical context through which the data were obtained, how the risk ratios were calculated and interpreted for those data, and how they serve the intended function. We conclude with a summary and future directions for behavioral research.
Demonstrations
Calculating risk ratios requires data with certain essential characteristics. Although risk ratios can be calculated from a range of data formats, you must be able to determine the conditional value (probability or rate) and the unconditional value (probability or rate). Probability refers to values for which the number of opportunities is finite (e.g., when an individual is presented with a choice; See Demonstration 3), and rate refers to contexts in which the environmental variable of interest relates to time (e.g., when or how often behavior occurs; See Demonstrations 1 and 2). Recall that the unconditional value describes the overall probability or rate of behavior across all variables of interest (e.g., days of the week) or opportunities to respond (e.g., 10-s intervals) and the conditional value describes the specific probability or rate of behavior given a specific variable (e.g., Tuesdays; 10 s following an event of interest). Although there are multiple ways to calculate probabilities, they can all be used to calculate risk ratios provided the conditional and unconditional probability are calculated from the same data using the same methods.
To obtain the conditional and unconditional values, you need data that describe the number of opportunities for the behavior, the number of instances of the behavior, and how behavior occurs relative to your variables of interest (e.g., which days, how close in time to an event of interest). For example, to calculate the risk of aggression occurring on different days of the week, you need to know the total number of days in the sample as well as the number of specific days of the week in the sample (e.g., the number of Mondays). You also need to know the total number of instances of aggression as well as the instances that occurred on specific days of the week (e.g., how many instances on Mondays). In the demonstrations below, we walk through the process of taking a large amount of data and breaking it down into usable units of analysis.
With the exception of Demonstration 3, all data in the following demonstrations originated from the authors’ clinical work. Dissemination of these findings was approved by the authors’ university-based Institutional Review Boards.
Demonstration 1: Identifying High- and Low-Risk Days of the Week
One of the simplest applications of risk ratios is analyzing the occurrence of behavior across units of time (e.g., days of the week, times of day, staff shifts) to determine when it is more or less likely to occur. This analysis may be of interest in scenarios where little is known about behavior function and you are interested in the potential influence of unknown environmental variables. For example, a relevant event that is unknown to you may reliably occur on Thursdays (e.g., this is the day a part-time staff member works with the client). Conducting a risk ratio analysis of behavior across units of time can guide you to investigate times of higher or lower likelihood.
In this demonstration, we examined occurrences of aggression in a secure residential detention center serving approximately 120 juvenile offenders. Residents in this facility ranged in age from 12 to 18 and had been adjudicated delinquent through the court system for various crimes including illegal drugs, gang activity, sexual offenses, and violence. Instances of aggression in the facility could be extremely dangerous, sometimes involving weapons, causing severe injury to other residents or staff members, or both. Any time an instance of aggression occurred in the facility, staff members made a report that included the name of the aggressor, the name of their target, date, time, location, independent witness statements (if available), and any documented evidence of the event (e.g., photos of injuries, weapons used, security video of the event). Reports were stored in an excel database. This reporting system had been in place for years and contained a substantial amount of data, so we were able to retroactively conduct a facility-wide analysis of aggression across days of the week.
Procedures
We examined the data for the previous year in the facility, isolating incidents of aggression. We then determined the day of the week each incident occurred by programming the spreadsheet to turn a calendar date into a day of the week (e.g., 27 July 2022 was a Wednesday). Next, we determined the total number of incidents on each day of the week (e.g., 34 instances of aggression occurred on Wednesdays) and the number of times each day occurred during that year (e.g., there were 52 Wednesdays in 2022) using a calendar. In this analysis, we examined the likelihood of aggression for all residents as a group because facility administration was most interested in determining ways to mitigate its occurrence across the facility rather than on an individual basis. However, the steps for conducting this analysis would be the same for an individual provided the data are available. To calculate the unconditional rate, we divided the total number of instances of aggression (194) by the total number of days (366) in the sample to get 0.53 (194/366 = 0.53). To calculate the conditional rate for each day of the week, we divided the number of instances of aggression occurring on a given day (e.g., 38 instances occurring on Mondays) by the number of that day in the sample (e.g., there were 52 Mondays that year; 38/52 = 0.73). We then divided the conditional rate by the unconditional rate to obtain the risk ratio for each day of the week (e.g., 0.73/0.53 = 1.4 for Mondays). The data used for these calculations are presented in Table 1.
Table 1.
Data for calculating risk ratios to quantify the relative likelihood or risk of aggression across days
| Number or Percentage of Opportunities | Frequency of Aggression | Unconditional Probability | Conditional Probability | Risk Ratio | |
|---|---|---|---|---|---|
| All Days | 366 | 194 | 0.53 | - | - |
| Sunday | 52 | 22 | - | 0.42 | 0.80 |
| Monday | 52 | 38 | - | 0.73 | 1.38 |
| Tuesday | 52 | 28 | - | 0.54 | 1.02 |
| Wednesday | 52 | 34 | - | 0.65 | 1.23 |
| Thursday | 52 | 45 | - | 0.87 | 1.63 |
| Friday | 53 | 49 | - | 0.92 | 1.74 |
| Saturday | 53 | 20 | - | 0.38 | 0.71 |
Results
When the data are graphed as bars and evaluated in reference to a value of one (indicated by a horizontal line; see Fig. 2), we can see which days of the week are at a higher risk for aggression (risk factors) and which are at a decreased risk for aggression (protective factors). Monday has an elevated risk (risk ratio = 1.4; aggression was 40% more likely), then the risk decreases to neutral on Tuesdays (risk ratio = 1; aggression was no more or less likely to occur), followed by steadily increasing risk from Wednesday (risk ratio = 1.2) to Friday (risk ratio = 1.7). Saturday and Sunday had the lowest likelihood of aggression with risk ratios of 0.7, whereas Friday had the highest risk. These results indicated that weekends were a protective factor (i.e., aggression is least likely to occur over the weekend), and Fridays were a risk factor (i.e., aggression is most likely to occur on a Friday).
Fig. 2.
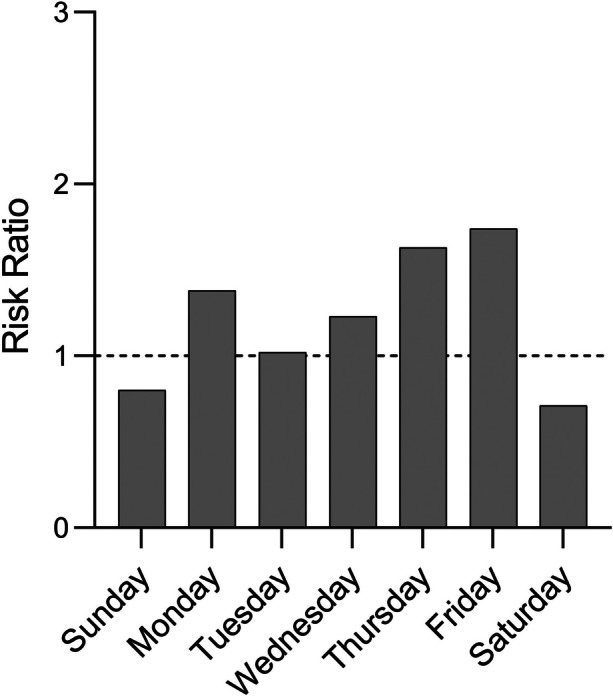
Risk ratios to quantify the relative likelihood or risk of aggression across days
Implications
Facility stakeholders were able to use the information provided by this analysis to inform staff scheduling decisions and to investigate environmental variables on high-risk days to attempt to mitigate occurrence. Although this particular example does not provide much more information than graphing the frequency of aggression on each day because there were similar numbers of each day across the year, it does allow one to quantify the level of increased or decreased risk on each day (i.e., aggression was approximately 70% more likely to occur on a Friday than on a Tuesday). This type of analysis may provide more valuable information when a group or individual is sporadically present (e.g., their attendance at school is infrequent). Day of week analyses may also be supplemented by analyses of time of day or location to provide more detail. For example, it might be useful to know that 3:00 pm on a Friday is the highest risk time on the highest risk day so stakeholders could evaluate the events occurring at that time. Perhaps this time on Friday is when there is a period with lower supervision or staff-to-student ratios.
This approach can be applied in an array of settings to examine big-picture behavioral trends. For example, an early intervention preschool may prioritize tracking individual behavior and thus overlook environmental variables with widespread effects. Perhaps the procedures of a shift change result in a brief site-wide increase in problem behavior which would not otherwise be detected. The approach is also useful on an individual basis. Perhaps a student has an elevated risk of disruption on Thursdays, and an investigation indicates that her father takes her to school on Thursdays and frequently forgets to give her medication. Although elevated risk ratios on certain days or times do not demonstrate behavior function, they can be useful as an exploratory or investigative tool to uncover unknown environmental variables influencing behavior.
Demonstration 2: Identifying Potential Functional Relations between Antecedents and Behavior
Behavior analysts are often tasked with identifying functional relations between antecedents and behavior to determine circumstances under which behavior is likely to occur and use this information to inform subsequent assessment and intervention. Often, behavior is followed by multiple simultaneous stimulus changes (e.g., attention, escape, and access to tangible items), making the antecedent-behavior analysis the best course of action for hypothesizing function. In some contexts, it may be feasible to systematically manipulate the presence and absence of antecedents of interest as in a structured descriptive assessment (e.g., Anderson & Long, 2002). However, in other contexts such manipulation may be infeasible due to constraints of the setting or difficulty contriving the relevant antecedents. These are cases in which risk ratios can serve or approximate the function of more analytic, intensive assessments. In particular, risk ratios can be used to quantify how much more likely behavior is given an antecedent than it is in general. To use risk ratios in this way, we must record all occurrences of behavior and antecedents of interest during our period of observation.
In this demonstration, we examined how different decibel levels and events such as instructions or watching videos influenced the likelihood of ear plugging for two children (age 11–12) with autism spectrum disorder. For these individuals, ear plugging occurred so frequently that caregivers and clinicians were concerned that it may put them in danger, damage their hearing, or impede their skill acquisition. Thus, we utilized risk ratios to identify antecedents that seemed to evoke or occasion ear plugging.
Procedures
We conducted 12, 10-min observations that occurred across at least two locations and two times of day. During these observations we recorded the duration of ear plugging, defined as plugging or covering at least one ear with any part of the hand. We also recorded decibel level via a decibel reader which was held and recorded by an observer who always remained approximately 5 feet from the participant. We also recorded the occurrence of antecedents of interest such as the participant engaging in vocal stereotypy (i.e., emitting vocal behavior with no clear social function), the participant interacting with leisure items (e.g., watching a video or interacting with toys), the delivery of an instruction in the context of discrete-trial training (e.g., “Match the picture”), and the initiation of social interaction (i.e., coming within 5 feet of the participant and initiating a vocal or physical interaction). All dependent variables were recorded in real time, with a time stamp of the second at which they occurred and stopped occurring.
Results
Table 2 depicts the results of these observations for two participants. A total of 7,200 10-s intervals of observation were included for each participant and we considered each 10-s interval an opportunity for ear plugging to occur. Thus, the number of 10-s intervals with ear plugging divided by the total number of 10-s intervals (i.e., opportunities for ear plugging) yielded an unconditional probability of ear plugging. For example, Alexandra ear plugged during 4,236 of the 7,200 intervals, yielding an unconditional probability of 0.59 (4,236/7,200 = 0.59). Next, we calculated the conditional probability of ear plugging given different antecedents of interest. Given that 10-s intervals were used to calculate the unconditional probability, it was important to use 10-s intervals in the calculation of the conditional probabilities to equate opportunity for ear plugging. We calculated the conditional probability of ear plugging given each antecedent by evaluating the probability that ear plugging occurred in the 10-s interval following the onset of that antecedent event and during each subsequent 10-s interval that the antecedent event continued to occur. Thus, the number of 10-s intervals in which ear plugging occurred following the onset or continued occurrence of an antecedent divided by the total number of 10-s intervals in which that antecedent occurred yielded a conditional probability of ear plugging. For example, Alexadra ear plugged 179 out of the 210 intervals in which others attempted to engage in social interaction with her, yielding a conditional probability of 0.85 (179/210 = 0.85).
Table 2.
Data for calculating risk ratios to quantify the relative likelihood or risk of ear plugging following different decibel levels or events
| Number of Intervals | Intervals with Ear Plugging | Unconditional Probability | Conditional Probability | Risk Ratio | |
|---|---|---|---|---|---|
| Alexandra | |||||
| All Decibels and Events | 7,200 | 4,236 | 0.59 | - | - |
| < 80 dB | 5,006 | 2,899 | - | 0.58 | 0.98 |
| 80–89 dB | 1,062 | 650 | - | 0.61 | 1.04 |
| 90–99 dB | 1,132 | 687 | - | 0.61 | 1.03 |
| > 99 dB | 0 | - | - | - | - |
| Vocal Stereotypy | 451 | 280 | - | 0.62 | 1.06 |
| Leisure Items | 566 | 253 | - | 0.45 | 0.76 |
| Instructions | 184 | 148 | - | 0.80 | 1.37 |
| Social Interaction | 210 | 179 | - | 0.85 | 1.45 |
| Harold | |||||
| All Decibels and Events | 7,200 | 2,183 | 0.30 | - | - |
| < 80 dB | 4,249 | 849 | - | 0.20 | 0.66 |
| 80–89 dB | 2,012 | 795 | - | 0.40 | 1.30 |
| 90–99 dB | 915 | 523 | - | 0.57 | 1.89 |
| > 99 dB | 24 | 16 | - | 0.67 | 2.20 |
| Vocal Stereotypy | 707 | 344 | - | 0.49 | 1.60 |
| Leisure Items | 881 | 400 | - | 0.45 | 1.50 |
| Instructions | 300 | 79 | - | 0.26 | 0.87 |
| Social Interaction | 498 | 119 | - | 0.24 | 0.79 |
Once the unconditional probability has been calculated and the conditional probabilities have been calculated for each antecedent of interest, the risk ratios for each antecedent can be calculated by dividing the conditional probability by the unconditional probability. Risk ratios for each antecedents’ effect on ear plugging are provided in Table 2 and depicted in Fig. 3. Each risk ratio quantifies how the probability of ear plugging changed given the occurrence of the antecedent event. For Alexandra, the observed decibel values had no effect on the likelihood of her ear plugging: all risk ratios remained near one. However, our analysis suggests that other antecedents such as the initiation of an instruction or social interaction may increase the likelihood of ear plugging, making it 1.37 or 1.45 times as likely than it is in general (i.e., unconditionally), whereas engagement with leisure items may decrease the likelihood of ear plugging, making it 0.76 time as likely than it is in general. For Harold, the higher the decibel level, the more likely his ear plugging became relative to how likely it was in general. Risk ratios for decibels less than 80, between 80 and 90, between 90 and 99, and greater than 99 indicated that ear plugging became 0.66, 1.30, 1.89, 2.20 times as likely than it was in general, respectively. Our analysis also suggests that earplugging was more likely when Harold was engaging in vocal stereotypy (risk ratio = 1.60) and with leisure items (risk ratio = 1.50) and less likely when others initiated an instruction (risk ratio = 0.87) or social interaction (risk ratio = 0.79) than it was in general.
Fig. 3.
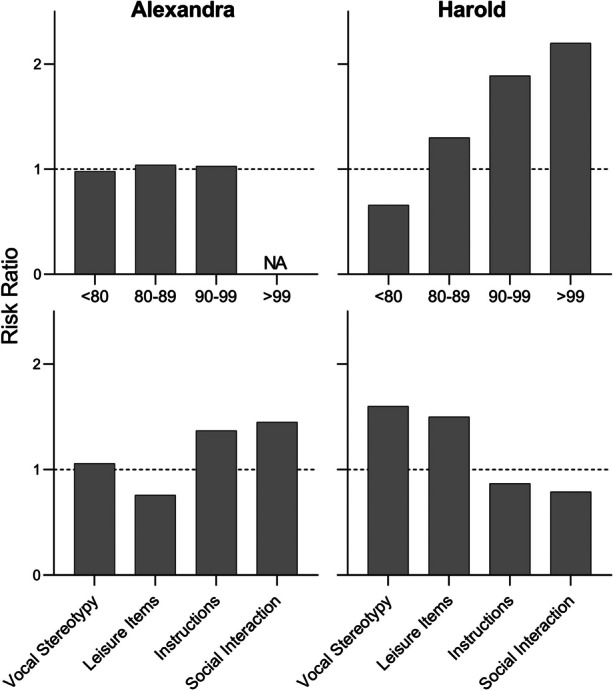
Risk ratios to quantify the relative likelihood or risk of ear plugging following different decibel levels or events
Implications
Descriptive assessment results, as summarized by the risk ratios, could be used to inform and develop subsequent intervention. Results of Alexandra’s descriptive assessment suggest that her ear plugging did not occur due to the volume of sounds in her environment or whenever she engaged in vocal stereotypy or with leisure items. Instead, Alexandra’s ear plugging became more likely when others initiated instructions or social interactions. These data suggest that a good next step may be to teach Alexandra to ask for a break from or the termination of instructions and social interactions or to evaluate methods of decreasing the extent to which instructions and social interactions are aversive. Results of Harold’s descriptive assessment suggest that his ear plugging did not occur when others initiated instructions or social interactions. Instead, Harold’s ear plugging became more likely when loud sounds occurred in his environments or when he was engaging in vocal stereotypy or with leisure items. These data indicate that a good next step may be to teach Harold a way to ask to reduce the volume or go to a quieter place. Given that Harold’s earplugging also seemed to supplement other reinforcing activities (i.e., vocal stereotypy, watching videos), it may also be beneficial to teach him safer ways to alter sound or volume (e.g., headphones or covering ears rather than plugging). These risk ratios could also be used to inform the development of subsequent functional analyses to ensure they are as ecologically valid and efficient as possible. Using risk ratios in this way will be discussed more in the context of the next demonstration.
Demonstration 3: Identifying Potential Functional Relations between Behavior and Consequences
Behavior analysts often need to identify functional relations between behavior and consequences to determine what consequences are likely to be delivered following the response and use this information to inform subsequent assessment and intervention. In some contexts, it may be feasible to systematically manipulate consequences of interest as in a functional analysis (e.g., Bloom et al., 2011; Iwata et al., 1982/1994). In these contexts, risk ratios can allow researchers and clinicians to use precise, quantitative criteria to inform which conditions may be useful and ecologically valid to evaluate. However, many clinicians report that they rely on indirect or descriptive assessments rather than functional analyses (Oliver et al., 2015; Petursdottir et al., 2010). Moreover, in some contexts manipulating consequences may be infeasible due to infrequent occurrence, unethical due to the severity of responses, types of consequences, or training and equipment deficiencies, or unacceptable from a social validity standpoint. Again, these are contexts in which risk ratios can serve or approximate the function of more analytic, intensive assessments. In particular, risk ratios can identify which consequences may be playing a role in maintaining behavior and indicate ways that consequences should be adjusted to improve allocation between problematic behaviors and appropriate alternatives. To use risk ratios in these scenarios, we must record all occurrences of any consequences of interest (e.g., attention, tangible items) and target behavior during our period of observation.
Let us consider an example from a few cases previously published by Pence et al. (2009), in which the occurrence of consequences and target behaviors were recorded as described above, but risk ratios were not calculated. Pence et al. conducted descriptive assessments and functional analyses with these three individuals because the target behaviors were reported to interfere with social interactions and skill development. Although the purpose of the study was to evaluate correspondence in the results of descriptive assessments and functional analyses, the descriptive assessments served to describe the occurrence of different consequences following target behaviors within participant’s classrooms. In this demonstration, we utilize the data to illustrate how risk ratios can summarize and quantify the strength of potential behavior–environment relations.
Procedures
Pence et al. (2009) conducted a series of observations consisting of one to three 10-min sessions and continued observing participants until at least 20 instances of the target behavior, 20 min of each consequence being present, and 60 min of observation had occurred. Participants were observed in their classroom across a variety of environmental contexts. During observations, the frequency or duration of participants’ target behavior was recorded. The duration of each consequence of interest was also recorded, including attention (e.g., vocal or physical interaction), no demand (e.g., no prompts to engage in a specific behavior), and materials (e.g., access to leisure or edible items). All dependent variables were recorded in real time, with a time stamp of the second at which they occurred and stopped occurring.
Results
Table 3 depicts the results of these observations for three participants. It is unclear from Pence et al. (2009) how many intervals were included for each participant, but for the purposes of illustration, we have assumed a total of 60 min of observation were included for each participant and that the target behavior occurred 20 times, resulting in a total of 3,600 10-s intervals of observation and 200 intervals in which target behavior occurred. Each 10-s interval was considered an opportunity for the consequence to be delivered. The number of intervals with a consequence divided by the total number of 10-s intervals (i.e., opportunities for the consequence to be delivered) yielded an unconditional probability for each consequence. For example, during observations of Gina attention was delivered during 1,332 of the 3,600 intervals, yielding an unconditional probability of 0.37 (1,332/3,600 = 0.37). Next, the conditional probability of each consequence given the occurrence of target behavior was calculated. Given that 10-s intervals were used to calculate the unconditional probability, 10-s intervals were also used in the calculation of the conditional probabilities to equate the opportunity for consequence delivery. The conditional probability of each consequence was calculated by evaluating the probability that a consequence was delivered within the 10-s interval following the occurrence or onset of target behavior. Thus, the number of 10-s intervals in which the consequence was delivered following the occurrence of target behavior by the total number of 10-s intervals in which the target behavior occurred yielded a conditional probability for each consequence. For example, during Gina’s observations, attention was delivered following the occurrence of target behavior during 96 out of 200 intervals in which target behavior occurred, yielding a conditional probability of 0.48 (96/200 = 0.48).
Table 3.
Data for Calculating Risk Ratios to Quantify the Relative Likelihood or Risk of Different Consequences following Problem Behavior (from Pence et al., 2009)
| *Number of Intervals with Consequence | *Number of Intervals Following PB with Consequence | Unconditional Probability | Conditional Probability | Risk Ratio | |
|---|---|---|---|---|---|
| Gina | |||||
| Attention | 1,332 | 96 | 0.37 | 0.48 | 1.30 |
| No Demand | 360 | 0 | 0.10 | 0.00 | 0.00 |
| Tangible | 72 | 0 | 0.02 | 0.00 | 0.00 |
| Hannah | |||||
| Attention | 1,152 | 44 | 0.32 | 0.22 | 0.69 |
| No Demand | 684 | 16 | 0.19 | 0.08 | 0.42 |
| Tangible | 360 | 12 | 0.10 | 0.06 | 0.60 |
| Charlie | |||||
| Attention | 1,224 | 12 | 0.34 | 0.06 | 0.18 |
| No Demand | 468 | 52 | 0.13 | 0.26 | 2.00 |
| Tangible | 360 | 0 | 0.10 | 0.00 | 0.00 |
Note: * = values estimated for illustration purposes, assuming 3,600 total intervals and 200 intervals with target behavior
Once the unconditional probability has been calculated and the conditional probabilities have been calculated for each consequence of interest, risk ratios for each consequence can be calculated by dividing the conditional probability by the unconditional probability. Risk ratios for the effect of target behavior on the occurrence of each consequence are provided in Table 3 and depicted in Fig. 4. Each risk ratio quantifies how the occurrence of each consequence changed given the occurrence of each participant’s target behavior. For Gina, attention was 1.30 times as likely to be delivered following the occurrence of target behavior than it was in general (i.e., not conditional on the occurrence of target behavior), whereas the removal of instructions or delivery of leisure or edible items never occurred following the occurrence of target behavior during observations (risk ratios = 0). These data suggest a potential behavior–environment relation or contingency between Gina’s target behavior and the delivery of attention. For Hannah, attention and tangible items were often delivered and instructions were often removed following the occurrence of target behavior, but they were 0.69, 0.60, and 0.42 times as likely to be delivered following target behavior than they were to be delivered in general. These data suggest none of the consequences were involved in a potential behavior–environment relation with Hannah’s behavior. For Charlie, the removal of instructions was twice as likely given the occurrence of target behavior than it was general, whereas the delivery of attention (risk ratio = 0.18) and tangible items (risk ratio = 0) were less likely given the occurrence of target behavior than they were in general. These data suggest a potential behavior–environment relation between Charlie’s target behavior and the removal of instructions.
Fig. 4.
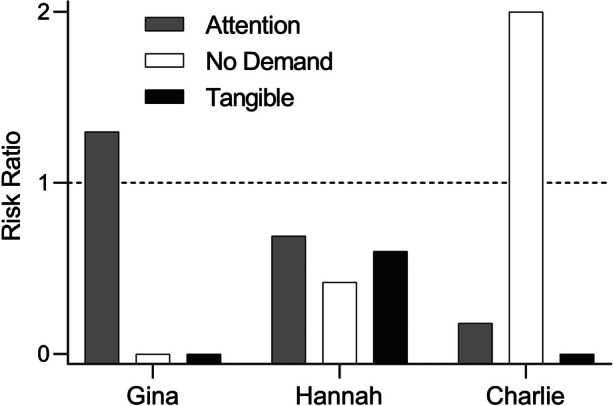
Risk ratios to quantify the relative likelihood or risk of different consequences following problem behavior (from Pence et al., 2009)
Implications
The descriptive assessment results as summarized by the risk ratios are more accurate than conditional probability alone, easier to interpret and disseminate than tabular or graphical depictions of unconditional and conditional probability, and could be used to inform subsequent assessments (e.g., a functional analysis). For example, the descriptive assessment data may be used to increase the efficiency and ecological validity of a functional analysis by ruling out conditions (Contreras et al., 2023). In particular, it may be useful to exclude conditions involving consequences which were not observed to be part of potential behavior-environment relations or contingencies that could maintain target behavior (i.e., risk ratios less than or equal to one). The descriptive assessment results may also be useful to assess staff or parent behavior and inform the development of training procedures and goals. For example, any case in which consequences are more likely to be delivered contingent on a disruptive behavior than they are in general (i.e., risk ratios greater than one) indicates a potentially maladaptive contingency that could currently or eventually function to maintain disruptive behavior. It may be infeasible or unreasonable for staff, teachers, or parents to avoid ever delivering the consequence following disruptive behavior, but training them to ensure that potentially reinforcing consequences are less likely to be delivered following disruptive behavior than they are in general (i.e., risk ratios less than one) or conditional on appropriate alternatives may be sufficient to shift allocation away from disruptive behavior and toward more appropriate alternatives (Kronfli et al., 2021; see Bacotti et al., 2022, and Vollmer et al., 2020, for discussions)
Demonstration 4: Evaluating and Quantifying Stimulus Function
Categorizing stimuli, activities, or interactions based on their function (i.e., how they affect an individual’s behavior) is a fundamental part of ABA. Such categorization is necessary for determining the types of behavior–environment relations these stimuli may already be a part of (e.g., a reinforcing stimulus involved in positive reinforcement or negative punishment contingencies) and programming new behavior-environment relations to facilitate behavior change (e.g., differential reinforcement of alternative behavior). Stimulus preference assessments provide a method of making data-based decisions about which stimuli are likely to function as effective reinforcers for a given individual (Hagopian et al., 2004; Tullis et al., 2011). However, clinicians infrequently employ them in practice and instead rely on more informal, momentary methods of reinforcer evaluation (Graff & Karsten, 2012; Morris et al., 2023). In addition, although preference assessments indicate whether stimuli are likely to function as reinforcers, sometimes it may be useful to go beyond assessing whether stimuli are reinforcing and evaluate and quantify the degree to which stimuli are reinforcing, neutral, or aversive. For example, it may be useful to evaluate whether an individual will approach or avoid instructional contexts (Cariveau et al., 2020) and social interactions (Morris & Vollmer, 2022b) and monitor the function of these activities and interactions across time and in response to interventions. This type of evaluation could be conducted experimentally (i.e., systematic manipulation of stimuli in which the opportunity to approach and avoid are equated) or descriptively (i.e., recording of natural occurrences of stimuli and whether approach or avoidance responses occur). In either case, risk ratios can be useful to evaluate and quantify stimulus function. To use risk ratios in this way, we must record all occurrences of the activities or interactions of interest as well as instances of approach and avoidance of those activities or interactions.
Let us consider an example from assessments of sociability (e.g., Call et al., 2013; Morris & Vollmer, 2020, 2021, 2022a) conducted with children with autism spectrum disorder. Assessments of sociability provide a measure of the function of social interaction in general, which is critical to consider because indifference to or avoidance of social interaction may limit an individual’s access to reinforcers and learning opportunities. In addition, such indifference or avoidance suggests that interventions aimed at improving an individual’s ability to solicit the types of interactions that they find reinforcing may be useful (e.g., Morris & Vollmer, 2022b). We will evaluate the assessment results of three children (age: 3–12) with autism: Lance, Felicity, and Stephen. Their duration data indicated social interactions were reinforcing, neutral, and aversive, respectively, and were previously published by Morris and Vollmer (2021), but risk ratios were not included. Recent research (Morris & Vollmer, 2022a, b) has demonstrated that risk ratios are a useful addition to duration measures, so here we utilize risk ratios to quantify the degree to which approach and avoidance were more likely given a manipulation of the availability of social interaction than they were in general (i.e., unconditional on such manipulations)
Procedures
Assessments of sociability were conducted in a split-room experimental arrangement in which a room was divided in half and both sides include tables, chairs, and developmentally appropriate leisure items. A therapist was present on one side of the room (i.e., the social side) and when the participant was on that side generic, nonindividualized social interactions were delivered (e.g., descriptions of the child's behavior and environment, praise-like statements). In contrast, when the participant was on the other side of the room from the therapist (i.e., the alone side) no social interactions were available. The side on which social interaction was available was systematically manipulated within sessions (i.e., the therapist changes sides every 2 min). Three sessions were conducted with Lance and Felicity and four sessions were conducted with Stephen. During each session, the occurrence of social switches (i.e., movement to the social side), avoidant switches (i.e., movement to the alone side), and therapist movement (i.e., therapist switching sides) were recorded. All movement was defined based on the location of the participant or therapist’s feet relative to a line of tape that divided the room in half. All dependent variables were recorded in real time, with a time stamp of the second at which they occurred.
Results
Table 4 depicts the results of these observations for two participants. A total of 144 (three sessions) or 192 (four sessions) 10-s intervals of observation were included for each participant and we considered each 10-s interval an opportunity for a social or avoidant switch to occur. Thus, the number of 10-s intervals with a social or avoidant switch divided by the total number of 10-s intervals (i.e., opportunities for switching) yielded an unconditional probability of social and avoidant switching. For example, Lance switched to the social side during 43 of the 144 intervals, yielding an unconditional probability of 0.30 (43/144 = 0.30), and switched to the alone side during 37 of the 144 intervals, yielding an unconditional probability of 0.26 (37/144 = 0.26). Next, we calculated the conditional probability of each type of switching given therapist movement (i.e., the manipulation of the availability of social interaction). Given that 10-s intervals were used to calculate the unconditional probability, it was important to use 10-s intervals in the calculation of the conditional probabilities to equate opportunity for switching. We calculated the conditional probability of each type of switching given therapist movement by evaluating the probability that each type of switch occurred during the 10-s interval following therapist movement. Thus, the number of 10-s intervals in which each type of switching occurred following an instance of therapist movement divided by the total number of instances of therapist movement (i.e., 10-s intervals in which it occurred) yielded a conditional probability of social and avoidant side switching. For example, Lance switched to the social side during 7 of the 9 intervals following therapist movement, yielding a conditional probability of 0.78 (7/9 = 0.78) switched to the alone side during 1 of the 9 intervals following therapist movement, yielding a conditional probability of 0.11 (1/9 = 0.11).
Table 4.
Data for calculating risk ratios to quantify the relative likelihood or risk of social and avoidant switches following an instance of therapist movement
| Number of Intervals | Number Intervals with a Switch | Unconditional Probability | Conditional Probability | Risk Ratio | ||
|---|---|---|---|---|---|---|
| Lance | ||||||
| Social Switches | ||||||
| All | 144 | 43 | 0.30 | - | 2.60 | |
| Therapist Move | 9 | 7 | - | 0.78 | ||
| Avoidant Switches | ||||||
| All | 144 | 37 | 0.26 | - | 0.43 | |
| Therapist Move | 9 | 1 | - | 0.11 | ||
| Felicity | ||||||
| Social Switches | ||||||
| All | 144 | 57 | 0.40 | - | 1.12 | |
| Therapist Move | 9 | 4 | - | 0.44 | ||
| Avoidant Switches | ||||||
| All | 144 | 69 | 0.47 | - | 1.16 | |
| Therapist Move | 9 | 5 | - | 0.56 | ||
| Stephen | ||||||
| Social Switches | ||||||
| All | 192 | 69 | 0.36 | - | 0.23 | |
| Therapist Move | 12 | 1 | - | 0.08 | ||
| Avoidant Switches | ||||||
| All | 192 | 76 | 0.40 | - | 1.47 | |
| Therapist Move | 12 | 7 | - | 0.58 | ||
Once the unconditional and conditional probabilities were calculated for each type of switching, the risk ratios were calculated by dividing the conditional probability by the unconditional probability. Risk ratios for the effect of therapist movement on social and avoidant switches are provided in Table 4 and depicted in Fig. 5. Each risk ratio quantifies how the probability of social and avoidant switches changed given the occurrence of therapist movement. For Lance, social switches were 2.6 times as likely given therapist movement than they were in general (i.e., unconditional on therapist movement), whereas avoidant switches were 0.43 times as likely given therapist movement than they were in general. Thus, therapist movement increased the likelihood of social switches and decreased the likelihood of avoidant switches. For Felicity, social and avoidant switches were only 1.12 and 1.16 times as likely following therapist movement than they were in general, respectively. Thus, although Felicity often displayed social and avoidant switches following therapist movement, therapist movement did not influence the likelihood of switching (i.e., she was likely to switch regardless). For Stephen, social switches were 0.23 times as likely given therapist movement than they were in general, whereas avoidant switches were 1.47 times as likely given therapist movement than they were in general. Thus, therapist movement increased the likelihood of avoidant switches and decreased the likelihood of social switches.
Fig. 5.
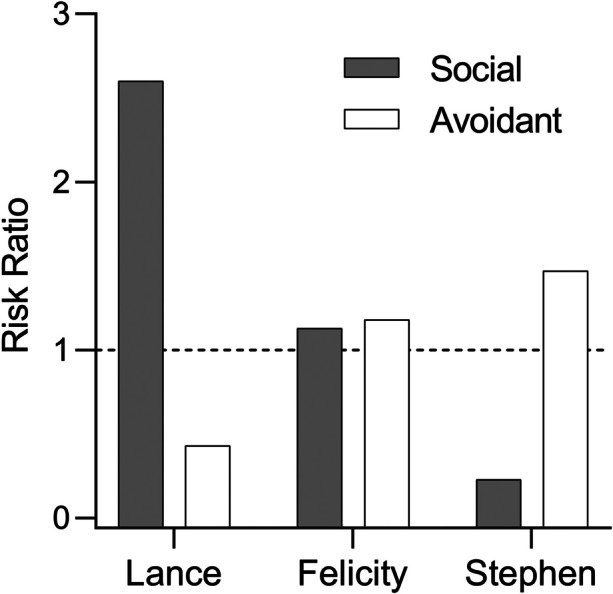
Risk ratio to quantify social and avoidant
Implications
The assessment of sociability results, as summarized by risk ratios, have important implications for characterizing the social time allocation of these participants as well as understanding mechanisms underlying the patterns of responding obtained. The risk ratio data are consistent with these participants’ duration data (see Morris & Vollmer, 2021): Lance, Felicity, and Stephen allocated about 70%, 50% and 40% of their time to the social side on average, respectively. However, risk also allow for conclusions beyond those facilitated by the duration data alone. Risk ratios much greater than one indicate that therapist movement may serve a discriminative function; participants change their behavior quickly (i.e., within 10 s) given a change in the therapist location. In contrast, risk ratios closer to one indicate that therapist movement is not discriminative for any change in participant’s behavior, but participants may still allocate their time socially or avoidantly due to contact with changes in the contingencies. Risk ratios may also elucidate the relative contributions of social interaction and other confounding variables on participant’s time allocation. The greater the risk ratio for either social or avoidant switches is than one, the more certainty we can have that the manipulation of availability of social interaction is the cause of changes in participant’s behavior. In contrast, with risk ratios closer to one, we are less certain that changes in participants’ behavior are due to the manipulation of the availability of social interaction rather than other causes (e.g., reinforcement obtained from leisure items, stereotypic responses, or movement in and of itself).
Demonstration 5: Predicting the Trajectory of Behavior
Although functional assessment and descriptive data collection can reliably indicate the current frequency of behavior and its causes, they may not be predictive of its future likelihood. Methods of predicting the trajectory of behavior over time, or behavioral forecasting, would be useful to both researchers and practitioners, particularly in environments where individuals spend long periods of time (e.g., schools, residential treatment, early intervention). In many settings, efficiently allocating resources and triaging cases are high priority tasks, but these decisions often must be made based on what little information is available such as the current frequency and severity of behavior. Further, sudden or unforeseen increases in the frequency or severity of behavior can strain resources and present difficult decisions. For example, administrators in an understaffed school district may need to decide to whether to reallocate a behavior technician from one student to another in an emergency case of sudden, severe aggression. These kinds of scenarios present clear ethical dilemmas and it would be best to avoid them.
Behavioral forecasting would be useful in preventing or curtailing the development of problem behavior, promoting the development of adaptive skills, informing decisions about treatment approaches and dosage, and improving staff and resource allocation. In this demonstration, we use risk ratios to quantify the relation between latency to the first instance and future frequency of severe aggression. In doing so, we return to the secure residential facility for juvenile offenders from Demonstration 1 to analyze the relation between latency and future frequency of aggression. This demonstration also shows the utility of analyzing existing data to inform treatment and logistics.
Procedures
In addition to the data required for the day-of-week analysis (Demonstration 1), we obtained information about each resident admitted to the facility in the past 5 years, including their date of admission, the date of their first instance of aggression, and the total frequency of their aggression during their time in the facility. First, we obtained the roster of all the residents in the facility and determined the date of their admission to the facility. Second, we accessed data on aggression going back to the earliest date of admission to obtain data for each current resident. Third, we removed all residents from the analysis who had never engaged in aggression; they would not contribute to the analysis. Fourth, we determined how many total instances of aggression each resident had engaged in during their time in the facility. Fifth, we determined when each resident’s first instance of aggression occurred and compared it to their admission date to determine the latency to aggression. These steps provided us with the information we needed to conduct the risk of habitual aggression given latency to the first instance of aggression.
In a series of analyses, we calculated the risk of residents engaging in 3 or more, 5 or more, and 10 or more instances of aggression given latencies of 7, 14, 30, or more than 30 days to their first instance of aggression. Each aggression frequency category required its own analysis. Because the calculations are similar for each, we will only walk through the analysis for risk of engaging in three or more instances. First, we categorized each student in the database by the latency to their first instance of aggression (i.e., within 7, 14, 30, or more than 30 days; these categories were selected arbitrarily). Next, we calculated the unconditional probability by dividing the total number of students who had engaged in at least three instances of aggression (hereafter referred to as “3+ Residents”; 41) by the total number of students who had engaged in any amount of aggression (hereafter referred to as “Any Aggression Residents”; 115) to get 0.36 (i.e., the probability that an Any Aggression Resident would go on to engage in three or more instances of aggression, regardless of latency; 41/115 = 0.36). Then, we calculated the conditional probabilities for each latency category by dividing the number of 3+ Residents by the number of Any Aggression Residents, with their first instance occurring within 7, 14, 30, and more than 30 days of admission to the facility. For example, to calculate the conditional probability that a student would go on to engage in three or more instances of aggression when they had engaged in their first instance within 7 days of being in the facility, we divided the number of 3+ Residents with latencies to aggression of up to 7 days by the number of Any Aggression Residents with latencies to aggression up to 7 days to get 0.6 (3/5 = 0.6). We then divided 0.6 (conditional probability) by 0.36 (unconditional probability) to get a RR of 1.67. We repeated this process for each of the remaining latency and total frequency categories. The data used for these calculations are presented in Table 5.
Table 5.
Data for calculating risk ratios to quantify the relative likelihood or risk of engaging in more than 3, 5, or 10 instances of severe aggression given the latency (days) to the first instance
| Students with any Instances | Students with More Than 3, 5, or 10 Instances | Unconditional Probability | Conditional Probability | Risk Ratio | |
|---|---|---|---|---|---|
| 3+ Instances | |||||
| Any Latency | 115 | 41 | 0.36 | - | - |
| > 30 Days | 87 | 29 | - | 0.33 | 0.93 |
| ≤ 30 Days | 28 | 12 | - | 0.43 | 1.20 |
| ≤ 14 Days | 10 | 6 | - | 0.60 | 1.68 |
| ≤ 7 Days | 5 | 3 | - | 0.60 | 1.68 |
| 5+ Instances | |||||
| Any Latency | 115 | 22 | 0.19 | - | - |
| > 30 Days | 87 | 14 | - | 0.16 | 0.84 |
| ≤ 30 Days | 28 | 8 | - | 0.29 | 1.49 |
| ≤ 14 Days | 10 | 3 | - | 0.30 | 1.57 |
| ≤ 7 Days | 5 | 3 | - | 0.60 | 3.14 |
| 10+ Instances | |||||
| Any Latency | 115 | 6 | 0.05 | - | - |
| > 30 Days | 87 | 3 | - | 0.03 | 0.66 |
| ≤ 30 Days | 28 | 3 | - | 0.11 | 2.05 |
| ≤ 14 Days | 10 | 2 | - | 0.20 | 3.83 |
| ≤ 7 Days | 5 | 2 | - | 0.40 | 7.67 |
Results
Figure 6 shows the outcome of the risk ratio analysis across each latency (i.e., 7, 14, 30, and more than 30 days) and frequency category (i.e., 3, 5, and 10 or more instances). Students with low latencies to their first instance of aggression were much more likely to engage in aggression repeatedly during their residence in the facility. As the latency to aggression decreases from more than 30 to 7 or fewer days, the risk ratio for 5 or 10 or more instances of aggression increases. The risk ratio for students who engage in aggression within 7 days of arriving at the facility and go on to engage in 5 or 10 or more instances of aggression is 3.1 and 7.7, respectively. That is, they are approximately 3 and 8 times as likely to engage in 5 or 10 or more instances of aggression than students with a latency higher than 7 days, so a latency of 7 or fewer days to the first instance of severe aggression is a substantial risk factor for habitual aggression. Students engaging in their first instance of aggression after 30 days were less likely to engage in repeated aggression for all categories, indicating that long latencies to aggression were a protective factor, particularly for higher frequencies of aggression. Across all categories, lower latencies predicted higher cumulative frequencies and higher latencies predicted lower cumulative frequencies of aggression.
Fig. 6.
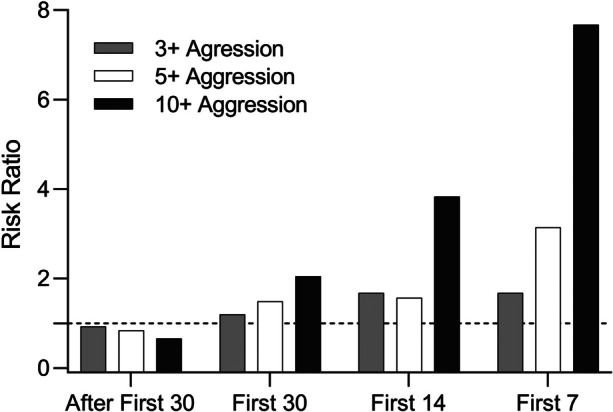
Risk ratios to quantify the relative likelihood or risk of engaging in more than 3, 5, or 10 instances of severe aggression given the latency to the first instance
Implications
These data provided facility administrators with new information about the behavioral trajectories of aggressive residents. The risk ratios provide convincing evidence that latency to the first instance of aggression can be a useful measure for predicting the likelihood for future habitual aggression. In particular, the first instance of aggression occurring within the first 7 days was identified as a risk factor for habitual aggression whereas the first instance of aggression occurring after the 30 days was identified as a protective factor for habitual aggression. These results could be used to inform preventive measures and guide resource allocation. Residents with lower latencies to aggression would likely benefit from early or preventive behavioral interventions for aggression, more intensive supervision (e.g., increased staffing ratios), and other additional supports, whereas residents with higher latencies to aggression may not require additional interventions and supports beyond those that are available for all residents because they are not likely to repeatedly aggress after their first instance. However, because aggression can be so dangerous, appropriate precautions should still be taken, as there were some students who did not follow this general pattern of behavior (e.g., a small number of residents who engaged in their first instance of aggression after 30 days went on to aggress repeatedly).
In addition to the direct implications for the facility in which this analysis was conducted, these data provide broader implications and future directions. First, similar analyses could be conducted in nearly any setting in which this type of data are available. Many facilities, like the one from the current demonstration, collect and retain large amounts of data that may be suitable for calculating risk ratios. If these data are not available, appropriate data collection systems can be put in place to allow for future analyses. For example, in a school or early intervention clinic, predictive risk ratios could be used to determine the likelihood of a student engaging in frequent elopement given a low latency to their first instance of elopement. Using this information to improve supervision ratios and refine safety protocols for these students could constitute a significant improvement in student safety. Second, these data correspond with previous research on the relationship between response latency and response rate (e.g., Thomason-Sassi et al., 2011, Traub & Vollmer, 2019), extended these analyses to a new behavior (i.e., aggression), and quantify the predictive relationship on a larger scale (i.e., to the behavior of a large number of individuals across extended periods of time), albeit without demonstrating a functional relation. Third, this demonstration illustrates the utility of risk ratios for conducting large-scale analyses of behavioral trajectories or response to treatment across many individuals. In this case we used risk ratios to forecast which individuals were likely to go on to display habitual severe aggression, but similar analyses could help predict which individuals are likely to respond to a particular behavioral treatment. These data also suggest that latency to the first instance of severe aggression may serve as a prognostic behavioral maker that, like its biomedical counterpart (e.g., Brünner, 2009; Buyse et al., 2011; Drucker & Krapfenbauer, 2013), could predict the development or trajectory of behavior in the absence of intervention. This is an important direction for future research because, unlike predictive behavioral markers (e.g., Falligant & Hagopian, 2020; Hagopian et al., 2018), prognostic behavioral markers have yet to be discussed or evaluated within the behavior analytic literature.
The ability to accurately predict the trajectory of behavior in a variety of contexts would constitute a significant advancement in ABA. Although the current demonstration is a small step in this direction, it shows that with the right data collection systems in place, large and unwieldy amounts of data can be converted into easily interpreted risk ratios that can project the future likelihood of behavior on both a small (e.g., the behavior of individuals, short-term analysis) and large scale (e.g., behavior patterns of large groups of people, analyses occurring over long periods of time). Future research could apply predictive risk ratios to explore the extent to and circumstances under which they are able to reliably predict behavior.
Conclusion
Risk ratios are a straightforward analytic tool that can aide behavior analysts in the identification and quantification of behavior–environment relations and facilitate progress toward prediction and influence of behavior. Risk ratios may benefit behavior analysts because they can enhance and simplify data analysis, facilitate dissemination, and address challenges with traditional assessment methods. We have illustrated the applicability of risk ratios by demonstrating their calculation, interpretation, and utility across diverse contexts and functions in real-world scenarios. Demonstration 1 showed that how risk ratios can be used as a preliminary investigative tool to determine days and times at which characteristics of the environment may be associated with an increase or decrease in the likelihood of target behavior. Demonstrations 2 and 3 showed how risk ratios can be used to identify potential antecedent–behavior and behavior–consequence relations that may help us to understand why behavior is occurring and inform subsequent assessment and treatment in a variety of ways. Demonstration 4 showed how risk ratios can be used to evaluate stimulus function in a way that quantifies their precise effect on behavior and supplements other common measures of stimulus function and efficacy. Demonstration 5 showed how risk ratios can be used to predict the likelihood of habitual severe aggression based on the latency to the first instance of severe aggression and inform the allocation of preventative measures and other resources.
This vast applicability is one strength of risk ratios that makes them unique among other methods of data analysis put forth in the behavior-analytic literature. To our knowledge, no single method of data analysis could be fruitfully applied across all these demonstrations. Thus, risk ratios may be a useful addition to any behavior analysts’ repertoire. Researchers and clinicians may benefit from the use of risk ratios regardless of their context, population of interest, and whether they want to identify momentary behavior–environment interactions for a given individual or improve outcomes and allocation of resources for large groups. The methods of analysis used in the current demonstrations can be applied, with little to no modification, to aid the pursuit of a myriad of research interests or clinical goals beyond those we have covered here. We hope this tutorial will stimulate the use of risk ratios to ask and answer interesting experimental questions and improve clinical practice across the diverse range of areas that make up ABA.
Funding
None
Data availability
All data generated or analyzed during this study are included in this published article
Declarations
Conflicts of interests/Competing interests
The authors of this paper have no known conflicts of interest/competing interests.
Footnotes
Publisher's Note
Springer Nature remains neutral with regard to jurisdictional claims in published maps and institutional affiliations.
References
- Anderson CM, Long ES. Use of a structured descriptive assessment methodology to identify variables affecting problem behavior. Journal of Applied Behavior Analysis. 2002;35(2):137–154. doi: 10.1901/jaba.2002.35-137. [DOI] [PMC free article] [PubMed] [Google Scholar]
- Bacotti JK, Peters KP, Vollmer TR. Parents are people too: Implementing empirically based strategies during daily interactions. Behavior Analysis in Practice. 2022;15:986–1000. doi: 10.1007/s40617-022-00686-9. [DOI] [PMC free article] [PubMed] [Google Scholar]
- Bijou SW, Peterson RF, Ault MH. A method to integrate descriptive an experimental field studies at the level of data and empirical concepts. Journal of Applied Behavior Analysis. 1968;1(2):175–191. doi: 10.1901/jaba.1968.1-175. [DOI] [PMC free article] [PubMed] [Google Scholar]
- Bloom SE, Iwata BA, Fritz JN, Roscoe EM, Carreau AB. Classroom application of trial-based functional analysis. Journal of Applied Behavior Analysis. 2011;44(1):19–31. doi: 10.1901/jaba.2011.44-19. [DOI] [PMC free article] [PubMed] [Google Scholar]
- Borrero CSW, England JD, Woods JN. A comparison of descriptive and functional analyses of inappropriate mealtime behavior. Behavior Analysis in Practice. 2016;9:364–379. doi: 10.1007/s40617-016-0149-5. [DOI] [PMC free article] [PubMed] [Google Scholar]
- Brünner N. What is the difference between “predictive and prognostic biomarkers?”. Can you give some examples. Connection. 2009;13:18. [Google Scholar]
- Buyse M, Michiels S, Sargent DJ, Grothey A, Matheson A, De Gramont A. Integrating biomarkers in clinical trials. Expert Review of Molecular Diagnostics. 2011;11(2):171–182. doi: 10.1586/erm.10.120. [DOI] [PubMed] [Google Scholar]
- Call NA, Shillingsburg MA, Bowen CN, Reavis AR, Findley AJ. Direct assessment of preferences for social interactions in children with autism. Journal of Applied Behavior Analysis. 2013;46(4):821–826. doi: 10.1002/jaba.69. [DOI] [PubMed] [Google Scholar]
- Cariveau T, Shillingsburg MA, Alamoudi A, Thompson T, Bartlett B, Gillespie S, Scahill L. A structured intervention to increase response allocation to instructional settings for children with autism spectrum disorder. Journal of Behavioral Education. 2020;29(4):699–716. doi: 10.1007/s10864-019-09340-x. [DOI] [Google Scholar]
- Cleveland WS, McGill R. Graphical perception: Theory, experimentation, and application to the development of graphical methods. Journal of the American Statistical Association. 1984;79(387):531–554. doi: 10.2307/2288400. [DOI] [Google Scholar]
- Contreras BP, Tate SA, Morris SL, Kahng S. A systematic review of the correspondence between descriptive assessment and functional analysis. Journal of Applied Behavior Analysis. 2023;56:146–165. doi: 10.1002/jaba.958. [DOI] [PubMed] [Google Scholar]
- Costello MS, Bagley RF, Fernández Bustamante L, Deochand N. Quantification of behavioral data with effect sizes and statistical significance tests. Journal of Applied Behavior Analysis. 2022;55(4):1068–1082. doi: 10.1002/jaba.938. [DOI] [PubMed] [Google Scholar]
- Cummings P. The relative merits of risk ratios and odds ratios. Archives of Pediatrics & Adolescent Medicine. 2009;163(5):438–445. doi: 10.1001/archpediatrics.2009.31. [DOI] [PubMed] [Google Scholar]
- Dallery J, Soto PL. Quantitative description of environment-behavior relations. In: Madden GJ, editor. APA handbook of behavior analysis: Methods and principles. American Psychological Association; 2013. pp. 219–249. [Google Scholar]
- Dallery J, Raiff BR, Grabinski MJ, Marsch LA. Technology-based contingency management in the treatment of substance-use disorders. Perspectives on Behavior Science. 2019;42(3):445–464. doi: 10.1007/s40614-019-00214-1. [DOI] [PMC free article] [PubMed] [Google Scholar]
- Delprato DJ, Midgley BD. Some fundamentals of BF Skinner's behaviorism. American Psychologist. 1992;47(11):1507. doi: 10.1037/0003-066X.47.11.1507. [DOI] [Google Scholar]
- Drucker E, Krapfenbauer K. Pitfalls and limitations in translation from biomarker discovery to clinical utility in predictive and personalized medicine. EPMA Journal. 2013;4:7. doi: 10.1186/1878-5085-4-7. [DOI] [PMC free article] [PubMed] [Google Scholar]
- Falligant JM, Hagopian LP. Further extensions of precision medicine to behavior analysis: A demonstration using functional communication training. Journal of Applied Behavior Analysis. 2020;53(4):1961–1981. doi: 10.1002/jaba.739. [DOI] [PMC free article] [PubMed] [Google Scholar]
- Falligant JM, McNulty MK, Hausman NL, Rooker GW. Using dual-criteria methods to supplement visual inspection: Replication and extension. Journal of Applied Behavior Analysis. 2020;53(3):1789–1798. doi: 10.1002/jaba.665. [DOI] [PubMed] [Google Scholar]
- Graff RB, Karsten AM. Assessing preferences of individuals with developmental disabilities: A survey of current practices. Behavior Analysis in Practice. 2012;5(2):37–48. doi: 10.1007/bf03391822. [DOI] [PMC free article] [PubMed] [Google Scholar]
- Hackshaw A, Morris JK, Boniface S, Tang JL, Milenković D. Low cigarette consumption and risk of coronary heart disease and stroke: Meta-analysis of 141 cohort studies in 55 study reports. BMJ. 2018;360:j5855. doi: 10.1136/bmj.j5855. [DOI] [PMC free article] [PubMed] [Google Scholar]
- Hagopian LP, Long ES, Rush KS. Preference assessment procedures for individuals with developmental disabilities. Behavior Modification. 2004;28(5):668–677. doi: 10.1177/0145445503259836. [DOI] [PubMed] [Google Scholar]
- Hagopian LP, Rooker GW, Yenokyan G. Identifying predictive behavioral markers: A demonstration using automatically reinforced self-injurious behavior. Journal of Applied Behavior Analysis. 2018;51(3):443–465. doi: 10.1002/jaba.477. [DOI] [PMC free article] [PubMed] [Google Scholar]
- Hanley GP. Functional assessment of problem behavior: Dispelling myths, overcoming implementation obstacles, and developing new lore. Behavior Analysis in Practice. 2012;5:54–72. doi: 10.1007/BF03391818. [DOI] [PMC free article] [PubMed] [Google Scholar]
- Higgins ST, Kurti AN, Davis DR. Voucher-based contingency management is efficacious but underutilized in treating addictions. Perspectives on Behavior Science. 2019;42(3):501–524. doi: 10.1007/s40614-019-00216-z. [DOI] [PMC free article] [PubMed] [Google Scholar]
- Iwata BA, Dorsey MF, Slifer KJ, Bauman KE, Richman GS. Towards a functional analysis of self-injury. Analysis & Intervention in Developmental Disabilities. 1994;2(2):3–20. doi: 10.1901/jaba.1994.27-197. [DOI] [PMC free article] [PubMed] [Google Scholar]
- Khera AV, Emdin CA, Drake I, Natarajan P, Bick AG, Cook NR, Chasman DI, Baber U, Mehran R, Rader DJ, Fuster V, Boerwinkle E, Melander O, Orho-Melander M, Ridker PM, Kathiresan S. Genetic risk, adherence to a healthy lifestyle, and coronary disease. New England Journal of Medicine. 2016;375(24):2349–2358. doi: 10.1056/NEJMoa1605086. [DOI] [PMC free article] [PubMed] [Google Scholar]
- Kranak MP, Hall SS. Implementing automated nonparametric statistical analysis on functional analysis data: A guide for practitioners and researchers. Perspectives on behavior science. 2022;45(1):53–75. doi: 10.1007/s40614-021-00290-2. [DOI] [PMC free article] [PubMed] [Google Scholar]
- Kronfli FR, Lloveras LA, Vollmer TR. Applications of the matching law to observe shifts in problem behavior: A proof-of-concept study. Behavioral Interventions. 2021;36(4):764–777. doi: 10.1002/bin.1810. [DOI] [Google Scholar]
- Morris, S. L., Conine, D. E., Slanzi, C. M., Kronfli, F. R., Etchison, H. M. (2023). A survey of whether, why, and how clinicians change reinforcers. Behavior Analysisin Practice.10.1007/s40617-023-00847-4 [DOI] [PMC free article] [PubMed]
- Morris SL, Vollmer TR. Evaluating the stability, validity, and utility of hierarchies produced by the Social Interaction Preference Assessment. Journal of Applied Behavior Analysis. 2020;53(1):522–535. doi: 10.1002/jaba.610. [DOI] [PubMed] [Google Scholar]
- Morris SL, Vollmer TR. Evaluating the function of social interaction for children with autism. Journal of Applied Behavior Analysis. 2021;54(4):1456–1467. doi: 10.1002/jaba.850. [DOI] [PubMed] [Google Scholar]
- Morris SL, Vollmer TR. Increasing social time allocation and concomitant effects on mands, item engagement, and rigid or repetitive behaviors. Journal of Applied Behavior Analysis. 2022;55(3):814–831. doi: 10.1002/jaba.919. [DOI] [PubMed] [Google Scholar]
- Morris SL, Vollmer TR. The matching law provides a quantitative description of social time allocation in children with autism. Journal of Applied Behavior Analysis. 2022;55(3):934–957. doi: 10.1002/jaba.934. [DOI] [PubMed] [Google Scholar]
- Motulsky H. Intuitive biostatistics: A non-mathematical guide to statistical thinking. 4. UK: Oxford University Press; 2018. [Google Scholar]
- National Cancer Institute. (2021) NCI dictionary of cancer terms.https://www.cancer.gov/publications/dictionaries/cancer-terms/def/risk-ratio
- Oliver AC, Pratt LA, Normand MP. A survey of functional behavior assessment methods used by behavior analysts in practice. Journal of Applied Behavior Analysis. 2015;48(4):817–829. doi: 10.1002/jaba.256. [DOI] [PubMed] [Google Scholar]
- Pence ST, Roscoe EM, Bourret JC, Ahearn WH. Relative contributions of three descriptive methods: Implications for behavioral assessment. Journal of Applied Behavior Analysis. 2009;42(2):425–446. doi: 10.1901/jaba.2009.42-425. [DOI] [PMC free article] [PubMed] [Google Scholar]
- Perez BC, Morris SL, Bacotti JK, Vollmer TR. Evaluating bowel movements, self-initiations, and problem behavior with the emergence of urinary continence. Journal of Applied Behavior Analysis. 2021;54(3):1111–1125. doi: 10.1002/jaba.837. [DOI] [PubMed] [Google Scholar]
- Petursdottir AI, Esch JW, Sautter RA, Stewart KK. Characteristics and hypothesized functions of challenging behavior in a community-based sample. Education & Training in Autism & Developmental Disabilities. 2010;45(1):81–93. [Google Scholar]
- Ranganathan P, Aggarwal R, Pramesh CS. Common pitfalls in statistical analysis: Odds versus risk. Perspectives in Clinical Research. 2015;6(4):222–224. doi: 10.4103/2229-3485.167092. [DOI] [PMC free article] [PubMed] [Google Scholar]
- Roscoe EM, Phillips KM, Kelly MA, Farber R, Dube WV. A statewide survey assessing practitioners' use and perceived utility of functional assessment. Journal of Applied Behavior Analysis. 2015;48(4):830–844. doi: 10.1002/jaba.259. [DOI] [PMC free article] [PubMed] [Google Scholar]
- Senn CY, Eliasziw M, Barata PC, Thurston WE, Newby-Clark IR, Radtke HL, Hobden KL. Efficacy of a sexual assault resistance program for university women. New England Journal of Medicine. 2015;372(24):2326–2335. doi: 10.1056/NEJMsa1411131. [DOI] [PubMed] [Google Scholar]
- Skinner BF. Science and human behavior. Macmillan; 1953. [Google Scholar]
- Skinner BF. Cumulative record. Appleton-Century-Crofts; 1972. [Google Scholar]
- Tenny S, Hoffman MR. Relative risk. StatPearls; 2022. [PubMed] [Google Scholar]
- Thomason-Sassi JL, Iwata BA, Neidert PL, Roscoe EM. Response latency as an index of response strength during functional analyses of problem behavior. Journal of Applied Behavior Analysis. 2011;44(1):51–67. doi: 10.1901/jaba.2011.44-51. [DOI] [PMC free article] [PubMed] [Google Scholar]
- Thompson RH, Iwata BA. A descriptive analysis of social consequences following problem behavior. Journal of Applied Behavior Analysis. 2001;34(2):169–178. doi: 10.1901/jaba.2001.34-169. [DOI] [PMC free article] [PubMed] [Google Scholar]
- Traub MR, Vollmer TR. Response latency as a measure of behavior in the assessment of elopement. Journal of Applied Behavior Analysis. 2019;52(2):422–438. doi: 10.1002/jaba.541. [DOI] [PubMed] [Google Scholar]
- Tullis CA, Cannella-Malone HI, Basbigill AR, Yeager A, Fleming CV, Payne D, Wu P-F. Review of the Choice and preference assessment literature for individuals with severe to profound disabilities. Education & Training in Autism & Developmental Disabilities. 2011;46(4):576–595. [Google Scholar]
- Vollmer TR, Peters KP, Kronfli FR, Lloveras LA, Ibañez VF. On the definition of differential reinforcement of alternative behavior. Journal of Applied Behavior Analysis. 2020;53(3):1299–1303. doi: 10.1002/jaba.701. [DOI] [PubMed] [Google Scholar]
Associated Data
This section collects any data citations, data availability statements, or supplementary materials included in this article.
Data Availability Statement
All data generated or analyzed during this study are included in this published article