Abstract
Geographic distribution patterns of board certified behavior analysts may be useful in analyzing the growth of the field. First, we present an international snapshot of Behavior Analyst Certification Board (BACB) certificants, then analyze relative growth rates between countries from 1999 to 2019. This is followed by an in depth review of certificant distribution patterns in the United States and Canada, as well as the ratios of experienced behavior analysts to new certificants. These data highlight regions with a potential deficit of qualified supervisors. There are factors that influence different dispersal patterns, and without drilling deeper into the data we may be unable to effectively identify or influence them in order meet the specific needs of a geographic region.
Supplementary Information
The online version contains supplementary material available at 10.1007/s40614-023-00370-5.
Keywords: Autism spectrum disorder, Big data, BACB certification, Legislative reform, Policy analysis, Supervision, Cultural diversity
There is a long history of using geo-coded data to provide insight into how humans interact with their environment. For example, John Snow’s 1854 mapping of cholera outbreaks was a catalyst for modern day epidemiology (Cameron & Jones, 1983). Depending on our levels of analyses relevant patterns may not be accessible or functionally relevant. This is especially the case when relying on aggregated data or statistical analyses alone without accompanying visual displays. Anscombe’s (1973) quartet demonstrated distinct graphical distributions (all telling different stories) can have identical means, modes, medians, regression lines, and correlations (see Murray & Wilson, 2021, for additional examples). Visually graphing data rather than relying solely on summary statistics is something the field of behavior analysis highly values, and it is one of the reasons why we can, and should be, involved in the analysis of big data sets, especially those that relate to the future success of the field.
Over the last 2 decades applied behavior analysis (ABA) inspired services have expanded rapidly in the United States, Canada, and the United Kingdom (UK). Understanding this growth may help predict and influence “growing pains” over the upcoming years. This service expansion is likely the result of many factors, but two highly influential ones are: (1) the public’s increased awareness of evidenced-based practices; and (2) insurance reform and related legislature regarding service for autism spectrum disorder (ASD) in the United States. There is often a delay to legislature enactment having a direct impact on behavioral services, and there are differences in how each state deploys its insurance mandates (Deochand & Fuqua, 2016; Yingling et al., 2021a).
The availability and quality of ABA service delivery is likely related in part to the number of credentialed behavior analysts by the Behavior Analyst Certification Board (BACB). The growth in the number of BACB certificants1 has been well-documented (Deochand & Fuqua, 2016; Johnston et al., 2017; Shook 2005; Shook & Favell, 2008). In 2019, there were 41,903 BACB1 certificants (BCBA-D, BCBA, and BCaBA practitioners), and at the end of 2020 there were roughly 48,754 certificants (BACB, 2019a). These figures have surpassed Deochand and Fuqua’s (2016) polynomial projection of 42,000 certificants by mid-2020, but are well below exponential projections of 60,000. The projected growth pattern for BACB certificants might fit an angled S-shaped curve (where early slower growth is followed by rapid growth, and then tempered future growth). The professional practice of ABA could be in “honeymoon period” of rapid growth that may only decelerate when ABA meets the service needs of its existing client demand. Unfortunately, without sufficient data our best guess on capacity of behavioral services relies on comparable service professionals.
Speech pathology, with a similar entry-level masters certification and credentialing process, has over 100,000 speech language pathologists in the United States and is projected to have a 29% increase from 2020 to 2030 (Bureau of Labor Statistics, 2020). The BACB was founded in 1998 and ensures quality assurance standards while facilitating the growth of ABA. Other service professions have had an earlier start in the credentialing process which is probably why the public may have only learned relatively recently about a potential career path in ABA. This might explain the 4,209% increase in certifications of BCBAs and BCBA-Ds from 2010 to 2020 (BACB, 2021). The last 12 years, 2010 to 2021, the growth in demand for these certifications increased by 5,852%. This rapid increase in the number of BACB certificants is likely caused by vacuum from unfulfilled demand of behavioral services in addition to increased demand from a growing world population. Many high population areas also have a high number of credentialed behavior analysts. For 2020, 47% of demand, assessed from job postings, originated from the following five states: California, Massachusetts, Texas, Florida, and Georgia (BACB, 2021). More than a fifth of job postings emanated from California, yet only about 14% of all BACB certificants lived there in 2019. Deochand and Fuqua (2016) reviewed purported reasons to account for differences in patterns of growth for the United States (e.g., being an early adopter of insurance, education and license reform, number of institutions with verified course sequences).
Growth of the field of ABA has often been examined using the proxy of BACB certificant growth. There are other metrics to indicate that the field is prospering such as: increases in affiliate membership to professional organizations, demands for tools and services from certificants and other ABA practitioners, and increased output of research to support the field. Many of these are likely correlate with one another. For example, BACB certificant growth does correspond with increases in conference and membership attendance, which is also a litmus test for the healthy growth of the professional practice of ABA, as are the diversity of topics covered at these conferences (Kangas & Vaidya, 2007). Data suggest a continued growth of certified behavior analysts, who represent the vanguard in delivering ABA therapy and interventions. A relatively minor change enacted by the BACB, making the certification exam dates flexible, has reduced the previously seen step pattern growth caused by specified testing cycles, resulting in a steady flow of certificants.
Overall growth is an important analysis, and so is drilling down regionally. Researchers have examined geo-coded BACB certificant data at the county level in the United States (Yingling et al., 2021a; Yingling et al., 2021b; Yingling et al., 2022). These efforts allow for an examination of ABA service availability as well as more nuanced recommendations. The growing demand for BACB certificants in the United States has been offered in BACB white paper reports (Burning Glass Technologies, 2015; BACB 2018a, 2019b, 2020b, 2021, 2022). These papers have used online advertising in the United States per each state for BCBA-D, BCBA, and BCaBA job postings as a means to assess demand for each certification. The benefit of this method is that it allows a review of the job demand by different market forces (e.g., health-care settings, behavioral gerontology, school settings). The caveat to this method is that states with fewer job postings might still have a high demand for BACB certificants, but may not have adequate state or private sector support, and other unrealized demand factors. This consideration is especially relevant for emerging nations, and some underserved states in the United States, who are in the process of recognizing the need for ABA therapy delivered from a competent practitioner. Unrealized demand for behavioral services could also be the result of clients being unaware, and/or misinformed about ABA services, undiagnosed, or being located in an area with fewer behavioral providers and/or no infrastructure for ABA. Another option for estimating demand used by Deochand and Fuqua (2016) that potentially captures unrealized demand (those unaware or unable to access ABA services) for ABA services is to use population size as a proxy for demand. Other researchers have focused on linking ABA specifically in the service of ASD using prevalence data (Yingling et al., 2022). However, data suggesting that prevalence rates for ASD are higher across higher SES groups could be the result of access to diagnostic screening, ASD awareness, cultural considerations for behavioral challenges, and other social determinants (Newschaffer, 2017). It is possible an area may have fewer ASD diagnoses but demand for behavioral services exists. Using location specific population sizes prevents us from ignoring those locations that do not have available funds or infrastructure to attract needed number BACB certificants to serve their population.
As the number of certificants rose in the United States, so too did the number of universities offering verified course sequences (Shook & Favell, 2008). In the United States, those states that have the highest numbers of certificants generally have more institutions offering a verified course sequence (VCS) to students on their path to becoming credentialed, despite the growing number of online university programs (Deochand & Fuqua, 2016). And these VCS locations with a large number of BACB certificants are around high-density cities even in states with overall fewer certificants than other states. Perhaps this relates to the academic terrain of where the majority of universities with VCSs were originally established, and their partnerships with the community that lead to establishing more locations for behavior analytic practice. BACB certificant data does not reflect the original location where an individual was certified, but rather the current location the BACB certificant has moved to practice behavior analysis (Deochand & Fuqua, 2016), and this presents a barrier when analyzing the movement of BACB certificants over time (i.e., we know little about the movement of certificants from state to state).
A factor that contributed to growth in the United States is a strong political advocacy and support system for people living with ASD and intellectual and developmental disabilities. In particular, there have been large-scale advocacy campaigns in the United States to promote awareness and the dissemination of ABA evidenced-based practices, as well as connecting individuals to services and funding (American Academy of Pediatrics, 2021; Bellando et al., 2016;). Agencies like Autism Speaks have been instrumental in the passage of insurance reform to cover behavioral services (McBain et al., 2020). This level of support and effective triage to attain behavioral care is much less, or nonexistent, in some low- to middle-income nations (Wallace et al., 2012). The national standards project released two systematic reviews in 2009 and 2015 (phase 3 underway), these as well as the National Clearinghouse on Autism Evidence and Practice all found a majority of the interventions producing beneficial outcomes were grounded in the behavioral literature (NAC, 2009; 2015; Steinbrenner et al., 2020). Carr and Nosik (2017) noted that educational and insurance reforms that established funds for behavioral services precipitated the field’s growth, along with license reform conferring additional protections and regulation for behavioral practice. It is unsurprising that over 70% of BACB certificants report that they primarily provide services to clients with a diagnosis of ASD (BACB, n.d.), and many who report working in schools or in higher education may work with clients with ASD, as well.
Shook and Favell (2008) provided the first glimpse into the development of the field on the international scale. At the time of their analysis there were approximately 20–30 BCBAs outside of the United States, whereas in 2019 there were 801 BCBAs in Europe alone (Martin & Carr, 2019). BACB certificant numbers are still the highest in the United States. Even countries with relatively larger populations, like Russia, India, China—and the sum of African and European nations—only account for 9.8% of the total certificants (Martin & Carr, 2019). Effective January 1, 2023 only residents of the United States, Canada, Australia, and the UK will be allowed to apply for the certification exam to become a BCBA-D, BCBA, or BCaBA. It should be noted that the BACB will support those who received their certification and reside abroad prior to January 1, 2023. Regardless of our borders, it is an ethical mandate to ensure ABA therapies reach broader populations including culturally and linguistically diverse learners (Deochand & Costello, 2022; Kauffman et al., 2008). An international snapshot allows us to investigate whether “evangelists” outside the United States contribute to establishing credentialing bodies to govern ABA quality assurance in their countries. We collected and presented worldwide certificant growth data for this article, although much of our analysis focuses on the United States and Canada, because these were initially the only two countries that would remain included in the purview of the Behavior Analysis Certification Board. Both countries are far along in the growth of the field compared to other countries, so lessons can be taken from these particular data sets as growth continues across the globe. This article provides county-level distributions of BACB certificants for selected states in the United States and identifies locations where certificants are clustering in high populace regions, or where they are more evenly distributed. Finally, we review the ratios of BACB certificants with 5 or more years postcertification experience to those more newly certified as a means to assess deficits of potential supervisors in a state.
Worldwide Distributions of BACB Certificants
Method
Dependent Measures
The frequency of BACB certificants holding any BCBA-D, BCBA, or BCaBA certificate in each nation was gathered. BACB certificants ignores counts of registered behavior technicians (RBTs), because these data are different than the other categories. This information was accessed from the BACB certificant database on June 25, 2019.
Data Collection and Design
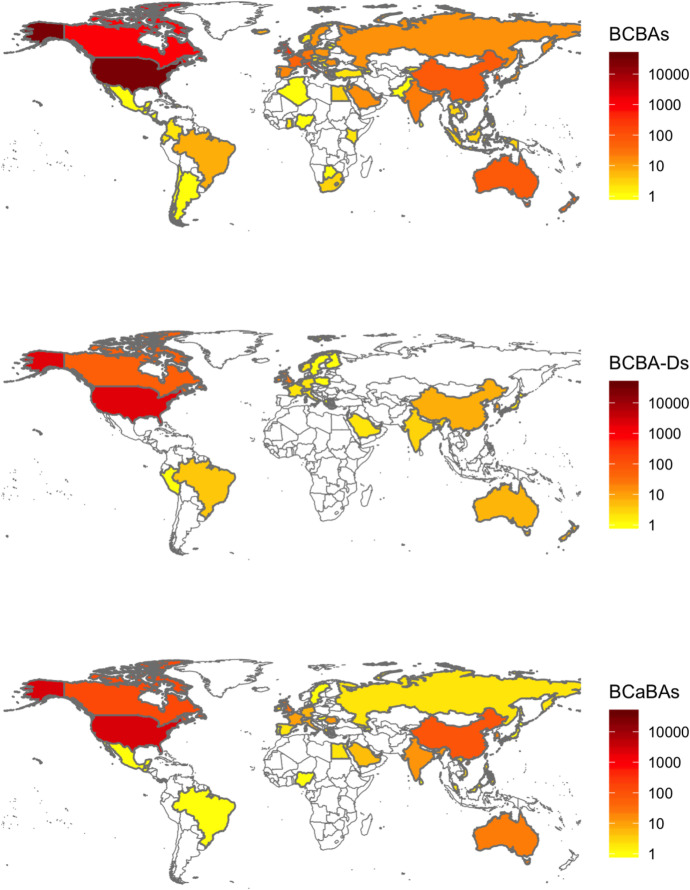
Data collection of certificants from 1999 to 2019 was automated with custom python (Python Core Team, 2019) web scraping functions that copied the HTML output of relevant data requested into comma-separated-value (CSV) files. This code is unable to scrape from websites with a security CAPTCHA, which now exists on the BACB website. We then used the R data programming language (R Core Team, 2019) to generate geographic plots with this information. To do this, we used the R ggplot2 map_data() function (Wickham, 2016) to draw the boundaries of each nation worldwide. For further technical details about our data collection procedure, please contact the first author. Each nation was filled with a color dependent on the number of BACB certificants that were observed; white equaled none, yellow equaled at least one, dark red was more than 1,000 certificants, and anywhere in-between was a gradient according to a logarithmic heatmap scale. Our data and code can be accessed at our online repository: https://osf.io/hmgjt/.
Results
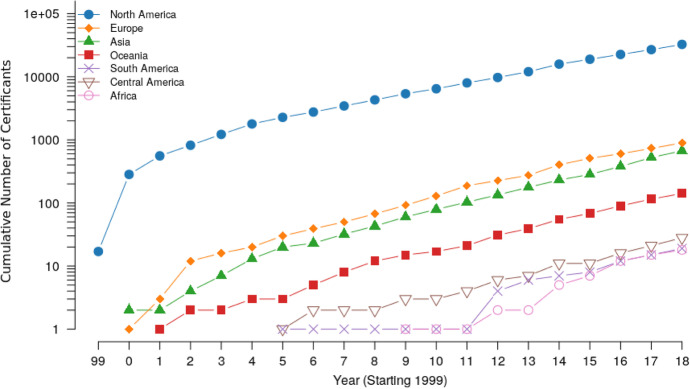
Figure 1 displays a snapshot of the international distribution of BACB certificants. Figure 2 displays the cumulative number of certificants across continents from 1999 to 2018. The percent of change year-over-year from 2017 to 2018 is as follows: North America with 21.2%, Europe with 22.6%, Oceania with 22.6%, Asia with 28.1%, Africa with 20%, South America with 26.7%, and Central America with 33.3%. The first three data points for North America and Europe had a more rapid increase prior to leveling out compared to other continents. Early adoption from the UK potentially led to this pattern. There appears to be a “tipping point” for observing a consistent year-over-year rate-of-change. For example, South America in 2012 and Africa in 2014 started to match the trajectory of a relative healthy growth trend. In other words, there is a celeration after a tipping point is reached in many of the continents. In Africa, Central America, and Eastern Europe BCBA certifications appear to establish before BCBA-Ds. The timing of this tipping point might influence a region’s ability to form a centralized equivalent credentialing body to certify behavioral providers. This is of particular relevance for those countries requesting assistance from the BACB, because this assistance should be weighted based on developing needs. Microsoft Power Maps allows plotting 3D geo-coded data, and add different levels of data slicing using a layer feature. Previously Deochand and Fuqua (2016) presented only annual U.S. state BACB certificant data using Excel’s power map add in. It is feasible to drill down to specific county locations within a state and present month-by-month BACB certificant growth throughout the world from 1999 to mid-2019 (see a video demonstration here: https://www.youtube.com/watch?v=QIWEfz9XeGk). 3D visualizations can be deceptive using only one perspective, so different angles were offered around the globe to assist with a general and rapid overview of this large data set. While watching using Youtube’s settings button the playback speed can be altered to help slow down or speed up the month to month changes in certificant numbers.
Fig. 1.
A Choropleth of the International Distribution of BACB certificants mid-2019
Fig. 2.
The cumulative number of BACB® certificants by region between between 1999 and 2018
Predicting Density of BACB Certificants in Counties or Provinces in the United States and Canada
The United States and Canada (with just over 92.5% of all BACB certificants) are suitable models to discuss growth distribution patterns in relation to geographic population and VCS locations for its counties and provinces. In addition, their longer standing policy enactments have established legislative efforts to expand behavioral services under the umbrella of medical necessity. It was not feasible, and moreover it could be misleading, to present international data at the granular level while trying to make reasonable comparisons without an understanding of how towns, counties, provinces, municipalities, or other place locations organize and effect regulation of their behavioral services. We can learn from existing growth trends of BACB certificants for the established regions, the United States, and Canada, with the hopes of providing information that could be used by the international community regarding how to equitably scale the field to meet the needs of all in a region’s population.
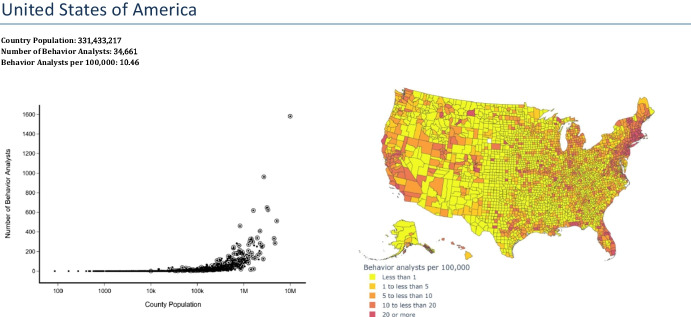
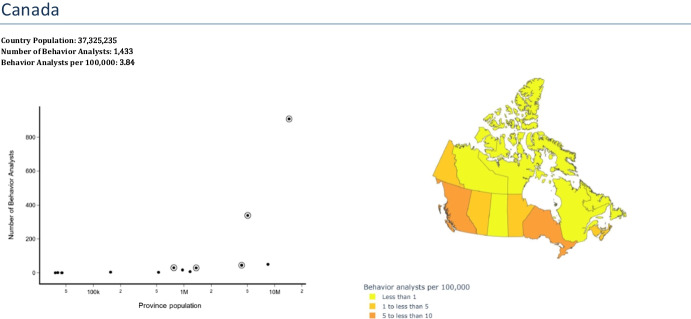
Using BACB certificants in relation to population size within a region could capture demand for ABA services that do not appear from a job posting analysis. Figure 3 displays U.S. data by county using a graduated heat scale based on number of BACB certificants per 100,000 of the population, along with a plot of BACB certificants to county population. Figure 4 presents Canada and its provinces. The encircled data points in Fig. 3 and 4 reflect a county or province with a higher education institution offering a VCS. The heat map in Fig. 3 highlights locations where there is a higher density of behavior analysts in the United States, and they are generally situated in more populace locations even if it does not have a VCS institution. In Fig. 4 the presence of a VCS appears to correlate with more total BACB certificants in a province.
Fig. 3.
County level dispersal of BACB certificants per population and heat map
Fig. 4.
Province level dispersal of BACB certificants per population and heat map
To deeper analyze these preliminary visual findings we used hierarchical generalized mixed modeling to examine the effects of population and number of VCSs on the density of behavior analysts.
Method
Dependent Measures
The same data set were used as in the previous analysis except the data were filtered by the county or province level. In addition, VCS locations were gathered from the Association for Behavior Analysis International website. To evaluate the distribution of certificants within each state, population densities for each county were gathered from the U.S. Census Bureau (2019). Likewise, relevant province level population data was gathered from census reports for Canada (Statistics Canada, 2019).
Data Collection and Design
The large range in population across counties, the different legislations across states, and the correlation between our predictor variables (i.e., multicollinearity) presented unique challenges for the analysis of the U.S. county-level data. To address these issues, we used hierarchical generalized mixed modeling to examine the effects of population and number of VCSs on the density of behavior analysts per county. Our analyses involved the use of a negative binomial regression to control for the large number of counties that included no behavior analysts (i.e., density of zero).
As part of our hierarchy, we tested five models. The first model evaluated in our hierarchical approach involved one fixed effect, the log of the population, and one random effect, the intercept for state. The addition of this random effect is designed to provide control over state-level variables (e.g., laws, policies, size, proximity to other states) that may have an impact on the density of behavior analysts. The second model added the VCS as a predictor. The subsequent models involved adding random effects slopes in relation to state for the log of population, the number of VCSs, and both. To select the best model, our analyses identified the model with the lowest value for the Akaike information criterion (AIC). To examine whether these patterns remained consistent at the state level, we graphed the fitted values of our best model (y-axis) with the log of the population (x-axis) while representing the number of VCSs with points of different shades.
The Canadian dataset did not present the same challenges as the one for the United States. The data were aggregated at the province level (rather than county level), which precluded the addition of random effects to control for legislation. Furthermore, the number of provinces and territories with no behavior analysts was low. That said, multicollinearity between the population and number of VCSs remained an issue. Hence, we used hierarchical linear modeling to examine the effects of both variables on the density of behavior analysts per province and territory. The first model involved using the log of the population as a predictor whereas the second model added the number of VCSs. To compare the models, we examined whether the addition of the VCS variable significantly increased the variance explained by the model as well as the p values of the coefficients. For more details about our analyses and parameters, both the code and data are freely available in an online repository at: https://osf.io/hmgjt/.
Results
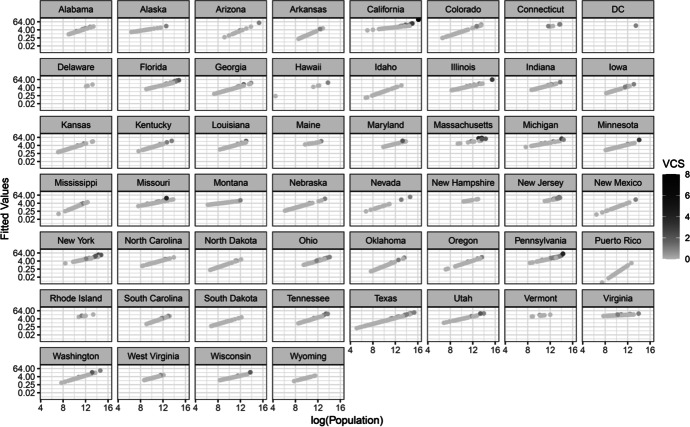
Table 1 shows the results of our hierarchical generalized mixed models for the U.S. data. We present the three most relevant models, including the one with best fit. The other models are available by running the code in the online repository. The first model only included the log of the population as a predictor (i.e., fixed effects) while controlling for the state-level factor (i.e., random effects). The estimate of the predictor was statistically significant (β = 0.50, z = 19.00, p < .0001). The second model added the number of VCSs in the county as a predictor. The estimate of the VCS predictor was nonsignificant (β = 0.20, z = 1.88, p =.0603) whereas the log of population remained statistically significant (β = 0.47, z = 16.78, p < .0001). The AIC marginally decreased with this more complex model (p = .0505). The third model was the one that provided the best fit for the data. This model added a slope for the log of population in the random effects for state. Both the log of population (β = 0.51, z = 10.86, p < .0001) and the number of VCSs (β = 0.22, z = 2.15, p = .0317) were statistically significant in this model. Moreover, this model significantly improved the value of the AIC (p < .0001). Taken together, these results support a strong relationship between population and the density of behavior analysts, and a marginal relationship between the number of VCSs and density. Figure 5 presents the fitted values of the third model according to the log of the population and the number of VCSs across the counties of each state. The patterns show that the relationship between population and density typically persisted at the state level. Furthermore, the graphs also depict a marginal positive effect of VCSs on the density of behavior analysts in multiple states.
Table 1.
Hierarchical Generalized Mixed Models for Predicting the Density of Behavior Analysts Per County in the United States
| Model 1 | |||
|
Fixed Effects Intercept log(population) |
Estimate (SE) -4.07(0.30) 0.50(0.03) |
z value -13.45 19.00 |
p value < .0001 < .0001 |
| Random Effects (State) Intercept |
Variance (SD) 0.67 (0.82) |
||
|
AIC 13686 |
p value - |
||
| Model 2 | |||
| Fixed Effects | Estimate (SE) | z value | p value |
| Intercept | -3.86 (0.32) | -12.08 | < .0001 |
| log(population) | 0.47 (0.03) | 16.78 | < .0001 |
| VCS | 0.20 (0.11) | 1.88 | .0603 |
| Random Effects (State) | Variance (SD) | ||
| Intercept | 0.66 (0.81) | ||
| AIC | p value | ||
| 13685 | .0505 | ||
| Model 3 | |||
| Fixed Effects | Estimate (SE) | z value | p value |
| Intercept | -4.20 (0.32) | -7.24 | < .0001 |
| log(population) | 0.51 (0.05) | 10.86 | < .0001 |
| VCS | 0.22 (0.10) | 2.15 | .0317 |
| Random Effects (State) | Variance (SD) | ||
| Intercept | 10.09 (3.18) | ||
| Slope - log(population) | 0.05 (0.23) | ||
| AIC | p value | ||
| 13650 | < .0001 | ||
Note. VCS: Number of verified course sequences, AIC: Akaike Information Criterion
Fig. 5.
Graphs of Fitted Values for Each County Given the Log of the Population and the Number of VCSs for Each State. Note. VCS Number of verified course sequences
Table 2 presents the results of hierarchical linear modeling for predicting the density of behavior analysts across provinces and territories. The first model, which included a single predictor (i.e., log of population), had a nonsignificant coefficient (β = 0.52, t = 1.81, p = .0982). The overall model also failed to achieve statistical significance (adjusted R2 = .16, F(1, 11) = 3.27, p = . 0982). The second model added the number of VCSs as a predictor. This addition made the second model significant overall (adjusted R2 = .53, F(2, 10) = 7.71, p = .0094). The coefficient for the VCS was identified as a statistically significant predictor of density (β = 0.75, t = 3.10, p < .0113) whereas the log of population remained nonsignificant (β = 0.04, t = 0.16, p = .8776). A comparison of the two models indicated that the addition of the number of the VCSs significantly improved the amount of variance explained (F(1, 10) = 9.60, p = .0112). In contrast with what we observed for the United States, our results suggest that the number of VCSs, but not population, was a predictor of the density of behavior analysts in Canada.
Table 2.
Hierarchical Linear Models for Predicting the Density of Behavior Analysts per Province or Territory in the Canada
| Model 1 | ||||||
|
Coefficients Intercept |
Estimate (SE) -4.85 (3.94) |
t value -1.23 |
p value .2443 |
|||
| log(population) | 0.52 (0.28) | 1.81 | .0982 | |||
| F-statistic |
F value 3.27 |
df (1, 11) |
p value .0982 |
|||
|
Adjusted R2 .1588 |
||||||
| Model 2 | ||||||
| Coefficients | Estimate (SE) | t value | p value | |||
| Intercept | 0.83 (3.48) | 0.24 | .8160 | |||
| log(population) | 0.04 (0.27) | 0.16 | .8776 | |||
| VCS | 0.75 (0.24) | 3.10 | .0113 | |||
| F value | df | p value | ||||
| F-statistic | 7.71 | (2, 10) | .0094 | |||
|
Adjusted R2 .5279 |
||||||
| Model Comparison | Residual df | Residual SS | df | SS | F | p value |
| Model 1 | 11 | 45.65 | ||||
| Model 2 | 10 | 23.29 | 1 | 22.36 | 9.60 | .0112 |
Note. VCS: Number of verified course sequences, AIC: Akaike Information Criterion
When examining differences between the United States and Canada, it is safe to assume the stage of growth a location finds itself could influence its dispersal and density patterns at the county and province level. For example, early in a country’s growth, an established VCS in a location will accelerate numbers of BACB certificants more rapidly and potentially have more of an influence on BACB certificant numbers. Whereas later, as more certificants emerge they may move to other locations with higher populations and a location’s population size will potentially predict a larger density of BACB certificants, perhaps driven by market forces.
In Figure 6, the graph on the left depicts the stages of growth within a sigmoid function typical where growth accelerates slower at the beginning and end of the function. At A there is a gradual build up which shifts toward a rapid scaling in B, and again shifting toward reaching a service capacity at C. In Figure 6 the square marker depicts mid-size region populations being served by a higher numbers of BACB certificants. This is an unlikely pattern as often there is more resource allocation for locations with larger populations, but it is possible if those locations are more easily able to effect changes that scale up behavioral services. One of the predictors for access to BACB certificants has been a higher ratio of health insurance coverage for a county population (Yingling et al., 2021a). States that have policies that encourage wider access to health-care insurance coverage, and or options for uninsured parties might also have higher per capita ratios of BACB certificants to their region’s population. The dashed line depicts constant scaling that only decreases when the service ratio of BACB certificants to the populace is met. If we find ourselves at point B, the county population pattern represented by the circle marker is the most likely density projection that fits our current stage of growth is where scaling occurs rapidly at a tipping point for mid-size to larger county population rather than for smaller county populations. Without reviewing county level data, a state or a province could appear to be well-served by the aggregated region data, but there could be underserved locations. As an alternative, BACB certificants could disperse more evenly in particular region within a state or province that lead to more widespread access to needed behavioral services even if there appears to be a low overall density of BACB certificants to the entire state or province population. It has been noted that rural counties often face access issues to behavioral services, but it is hoped that telehealth options will decrease some of these access issues (Yingling et al., 2021a).
Fig. 6.
Sigmoid function for cumulative no. of BACB certificants and hypothetical projections for BACB certificants per county population
In the next analysis, we examined certificant location with interest in county distribution and proximity to training programs in the United States. We examined whether certificants saturate in counties with specific population sizes, or if certificants in counties appear to grow concordantly relative to population. To that end, we created state–county heat maps and plots of county BACB certificant data in relation to population size.
County Density and Dispersal of BACB Certificants in the United States
Method
Dependent Measures and Eligibility Criteria
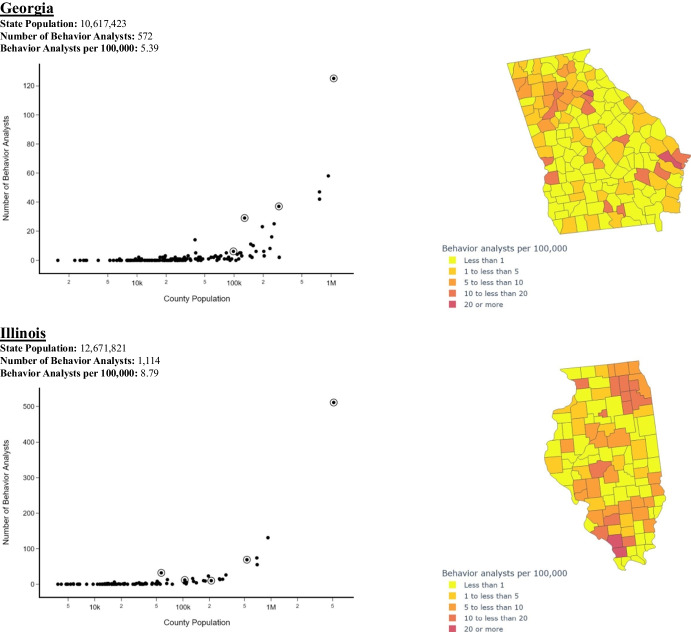
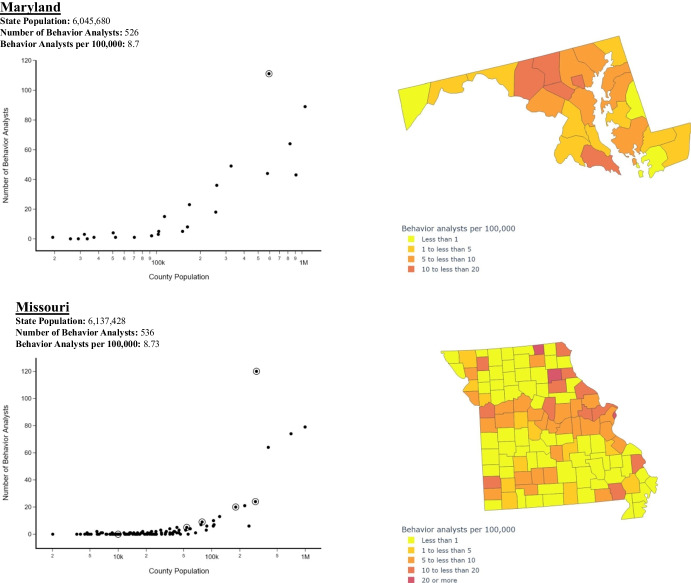
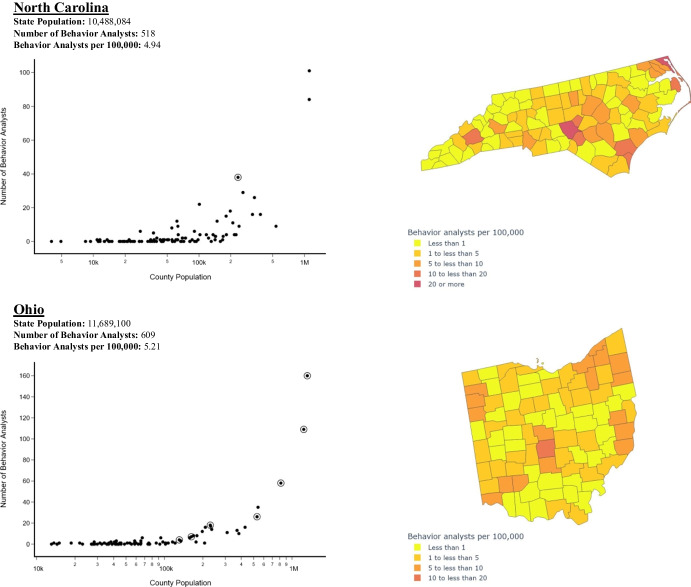
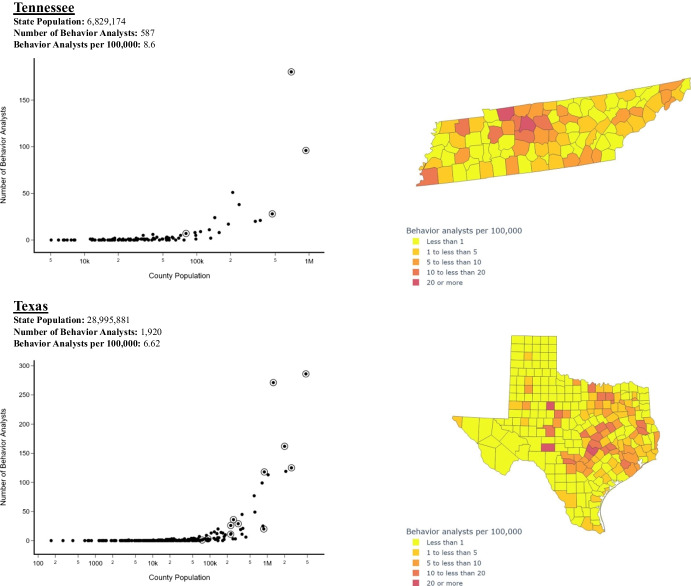
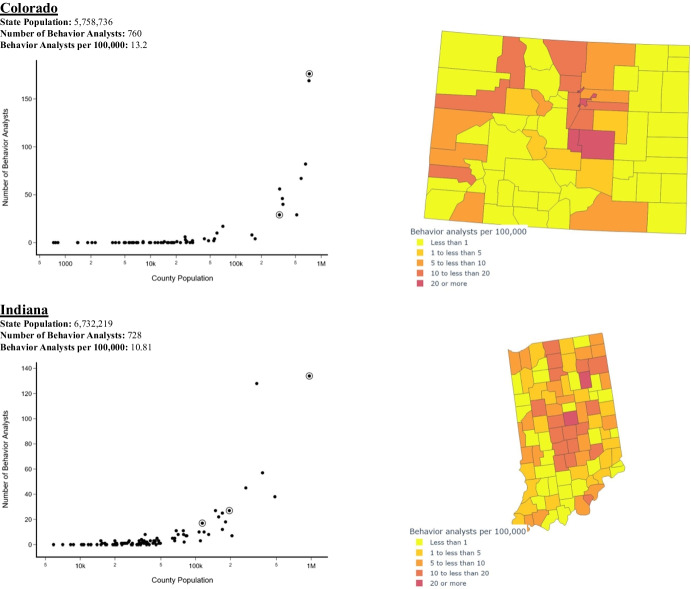
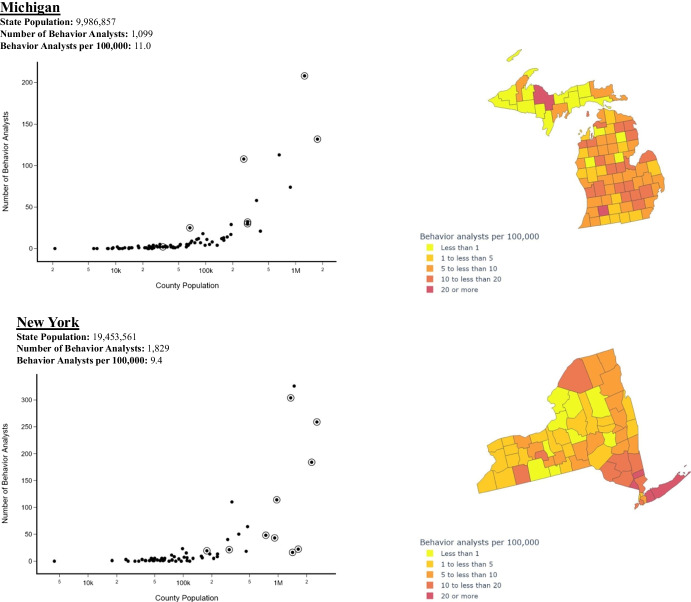
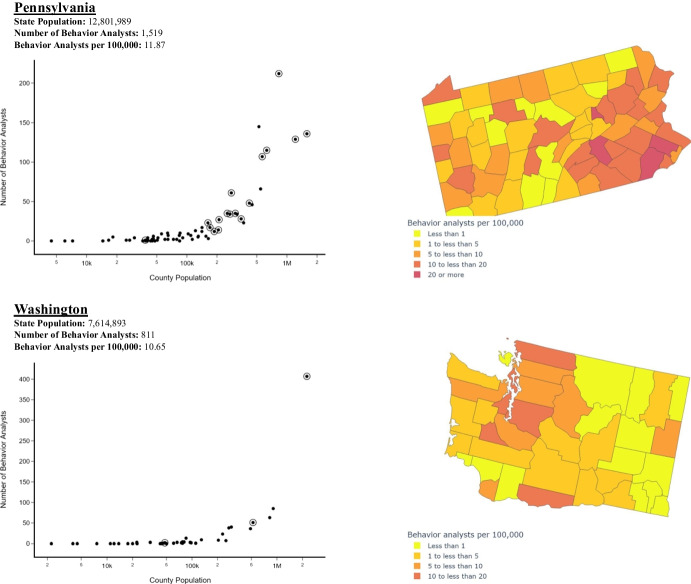
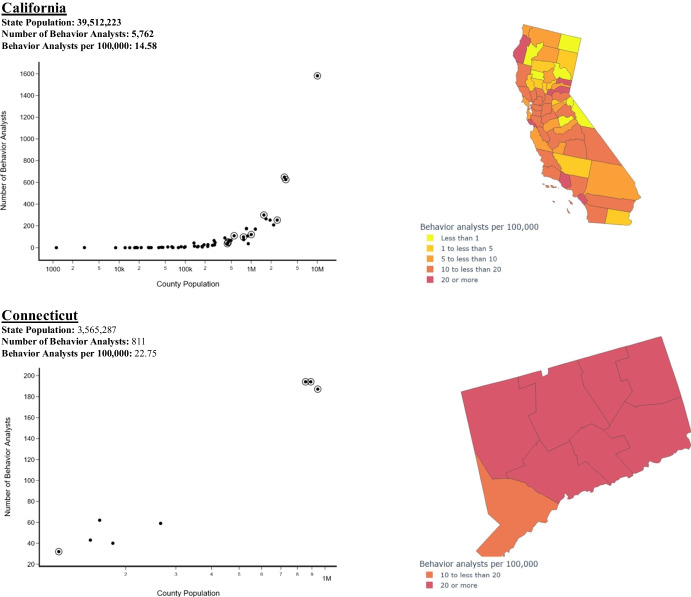
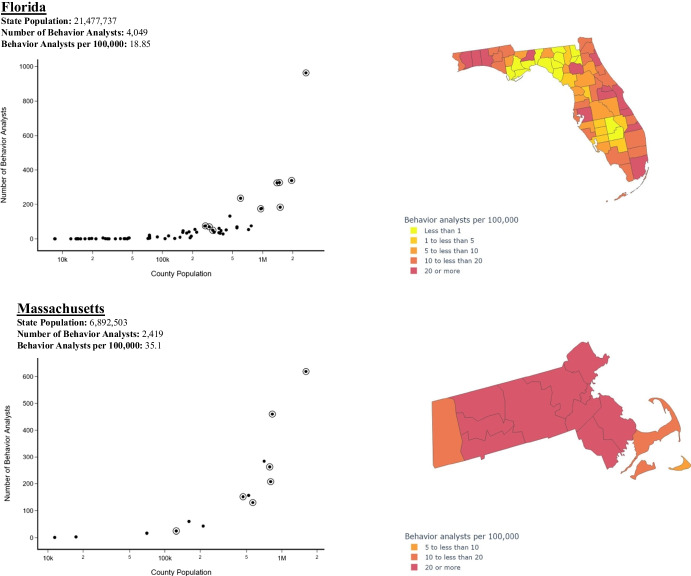
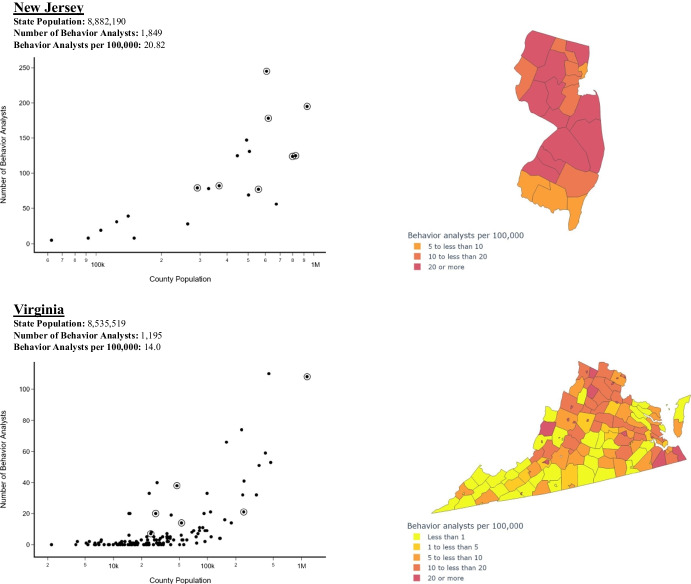
We divided states into overall high, medium, and low density of BACB certificants to its population. To be included in this analysis, a state had at least 500 BACB certificants to filter those states with low dispersal resulting from too few BACB certificants. For example, states like Wyoming and the Dakotas, which technically have the lowest density and dispersal patterns, were excluded as a result of their low total number of BACB certificants. Some excluded states did in fact have high ratios of certificants to their state populations (Hawaii, Maine, Nevada, New Hampshire, Rhode Island, Vermont, and Utah) as a result of this criterion, but the majority lacked enough certificants to discuss dispersal patterns as a factor of anything but low total certificant numbers. Figure 7 depicts low density (lower than 9 per 100,000) states: Georgia, Illinois, Maryland, Missouri, North Carolina, Ohio, Tennessee, and Texas. Figure 8 depicts the medium density (9–14 per 100,000) states: Colorado, Indiana, Michigan, New York, Pennsylvania, and Washington. Figure 9 depicts high density (greater than 14 per 100,000) states: California, Connecticut, Florida, Massachusetts, New Jersey, and Virginia. We encourage readers to review the entirety of the state data in the supplemental materials.
Fig. 7.
Dispersal plots and heat maps for states with overall lower density of BACB certificants per state population
Fig. 8.
Dispersal plots and heat maps for states with overall medium density of BACB certificants per state population
Fig. 9.
Dispersal plots and heat maps for states with overall high density of BACB certificants per state population
Data Collection and Design
The same data from the previous analysis were used to present all relevant BACB certificant data. To evaluate the distribution of certificants within each state, county populations were gathered from the U.S. Census Bureau (2019). The locations of BACB approved training programs were gathered from the Applied Behavior Analysis International (n.d.) Verified Course Sequence Directory.
Choropleth charts were generated for each state using the Plotly package in Python. These graphs contained (1) a 2D boundary of the shape and orientation of the given state; (2) counties within the state boundary; and (3) varying heat density shading for the density of BACB certificants. For the linear charts, the state’s county population was plotted using a logarithmic scale on the x-axis and the number of BACB certificants was presented on the y-axis. We placed an open circle around a data point on the graph to represent the location(s) of VCSs (some overlap if in the same county). The y-axis is not standard for each state to prevent obscuring the internal variability of that state’s dispersal patterns.
Results
Figures 7, 8, and 9 were created to review individual state data beyond the mixed models presented previously. In each figure the dispersal pattern plot is presented on the left, and the heat map of density of BACB certificants is presented on the right. Figures 7, 8, and 9 all depict scaling where the total number of BACB certificants per county appear to increase with county population. However, states in Figures 7 and 8 have many counties with zero BACB certificants. In Figure 7, Maryland and North Carolina appear to have an increasing spread between data points as county population increases. Maryland has fewer locations with zero BACB certificants. Tennessee and Texas have increased variability in the number of BACB certificants as the county population increases. Texas has more locations with 20 or more BACB certificants per 100,000. This dispersal could lead to many without access to behavioral services unless located in a county with more service providers.
In Figure 8, Michigan and New York have a higher variability in the number of BACB certificants for higher population counties. Michigan’s Upper Peninsula has more counties with zero certificants. It should be noted that VCS locations also appear to have a higher density of certificants compared to similar counties, but there are exceptions like New York. Its VCS locations may actually have a lower comparative density when looking at other counties in that state that contain a similar population sizes without a VCS. Potentially students from these programs leave to serve other counties, or move out of the state after graduating, or are completing their work online from another location. Pennsylvania has more VCS locations compared to New York and may be more consistently scaling BACB certificant numbers in larger populace counties. New York has high populace counties with fewer analysts than some counties with smaller population sizes. In Figure 9, Connecticut, Massachusetts, and New Jersey continue to have the overall highest number of behavior analysts per capita (Deochand & Fuqua, 2016; Yingling et al., 2021a), and when using the heat maps they also have the most even dispersal of 20 or more BACB certificants per 100,000 population in each county. There is some variance in dispersal of certficants in Florida and some areas with no BACB certificants. New Jersey and Virginia have more variability in the dispersal of BACB certificants per county population as represented by the spread in their dispersal plots, but New Jersey may have greater overall access to behavioral services because there are at least five certificants in each county.
California, New York, New Jersey, Virginia, and Michigan, which have an overall high to medium density of certificants to the state population, are in the top 10 states with the highest total number of certificants. As an alternative, Texas and Illinois, also in the top 10 states, had a high proportion of counties with zero BACB certificants. Higher overall density of BACB certificants in a state does not necessarily guarantee each county has an even spread of BACB certificants, however, it appears that that a majority of states in Figure 9 have fewer counties containing no BACB certificants. It is not feasible to review all policies that have led to these distributions, but in the discussion some of Massachusetts policies are discussed as it appears to also be scaling behavioral services in its counties so they are well-served.
Estimating Potential Supervisorial Strains
Behavior analysts with sufficient experience train the next generation of behavior analysts. During rapid growth the ratios of newly certified behavior analysts have been increasing. The BACB reports that one of the top three alleged ethical complaints relates to improper or inadequate supervision or delegation (BACB, 2018b). The recent influx of newly certified BCBAs into the field has been helpful to meet public demand for behavioral services (Deochand & Fuqua, 2016), but it also presents unique challenges for the field.
One method to assess supervisorial strain is to examine if there are sufficient ratios of experienced BACB certificants to the more recently certified. There are caveats to using years postcertification to quantify “experience” because there are intensive training programs and experiences or time in the field practicing before certification that may be ignored, but 5 years is one of the requirements set by the BACB for an eligible supervisor, so we examined the ratios of BCBA and BCBA-D certificants with under 5 years postcertification experience to those with 5 or more years’ experience. Experienced BCBAs and BCBA-Ds help monitor and mentor less experienced BCBAs, BcaBAs, and RBTs, as well as those seeking to become certified through the BACB. Also, because training and education are equally important and some BCBA-Ds teach in the academic eco-system, the number of BCBA-Ds per each state are presented separately in Tables 3 and 4.
Table 3.
States with D.C. ranked by total BCBAs and BCBA-Ds with mean years experience post certification and ratio of newly certified to senior BCBAs and BCBA-Ds, and number of BCBA-Ds presented separately
| Ranked States | No. of BCBAs & BCBA-Ds | Mean years’ experience |
New to Senior Analysts | No of BCBA-Ds |
|---|---|---|---|---|
| 1. California | 5479 | 4.7 | 1.5 | 294 |
| 2. Florida | 2784 | 5.9 | 1.2 | 211 |
| 3. Massachusetts | 2368 | 5.7 | 1.2 | 132 |
| 4. New York | 1938 | 5.3 | 1.3 | 152 |
| 5. Texas | 1776 | 4.7 | 1.5 | 103 |
| 6. New Jersey | 1716 | 5.1 | 1.4 | 216 |
| 7. Pennsylvania | 1443 | 6.3 | 0.9 | 89 |
| 8. Illinois | 1079 | 4.2 | 2.1 | 45 |
| 9. Virginia | 1048 | 4.6 | 1.7 | 51 |
| 10. Michigan | 996 | 3.7 | 2.7 | 72 |
| 11. Washington | 768 | 4.6 | 1.8 | 49 |
| 12. Connecticut | 764 | 5.4 | 1.2 | 49 |
| 13. Colorado | 703 | 4.3 | 2.0 | 37 |
| 14. Indiana | 657 | 3.7 | 2.4 | 25 |
| 15. Tennessee | 566 | 6.0 | 1.1 | 38 |
| 16. Ohio | 548 | 4.3 | 2.1 | 44 |
| 17. Georgia | 532 | 4.6 | 1.6 | 53 |
| 18. Maryland | 507 | 4.5 | 1.8 | 54 |
| 19. Missouri | 483 | 4.9 | 1.5 | 21 |
| 20. North Carolina | 475 | 4.7 | 1.7 | 41 |
| 21. Arizona | 395 | 4.1 | 2.1 | 28 |
| 22. Louisiana | 311 | 4.0 | 2.4 | 25 |
| 23. New Hampshire | 294 | 5.0 | 1.4 | 12 |
| 24. Utah | 289 | 3.1 | 4.7 | 17 |
| 25. South Carolina | 274 | 5.1 | 1.4 | 19 |
| 26. Kentucky | 271 | 4.9 | 1.4 | 16 |
| 27. Wisconsin | 255 | 4.4 | 1.8 | 19 |
| 28. Alabama | 243 | 6.4 | 0.9 | 29 |
| 39. Nevada | 204 | 4.6 | 1.8 | 29 |
| 30. Minnesota | 202 | 5.1 | 1.6 | 17 |
| 31. Rhode Island | 199 | 5.4 | 1.3 | 11 |
| 32. Oregon | 196 | 4.0 | 3.6 | 11 |
| 33. Hawaii | 191 | 4.9 | 1.5 | 10 |
| 34. Maine | 185 | 5.6 | 0.9 | 20 |
| 35. Kansas | 171 | 5.0 | 1.6 | 22 |
| 36. Vermont | 144 | 5.0 | 1.8 | 4 |
| 37. Nebraska | 132 | 4.7 | 1.6 | 21 |
| 38. Iowa | 123 | 4.8 | 1.4 | 11 |
| 39. Oklahoma | 94 | 4.6 | 1.6 | 12 |
| 40. West Virginia | 81 | 5.0 | 0.8 | 11 |
| 41. Arkansas | 81 | 4.3 | 1.8 | 9 |
| 42. Mississippi | 81 | 3.3 | 3.1 | 12 |
| 43. New Mexico | 80 | 4.5 | 1.9 | 5 |
| 44. D. C. | 64 | 4.2 | 1.9 | 1 |
| 45. Delaware | 60 | 3.8 | 1.9 | 0 |
| 46. Alaska | 53 | 5.0 | 1.1 | 5 |
| 47. Idaho | 46 | 3.8 | 2.3 | 1 |
| 48. Montana | 43 | 4.6 | 1.4 | 2 |
| 49. North Dakota | 34 | 3.4 | 4.7 | 2 |
| 50. South Dakota | 32 | 5.7 | 1.5 | 7 |
| 51. Wyoming | 20 | 2.9 | 4 | 0 |
Table 4.
Canadian provinces ranked by total number of BCBAs and BCBA-Ds in 2019 with mean years’ experience post certification and ratio of newly certified to senior BCBAs and BCBA-Ds, and number of BCBA-Ds presented separately
| Province | No. of BCBAs & BCBA-Ds | Mean years’ experience |
New to Senior Analysts | No. of BCBA-Ds |
|---|---|---|---|---|
| 1. Ontario | 825 | 4.1 | 1.8 | 29 |
| 2. British Columbia | 279 | 4.9 | 1.3 | 11 |
| 3. Alberta | 42 | 3.8 | 1.8 | 1 |
| 4. Quebec | 40 | 3.8 | 2.6 | 1 |
| 5. Manitoba | 29 | 4.9 | 1.4 | 12 |
| 6. New Brunswick | 29 | 4.4 | 1.2 | 2 |
| 7. Nova Scotia | 17 | 5.1 | 1.1 | 1 |
| 8. Saskatchewan | 5 | 3.4 | 1.5 | 0 |
| 9. Prince Edward Island | 4 | 6.9 | 1.0 | 0 |
| 10. Newfoundland | 3 | 2.2 | N/A | 1 |
Note. Newfoundland did not have senior analysts
Method
Dependent Measures
The same BACB certificant data from the previous analysis were filtered per each state and Canadian provinces and divided into only board certified behavior analysts (BCBA and BCBA-Ds) who were certified before mid-2015. This divided data into BCBAs and BCBA-Ds with under 5 years’ experience (newly certified) and those with over 5 years’ experience (senior analysts). A ratio was created by dividing the number of newly certified by the senior analysts for each state or province. After ranking each state and province by the total number of BCBA and BCBA-D certificants in that state, the mean years’ experience and ratio of newly certified to senior analysts was added to Tables 3 and 4 respectively, along with counts of BCBA-Ds in those locations.
Results
For the United States there are an average of 1.5:1 newly certified to senior analysts. Any states with a ratio lower than 1.5 newly certified to senior analysts could be described as having above average numbers of senior analysts to support the professional practice of ABA. The following states, Pennsylvania (0.9), Connecticut (1.2), Tennessee (1.1), Alabama (0.9), Maine (0.9), West Virginia (0.8), and Alaska (1.1), arranged by those with the largest number of total BCBAs and BCBA-Ds, have the lowest ratios of newly certified to senior analysts. Based on the total certificant populations of those more highly ranked, it would take larger certificant population shifts for Pennsylvania to change its ratios compared to states like Wyoming and the Dakotas, whose data are likely to shift more rapidly.
Michigan (2.7), Utah (4.7), Oregon (3.6), Mississippi (3.1), North Dakota (4.7), and Wyoming (4) had the reverse patterns where there are a disproportionate number of newly certified BCBAs and BCBA-Ds compared to senior analysts. Utah, North Dakota, and Wyoming have the highest ratios of newly certified to senior analysts. North Dakota and Wyoming also face the issue of low overall numbers of BACB certificants and low dispersal patterns in their states (see supplemental materials).
When examining Table 4, the Canadian provinces have fewer ratios of newly certified to senior analysts. This could be typical of an earlier stage of growth where becoming a BCBA has not yet reached the tipping point or mass influx of new certificants that the United States has experienced, or is experiencing. Quebec was the exception as it did have a ratio of 2.6 new analysts to senior analysts. As the popularity of the BCBA certification increases, it is likely that these ratios will change to mirror some of the patterns present in the United States, where in some locations the ratios of new analysts to senior analysts start to grow. Many BCBA-Ds serve in leadership roles, whether it is to assist as clinical directors, or serve on quality assurance review boards, or as faculty that train the next generation of behavior analysts, which is why they are presented separately in the tables.
Discussion
To be stewards of our data we must explore new ways to display information not only to discover patterns, but also to promote value-driven action based on relevant findings. To expose new findings that lurk at different levels we require approaches that parsimoniously use data transformations rather than rely on them to prove a particular a priori assumption. Data scientists should provide relevant limitations to the data as well as a rationale for their selected approach to analyzing a topic. In addition, to increase transparency and replication efforts it is essential to provide all relevant data (Tincani & Travers, 2019). Our data and code can be readily accessed at: https://osf.io/hmgjt/.
An interesting finding is that at an early stage of growth VCS locations may be a stronger prediction than population size, which later shifts in favor of population size as a predictor for BACB certificant numbers. The inconsistent effects of VCS locations on BACB certificant density might also be as a result of the increased access to hybrid or online programs serving students from outside their immediate vicinity. Our data is just a preliminary overview of some interesting trends, distribution patterns, and potential supervisorial strains. In our analysis of dispersal patterns our criteria for inclusion excluded some states with the lowest total number of BACB certificants, which would have had the lowest actual dispersal patterns. This inclusion criteria allowed for a reasonable sample of some state data to review, but the readers are encouraged to review the data in its entirety in the supplemental materials. The field needs to develop metrics to assess the quality of care or supervision practices used in practice, but in lieu of this, the ratio of new to more seasoned certificants could offer a means to assess supervisorial strain. The professional practice of ABA heavily relies on peer support from all those committed to serve their clients. Recommendations through local review committees present opportunities for seasoned behavior analysts to maintain the quality assurance of services. Therefore, it is reasonable to further our understanding on strains that could occur through changing distributions and ratios of seasoned to new certificants.
Although it was not feasible to drill down to the legal precedents for each state and examine their potential influence on BACB certificant growth, readers can access details regarding state law from the National Conference of State Legislatures list of Autism Insurance Coverage (National Conference of State Legislatures, 2018). Each of these states might have different distribution patters that may arise because of differences in funding, insurance, and/or licensure policies, or even accessibility to a location based on geographic terrain. Despite the fact that just over 92.5% of BACB certificants reside in the United States and Canada, there are regions with no BACB certificants. There are patterns in these data that may be explained by the knowledge of the local behavior analytic community based on their understanding of the terrain. For example, the locations of military bases in states without extended ABA service coverage may contribute to pockets of coverage through Tricare and lead to unique localization patterns of BACB certificants (e.g., Virginia). Likewise, Medicaid differentially covers ABA services, leading to unique patterns in some states. Florida has consistently had the highest ratios of BCaBA certificants partially because of the long-standing means of coverage through Medicaid. In 2022, the growth in the number of new incoming BCaBAs dropped for the first time in 11 years since 2010 (BACB, n.d.). This may have been precipitated by the rapid growth in numbers of RBTs and increased numbers of BCBAs. Gathering additional details from the behavioral community and from other data pools could account for additional variance in the data and extend our understanding of evidenced-based policy decision making and their impacts on ABA services.
Massachusetts Collaborative Care Model
Massachusetts is a notable state that has the highest overall density of behavior analysts, and it has maintained high ratios and relatively even dispersal (Deochand & Fuqua, 2016). It has had the highest ratios of medical and mental health care professionals to its population in the United States historically for many years. The aggressive and ambitious policies implemented by Massachusetts have served to improve the health and well-being of their population (McDonough et al., 2006). It was home to the first community health center in the United States, and these centers combine behavioral health with high quality medical care. Recognizing ABA credentialed professionals within a multidisciplinary treatment team assists in moving rapidly from a medical rule-out to behavioral assessment. There is some evidence to suggest early ASD diagnosis is affected by the availability of neurologists and psychiatrists within a region (Kalkbrenner et al., 2011). This likely expedites the delivery of early behavioral intervention, and or crisis intervention for cases where an individual poses a danger to themselves or others. In addition, many of these facilities have a more transparent process for the uninsured to receive access to care minimizing socioeconomic disparities (McDonough et al., 2006). It also boasts the least uninsured persons and one of the best health-care systems in the nation. It has explicitly minimized access barriers influencing culturally and linguistically diverse populations. Adopting evidenced-based policies like behavioral health screening mandates have helped to increase access to service use (Hacker et al., 2017). These initiatives help access needed behavioral and medical services across the board for multiple ages and racial/ ethnic groups. Using a collaborative support model helps caregivers receive needed referrals and quicker access to early diagnosis and intervention. The data for Massachusetts suggests that despite initial high costs, their model appears to be scalable and a long-term cost-effective means to provide timely access to all constituents within its borders. The policies could have been influential as to why this state continues to have a high density of BACB certificants, but we caution the readers from overgeneralizing from these speculative and anecdotal comments.
Limitations of the Data
The progression and access to telehealth could serve to assist in the dissemination of behavior analysis to areas with fewer BACB certificants. Our analyses to assess access to a BACB certificants is complicated by those that offer telehealth and or consult long distances outside of their region. Likewise, modeling the impact of VCS institutions is complicated by those online or hybrid programs that serve students outside their state. These differences could explain why there is variability in the impact of VCS locations. The BACB collates data on most recent location a person reports to reside, and historic mobility data of its constituents is not available at this time. We hope that these data are more purposefully gathered to ensure we are able to see trends in how BACB certificants distribute themselves based on changing market forces.
The arbitrary nature of geographic boundaries could obscure deeper analysis, as some states might have fewer counties but they cover larger geographic areas while still having pockets that have no BACB certificants. Our rationale for population size was related to those that may not receive diagnoses and to not ignore services to other client populations, however, it may not be a true assessment of demand if there is differential clustering of the clients we serve. There is some evidence of higher prevalence rates of ASD in Minnesota, Indiana, Pennsylvania, and New England states (Yingling et al., 2021b). The most recent challenge going forward will relate to internationally tracking the professional practice of behavior analysis as the BACB transitions from being a global certification. Overall, BACB certificant growth appears to be healthy and it has historically recovered from task list updates, and additional coursework and supervision requirements (Shook & Neisworth, 2005), as well as factors like COVID.
Future Research
Sharing and improving upon our data and analyses on BACB certificant county density, dispersal, and potential supervisorial strains could help expose strategies to prevent potential threats to future growth, as well as support the quality of delivered behavioral services. More data is needed regarding those in need of services, those receiving services, and the quality of service delivery in relation to costs. With these data we can proactively attempt to predict where the highest need locations could be, and behavior analysts can develop resources to support those locations. Researchers should allocate their time and resources towards topics that will continue to support growth while developing tools for supervision (Fraidlin et al., 2022; Garza et al., 2018; Gatzunis et al., 2022), or on topics related to diversity, equity, and inclusion, as well as other instructional resources that advance the professional practice of behavior analysis (Deochand et al., 2020; Deochand & Costello, 2022). Considering the relative distribution of new behavior analysts to senior behavior analysts in addition to the density and dispersal of number of certificants could lead to offering supports where there are supervisorial deficits. No model can adequately predict the capacity of BACB certificants within a job market if the certification diversifies to serve a broader market, which is one rationale for why population versus a client demographic was selected. There is growing demand for certificants to serve in school settings and the needs for behavior management within the classroom presents an ongoing demand for behavior services potentially constitute a diversification of client demographics and diagnoses. It should be noted that 28% of job postings prior to 2015 were in the education sector, but only 12.2% of BCBA and BCBA-Ds report working in that sector (BACB, n.d.).
An operational definition for equitable distribution of ABA services will be refined as additional parameters are encompassed into a working definition. Other researchers have noted inequitable access to BCBAs per child diagnosed with ASD at the county level and this has contributed to our understanding regarding access to credentialed BCBAs (Yingling et al., 2022). There are many populations in need of behavioral services, and it is hoped that behavior analysts will serve to effect change in their communities to improve the quality of life for all. As diversified employment opportunities for BACB certificants within the school system and other subspecialties grow, the overall population within a geographic region will likely be more broadly served by the credential. It is important to consider those not seeking services, barriers to receiving services, the clinical experience of behavior analysts in a region, legislation governing where ABA may be practiced, as well as supports from academic institutions, professional organizations, and their networks to provide resources for newly minted certificants navigating the service world. Unfortunately, major racial disparities exist regarding how funding is delivered for behavior services both in the Medicaid and insurance system, and this will likely lead to delays to receiving services and widen the racial service delivery disparity gap (Smith et al., 2020). Our data does not capture this, but after identifying states with potentially higher supervisorial strains and low service distributions, leadership in the ABA community can focus more heavily on these places to eliminate these disparities. Gender and racial disparities exist in our practitioner make-up, which could also be a barrier to service for some clients (Deochand & Costello, 2022). States with few BACB certificants are doubly affected if experienced behavior analysts migrate to other states where salaries may be higher. Therefore, mobility data tracking the movements of BACB certificants are needed as these details fill in critical aspects of the narrative regarding dispersal patterns. To strategically analyze growth patterns the BACB could offer data on mobility of its certificants, or allow more data transparency for researchers to continue to follow the growth of the credentialed behavior analysts. The location of alleged ethical code violations per each state might also assist in determining where additional supports are needed. Again, data transparency is key for the field to be involved in self-governance. A behavioral certification that met all global requirements was cited as the primary challenge that precipitated the removal of all non-English exams after January 1, 2022, despite previous plans to add 4 more languages to 10 translated languages (BACB, 2020a). It is now more important than ever to examine what has sustained international growth of behavioral certificants.
Growth alone is not a sufficient metric of success. The field must demonstrate that is serving the public and offering quality care as it grows. Data scientists in our field can continue to refine and improve upon these methods and displays rather than assume BACB certificant growth will find a way to equitably distribute itself geographically. Yingling et al. (2021a) have highlighted that rural counties have less equitable access to BACB certificants, as do counties with residents that have higher rates of no health-care insurance coverage. The field should examine strategies that incentivize senior behavior analysts moving to locations where there are fewer supports for the newly certified, and recognize service behavior analysts that serve their communities through peer review committees, and other quality assurance initiatives. Another “grass roots” approach is to build equivalent VCS programs in other countries that are in the early stages of scaling up training and or creating an equivalent credential. Evangelists like Fred Keller, who contributed to a powerful Brazilian contingent from within the University of Brasillia psychology department, have demonstrated that is not only feasible but also an enduring contribution. It would be narrow-sighted to investigate growth localized only to those countries that the BACB will continue to certify, especially as equivalent behavior credentialing emerges, as it ignores the roots of behavior analysis that are being sewn across the international theater.
Supplementary Information
(DOCX 6746 kb)
Data availability
Our data and code can be accessed at our online repository: https://osf.io/hmgjt/. Additional information is available from the first author upon request.
Compliance with Ethical Standards
Conflicts of Interest
The authors have no conflict of interest that would present any financial or nonfinancial gain as a result of potentially publication of this manuscript.
Ethical Approval
Human subjects were not utilized in this article.
Footnotes
The Behavior Analysis Certification Board (BACB) is the governing body regulating certification requirements, continuing education, and disciplinary guidelines for its constituents, comprising of registered behavioral technicians (RBTs), board certified assistant behavior analysts (BCaBAs), board certified behavior analysts (BCBA), and doctoral-level board certified behavior analysts (BCBA-D). BACB certificants refers to all in this group except RBTs.
The authors acknowledge Harley Lang’s help on a previous version.
Publisher’s Note
Springer Nature remains neutral with regard to jurisdictional claims in published maps and institutional affiliations.
References
- American Academy of Pediatrics. (2021). Financial Assistance—Autism Toolkit. Pediatric Patient Education.10.1542/peo_document580
- Anscombe FJ. Graphs in statistical analysis. The American Statistician. 1973;27:17–21. doi: 10.1080/00031305.1973.10478966. [DOI] [Google Scholar]
- Applied Behavior Analysis International. (n.d.). Verified course sequence dictionary [Database]. https://www.abainternational.org/vcs/directory.aspx
- Behavior Analyst Certificant Board. (n.d.). BACB certificant data. https://www.bacb.com/BACB-certificant-data
- Behavior Analyst Certificant Board. (2018a). US employment demand for behavior analysts: 2010–2017. https://www.bacb.com/team-view/us-employment-demand-for-behavior-analysts-2010-2017/
- Behavior Analyst Certificant Board. (2018b). A summary of ethics violations and code-enforcement activities: 2016–2017. https://www.bacb.com/wp-content/uploads/2020/05/180606_Ethics_Violations_and_Code-Enforcement-Whitepaper.pdf
- Behavior Analyst Certificant Board. (2019a). BACB certificant data. https://www.bacb.com/bacb-certificant-data/
- Behavior Analyst Certificant Board. (2019b). US employment demand for behavior analysts: 2010–2018.
- Behavior Analyst Certificant Board. (2020a). Global Certification.https://www.bacb.com/global-certification/
- Behavior Analyst Certificant Board. (2020b). US employment demand for behavior analysts: 2010–2019.
- Behavior Analyst Certificant Board. (2021). US employment demand for behavior analysts: 2010–2020.
- Behavior Analyst Certificant Board. (2022). US employment demand for behavior analysts: 2010–2021.
- Bellando J, Fussell JJ, Lopez M. Autism speaks toolkits: resources for busy physicians. Clinical Pediatrics. 2016;55:171–175. doi: 10.1177/00099228155945. [DOI] [PubMed] [Google Scholar]
- Bureau of Labor Statistics. (2020). U.S. Department of Labor, Occupational Outlook Handbook, 2020–30 Eds., Speech-Language Pathologists, https://www.bls.gov/ooh/healthcare/speech-language-pathologists.htm.
- Burning Glass Technologies. (2015). US behavior analyst workforce: Understanding the national demand for behavior analysts.https://www.bacb.com/wp-content/uploads/2017/09/151009-burning-glass-report.pdf
- Cameron D, Jones IG. John Snow, the Broad Street pump and modern epidemiology. International Journal of Epidemiology. 1983;12:393–396. doi: 10.1093/ije/12.4.393. [DOI] [PubMed] [Google Scholar]
- Carr JE, Nosik MR. Professional credentialing of practicing behavior analysts. Policy Insights from the Behavioral & Brain Sciences. 2017;4(1):3–8. doi: 10.1177/2372732216685861. [DOI] [Google Scholar]
- Deochand N, Costello SM. Building a social justice framework for cultural and linguistic diversity in ABA. Behavior Analysis in Practice. 2022;15:893–908. doi: 10.1007/s40617-021-00659-4. [DOI] [PMC free article] [PubMed] [Google Scholar]
- Deochand N, Fuqua RW. BACB certification trends: State of the states (1999 to 2014). Behavior Analysis. Practice. 2016;9:243–252. doi: 10.1007/s40617-016-0118-z. [DOI] [PMC free article] [PubMed] [Google Scholar]
- Deochand N, Eldridge RR, Peterson SM. Toward the development of a functional analysis risk assessment decision tool. Behavior Analysis in Practice. 2020;13:978–990. doi: 10.1007/s40617-020-00433-y. [DOI] [PMC free article] [PubMed] [Google Scholar]
- Fraidlin, A., McElroy, A., Moses, K. A., Jenssen, K., & Van Stratton, J. E. (2022). Designing a successful supervision journey: Recommendations and resources for new BCBA supervisors. Behavior Analysis in Practice, 1–14. 10.1007/s40617-022-00728-2 [DOI] [PMC free article] [PubMed]
- Garza KL, McGee HM, Schenk YA, Wiskirchen RR. Some tools for carrying out a proposed process for supervising experience hours for aspiring Board Certified Behavior Analysts. Behavior Analysis in Practice. 2018;11:62–70. doi: 10.1007/s40617-017-0186-8. [DOI] [PMC free article] [PubMed] [Google Scholar]
- Gatzunis KS, Edwards KY, Rodriguez Diaz A, Conners BM, Weiss MJ. Cultural responsiveness framework in BCBA supervision. Behavior Analysis in Practice. 2022;15:1373–1382. doi: 10.1007/s40617-022-00688-7. [DOI] [PMC free article] [PubMed] [Google Scholar]
- Hacker K, Penfold R, Arsenault LN, Zhang F, Soumerai SB, Wissow LS. The impact of the Massachusetts behavioral health child screening policy on service utilization. Psychiatric Services. 2017;68:25–32. doi: 10.1176/appi.ps.201500543. [DOI] [PMC free article] [PubMed] [Google Scholar]
- Johnston JM, Carr JE, Mellichamp FH. A history of the professional credentialing of applied behavior analysts. The Behavior Analyst. 2017;40:523–538. doi: 10.1007/s40614-017-0106-9. [DOI] [PMC free article] [PubMed] [Google Scholar]
- Kalkbrenner AE, Daniels JL, Emch M, Morrissey J, Poole C, Chen J-C. Geographic access to health services and diagnosis with an autism spectrum disorder. Annals of Epidemiology. 2011;21:304–310. doi: 10.1016/j.annepidem.2010.11.010. [DOI] [PMC free article] [PubMed] [Google Scholar]
- Kangas BD, Vaidya M. Trends in presentations at the annual conference of the Association for Behavior Analysis. The Behavior Analyst. 2007;30:117–131. doi: 10.1007/BF03392150. [DOI] [PMC free article] [PubMed] [Google Scholar]
- Kauffman JM, Conroy M, Gardner R, III, Oswald D. Cultural sensitivity in the application of behavioral principles to education. Education & Treatment of Children. 2008;31(2):239–262. doi: 10.1353/etc.0.0019. [DOI] [Google Scholar]
- Martin, N. T., & Carr, J. E. (2019). Training and certification of behaviour analysts in Europe. European Journal of Behavior Analysis, 1–11. 10.1080/15021149.2019.1596653
- McBain RK, Cantor JH, Kofner A, Stein BD, Yu H. State insurance mandates and the workforce for children with autism. Pediatrics. 2020;146:e20200836. doi: 10.1542/peds.2020-0836. [DOI] [PMC free article] [PubMed] [Google Scholar]
- McDonough JE, Rosman B, Phelps F, Shannon M. The third wave of Massachusetts health care access reform: A unique “political blueprint” that merges individual and employer responsibility for obtaining health insurance. Health Affairs. 2006;25:W420–W431. doi: 10.1377/hlthaff.25.w420. [DOI] [PubMed] [Google Scholar]
- Murray LL, Wilson JG. Generating data sets for teaching the importance of regression analysis. Decision Sciences Journal of Innovative Education. 2021;19:157–166. doi: 10.1111/dsji.12233. [DOI] [Google Scholar]
- National Autism Center. (2015). National Standards Project. Phase, 2.
- National Autism Center. (2009). National Standards Project. Phase, 2.
- National Conference of State Legislatures. (2018). Autism and insurance coverage: State laws. https://www.ncsl.org/research/health/autism-and-insurance-coverage-state-laws.aspx
- Newschaffer CJ. Trends in autism spectrum disorders: the interaction of time, group-level socioeconomic status, and individual-level race/ethnicity. American Journal of Public Health. 2017;107:1698. doi: 10.2105/AJPH.2017.304085. [DOI] [PMC free article] [PubMed] [Google Scholar]
- Python Core Team . Python (Version 2.27.10) Python Software Foundation; 2019. [Google Scholar]
- R Core Team . R: A language and environment for statistical computing (Version 3.6.0) R Foundation for Statistical Computing; 2019. [Google Scholar]
- Shook GL. An examination of the integrity and future of the Behavior Analyst Certification Board credentials. Behavior Modification. 2005;29:562–574. doi: 10.1177/0145445504274203¶. [DOI] [PubMed] [Google Scholar]
- Shook GL, Neisworth JT. Ensuring appropriate qualifications for applied behavior analyst professionals: The behavior analyst certification board. Exceptionality. 2005;13:3–10. doi: 10.1207/s15327035ex1301_2. [DOI] [Google Scholar]
- Shook GL, Favell JE. The Behavior Analyst Certification Board and the profession of behavior analysis. Behavior Analysis in Practice. 2008;1:44–48. doi: 10.1007/bf03391720. [DOI] [PMC free article] [PubMed] [Google Scholar]
- Smith KA, Gehricke JG, Iadarola S, Wolfe A, Kuhlthau KA. Disparities in service use among children with autism: a systematic review. Pediatrics. 2020;145(Suppl. 1):S35–S46. doi: 10.1542/peds.2019-1895G. [DOI] [PubMed] [Google Scholar]
- Statistics Canada. (2019). Census subdivisions (CSD). In Dictionary, Census of Population, 2016https://www12.statcan.gc.ca/census-recensement/2016/ref/dict/geo012-eng.cfm
- Steinbrenner JR, Hume K, Odom SL, Morin KL, Nowell SW, Tomaszewski B, Szendrey S, McIntyre NS, Yücesot-Özkan S, Savage MN. Evidence-based practices for children, youth, and young adults with autism. FPG Child Development Institute. 2020;51(11):4013–4032. doi: 10.1007/s10803-020-04844-2. [DOI] [PMC free article] [PubMed] [Google Scholar]
- Tincani M, Travers J. Replication research, publication bias, and applied behavior analysis. Perspectives on Behavior Science. 2019;42:59–75. doi: 10.1007/s40614-019-00191-5. [DOI] [PMC free article] [PubMed] [Google Scholar]
- U.S. Census Bureau. (2019). Census API: Datasets in /data/2019/pep/population and its descendants [Application programming interface]. https://www.census.gov/data/developers/data-sets/popest-popproj/popest.Vintage_2019.html
- Wallace S, Fein D, Rosanoff M, Dawson G, Hossain S, Brennan L, Como A, Shih A. A global public health strategy for autism spectrum disorders. Autism Research. 2012;5:211–217. doi: 10.1002/aur.1236. [DOI] [PubMed] [Google Scholar]
- Wickham, H. (2016). ggplot2: elegant graphics for data analysis. Springer. 10.1007/978-3-319-24277-4
- Yingling, M. E., Ruther, M. H., & Dubuque, E. M. (2022). Trends in geographic access to board certified behavior analysts among children with autism spectrum disorder, 2018–2021. Journal of Autism & Developmental Disorders, 1–8. 10.1007/s10803-021-05402-0 [DOI] [PMC free article] [PubMed]
- Yingling ME, Ruther MH, Dubuque EM, Bell BA. Impact of county sociodemographic factors and state policy on geographic access to behavior analysts among children with autism spectrum disorder. Administration & Policy in Mental Health & Mental Health Services Research. 2021;48:1105–1114. doi: 10.1007/s10488-021-01120-y. [DOI] [PMC free article] [PubMed] [Google Scholar]
- Yingling ME, Ruther MH, Dubuque EM, Mandell DS. County-level variation in geographic access to board certified behavior analysts among children with Autism Spectrum Disorder in the United States. Autism. 2021;25:1734–1745. doi: 10.1177/136236132110020. [DOI] [PubMed] [Google Scholar]
Associated Data
This section collects any data citations, data availability statements, or supplementary materials included in this article.
Supplementary Materials
(DOCX 6746 kb)
Data Availability Statement
Our data and code can be accessed at our online repository: https://osf.io/hmgjt/. Additional information is available from the first author upon request.


