Abstract
Primary cilia are sensory organelles that provide a feedback mechanism to restrict Wnt signaling in the absence of endogenous Wnt activators. Abnormal Wnt signaling has been shown to result in polycystic kidney disease (PKD) although the exact mechanism has been debated. Previously, we reported that the calcium channel CaV1.2 functions in primary cilia. In this study, we show that CaV1.2 expression level is regulated by Wnt signaling. This occurs through modulation of mitochondrial mass and activity resulting in increased reactive oxygen species which generate oxidative DNA lesions. We found that the subsequent cellular DNA damage response triggers increased CaV1.2 expression. In the absence of primary cilia where Wnt signaling is upregulated, we found that CaV1.2 is overexpressed as a compensatory mechanism. We show for the first time that CaV1.2 knockdown in zebrafish results in classic primary cilia defects including renal cyst formation, hydrocephalus, and left-right asymmetry defects. Our study shows that suppressed Wnt signaling prevents CaV1.2 expression ultimately resulting in PKD phenotypes. Thus, CaV1.2 expression is tightly regulated through Wnt signaling and plays an essential sensory role in primary cilia necessary for cellular homeostasis.
Wnt signaling is an important regulator of cellular development and proliferation. In the absence of Wnt ligands, a complex consisting of Axin, adenomatous polyposis coli (APC), and glycogen synthase kinase 3β (GSK3β) induces β-catenin for ubiquitylation by SCF E3 ligases and eventual proteasomal degradation (Aberle et al., 1997). Wnt signal transduction occurs when secreted Wnt ligands bind Frizzled receptors resulting in phosphorylation of LRP5/6. The Axin-APC-GSK3β complex is then recruited to LRP5/6 at the cell membrane which prevents β-catenin from being degraded. The accumulated β-catenin translocates to the nucleus and activates transcription of Wnt target genes (Muntean et al., 2012).
Primary cilia are non-motile sensory organelles present as a single copy on most differentiated cells in the body. Calcium signaling through primary cilium is essential for renal epithelial homeostasis (Nauli et al., 2003; Jin et al., 2013). Cilia extend from the cell surface through the basal body via intraflagellar transport (Moyer et al., 1994). The most common pathologies resulting from cilia dysfunction include polycystic kidney (Wilson, 2004), hypertension (Nauli et al., 2008; AbouAlaiwi et al., 2009), aneurysm (Aboualaiwi et al., 2013), hydrocephalus (Carter et al., 2012), and left-right asymmetry defects (Norris, 2012).
Abnormal Wnt signaling has also been linked to polycystic kidney disease (PKD) (Lancaster et al., 2009). For example, increased cytosolic and nuclear β-catenin accumulation has been shown in various cilia mutant cells (Gerdes et al., 2007; Lancaster et al., 2011). Thus, primary cilia are thought to provide a feedback mechanism that restricts Wnt signaling in the absence of appropriate ligands (Gerdes et al., 2007; Lancaster et al., 2009, 2011).
We recently showed that voltage-gated L-type calcium channel CaV1.2 localized to primary cilia in renal epithelia (Jin et al., 2013). Because Wnt signaling has also been reported to modulate mitochondrial physiology (Yoon et al., 2010), we hypothesized that primary cilia play a role in Wnt regulation of mitochondria through CaV1.2. We show that although CaV1.2 is not required for cilia formation, Wnt increases mitochondria mass and activity in CaV1.2 deficient renal epithelial cells. This increases mitochondria reactive oxidative species (ROS) and DNA damage, resulting in PKD phenotypes. Thus, our study suggests that primary cilia may play a role in CaV1.2 expression level through Wnt regulation of mitochondria.
Materials and Methods
The experimental use of zebrafish was approved by The University of Toledo’s Institutional Animal Care and Use Committee (IACUC). The use of lentiviral components was approved by the Institutional Biosafety Committee of The University of Toledo.
Cell culture
Immortalized mouse renal epithelial wild-type and Tg737orpk/orpk cells were cultured in Dulbecco’s Modified Eagle Medium (Corning Cellgro) supplemented with 10% fetal bovine serum (HyClone Laboratories, Logan, Utah) and 1% penicillin/streptomycin (Corning Cellgro) at 39°C in 5% CO2, as previously described (Aboualaiwi et al., 2013). Prior to experiments, cells were treated with 100 ng/ml recombinant Wnt3a (R&D Systems, Minneapolis, MN) for 3 days and serum starved for 24 h.
RNAi knockdown cells
shRNA lentiviral vectors specific to Cacna1c (Origene; pGFP-C-shLenti clone ID: TL500242) were transfected into HEK293T cells. Viral supernatants were collected after 48 h, centrifuged, and passed through a 0.45 μm filter. Cells were then spin-inoculated with pseudoviral particles containing 8 μg/ml polybrene at 2,500 rpm for 30 min at 30°C and then cultured for up to 1 week. CaV1.2 knockdown was verified through Western blot analysis. Stable knockdown cell lines were obtained through puromycin selection. The following shRNA sequences were used (Table 1).
TABLE 1.
shRNA sequences
| Descriptions | Sequences |
|---|---|
| Scrambled control | 5′-TGACCACCCTGACCTACGGCGTGCAGTGC-3′ |
| Cacna1c | 5′-TCAGAAGTGCCTCACTGTTCTCGTGACCT-3′ |
Immunostaining studies
Cells were grown to confluence on collagen-coated glass coverslips and differentiated in serum-free media for 24 h. Cells were then fixed in 4% paraformaldehyde in PBS containing 2% sucrose, permeabilized in 10% triton X-100, incubated sequentially with primary followed by secondary antibodies for 1 h each, and finally mounted on a slide with DAPI hard set mounting media (Vector Laboratories, Burlingame, CA). The following primary antibody dilutions were used: acetylated-α-tubulin 1:10,000 (Sigma-Aldrich, St. Louis, MO) and CaV1.2 1:50 (Alomone Labs, Jerusalem, Israel). Anti-mouse Texas Red and anti-rabbit FITC fluorescent conjugated secondary antibodies were used at 1:500 (VectorLabs).
Mitochondrial studies
MitoTracker Green FM and MitoTracker Red CMXRos (Cell Signaling Technology) were incubated with cells at 100 nM for 30 min at 37°C. MitoSOX (Life Technologies) was incubated with cells at 5 μM for 10 min at 37°C. After staining, cells were washed three times with PBS and analyzed immediately through microscopy or flow cytometry. For microscopic analysis, cells were grown on custom glass-bottom cell culture plates and imaged under a Nikon Eclipse TE2000-U microscope controlled by MetaMorph software with a 100× objective lens. For flow cytometry studies, cells were detached with trypsin, washed, and analyzed.
DNA damage assessment
Oxidative DNA lesions were detected with an 8-oxoguanine antibody (Santa Cruz). Detached cells were fixed in 4% formaldehyde for 10 min at 37°C and permeabilized in ice-cold 90% methanol for 30 min on ice. After washing with PBS, cells were incubated in PBS containing anti-8-oxoguanine antibody (1:50), 0.5% Tween-20, and 5% FBS for 1 h. Cells were washed and incubated in PBS containing anti-mouse Texas Red antibody (1:500), 0.5% Tween-20, and 5% FBS for 1 h. Cells were then washed and analyzed with flow cytometer.
Mitochondrial DNA and mRNA measurement
Total cellular DNA was obtained using the DNeasy Blood & Tissue Kit (Qiagen) and used for detection with PCR primers listed below to quantify the nuclear (18S rRNA) to mitochondrial DNA (Coi) ratio as described (Brown and Clayton, 2002; Bai et al., 2004). Total cellular RNA was obtained using TRIzol (Life Technologies) and reverse transcribed to cDNA using the High-Capacity cDNA Reverse Transcription Kit (Applied Biosystems). PCR detection of expression genes was performed using the primers listed below comparing mitochondrial encoded oxidative phosphorylation genes (ATP5γ1 and CytC) to nuclear encoded β-Actin as described (Yoon et al., 2010) (Table 2).
TABLE 2.
Primer sequences
| Descriptions | Sequences |
|---|---|
| Coi F | 5′-GCCCCAGATATAGCATTCCC-3′ |
| Coi R | 5′-GTTCATCCTGTTCCTGCTCC-3′ |
| 18S rRNA F | 5′-TAGAGGGACAAGTGGCGTTC-3′ |
| 18S rRNA R | 5′-CGCTGAGCCAGTCAGTGT-3′ |
| ATP5γ1 F | 5′-AGTTGGTGTGGCTGGATCA-3′ |
| ATPγ1 R | 5′-GCTGCTTGAGAGATGGGTTC-3′ |
| CytC F | 5′-GGAGGCAAGCATAAGACTGG-3′ |
| CytC R | 5′-TCCATCAGGGTATCCTCTCC-3′ |
| β-actin F | 5′-TGTTACCAACTGGGACGACA-3′ |
| β-actin R | 5′-GGGGTGTTGAAGGTCTCAAA-3’ |
Western blot analysis
Cells were scraped from culture plates in the presence of RIPA buffer supplemented with Complete Protease Inhibitor (Roche, New York, NY), incubated on ice with frequent vortexing, and centrifuged. Supernatants were subjected to protein quantification and PAGE on 6–10% SDS gels followed by wet transfer to PVDF membranes and detection using β-catenin 1:1,000, CaV1.2 1:200, NF-κB p65 1:200, and GAPDH 1:1,000 (Cell Signaling Technology, Danvers, MA).
Zebrafish
Adult wild-type AB zebrafish were obtained from the Zebrafish International Resource Center (Eugene, OR) and used for breeding. Embryos were injected with 1 mM antisense translation blocking morpholino oligos (MO; GeneTools) at the 1–2 cell stage. Zebrafish embryos were then cultured at 28.5°C in sterile egg water (Muntean et al., 2010). The following MO sequences were used: control MO: 5′-CCT CTT ACC TCA GTT ACA ATT TAT A-3′, cav1.2 MO: 5′-ACA TGT TTT TGC TTT CAT TTA CCA T-3′, pkd2 MO: 5′-AGG ACG AAC GCG ACT GGA GCT CAT C-3′.
Knockdown of CaV1.2 was verified through Western blot analysis. Briefly, zebrafish embryos were dechorionated at 28 h postfertilization and homogenized in RIPA buffer to obtain protein extracts. Western was performed on 50 μg total protein using CaV1.2 (1:200) and GAPDH (1:1,000) antibodies.
Histological examination was used to measure renal cyst formation and hydrocephalus at 3 days postfertilization. Embryos were fixed in a PBS solution containing 4% paraformaldehyde and 2% sucrose overnight at 4°C, dehydrated through an ethanol gradient, and embedded in JB4 resin (Polysciences, Inc., Warrington, PA) as specified in manufacturer’s protocol. A Reichert Jung microtome was used to cut 5 μm sections which were subsequently hematoxylin and eosin stained. Heart looping was assessed at 48 h postfertilization by positioning zebrafish on their dorsal axis and recording heart beat to reveal the respective relative locations of the atrium and the ventricle.
Data analysis
Data are reported as the mean ± standard error of the mean. All image analysis was performed using ImageJ. All flow cytometry data were analyzed with BD Accuri C6 software and were presented without any compensation gating. All data were analyzed using IBM SPSS Statistics Version 21 software by performing the student t-test for two group comparison or ANOVA test followed by Tukey’s post-test for three or more group comparison. Statistical significance is reported with a statistical power greater than 0.8 at P < 0.05.
Results
CaV1.2 is not required for primary cilia assembly
We recently reported that the voltage gated L-type calcium channel CaV1.2 localized to primary cilia in bovine LLCPK cells (Jin et al., 2013). We performed immunostaining to verify this finding in mouse renal epithelial cells (Fig. 1). The mouse Tg737orpk/orpk cell line contains a hypomorphic mutation in an intraflagellar transport gene (Ift88) that is required for cells to assemble primary cilia (Moyer et al., 1994). Thus, the Tg737orpk/orpk system is a well-established model for studying cells without longer primary cilia, as verified through our immunostaining. We next asked if CaV1.2 played a role in primary cilia assembly. We generated a stable CaV1.2 shRNA knockdown mouse renal epithelial cell line and immunostaining studies revealed that primary cilia were similar to that of scrambled shRNA.
Fig. 1.
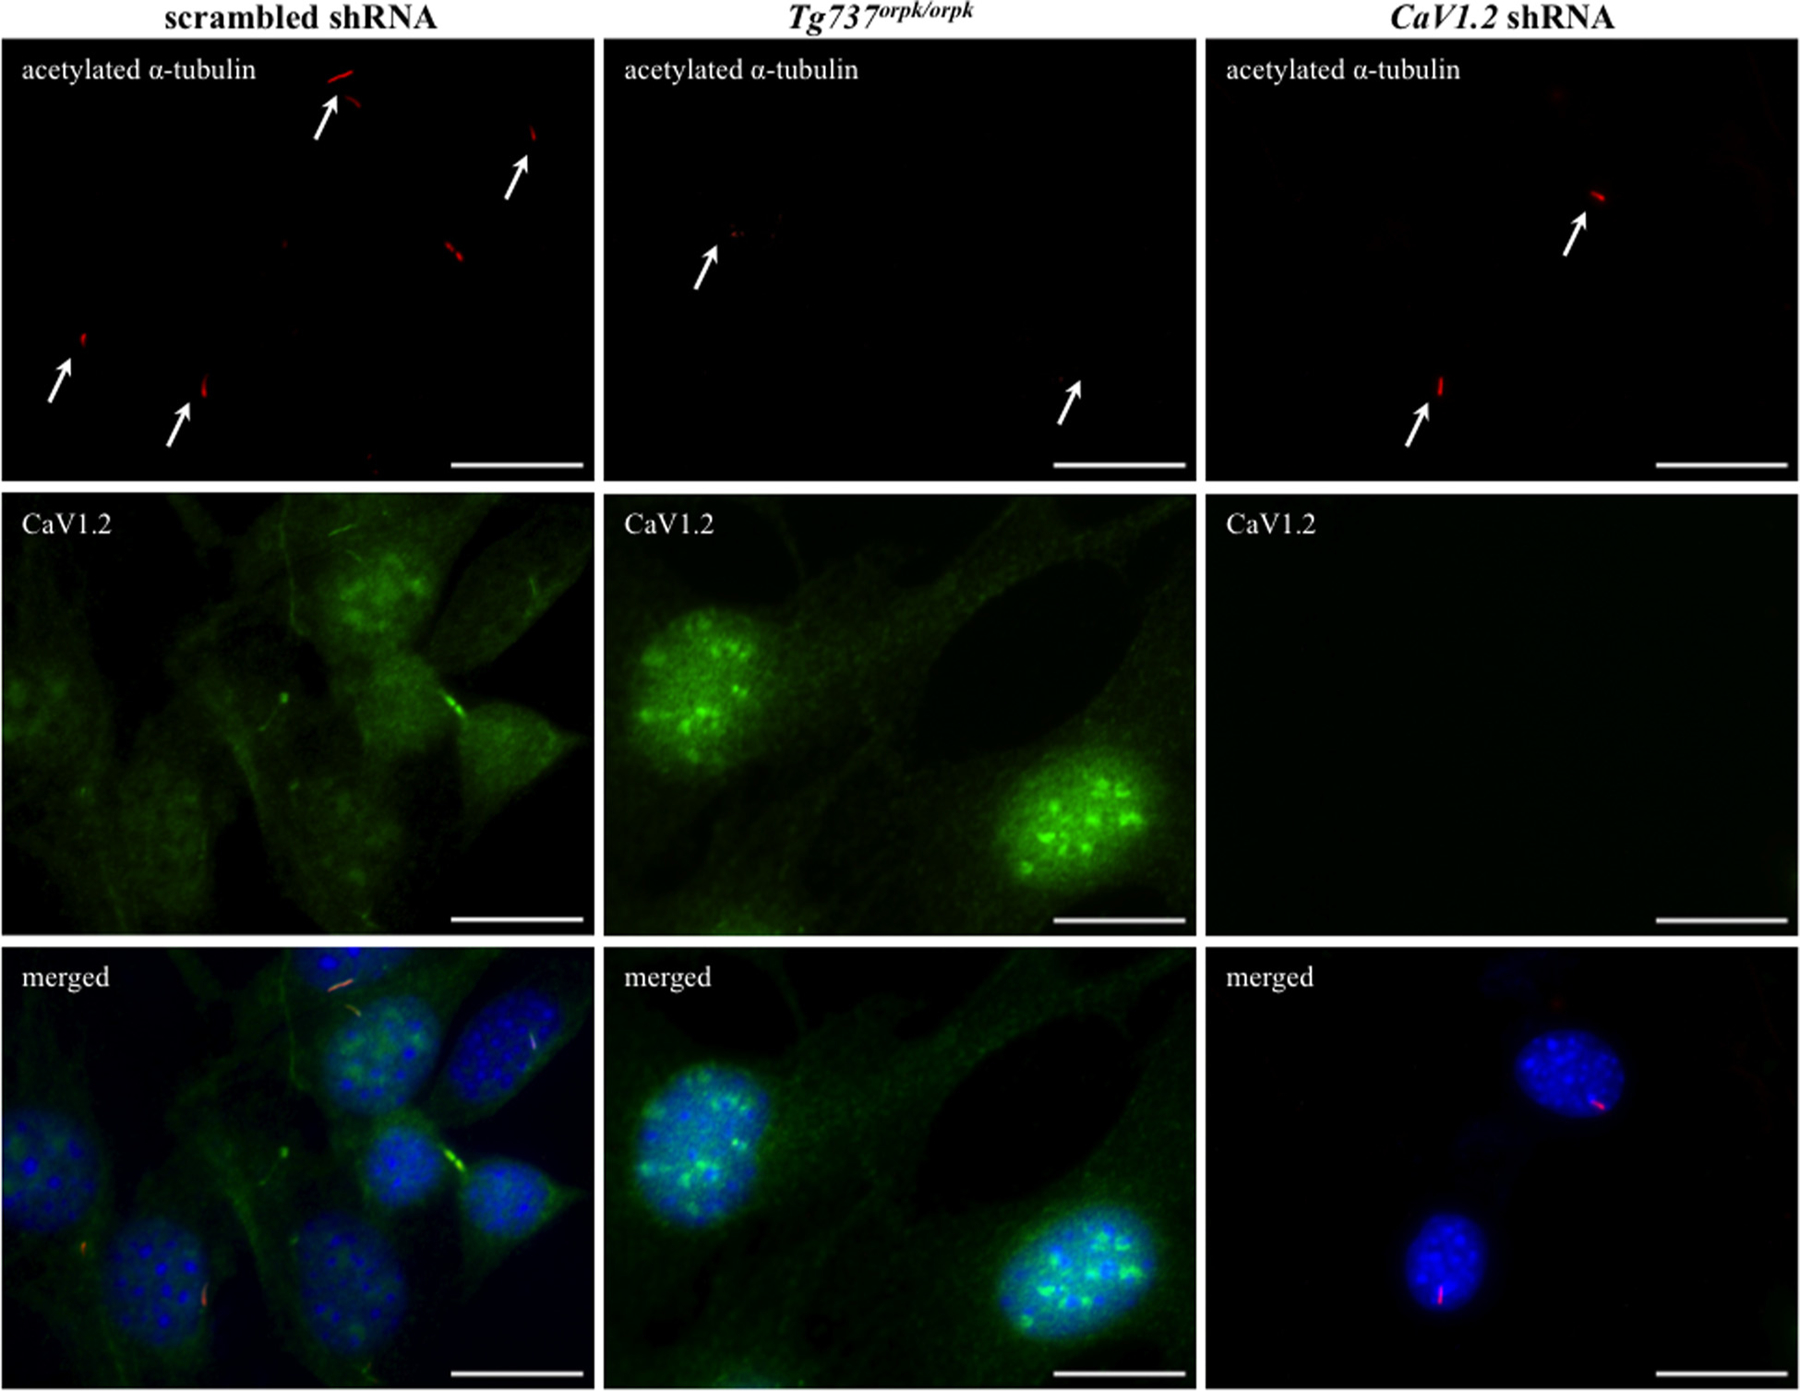
Localization of CaV1.2 to renal epithelial cilia is not required for primary cilia assembly. Immunofluorescence revealed that CaV1.2 localized to primary cilia in renal epithelial cells (scrambled shRNA) when compared with cilia-deficient cells (Tg737orpk/orpk). The presence of primary cilia was confirmed in CaV1.2 shRNA cells. Acetylated-α-tubulin was used as a ciliary marker. Arrow indicates the presence of primary cilium, except in cilia-deficient cells. Bar = 20 μm.
Wnt3a induces mitochondrial biogenesis in CaV1.2-deficient but not cilia-deficient cells
Wnt signaling has recently been reported to regulate mitochondrial physiology (Yoon et al., 2010). To assess mitochondrial mass, cells were stained with Mito Tracker Green (MTG) and observed live using fluorescence microscopy. When treated with recombinant Wnt3a, mitochondrial mass increased (Fig. 2a). However, the mitochondrial mass in Tg737orpk/orpk cells was unchanged after Wnt3a treatment. We next performed this experiment in CaV1.2 shRNA cells and the results were similar to that of the scrambled control. To quantify these findings, MTG fluorescence was recorded using flow cytometry which confirmed our fluorescent observation (Fig. 2b). Our MTG studies were further validated using a common technique by comparing mitochondrial DNA (Coi) to nuclear DNA (18S rRNA) (Brown and Clayton, 2002; Bai et al., 2004). As expected, Wnt3a did indeed statistically increase mitochondrial biogenesis in scrambled and CaV1.2 shRNA but not in Tg737orpk/orpk cells (Fig. 2c). Our immunofluorescence study showed that Wnt3a did not alter CaV1.2 localization to cilia (Table 3).
Fig. 2.
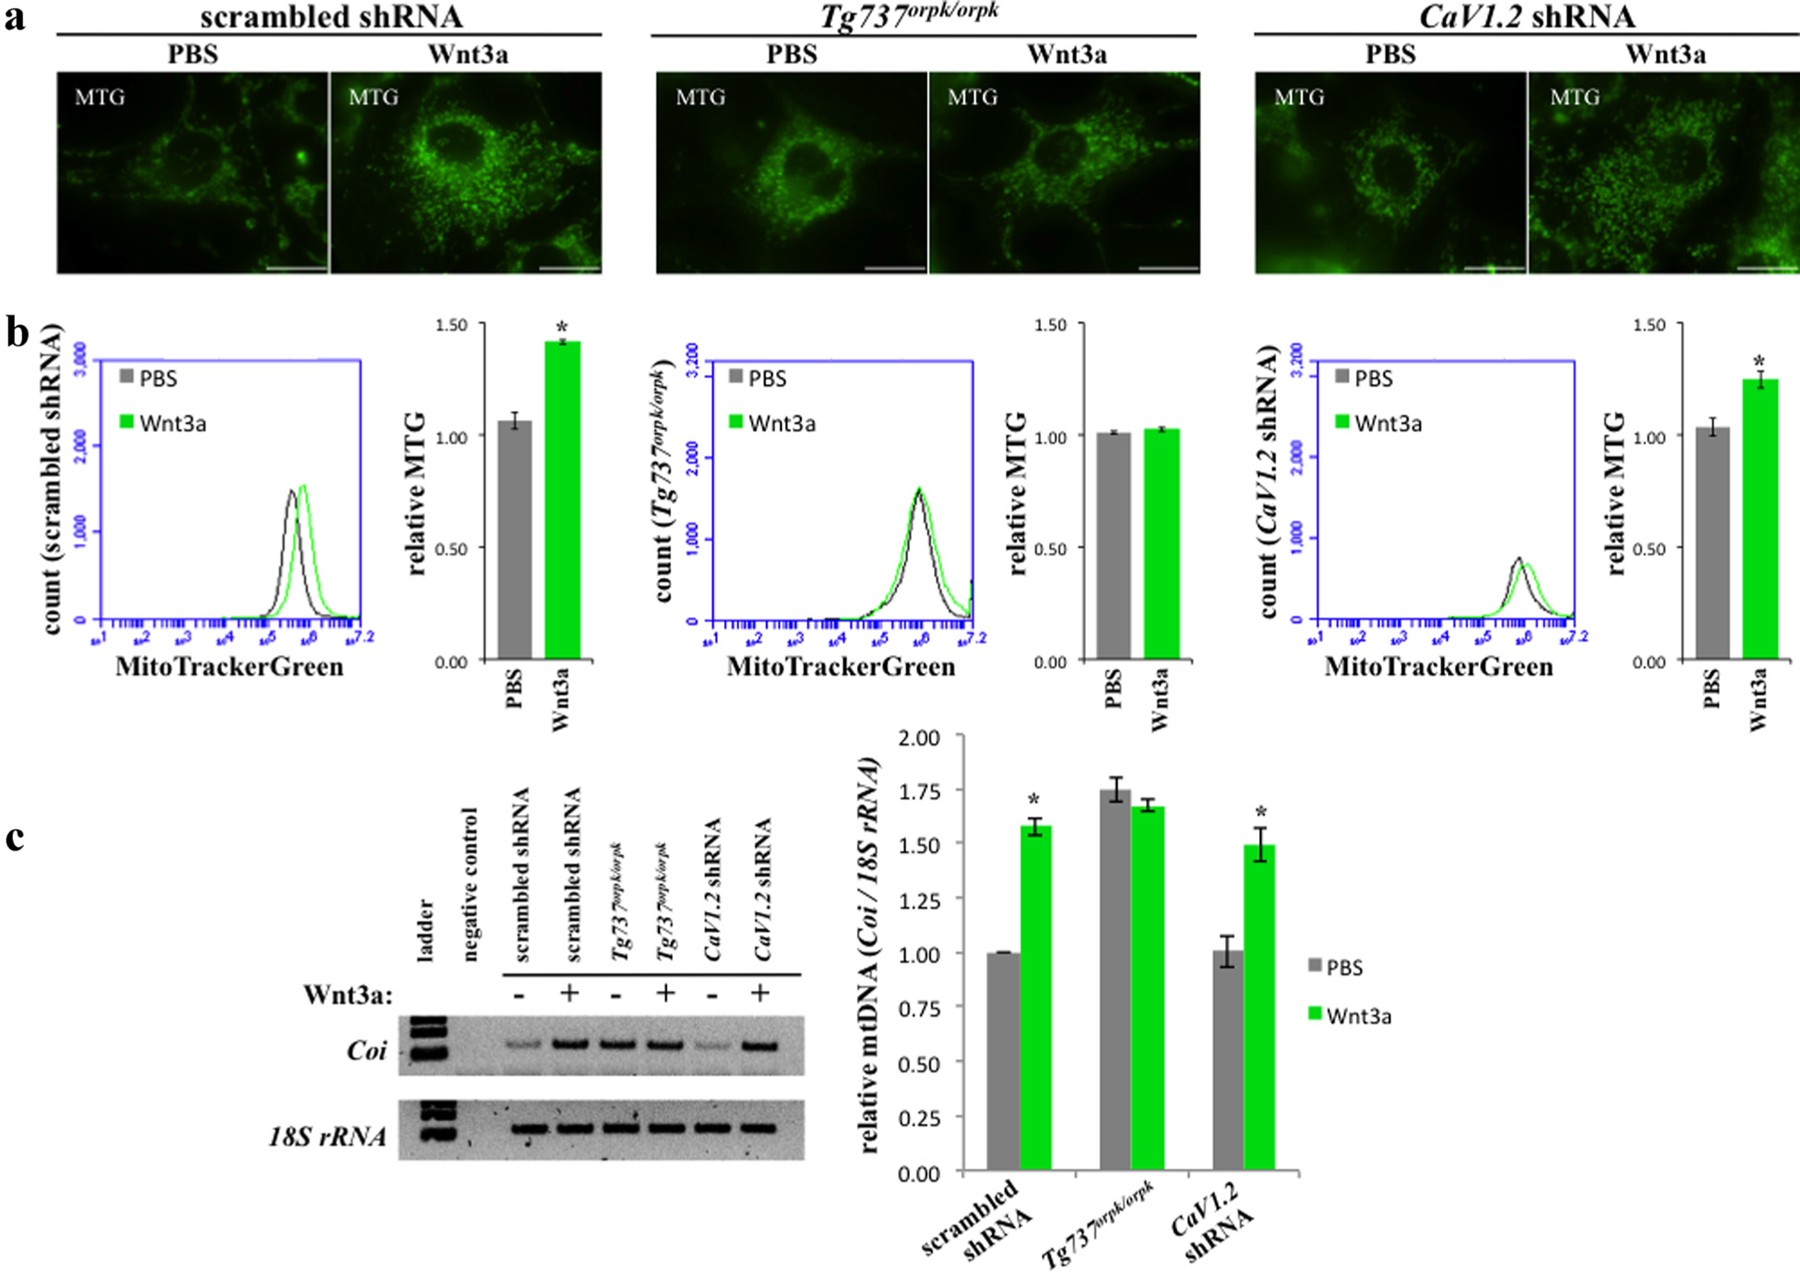
Wnt3a induces mitochondrial biogenesis in CaV1.2 shRNA but not Tg737orpk/orpk cells. a: Mitochondrial mass was assessed by staining cells with Mito Tracker Green. Wnt3a was found to induce mitochondrial mass in scrambled and CaV1.2 shRNA cells but had no effect on Tg737orpk/orpk when examined using fluorescence microscopy (bar = 20 μm). b: Results were quantified using flow cytometry. c: Mitochondrial DNA was measured using PCR by taking the ratio of a mitochondrial gene (Coi) to a nuclear gene (18S rRNA) (N = 3).
TABLE 3.
CaV1.2 ciliary localization
| % CaV1.2 localization to cilia | N | |
|---|---|---|
| PBS (control) | ||
| Scramble shRNA | 91.1 | 45 |
| Tg737orpk/orpk | 91.7 | 36 |
| CaV1.2 shRNA | 0.0 | 41 |
| Wnt3a (100 ng/ml) | ||
| Scramble shRNA | 90.4 | 52 |
| Tg737orpk/orpk | 92.3 | 39 |
| CaV1.2 shRNA | 0.0 | 46 |
Wnt3a increases mitochondrial activity in CaV1.2-deficient cells while decreasing activity in cilia-deficient cells
We next asked if Wnt3a would have an effect on mitochondrial oxidative phosphorylation (activity) in Tg737orpk/orpk cells. Similar to before, we stained cells with Mito Tracker Red (MTR). Unlike MTG, MTR staining is dependent on the mitochondrial membrane potential (Poot and Pierce, 2001; Pendergrass et al., 2004). Therefore, increased staining correlates to increased oxidative phosphorylation. As expected, Wnt3a increased MTR staining in scrambled and CaV1.2 shRNA cells when observed using fluorescence microscopy (Fig. 3a). However, mitochondrial activity decreased in Tg737orpk/orpk cells. We again quantified our findings using flow cytometry (Fig. 3b). Wnt3a significantly increased mitochondrial activity in scrambled and CaV1.2 shRNA while significantly decreasing activity in Tg737orpk/orpk cells. To verify these results, we compared expression of two key mitochondrial encoded oxidative phosphorylation genes (ATP Synthase 5γ1 and Cytochrome c) relative to that of nuclear encoded β-actin (Fig. 3c).
Fig. 3.

Wnt3a increases mitochondrial activity in CaV1.2 shRNA but decreasing activity in Tg737orpk/orpk cells. a: Mitochondrial oxidative phosphorylation was used to indicate activity through Mito Tracker Red staining. Wnt3a was found to increase oxidative phosphorylation in scrambled and CaV1.2 shRNA cells while decreasing oxidative phosphorylation in Tg737orpk/orpk when examined using fluorescence microscopy (bar = 20 μm). b: Results were quantified using flow cytometry. c: Two mitochondrial mRNAs encoded oxidative phosphorylation genes (CytC and ATP5γ1) were measured using PCR normalized to nuclear encoded β-actin (N = 3).
Wnt3a increases ROS and DNA damage in CaV1.2-deficient but not in cilia-deficient cells
An inevitable consequence of oxidative phosphorylation is the generation of reactive oxygen species (ROS) (Boveris et al., 1972; Boveris and Chance, 1973). MitoSOX is a cell permeable red fluorescent indicator specific for mitochondrial ROS. We therefore stained cells with MitoSOX and observed a significant increase in mitochondrial ROS in scrambled and CaV1.2 shRNA after treatment with Wnt3a (Fig. 4a). A significant decrease in staining was observed in Tg737orpk/orpk cells (Fig. 4b). Genomic DNA can be damaged by ROS to form DNA lesions resulting from mismatched repairs (Kasai et al., 1984). Thus, we quantified the levels of 8-Oxoguanine, a common DNA lesion formed by mismatched Adenine (Kasai, 1997). Treatment with Wnt3a was found to increase 8-Oxoguanine in scrambled and CaV1.2 shRNA while no change was observed in Tg737orpk/orpk cells (Fig. 4c).
Fig. 4.
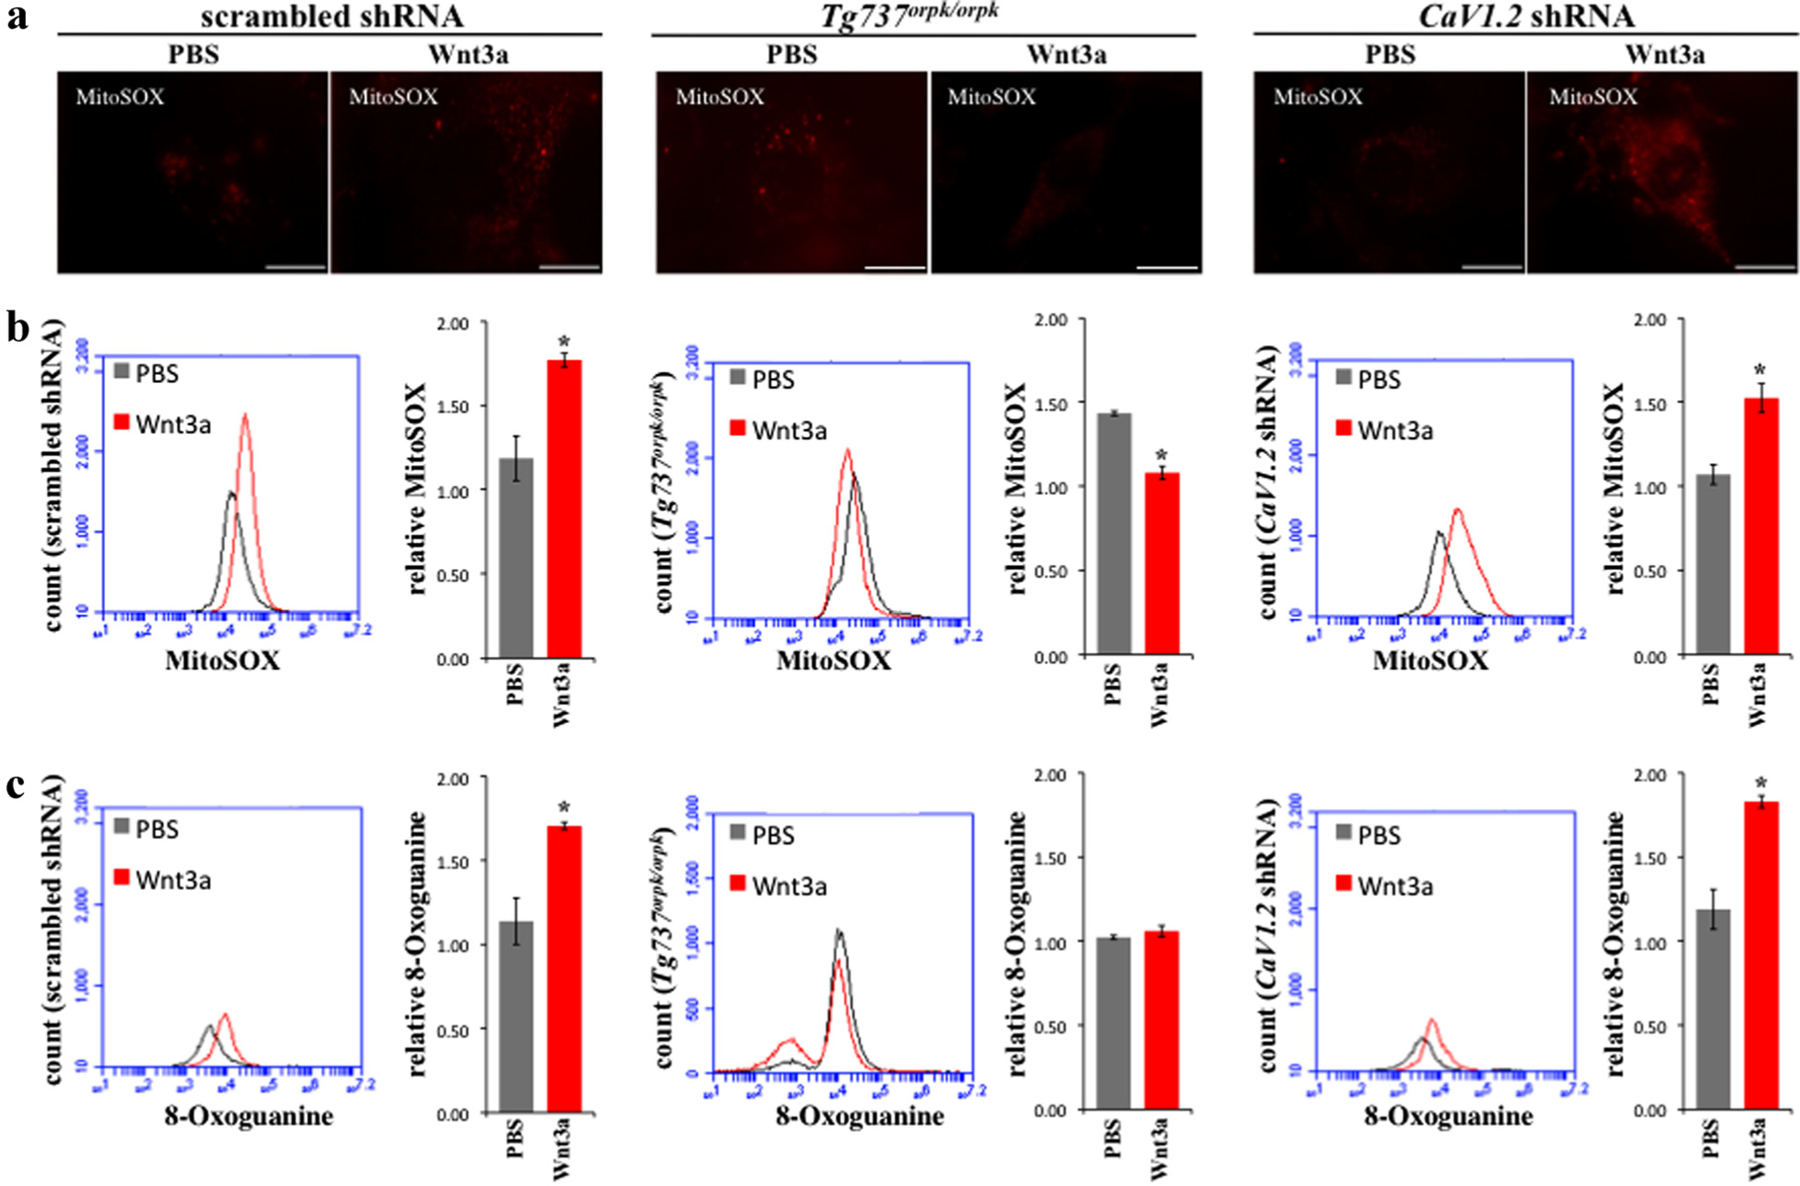
Wnt3a increases ROS and DNA damage in CaV1.2 shRNA but not in Tg737orpk/orpk cells. a: Mitochondrial ROS was assessed by staining cells with MitoSOX. Wnt3a was found to increase ROS in scrambled and CaV1.2 shRNA cells while decreasing ROS in Tg737orpk/orpk when examined using fluorescence microscopy (bar = 20 μm). b: Results were quantified using flow cytometry. c: Wnt3a increased formation of the oxidative DNA lesion 8-Oxoguanine in scrambled and CaV1.2 shRNA cells but had no effect on Tg737orpk/orpk cells (N = 3).
Cilia modulates Wnt signaling to regulate CaV1.2 expression
As previously reported, Wnt3a treatment induced β-catenin expression in all cells (Aberle et al., 1997). We confirmed this in our system, including in Tg737orpk/orpk and CaV1.2 shRNA cells (Fig. 5). Consistent with previous study (Corbit et al., 2008), Tg737orpk/orpk cells showed a higher basal level of β-catenin than control. Further, Wnt3a treatment increased CaV1.2 expression in scrambled shRNA while decreasing CaV1.2 in Tg737orpk/orpk cells. Of note is that CaV1.2 expression was not detectable in CaV1.2 shRNA cells, confirming knockdown of CaV1.2 in our stable cell line.
Fig. 5.
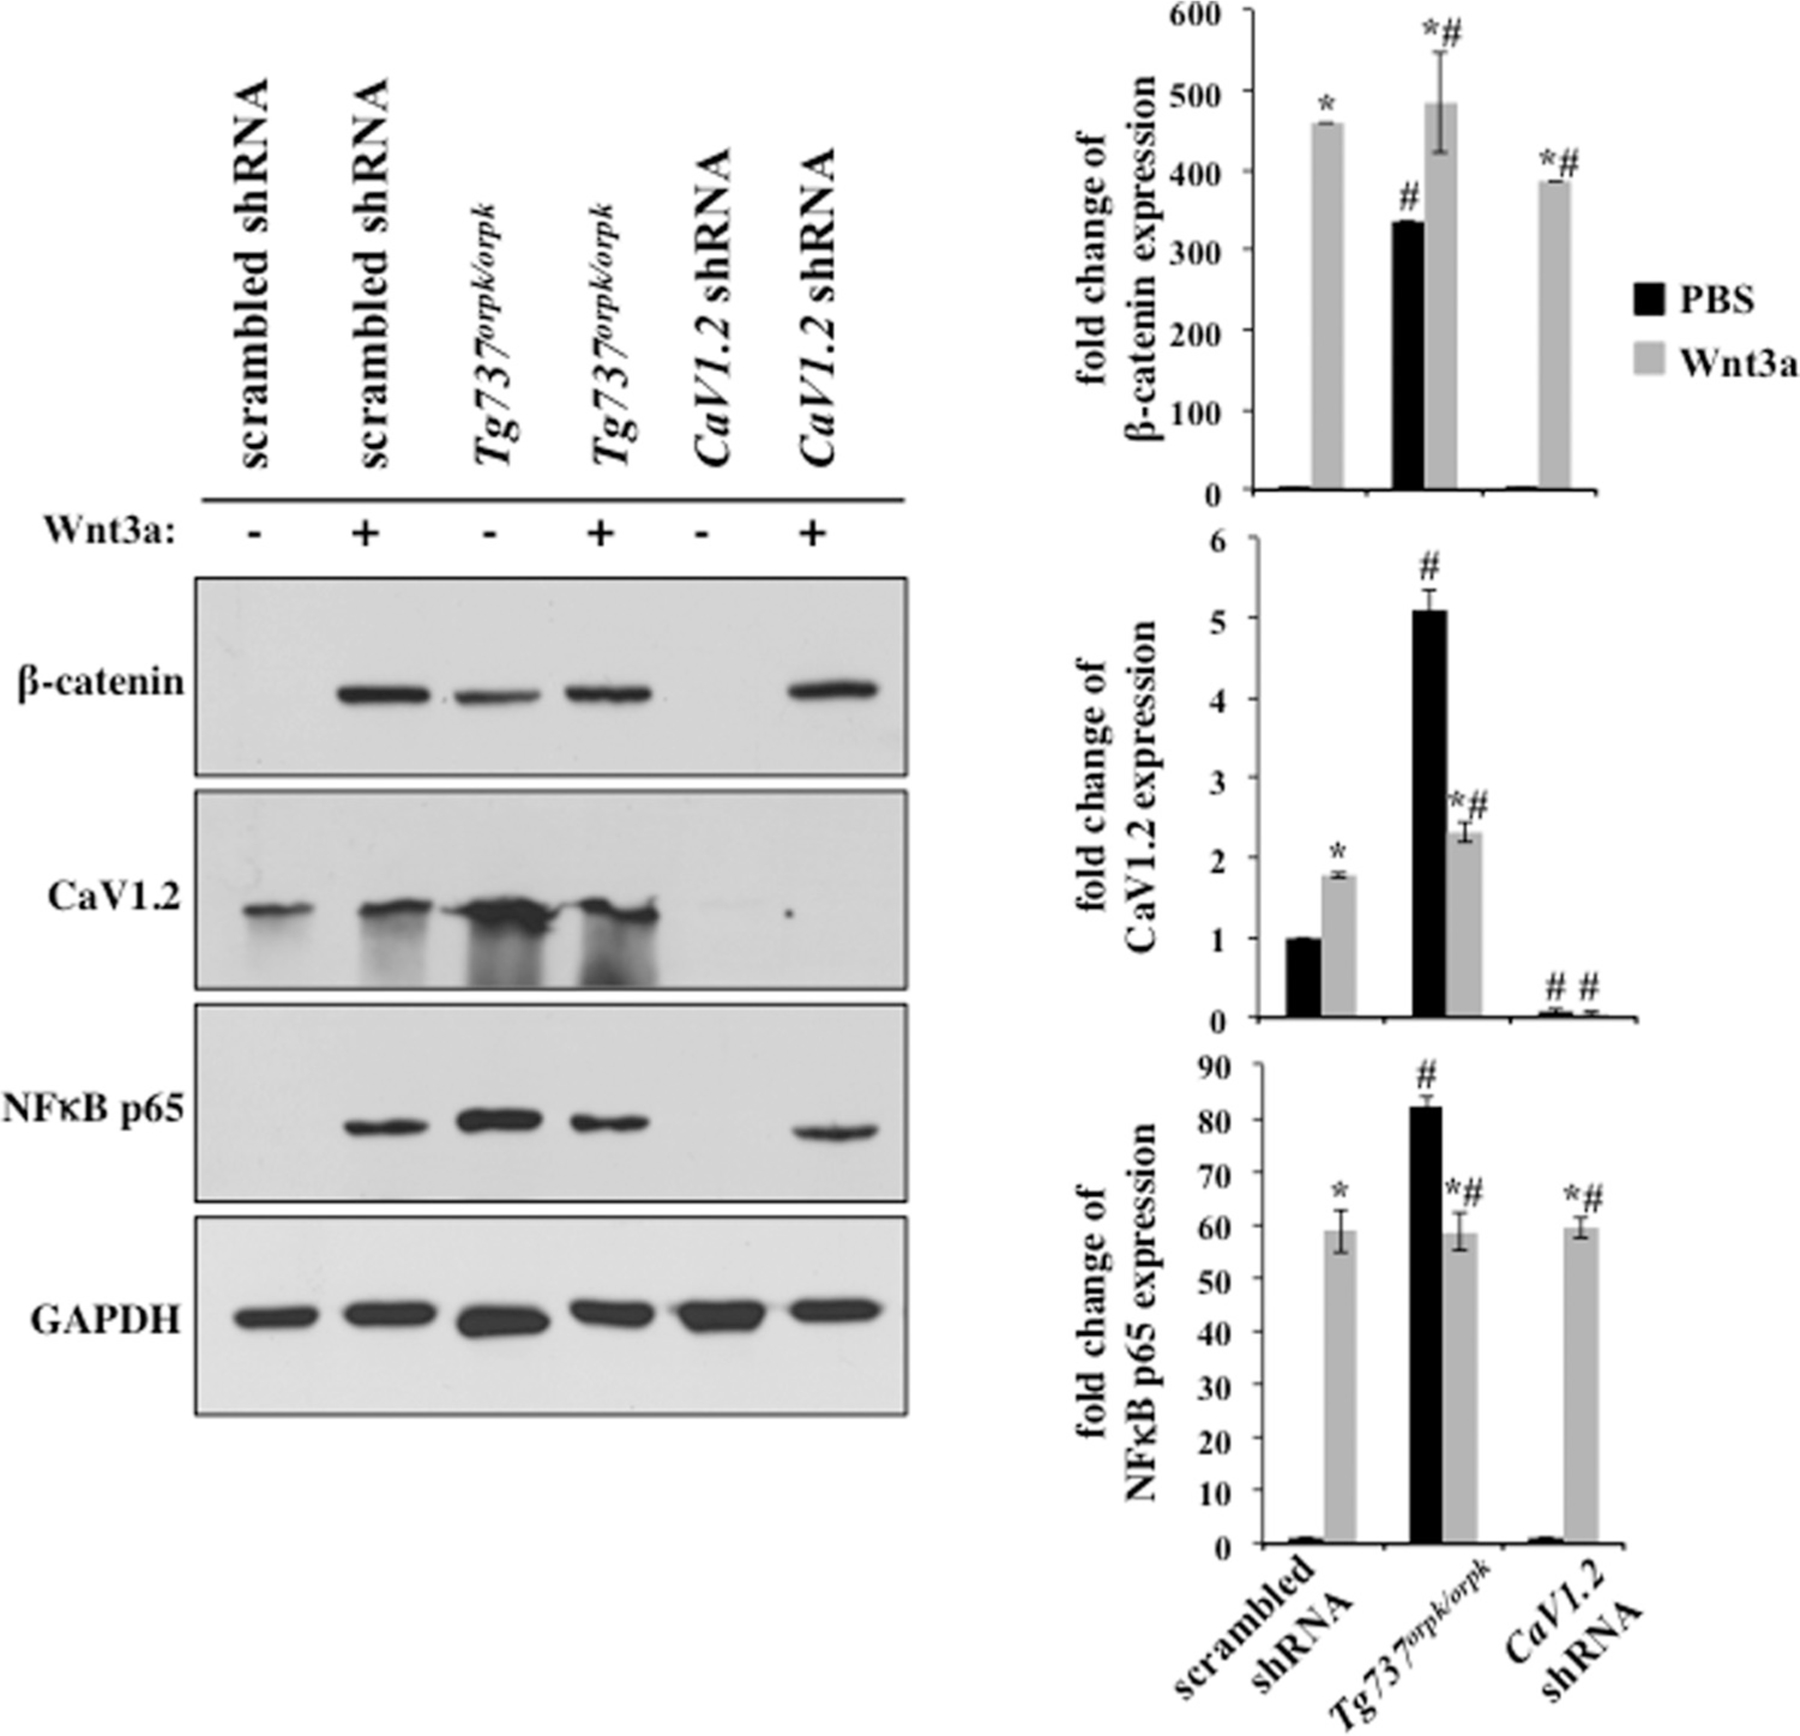
Cilia modulates Wnt signaling to regulate CaV1.2 expression. Western blotting was performed on cellular protein extracts. Wnt3a treatment increased β-catenin accumulation in all cells, however, Tg737orpk/orpk cells displayed high basal levels of β-catenin. NF-κB p65 was blotted as a readout for DNA damage response (DDR) to ROS induced DNA lesions. Wnt3a induced NF-κB p65 expression in scrambled and CaV1.2 shRNA cells but decreased NF-κB p65 in Tg737orpk/orpk cells. CaV1.2 was overexpressed in Tg737orpk/orpk cells. Wnt3a treatment induced CaV1.2 expression in scrambled shRNA while decreasing expression in Tg737orpk/orpk cells. Data normalized to GAPDH for analysis (N = 3). Asterisks indicate significant difference from the corresponding control group (P < 0.05). # signs denote significant difference from the corresponding scrambled shRNA group (P < 0.05).
The DNA damage response (DDR) is a cellular mechanism to recover from DNA lesions, such as 8-Oxoguanine (Kasai et al., 1984; Jackson and Bartek, 2009). One arm of this cell survival pathway is the activation of nuclear factor κB p65 (NFκB p65) (Janssens and Tschopp, 2006). Through Western blot analysis, we also found that Wnt3a induced NFκB p65 expression in scrambled and CaV1.2 shRNA (Fig. 5). On the other hand, Tg737orpk/orpk cells expressed a high basal level of NFκB p65 which decreased in response to Wnt3a. In addition, CaV1.2 expression was found to correlate with NFκB p65.
CaV1.2 knockdown zebrafish develop PKD phenotypes
We have shown that CaV1.2 localizes to primary cilia and have now elucidated the mechanism by which CaV1.2 expression is regulated in renal epithelial cells. To assess the biological significance of CaV1.2 expression, we used antisense morpholinos to knockdown CaV1.2 in zebrafish. Knockdown of the ciliary calcium channel polycystin-2 in zebrafish has been reported to result in PKD phenotypes including renal cyst formation, hydrocephalus, and left-right asymmetry (Obara et al., 2006). Our study showed that knockdown of pkd2 increased CaV1.2 expression (Fig. 6). This slight increase in CaV1.2 was significant compared to the control morpholino. Interestingly, similar phenotypes were observed in CaV1.2 morpholino (cav1.2 MO) zebrafish. Compared with a non-specific control morpholino (control MO) injection, cav1.2 MO zebrafish developed renal cysts (Fig. 7a), hydrocephalus (Fig. 7b) and various heart-looping defects (Fig. 7c). As generally accepted (Bakkers, 2011), left-right asymmetry was assessed by measuring the relative position of the cardiac atrium and ventricle with respect to the dorsal axis (Supplemental Movie 1).
Fig. 6.
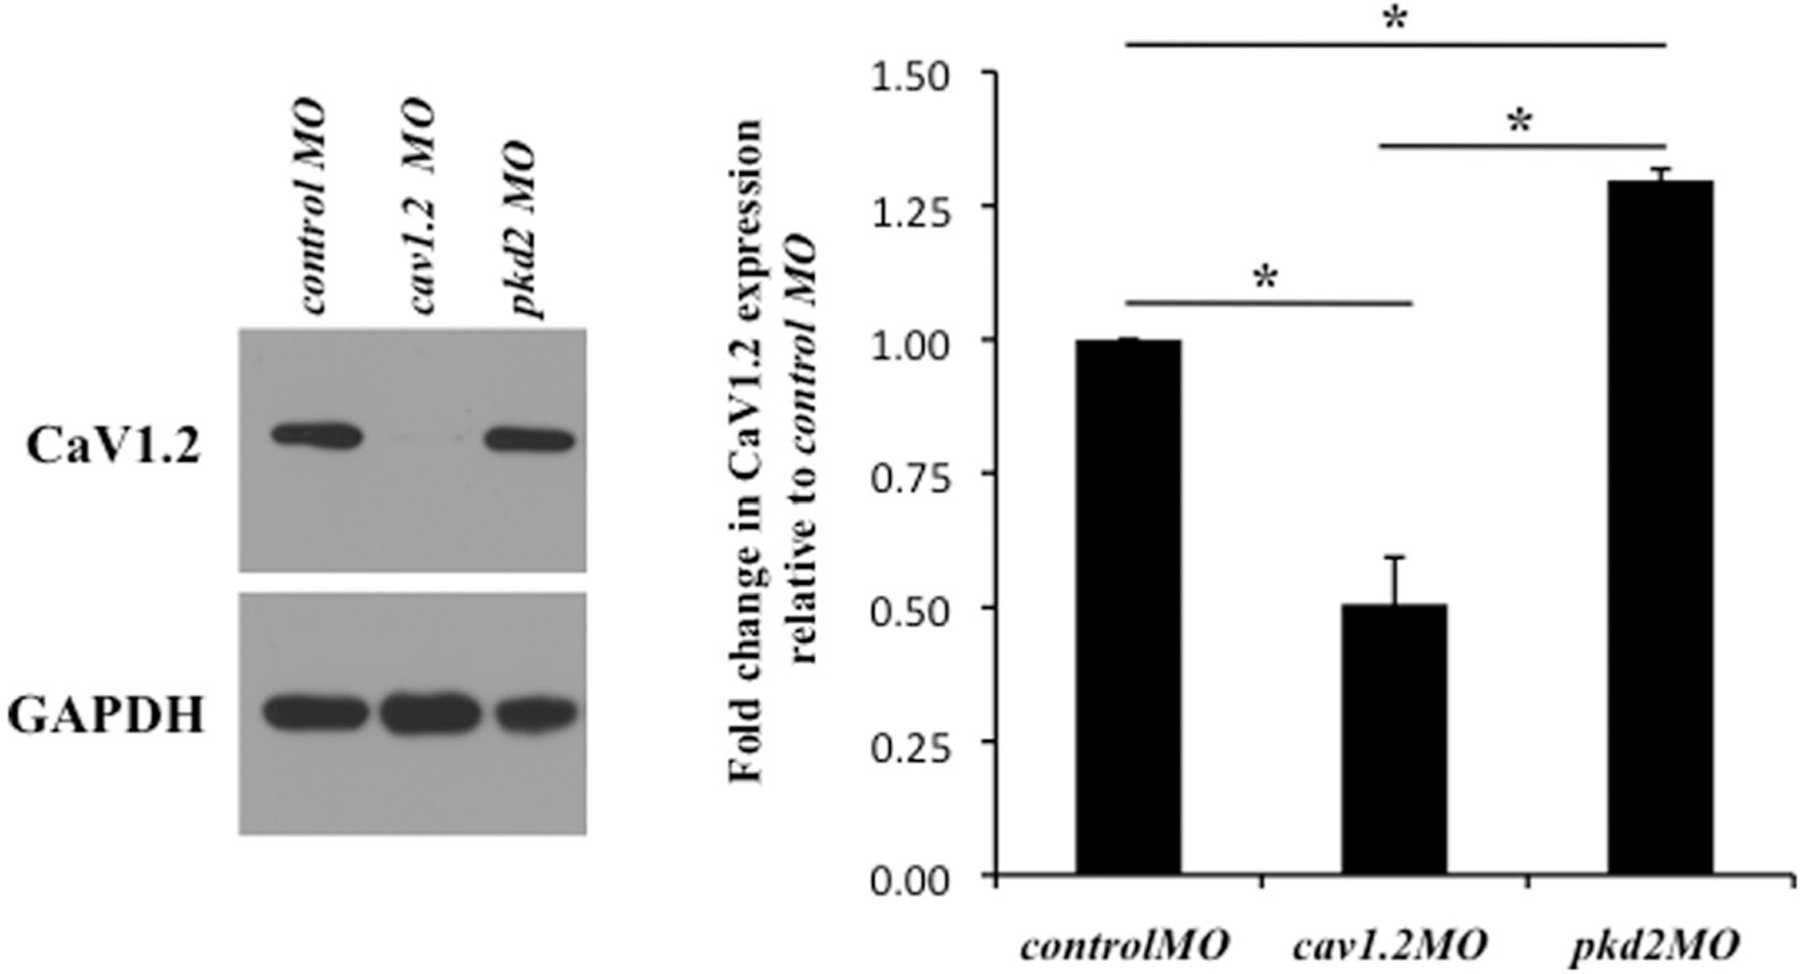
pkd2 knockdown increases CaV1.2 expression in zebrafish. Embryonic zebrafish protein extracts were obtained at 28 h postfertilization. Western blotting showed that cav1.2MO effectively reduced CaV1.2 expression compared with controlMO. pkd2MO zebrafish were used to further verify morpholino specificity. Results were quantified through one-way ANOVA with Tukey post-test. Statistical significance is reported with a mean difference at the 0.05 level and denoted with an asterisk (N = 3).
Fig. 7.
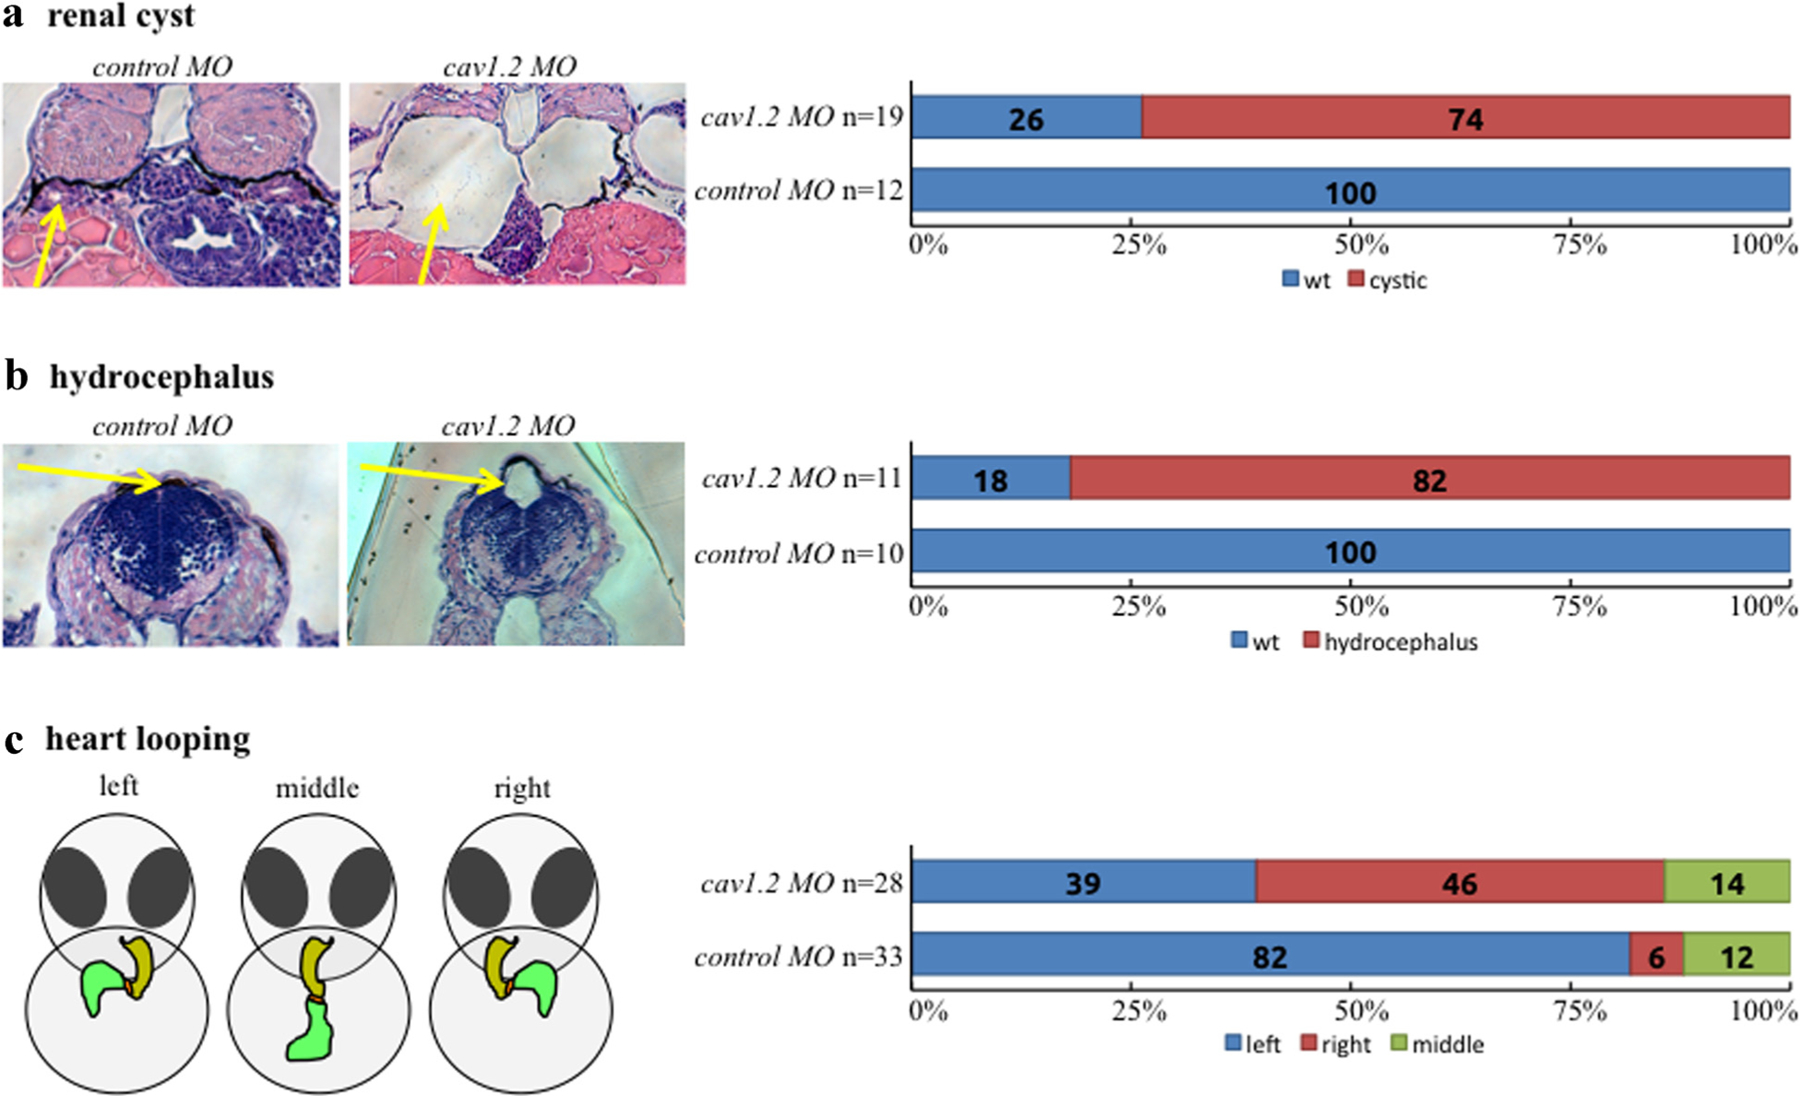
CaV1.2 knockdown zebrafish develop renal cysts, hydrocephalus, and left-right asymmetry defects. CaV1.2 was knocked down in zebrafish (cav1.2 MO) using morpholino microinjection and compared to a scrambled control morpholino (control MO) to assess phenotypes. Renal cyst formation (a) and hydrocephalus (b) were measured at 3 days postfertilization through standard H&E staining as indicated by arrows. Left-right asymmetry was determined by measuring heart looping (c) at 2 days postfertilization under live microscopy.
Discussion
Non-motile primary cilia have been found to play a critical role in Wnt signaling by restricting β-catenin accumulation. Overexpression of polycystin-1 (a ciliary signaling receptor) inhibits GSK3β and stabilizes β- catenin (Kim et al., 1999). Polycystin-2 (encoded by Pkd2) is calcium channel forming protein found in primary cilia. In Pkd2−/− embryos, cilia length was found to be decreased while β-catenin was upregulated (Kim et al., 2009). Interestingly, transgenic mice overexpressing β-catenin also developed cystic kidneys (Saadi-Kheddouci et al., 2001). Further, LRP6−/− (a component of the Wnt receptor complex) mouse embryos die in utero with cystic kidneys (Pinson et al., 2000). Thus, primary cilia and Wnt signaling play a crucial role in PKD (Corbit et al., 2008).
Given that Wnt signaling also modulates mitochondrial physiology (Yoon et al., 2010), we examined the role of cilia in regards to mitochondria. Tg737orpk/orpk contains an intron insertion at the 3′ end of the intraflagellar transport 88 (Ift88) gene which results in a hypomorphic mutation that prevents ciliogenesis (Moyer et al., 1994). We used Tg737orpk/orpk cells as a model for a cilia-deficient system. Through immunostaining, we confirmed the absence of cilia in Tg737orpk/orpk cells compared with control (Fig. 1). The voltage-gated L-type calcium channel CaV1.2 also localized to primary cilia. We generated a stable CaV1.2 shRNA cell line and observed no changes in primary cilia compared with control. Further, treatment with Wnt3a had no effect on cilia number or length in scrambled or CaV1.2 shRNA cells (data not shown). Thus, CaV1.2 does not seem to play a role in ciliogenesis.
Mitochondrial biogenesis, oxidative phosphorylation, and generation of reactive oxidative species (ROS) were increased in response to Wnt3a in control renal epithelial cells (Figures 2–4). The elevated levels of oxidative stress increased the formation of DNA lesions and the cellular DNA damage response (DDR). An interesting aspect of this response was an increase in expression of CaV1.2 (Fig. 5). In CaV1.2 knockdown cells, Wnt3a induced a similar effect on mitochondria and DDR. This data suggests that CaV1.2 is a downstream effector in regard to Wnt signaling. In cilia-deficient cells, Wnt3a was unable to induce mitochondrial biogenesis and decreased mitochondrial activity, ROS production, and DDR. CaV1.2 was found to be overexpressed in cilia-deficient cells as a compensatory mechanism; however, its expression decreased following Wnt3a treatment. Therefore, cilia length plays a role in regulating CaV1.2 expression through modulation of Wnt signaling.
Defective primary cilia, indicated by either depletion of key ciliary proteins or fundamental changes in structure/length, results in PKD phenotypes (Wilson, 2004). Here we show that CaV1.2 is a biologically significant ciliary protein. In the absence of CaV1.2 in zebrafish (Fig. 6), PKD phenotypes including renal cyst formation, hydrocephalus, and left-right asymmetry defects were observed (Fig. 7). Moreover, CaV1.2 was found to be overexpressed in pkd2 knockdown zebrafish. This is intriguing given that both CaV1.2 and PC2 are calcium channel forming proteins in the primary cilium, which further suggests a role for CaV1.2 in PKD pathogenesis. Therefore, CaV1.2 not only localizes to renal epithelial primary cilia, but it is also required for cilia function.
Although it has been known that abnormal Wnt signaling leads to renal cyst formation (Lancaster et al., 2009), the underlying mechanism has been unclear. One proposed explanation is that Wnt signaling regulates renal cell proliferation and planar cell polarity to maintain renal tubule homeostasis (Happe et al., 2009). Our present study further suggests that cilia regulate Wnt signaling which ultimately controls CaV1.2 expression. Therefore, in the absence of CaV1.2, ciliary function is compromised leading to formation of renal cysts. In addition, our study also shows a previously unrecognized relationship between primary cilia and mitochondrial function. Overall, we propose that Wnt3a induces β-catenin accumulation in a cilia-dependent manner. This in turn increases mitochondrial biogenesis, oxidative phosphorylation, and generation of ROS that cause genomic DNA damage. The DDR triggers NFκB p65 expression ultimately resulting in increased CaV1.2 expression.
Supplementary Material
Acknowledgments
This work was supported in part by DOD PR130153 and NIH DK080640.
Footnotes
Supporting Information
Additional supporting information may be found in the online version of this article at the publisher’s web-site.
Literature Cited
- Aberle H, Bauer A, Stappert J, Kispert A, Kemler R. 1997. Beta-catenin is a target for the ubiquitin-proteasome pathway. EMBO J 16:3797–3804. [DOI] [PMC free article] [PubMed] [Google Scholar]
- AbouAlaiwi WA, Takahashi M, Mell BR, Jones TJ, Ratnam S, Kolb RJ, Nauli SM. 2009. Ciliary polycystin-2 is a mechanosensitive calcium channel involved in nitric oxide signaling cascades. Circ Res 104:860–869. [DOI] [PMC free article] [PubMed] [Google Scholar]
- Aboualaiwi WA, Muntean BS, Ratnam S, Joe B, Liu L, Booth RL, Rodriguez I, Herbert BS, Bacallao RL, Fruttiger M, Mak TW, Zhou J, Nauli SM. 2013. Survivin-induced abnormal ploidy contributes to cystic kidney and aneurysm formation. Circulation. [DOI] [PMC free article] [PubMed] [Google Scholar]
- Bai RK, Perng CL, Hsu CH, Wong LJ. 2004. Quantitative PCR analysis of mitochondrial DNA content in patients with mitochondrial disease. Ann NY Acad Sci 1011:304–309. [DOI] [PubMed] [Google Scholar]
- Bakkers J 2011. Zebrafish as a model to study cardiac development and human cardiac disease. Cardiovasc Res 91:279–288. [DOI] [PMC free article] [PubMed] [Google Scholar]
- Boveris A, Chance B. 1973. The mitochondrial generation of hydrogen peroxide. General properties and effect of hyperbaric oxygen. Biochem J 134:707–716. [DOI] [PMC free article] [PubMed] [Google Scholar]
- Boveris A, Oshino N, Chance B. 1972. The cellular production of hydrogen peroxide. Biochem J 128:617–630. [DOI] [PMC free article] [PubMed] [Google Scholar]
- Brown TA, Clayton DA. 2002. Release of replication termination controls mitochondrial DNA copy number after depletion with 2′,3′-dideoxycytidine. Nucleic acids Res 30:2004–2010. [DOI] [PMC free article] [PubMed] [Google Scholar]
- Carter CS, Vogel TW, Zhang Q, Seo S, Swiderski RE, Moninger TO, Cassell MD, Thedens DR, Keppler-Noreuil KM, Nopoulos P, Nishimura DY, Searby CC, Bugge K, Sheffield VC. 2012. Abnormal development of NG2+PDGFR-alpha+ neural progenitor cells leads to neonatal hydrocephalus in a ciliopathy mouse model. Nat Med 18:1797–1804. [DOI] [PMC free article] [PubMed] [Google Scholar]
- Corbit KC, Shyer AE, Dowdle WE, Gaulden J, Singla V, Chen MH, Chuang PT, Reiter JF. 2008. Kif3a constrains beta-catenin-dependent Wnt signalling through dual ciliary and non-ciliary mechanisms. Nat Cell Biol 10:70–76. [DOI] [PubMed] [Google Scholar]
- Gerdes JM, Liu Y, Zaghloul NA, Leitch CC, Lawson SS, Kato M, Beachy PA, Beales PL, DeMartino GN, Fisher S, Badano JL, Katsanis N. 2007. Disruption of the basal body compromises proteasomal function and perturbs intracellular Wnt response. Nat Genet 39:1350–1360. [DOI] [PubMed] [Google Scholar]
- Happe H, Leonhard WN, van der Wal A, van de Water B, Lantinga-van Leeuwen IS, Breuning MH, de Heer E, Peters DJ. 2009. Toxic tubular injury in kidneys from Pkd1-deletion mice accelerates cystogenesis accompanied by dysregulated planar cell polarity and canonical Wnt signaling pathways. Hum Mol Genet 18:2532–2542. [DOI] [PubMed] [Google Scholar]
- Jackson SP, Bartek J. 2009. The DNA-damage response in human biology and disease. Nature 461:1071–1078. [DOI] [PMC free article] [PubMed] [Google Scholar]
- Janssens S, Tschopp J. 2006. Signals from within: The DNA-damage-induced NF-kappaB response. Cell Death Differ 13:773–784. [DOI] [PubMed] [Google Scholar]
- Jin X, Mohieldin AM, Muntean BS, Green JA, Shah JV, Mykytyn K, Nauli SM. 2013. Cilioplasm is a cellular compartment for calcium signaling in response to mechanical and chemical stimuli. Cell Mol Life Sci [DOI] [PMC free article] [PubMed] [Google Scholar]
- Kasai H 1997. Analysis of a form of oxidative DNA damage, 8-hydroxy-2′-deoxyguanosine, as a marker of cellular oxidative stress during carcinogenesis. Mutat Res 387:147–163. [DOI] [PubMed] [Google Scholar]
- Kasai H, Tanooka H, Nishimura S. 1984. Formation of 8-hydroxyguanine residues in DNA by X-irradiation. Gann 75:1037–1039. [PubMed] [Google Scholar]
- Kim E, Arnould T, Sellin LK, Benzing T, Fan MJ, Gruning W, Sokol SY, Drummond I, Walz G. 1999. The polycystic kidney disease 1 gene product modulates Wnt signaling. J Biol Chem 274:4947–4953. [DOI] [PubMed] [Google Scholar]
- Kim I, Ding T, Fu Y, Li C, Cui L, Li A, Lian P, Liang D, Wang DW, Guo C, Ma J, Zhao P, Coffey RJ, Zhan Q, Wu G. 2009. Conditional mutation of Pkd2 causes cystogenesis and upregulates beta-catenin. J Am Soc Nephrol 20:2556–2569. [DOI] [PMC free article] [PubMed] [Google Scholar]
- Lancaster MA, Louie CM, Silhavy JL, Sintasath L, Decambre M, Nigam SK, Willert K, Gleeson JG. 2009. Impaired Wnt-beta-catenin signaling disrupts adult renal homeostasis and leads to cystic kidney ciliopathy. Nat Med 15:1046–1054. [DOI] [PMC free article] [PubMed] [Google Scholar]
- Lancaster MA, Schroth J, Gleeson JG. 2011. Subcellular spatial regulation of canonical Wnt signalling at the primary cilium. Nat Cell Biol 13:700–707. [DOI] [PMC free article] [PubMed] [Google Scholar]
- Moyer JH, Lee-Tischler MJ, Kwon HY, Schrick JJ, Avner ED, Sweeney WE, Godfrey VL, Cacheiro NL, Wilkinson JE, Woychik RP. 1994. Candidate gene associated with a mutation causing recessive polycystic kidney disease in mice. Science 264:1329–1333. [DOI] [PubMed] [Google Scholar]
- Muntean BS, Horvat CM, Behler JH, Aboualaiwi WA, Nauli AM, Williams FE, Nauli SM. 2010. A comparative study of embedded and anesthetized zebrafish in vivo on myocardiac calcium oscillation and heart muscle contraction. Front Pharmacol 1:139. [DOI] [PMC free article] [PubMed] [Google Scholar]
- Muntean BS, Jin X, Nauli SM. Chapter 9: Primary cilia are mechanosensory organelles with chemosensory roles. Mechanosensitivity and mechanotransduction. ISBN: 978-994-007-2003-2009. [Google Scholar]
- Nauli SM, Alenghat FJ, Luo Y, Williams E, Vassilev P, Li X, Elia AE, Lu W, Brown EM, Quinn SJ, Ingber DE, Zhou J. 2003. Polycystins 1 and 2 mediate mechanosensation in the primary cilium of kidney cells. Nat Genet 33:129–137. [DOI] [PubMed] [Google Scholar]
- Nauli SM, Kawanabe Y, Kaminski JJ, Pearce WJ, Ingber DE, Zhou J. 2008. Endothelial cilia are fluid shear sensors that regulate calcium signaling and nitric oxide production through polycystin-1. Circulation 117:1161–1171. [DOI] [PMC free article] [PubMed] [Google Scholar]
- Norris DP. 2012. Cilia, calcium and the basis of left-right asymmetry. BMC Biol 10:102. [DOI] [PMC free article] [PubMed] [Google Scholar]
- Obara T, Mangos S, Liu Y, Zhao J, Wiessner S, Kramer-Zucker AG, Olale F, Schier AF, Drummond IA. 2006. Polycystin-2 immunolocalization and function in zebrafish. J Am Soc Nephrol 17:2706–2718. [DOI] [PMC free article] [PubMed] [Google Scholar]
- Pendergrass W, Wolf N, Poot M. 2004. Efficacy of MitoTracker Green and CMXrosamine to measure changes in mitochondrial membrane potentials in living cells and tissues. Cytometry A 61:162–169. [DOI] [PubMed] [Google Scholar]
- Pinson KI, Brennan J, Monkley S, Avery BJ, Skarnes WC. 2000. An LDL-receptor-related protein mediates Wnt signalling in mice. Nature 407:535–538. [DOI] [PubMed] [Google Scholar]
- Poot M, Pierce RH. 2001. Analysis of mitochondria by flow cytometry. Methods Cell Biol 64:117–128. [DOI] [PubMed] [Google Scholar]
- Saadi-Kheddouci S, Berrebi D, Romagnolo B, Cluzeaud F, Peuchmaur M, Kahn A, Vandewalle A, Perret C. 2001. Early development of polycystic kidney disease in transgenic mice expressing an activated mutant of the beta-catenin gene. Oncogene 20:5972–5981. [DOI] [PubMed] [Google Scholar]
- Wilson PD. 2004. Polycystic kidney disease. N Engl J Med 350:151–164. [DOI] [PubMed] [Google Scholar]
- Yoon JC, Ng A, Kim BH, Bianco A, Xavier RJ, Elledge SJ. 2010. Wnt signaling regulates mitochondrial physiology and insulin sensitivity. Genes Dev 24:1507–1518. [DOI] [PMC free article] [PubMed] [Google Scholar]
Associated Data
This section collects any data citations, data availability statements, or supplementary materials included in this article.


