

Abstract
Activation of G-protein-coupled receptors is the first step of the signaling cascade triggered by binding of an agonist. Here we compare the activation kinetics of the Gq-coupled M3 acetylcholine receptor (M3-AChR) with that of a constitutively active mutant receptor (M3-AChR-N514Y) using M3-AChR constructs that report receptor activation by changes in the fluorescence resonance energy transfer (FRET) signal. We observed a leftward shift in the concentration-dependent FRET response for acetylcholine and carbachol with M3-AChR-N514Y. Consistent with this result, at submaximal agonist concentrations, the activation kinetics of M3-AChR-N514Y were significantly faster, whereas at maximal agonist concentrations the kinetics of receptor activation were identical. Receptor deactivation was significantly faster with carbachol than with acetylcholine and was significantly delayed by the N514Y mutation. Receptor-G-protein interaction was measured by FRET between M3-AChR-yellow fluorescent protein (YFP) and cyan fluorescent protein (CFP)-Gγ2. Agonist-induced receptor-G-protein coupling was of a time scale similar to that of receptor activation. As observed for receptor deactivation, receptor-G-protein dissociation was slower for acetylcholine than that for carbachol. Acetylcholine-stimulated increases in receptor-G-protein coupling of M3-AChR-N514Y reached only 12% of that of M3-AChR and thus cannot be kinetically analyzed. G-protein activation was measured using YFP-tagged Gαq and CFP-tagged Gγ2. Activation of Gq was significantly slower than receptor activation and indistinguishable for the two agonists. However, Gq deactivation was significantly prolonged for acetylcholine compared with that for carbachol. Consistent with decreased agonist-stimulated coupling to Gq, agonist-stimulated Gq activation by M3-AChR-N514Y was not detected. Taken together, these results indicate that the N514Y mutation produces constitutive activation of M3-AChR by decreasing the rate of receptor deactivation, while having minimal effect on receptor activation.
Introduction
Almost two decades after its initial description by Costa and Herz (1989), constitutive receptor activity of G-protein-coupled receptors (GPCRs) is well established as a basic concept in receptor pharmacology (Costa and Cotecchia, 2005). Soon after the initial description of this phenomenon for δ-opioid peptide receptors (Costa and Herz, 1989), it was demonstrated that constitutive receptor activity could be artificially generated by mutations within the G-protein-coupling region of the β2-adrenergic receptor (Samama et al., 1993). Today it is well know that mutations in many different regions of a GPCR can lead to constitutive receptor activity (Pauwels and Wurch, 1998; Seifert and Wenzel-Seifert, 2002; Spalding and Burstein, 2006; Smit et al., 2007). Such mutations also occur naturally and are the cause of diseases such as precocious puberty (luteinizing hormone receptor), congenital stationary night blindness (rhodopsin), and hyperthyroidism (thyroid-stimulating hormone receptor) (Adan, 2006; Smit et al., 2007). The phenomenon of constitutive receptor activity was rapidly introduced into theoretical receptor concepts (Leff, 1995), which describe receptor activity as an equilibrium between an inactive (R) and an active state (R*) of the receptor. This theoretical framework explained observations such as increased basal receptor activity and increased agonist affinity as well as ligands that reduce basal receptor activity (termed inverse agonists) (Kenakin, 2001; Strange, 2002). The use of inverse agonists in a clinical setting has also been discussed (Milligan, 2003; Bond and Ijzerman, 2006), and the physiological relevance of inverse agonism in control of body weight has been demonstrated clearly (Adan and Kas, 2003).
Constitutive receptor activity has been mostly studied by use of quantitative second messenger determination or guanosine 5′-O-(3-thio)triphosphate binding assays (Seifert and Wenzel-Seifert, 2002), but not at the receptor level itself. Several different mutations have been demonstrated to cause constitutive receptor activity for the muscarinic acetylcholine receptor family (Spalding and Burstein, 2006). In particular, the amino acid in position 6.58 [according to the Ballesteros/Weinstein numbering scheme (Ballesteros and Weinstein, 1995)] at the interface of transmembrane domain (TM) 6 and the extracellular loop was shown to cause constitutive activity in all five muscarinic AChR subtypes (Spalding et al., 1997; Ford et al., 2002; Dowling et al., 2006; Nelson et al., 2006), whereas alternative mutations in the E/DRY motif in TM3 or in the NPXXY motif in TM7 close to the cytoplasmic side (Spalding and Burstein, 2006; Smit et al., 2007) did not cause constitutive activity at the M1-AChR. This particular position corresponds to amino acid 514 in the human M3-AChR, and the mutation N514Y within the human M3-AChR has been thoroughly characterized for its effects on basal receptor activity, agonist affinity, and inverse agonist effects (Dowling et al., 2006).
Over the past few years, we have reported the generation of conformational sensors based on fluorescence resonance energy transfer (FRET) for different GPCRs (Vilardaga et al., 2003; Hoffmann et al., 2005; Zürn et al., 2009; Maier-Peuschel et al., 2010; Alvarez-Curto et al., 2011; Ziegler et al., 2011). Such conformational sensors are usually modified with CFP at the C terminus and a second fluorophore (YFP or a tetracysteine-motif capable of binding a small soluble fluorophore called FlAsH) within the third intracellular loop of the receptor (Hoffmann et al., 2008; Vilardaga et al., 2009). Upon agonist binding, a change in receptor conformation occurs, and, hence, these receptor sensors respond with an alteration in the observed FRET signal. Thereby, receptor activation can be monitored in real time and in intact cells (Vilardaga et al., 2009; Lohse et al., 2012).
Here we studied the effects of the N514Y mutation within such a sensor for the M3-AChR. Unlike potential alternative mutations in the E/DRY motif in TM3 or in the NPXXY motif in TM7 close to the cytoplasmic side (Spalding and Burstein, 2006; Smit et al., 2007), this mutation is located far away from both fluorophore attachment sides and thus is supposed to be best suited to study constitutive receptor activity without possible interference with the fluorescent groups on the cytoplasmic side. With these techniques, we investigated the activation and inactivation behavior of wild-type versus constitutively active mutant receptors in intact cells. Furthermore, we investigated dynamic receptor-G-protein coupling, receptor-mediated G-protein activation, and receptor-mediated PLC activity stimulated by acetylcholine and carbachol in living cells.
Materials and Methods
Materials.
Acetylcholine and atropine were purchased from Sigma-Aldrich (Steinheim, Germany). Carbachol was purchased from Alfa Aesar (Karlsruhe, Germany). [3H]N-Methyl-scopolamine was purchased from GE Healthcare (Chalfont St. Giles, Buckinghamshire, UK). Cell culture reagents were supplied from PAN-Biotech GmbH (Aidenbach, Germany). Effectene was purchased from QIAGEN GmbH (Hilden, Germany). The cDNA for the human M3-AChR was purchased from the cDNA Resource Center (University of Missouri−Rolla, Rolla, MO) at cDNA.org. All PCR primers were synthesized by MWG-Biotech GmbH (Ebersberg, Germany). Sequencing reactions were done by Eurofins Medigenomix GmbH (Martinsried, Germany). All other chemicals were provided from commercial suppliers at the highest purity grade available.
Molecular Biology.
The enhanced variants of CFP or YFP (BD Bioscience Clontech, Heidelberg, Germany) were fused to the human M3-AChR by the standard PCR extension overlap technique (Ho et al., 1989). In each case, the C-terminal stop codon of the receptor and the initial codon for methionine of the fluorescent protein were deleted. All resulting constructs were cloned into pcDNA3 (Invitrogen, Carlsbad, CA) and confirmed by sequencing.
The generation of the M3-ACh-Flash3-CFP receptor construct has been described in detail previously (Ziegler et al., 2011). In brief, the third intracellular loop was truncated (Δ271–465) and the tetracysteine motif for specific FlAsH binding was inserted instead using an EcoRI site. Thus, the modified sequence of the third loop reads LQACCPGCCEFAL. In addition, the construct was C-terminally fused with CFP. The M3-ACh-Flash3-CFP-N514Y mutant receptor construct was generated by further addition of a point mutation. To generate YFP-tagged receptor constructs, the human M3-AChR was C-terminally fused with YFP by insertion of an XbaI site. Thus, the fusing sequence between the M3-AChR and YFP reads EQALSRVSK. The M3-AChR-YFP-N514Y mutant receptor construct was generated by further addition of a point mutation. The construction of CFP-Gγ2, Gβ1 (Hein et al., 2005), and Gαq-YFP was described previously (Hughes et al., 2001). The YFP-PLC-δ1-PH probe was described previously (Stauffer et al., 1998) and kindly provided by Tobias Meyer.
Cell Culture.
HEK293 cells were maintained in Dulbecco's modified Eagle's medium with 4.5 g/l glucose, 10% fetal calf serum, 100 U/ml penicillin G, and 100 μg/ml streptomycin sulfate at 37°C and 7% CO2. Cells were routinely passaged every 2 to 3 days. Culture medium for cells stably expressing the receptor constructs were additionally supplemented with 200 μg/ml G418.
Transfection of HEK293 Cells for Microscopic Analysis.
HEK293 cells were seeded onto poly-d-lysine (1 mg/ml)-coated 24-mm glass coverslips to approximately 50% confluence. Four to 6 h after attachment, the cells were transfected using Effectene according to the manufacturer's instructions. The following amounts of DNA were used per well: 0.5 μg of M3-ACh-Flash3-CFP (receptor activation); 0.4 μg of M3-ACh-YFP, 2 μg of Gαq, 0.5 μg of Gβ1, and 0.2 μg of CFP-Gγ2 (receptor-G-protein coupling); 0.4 μg of M3-ACh, 1.2 μg of Gαq-YFP, 0.35 μg of Gβ1, and 0.1 μg of CFP-Gγ2, (G-protein activation); and 0.3 μg of respective receptor DNA and 0.2 μg of YFP-PLC-δ1-PH (PLC activity). The amount of DNA was adjusted to transfect equal amounts of DNA per well using empty pcDNA3 vector. Medium was exchanged 12 to 16 h later, and cells were analyzed 48 h after transfection.
FlAsH Labeling.
The labeling was done as described previously (Hoffmann et al., 2005, 2010). In brief, transfected cells were washed twice on the coverslips with HBSS containing 1 g/l glucose and then were incubated at 37°C for 1 h with HBSS-500 nM FlAsH supplemented with 12.5 μM 1,2-ethane dithiol. Then, to reduce nonspecific labeling, the cells were washed twice with HBSS, incubated for 10 min with HBSS-250 μM 1,2-ethane dithiol, and again washed twice with HBSS before being used for fluorescence measurements.
Confocal Microscopy.
Confocal microscopy experiments were performed on a TCS SP2 system (Leica, Wetzlar, Germany). Coverslips with transfected HEK293 cells were mounted using an Attofluor holder (Molecular Probes, Leiden, The Netherlands). Images were taken with a 63× objective. CFP was excited with a 430-nm diode laser using a DCLP455 dichroic mirror. Fluorescence intensities were recorded from 470 to 550 nm. YFP was excited with the 514-nm line of an argon laser and a dual beamsplitter (458/514 nm). Fluorescence intensities were recorded from 525 to 600 nm. Settings for recording images were kept constant: 512 × 512 pixel format, line average 4, and 400 Hz, resulting in an image acquisition time of 4 s.
Quantification of YFP-PLC-δ1-PH translocation was done with the Leica software package (version 2.5). Regions of interest were defined in the cytosol and quantified over the time recorded. Care was taken that slight movements of the cells did not result in misplacement of the defined region of interest either onto the membrane or into the nuclear region. To correct for possible photobleaching, control regions that included whole cells were defined and were used to correct the images in the cytosolic regions of interest. The resulting fluorescence intensity values were then normalized to the initial value and plotted against time to quantify YFP-PLC-δ1-PH translocation into the cytosol.
Solely for display reasons, but not for quantitative analyses, individual images were corrected for autocontrast using Photoshop software (version 6.0).
FRET Measurements.
FRET measurements were performed as described previously (Vilardaga et al., 2003; Hein et al., 2005; Hoffmann et al., 2005). Cells transfected as described above were washed with HBSS and maintained in buffer A (140 mM NaCl, 5 mM KCl, 2 mM CaCl2, 1 mM MgCl2, and 10 mM HEPES, pH 7.3) at room temperature. Coverslips were mounted on an Attofluor holder and placed on an inverted microscope (Axiovert 135; Carl Zeiss GmbH, Jena, Germany) equipped with an oil immersion 63x objective and a dual-emission photometric system (Till Photonics, Gräfelfing, Germany). Samples were excited with light from a polychrome IV (Till Photonics). To minimize photobleaching, the illumination time was set to 10 to 40 ms, applied with a frequency of 10 Hz. Kinetic experiments were performed using an illumination time of 10 ms, applied with a frequency of 20 or 50 Hz. The fluorescence signal was recorded from a single cell. FRET was monitored from the emission ratio of YFP to CFP, F535/F480 (emission intensities at 535 ± 15 and 480 ± 20 nm, beamsplitter DCLP 505 nm) upon excitation at 436 ± 10 nm (beamsplitter DCLP 460 nm). The YFP or FlAsH emission upon excitation at 480 nm was recorded at the beginning of each experiment to subtract direct excitation of YFP or FlAsH (YFP or FlAsH emission at 436 nm excitation/YFP or FlAsH emission at 480 nm excitation was 0.065). The emission ratio was corrected by the spillover of CFP into the 535-nm channel (spillover of YFP into the 480-nm channel was negligible) to give a corrected ratio F*535/F*480. To determine agonist-induced changes in FRET, cells were continuously superfused with buffer A, and agonist was applied using a computer-assisted solenoid valve-controlled rapid superfusion device ALA-VM8 (solution exchange 5–10 ms; ALA Scientific Instruments, Farmingdale, NY). Signals detected by photodiodes were digitized using an AD converter (Digidata1322A; Molecular Devices, Sunnyvale, CA) and stored using Clampex 8.1 software (Molecular Devices).
Results
FRET-Based Muscarinic M3-AChR Sensor.
The generated M3-ACh-Flash3-CFP receptor construct was expressed on the cell surface of HEK293 cells and responded with an increase in the FRET ratio upon superfusion with the agonist acetylcholine or carbachol (Supplemental Fig. 1). Into this receptor construct, we introduced an additional point mutation N514Y (M3-ACh-Flash3-CFP-N514Y) at the extracellular portion of TM6 that had been described previously to cause constitutive receptor activity for the M3-AChR (Dowling et al., 2006). We particularly chose that mutation over others described to cause constitutive activity at muscarinic receptors (Spalding and Burstein, 2006) because it is well out of reach from the intracellular site of the receptor where the fluorophores had been attached. The additional mutation did not alter receptor expression on the cell surface as shown in Supplemental Fig. 1. Comparable to the wild-type M3-ACh-Flash3-CFP receptor construct, the constitutively active receptor construct responded with an increase in the FRET ratio upon superfusion with acetylcholine or carbachol (Supplemental Fig. 1).
Atropine has been reported to act as a neutral antagonist at the M3-AChR and as an inverse agonist at the M3-AChR-N514Y variant (Dowling et al., 2006). Therefore, we tested both receptor constructs with respect to their response to atropine. The receptor constructs were first superfused with carbachol and after a short washout period were exposed to 1 μM atropine. As shown in Fig. 1A, the wild-type M3-ACh-Flash3-CFP receptor construct did not respond to atropine, whereas the constitutively active receptor construct responded with a decrease in the FRET ratio upon superfusion with 1 μM atropine (Fig. 1B). As for several constitutively active receptors, the N514Y mutation has been described to shift the agonist binding curve to higher affinity (Dowling et al., 2006). Because we had previously shown that the change in the FRET signal corresponds well with agonist binding (Hoffmann et al., 2005; Ziegler et al., 2011), we investigated the concentration-dependent change in the FRET signal evoked by acetylcholine or carbachol for both receptor constructs. The maximally obtained change in FRET was set as 100%, and the change observed for each agonist concentration was normalized to this value. The data obtained were plotted against the ligand concentration as depicted in Fig. 1C for acetylcholine or Fig. 1D for carbachol. A clear and approximately 10-fold left shift was observed for acetylcholine and carbachol at the constitutively active mutant receptor (Fig. 1, C and D). Furthermore, in Fig. 1, A and B, and Supplemental Fig. 1, it can also be seen that the constitutively active mutant receptor exhibited only a 6% maximal change compared with the 10% maximal change for the wild-type construct. Thus, we conclude that we generated tools that would enable us to study receptor dynamics of the M3-AChR and a constitutive receptor variant in more detail.
Fig. 1.

Effects of ligands on the FRET response of the M3-ACh receptor sensors. HEK293 cells were transfected with M3-AChR-Flash3-CFP or M3-AChR-Flash3-CFP-N514Y and labeled with FlAsH as described. A, the trace depicted represents the recording of a FRET ratio of an individual cell expressing the M3-ACh-Flash3-CFP receptor construct when superfused with the agonist (carbachol) or the antagonist (atropine) as indicated. B, FRET ratio of an individual cell expressing the M3-ACh-Flash3-CFP-N514Y receptor construct when superfused with carbachol or atropine. Data in A and B are representative of at least 10 different recordings on 3 different experimental days. C, concentration-response curves for the FRET changes evoked by ACh at the M3-ACh-Flash3-CFP (□) or M3-ACh-Flash3-CFP-N514Y (■). EC50 values were 0.22 ± 0.04 and 0.029 ± 0.003 μM, respectively (means ± S.E., n = 12–15). D, concentration-response curves for the FRET changes evoked by carbachol at the M3-ACh-Flash3-CFP (○) or M3-ACh-Flash3-CFP-N514Y (●) receptor. EC50 values were 1.9 ± 0.1 and 0.20 ± 0.07 μM, respectively, (means ± S.E., n = 12–15). Data for the M3-ACh-Flash3-CFP receptor construct were published previously (Ziegler et al., 2011).
Receptor Activation and Deactivation Kinetics.
The maximal activation kinetics for the M3-ACh-Flash3-CFP receptor construct are consistent with kinetics that were observed for other small-molecule binding receptors (Hoffmann et al., 2005; Nikolaev et al., 2006, Zürn et al., 2009; Ziegler et al., 2011). Therefore, we wanted to compare the kinetics of wild-type receptor activation with those for the constitutively active receptor variant. For both receptor constructs and each agonist concentration, the agonist-induced changes in FRET were analyzed by an exponential fit as described previously (Vilardaga et al., 2003; Hoffmann et al., 2005; Ziegler et al., 2011). The values obtained are τ values (time constants), equal to t1/2 values divided by ln2. The same kinetic analysis was also performed for receptor deactivation by fitting the decline of the agonist-induced changes in FRET signal after the agonist solution was changed back to superfusion with buffer. The results are presented in Fig. 2.
Fig. 2.

Kinetics of ligand-mediated changes in the FRET ratio. HEK293 cells were transfected with the M3-ACh-Flash3-CFP or M3-ACh-Flash3-CFP-N514Y receptor and labeled with FlAsH as described. A and B, recordings were done in single cells with 10 to 50 Hz, and the kinetics of the change in the FRET ratio were analyzed by exponential fitting. Time constants (τ) are plotted against ligand concentration. A (ACh), data for the M3-ACh-Flash3-CFP receptor (light gray columns) and the M3-ACh-Flash3-CFP-N514Y receptor construct (crossed pattern columns). B (carbachol), data for M3-ACh-Flash3-CFP receptor (dark gray columns) and the M3-ACh-Flash3-CFP-N514Y receptor construct (crossed pattern columns). C and D, maximal receptor activation kinetics were compared with receptor deactivation kinetics. Deactivation kinetics were analyzed similarly to activation kinetics. C, data for ACh (light gray) and carbachol (dark gray) at the M3-ACh-Flash3-CFP receptor. D, data for ACh (light gray, crossed pattern) and carbachol (dark gray, crossed pattern) at the M3-ACh-Flash3-CFP-N514Y receptor. Columns represent data for 100 μM agonist except for maximal activation data for carbachol (1 mM). Each column represents mean ± S.E. values from 12 to 17 different cells recorded in three to four independent experiments. *, p < 0.05; **, p < 0.01; ***, p < 0.001 (independent t test). wt, wild-type.
As observed previously, receptor activation occurs increasingly faster with higher agonist concentrations (indicated by lower τ values) (Vilardaga et al., 2003; Hoffmann et al., 2005) and reaches a maximum at saturating agonist concentrations (Fig. 2, A and B). However, comparison of M3-ACh-Flash3-CFP and M3-ACh-Flash3-CFP-N514Y shows that at subsaturating agonist concentrations, the constitutively active mutant switches significantly faster. However, both receptor constructs reached the same maximal activation kinetics. Furthermore, maximal activation kinetics for acetylcholine and carbachol were equally fast. When receptor deactivation kinetics were analyzed, a different picture emerged. First, for both receptor constructs, the change in FRET signal declined significantly slower than receptor activation and slower for acetylcholine than for carbachol (Fig. 2, C and D). Second, the FRET signal declined significantly slower for the constitutively active receptor as indicated by much larger τ values (compare Fig. 2, C and D; please note the different time scale in Fig. 2D). Furthermore, receptor deactivation kinetics were found to be independent of agonist concentrations (data not shown).
Receptor-G-Protein Interaction.
The next step in the signaling cascade of GPCRs is the interaction between receptor and G-proteins. We examined receptor-G-protein coupling by measuring FRET between the YFP-tagged M3-AChR and Gq-proteins, whose Gγ-subunits were labeled with CFP. The basic approach has been described previously (Hein et al., 2005, 2006; Jensen et al., 2009). Again, fluorescence of a single cell was measured while the cell was superfused with buffer or agonist solution. Figure 3, A and B, shows representative traces of an individual experiment. Upon agonist application, a rapid increase in the FRET ratio was observed (Fig. 3A). The individual trace for CFP decreased (Fig. 3B, upper trace), whereas the YFP intensity increased (Fig. 3B, lower trace). These results are consistent with previously published observations for receptor-G-protein coupling (Hein et al., 2005, 2006; Jensen et al., 2009). Upon agonist application, the signal quickly reached a plateau but rapidly decreased if superfusion was again changed to buffer. This behavior allowed us to analyze the kinetics of receptor-G-protein interaction in a ligand-dependent manner. The kinetics of receptor-G-protein interaction were fast (Fig. 3C) and similar to the maximal activation kinetics of receptor activation (Fig. 2C). Interaction kinetics were identical for acetylcholine or carbachol. Dissociation of receptor and G-protein was delayed and took significantly longer for acetylcholine than for carbachol. Because the signal amplitude was stable at a 4% increase, we measured FRET between the tagged M3-AChR and tagged Gγ-subunits in an agonist concentration-dependent manner for both ligands. The change in the FRET signal at saturating ligand concentrations was set as 100%, and all values were calculated accordingly. The corresponding concentration-response curves are shown in Fig. 3D. It can be seen that acetylcholine has a roughly 10-fold higher potency for receptor-G-protein coupling than carbachol. This observation is in very good agreement with the difference in receptor activation for both ligands (Fig. 1, C and D).
Fig. 3.

Analysis of receptor-G-protein interaction by FRET. FRET was measured between M3-AChR-YFP and CFP-tagged Gγ2. Excitation of CFP at 436 nm shifts the emission from 480 to 535 nm when the two fluorophores are close enough to permit FRET. A, HEK293 cells transiently expressing M3-AChR-YFP together with CFP-Gγ2 (and Gαq and β1) were superfused with 100 μM carbachol. This resulted in a rapid increase in FRET, as seen by the increase in the normalized FRET ratio (FYFP/FCFP). The increase in FRET was readily reversible upon agonist washout. B, upon superfusion with 100 μM carbachol, a decrease in CFP fluorescence and an increase in YFP fluorescence was observed. C, maximal receptor-G-protein interaction kinetics were compared with receptor-G-protein dissociation kinetics. Deactivation kinetics were analyzed similarly to activation kinetics. C, data for ACh (light gray) and carbachol (dark gray) for M3-AChR-YFP (data represent means ± S.E. values; n = 9 for each column). D, concentration-response curves for the M3-ACh receptor-G-protein interaction quantified by the amplitude of the ligand-evoked FRET changes. For ACh (□) EC50 values were 0.14 ± 0.02 μM, whereas for carbachol (○) EC50 values were 1.46 ± 0.26 μM, respectively (means ± S.E.; n = 10–12 for each ligand concentration). **, p < 0.01 (independent t test). AU, arbitary units.
Because the phenomenon of constitutive receptor activity has been described mainly by determining accumulation of second messengers (Seifert and Wenzel-Seifert, 2002; Smit et al., 2007), we wanted to investigate what influence constitutive receptor activity had on the dynamics of receptor-G-protein coupling. Therefore, we measured FRET between the YFP-tagged M3-AChR-N514Y and Gq, using the CFP-tagged Gγ2. Experiments were performed in parallel to those for the YFP-tagged wild-type M3-AChR. In Fig. 4A receptor expression was verified by confocal microscopy, demonstrating cell surface localization of receptors by YFP excitation, whereas Gγ2 subunits were visualized by excitation of CFP. For both receptor constructs, a clear expression at the cell surface together with Gγ2 was verified. However, we observed only a very small increase in ACh-stimulated receptor-G-protein coupling for M3-AChR-N514Y compared with that for the wild-type M3-AChR. The increase in the signal could only be analyzed with respect to the maximal amplitude, which was found to be 0.5% and thus only 12 ± 7% of the wild-type M3-AChR signal amplitude (Fig. 4A, right panel). This small increase did not permit reliable recordings of interaction kinetics or measurements of concentration-response curves for the receptor-G-protein interaction of M3-AChR-N514Y.
Fig. 4.
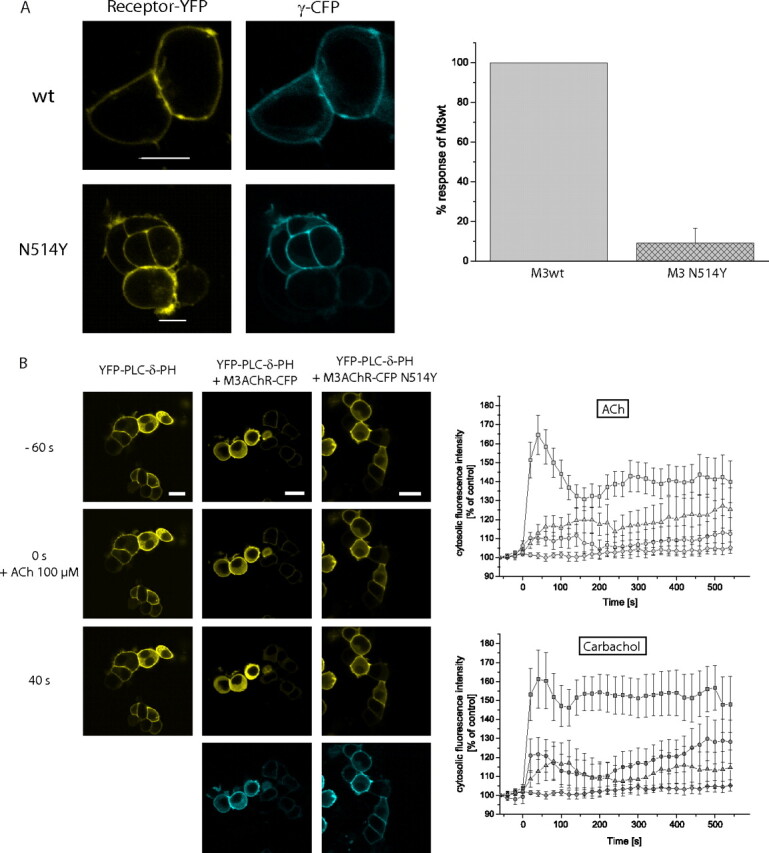
Analysis of M3-AChR-N514Y signaling dynamics in HEK293 cells. A, in HEK293 cells transiently expressing M3-AChR-YFP or M3-AChR-YFP-N514Y together with CFP-Gγ2 (and Gαq and β1) receptor (left) and Gγ2 (right) colocalize at the cell membrane (white scale bar, 10 μM). Upon stimulation with 100 μM ACh, the FRET ratio increased (see also Fig. 3) on average 4.0% for the M3-AChR-YFP receptor, whereas the average increase was only 0.5% for the M3-AChR-YFP-N514Y receptor (n = 7). B, in HEK293 cells transiently expressing YFP-PLC-δ1-PH alone or together with the M3-AChR-CFP or M3-AChR-CFP N514Y, YFP-PLC-δ1-PH and receptor localize to the plasma membrane (top row and CFP image, middle and right columns). Upon addition of ACh, PtdIns(4,5)P2 is converted to diacylglycerol and inositol 1,4,5-trisphosphate. Thus, the fluorescent probe relocates into the cytosol (middle row 0 s and bottom row 40 s). Scale bars, 20 μm. The dynamic increase in cytosolic fluorescence was quantified and plotted against time for each receptor construct tested. The upper right panel represents data for 100 μM ACh (data for HEK cells without M3-AChR (diamonds), data for HEK293 cells with M3-AChR-CFP (squares), data for HEK cells with M3-AChR-CFP-N514Y (triangles), and data for HEK cells with M3-AChR-N514Y (circles). The lower right panel shows the same experiments done with 1 mM carbachol (diamonds represent data for HEK293 cells without M3-AChR, squares represent data for HEK cells with M3-AChR-CFP, triangles represent data for HEK cells with M3-AChR-CFP-N514Y, and circles represent data for HEK cells with M3-AChR-N514Y). Each point represents mean ± S.E. values from 14 to 18 different cells recorded in five to seven independent experiments.
To investigate whether this small agonist-dependent increase in G-protein coupling could be detected downstream in the signaling cascade in intact cells, we used a fluorescent probe that consists of the PLC-δ1 PH domain, which was tagged with YFP (Stauffer et al., 1998). The PH domain binds to PtdIns(4,5)P2 and thus localizes to the plasma membrane and can be visualized by localization of YFP at the membrane. Upon Gq-coupled receptor activation, PLC is activated and PtdIns(4,5)P2 is converted to diacylglycerol and inositol 1,4,5-trisphosphate. Thus, the fluorescent probe relocates into the cytosol, which can be measured by an increase in cytosolic fluorescence intensity (Várnai and Balla, 2006). This response was used to investigate the activity of wild-type M3-AChR and the constitutively active mutant. Figure 4B summarizes the results. HEK293 cells had been transfected with YFP-PLC-δ1-PH alone or with either wild-type M3-AChR or the constitutively active mutant receptor. Confocal images were recorded every 20 s for a period of 10 min. After 1 min, the agonist was added manually at 100 μM final concentration, and the images were recorded until the end of the 10-min period. In cells that had not been cotransfected with the M3-AChR, ligand addition did not result in an increase in intracellular fluorescence (Fig. 4B, left column and quantification in right panels). In contrast, HEK293 cells that had been cotransfected with wild-type M3-AChR-CFP showed a clear increase in intracellular fluorescence upon ligand addition (Fig. 4B, second column from the left and quantification in right panels). However, HEK293 cells that had been cotransfected with M3-AChR-CFP-N514Y showed a very small increase in intracellular fluorescence upon ligand addition (Fig. 4B, right column and quantification in right panels), although the CFP image of receptor transfection clearly indicates that dually transfected cells were analyzed. It is unlikely that this smaller response was due to impaired receptor signaling caused by the CFP modification of the receptor, because the wild-type receptor was also modified with CFP and functioned well. Second, for control reasons, we created the M3-AChR with N514Y mutation but without fluorescent protein. This construct behaved very much like the CFP-tagged receptor as can be seen in the quantification of probe translocation in the right panels of Fig. 4B. Thus, the smaller increase in PLC activity is consistent with the small agonist-dependent increase in receptor-G-protein coupling.
G-Protein Activation.
Finally, we analyzed the activation and deactivation kinetics of the Gq-protein. To do so, we employed a previously published strategy (Hein et al., 2005, 2006; Jensen et al., 2009; Adjobo-Hermans et al., 2011) using Gq, with Gγ2 labeled with CFP and Gαq labeled with YFP (Hughes et al., 2001). HEK293 cells were transfected as described and analyzed as depicted in the previous sections for receptor activation or receptor-G-protein coupling. Upon superfusion with agonist solution, a clear decrease in the FRET ratio could be observed (Fig. 5A). The fluorescence intensity for CFP increased (Fig. 5B, upper trace), whereas the fluorescence intensity for YFP decreased simultaneously (Fig. 5B, lower trace). Thus, we were able to analyze the kinetics of agonist-dependent activation and deactivation of Gq. Both acetylcholine and carbachol induced a rapid decrease in the FRET signal, but the observed signal was significantly delayed with respect to receptor activation or receptor-G-protein coupling, with approximate time constants of 450 ms. This finding is consistent with data observed for other G-protein subtypes (Hein et al., 2005, 2006; Jensen et al., 2009; Adjobo-Hermans et al., 2011; Goedhart et al., 2011). In Fig. 5, A and B, it can be seen that upon agonist washout by perfusion with buffer, the signal returns almost to its original level. When we analyzed the kinetics of G-protein deactivation, we observed that it was strongly delayed compared with receptor-G-protein coupling deactivation. Even more interesting than the absolute delay was the relative difference between acetylcholine and carbachol. As for receptor deactivation or receptor/G-protein coupling deactivation, the signal induced by carbachol decayed significantly faster than that for acetylcholine (Fig. 5C). We were unable to detect agonist-dependent changes in Gq activation for the M3-AChR-N514Y mutant. This result was consistent with the very small agonist-dependent receptor-G-protein coupling signal as described in Fig. 4A.
Fig. 5.
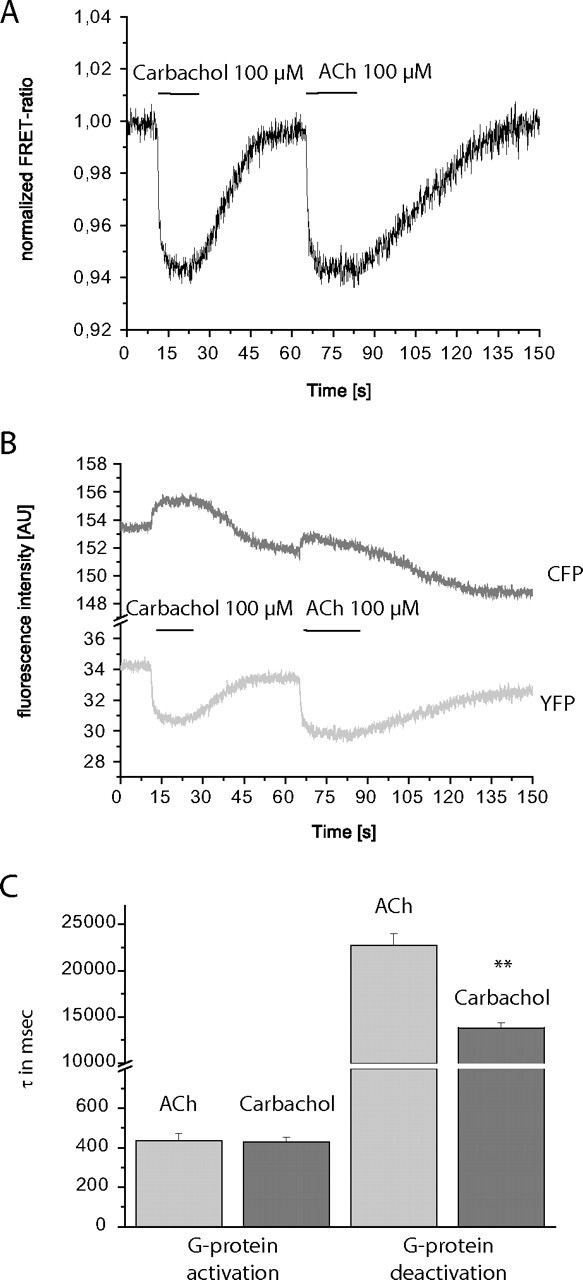
Analysis of G-protein activation by FRET. FRET was measured between YFP-tagged Gαq and CFP-tagged Gγ2. Excitation of CFP at 436 nm shifts the emission from 480 to 535 nm when the two fluorophores are close enough to permit FRET. A, HEK293 cells transiently expressing YFP-tagged Gαq together with CFP-Gγ2 (and M3-AChR and β1) were superfused with 100 μM carbachol or 100 μM ACh. This resulted in a rapid decrease in FRET as seen by the decrease in the normalized FRET ratio (FYFP/FCFP). The decrease in FRET was readily reversible upon agonist washout. B, upon superfusion with 100 μM carbachol or 100 μM ACh, an increase in CFP fluorescence and a decrease in YFP fluorescence were observed. C, maximal G-protein activation kinetics for ACh (light gray bars) and carbachol (dark gray bars) were compared with G-protein deactivation kinetics. Deactivation kinetics were analyzed similarly to activation kinetics (data represent means ± S.E. values; n = 18 for ACh and n = 17 for carbachol). AU, arbitary units.
Discussion
Constitutive receptor activity has been observed to occur in many different GPCRs (Seifert and Wenzel-Seifert, 2002). Recent models of receptor activation discuss several microdomains or microswitches to explain the conformational changes observed during receptor activation (Ahuja and Smith, 2009; Hofmann et al., 2009; Nygaard et al., 2009; Rosenbaum et al., 2009; Tate and Schertler, 2009). Of interest, some of the conserved receptor domains, such as the E/DRY motif or the NPXXY motif, appear as hotspots for constitutively activating mutations (Smit et al., 2007). This observation was discussed with respect to current models of receptor activation (Smit et al., 2007), but surprisingly little is known about this phenomenon at the receptor level itself with respect to receptor activation dynamics.
As outlined in the Introduction, the position corresponding to amino acid 514 in the human M3-AChR was shown to generate constitutive activity in all muscarinic receptor subtypes (Dowling et al., 2006; Nelson et al., 2006). In particular, the mutation N514Y was reported to cause constitutive activity in the M3-AChR and was analyzed in detail (Dowling et al., 2006). Therefore, we introduced the N514Y mutation into the recently published M3-ACh-Flash3-CFP receptor (Ziegler et al., 2011) and tested these receptor constructs for receptor activation. Individual signal traces for the recorded FlAsH and CFP channels demonstrated an opposite change in intensity (Supplemental Fig. 1), which is characteristic for FRET. Of interest, the amplitude of the change in the FRET signal was much smaller for the M3-ACh-Flash3-CFP-N514Y mutant than that for the wild-type M3-ACh-Flash3-CFP receptor. Such behavior would be consistent with the postulate that the constitutively active receptor has a higher propensity to be in the active R* state (Leff, 1995). Thus, the equilibrium between R and R* would be altered, and in our receptor system, this would correspond to an increased basal FRET signal and, hence, smaller signal amplitudes for agonist stimulation. Consistent with this observation, the inverse agonist atropine did not have an effect at the wild-type M3-ACh-Flash3-CFP receptor (Fig. 1A), whereas atropine clearly induced a decrease in the FRET signal for the M3-ACh-Flash3-CFP-N514Y receptor (Fig. 1B). The signal for the inverse agonist was opposite to the signal of an agonist, consistent with previous observations for an α2A-receptor sensor (Vilardaga et al., 2005).
The concentration-response curves of the induced changes in the FRET signal for acetylcholine and carbachol were approximately 10-fold left-shifted for the M3-ACh-Flash3-CFP-N514Y receptor (compare Fig. 1, C and D), and we observed a similar increase in agonist affinity as was described for the N514Y mutation (Dowling et al., 2006). Because increased agonist affinity is a well known feature of constitutive receptor activity, we conclude that the N514Y mutation produced constitutive receptor activity in the sensor construct.
In accordance with basic receptor theory, it had been demonstrated previously that receptor activation kinetics depend on the ligand concentrations and reach a maximum at the saturating ligand concentration (Vilardaga et al., 2003; Hoffmann et al., 2005). Figure 2 shows that acetylcholine (Fig. 2A) and carbachol (Fig. 2B) stimulate the M3-ACh-Flash3-CFP-N514Y receptor significantly faster at subsaturating ligand concentrations compared with the wild-type M3-ACh-Flash3-CFP receptor. However, at maximal receptor occupancy both receptor constructs are equally fast for both ligands. Of interest, if one compares kinetic data for subsaturating ligand concentrations but similar receptor occupancy, both receptors switch with similar kinetics. This can be seen in Fig. 2A, where the kinetics for 0.1 μM acetylcholine at the constitutively active receptor and 1 μM acetylcoline at the wild-type receptor are equivalent. Thus, from the kinetic data we cannot conclude that the wild-type or constitutively active mutant receptor induce different active receptor conformations. This conclusion is in agreement with the recently solved X-ray structure of a constitutively active mutant of rhodopsin (Standfuss et al., 2011), which showed high similarity with the active opsin structure in the Gα C-terminal complex (Scheerer et al., 2008).
Analysis of receptor deactivation times was also informative. Although receptor deactivation is independent of the ligand concentration, it was not independent of the ligand used. As shown in Fig. 2, C and D, acetylcholine-stimulated receptor activation needed a significantly longer time to decline than that for carbachol. Of interest, the differences between deactivation time for wild-type receptor and the constitutively active receptor mutant were approximately 10-fold for both ligands. This indicates that the observed difference in ligand affinity between the wild-type and constitutively active mutant receptors is mostly based on differences in receptor deactivation and thus, most likely, ligand receptor dissociation rates. Therefore, the observed differences in kinetics might give important insights to further evaluate the concept of ligand residence time and its effects on ligand efficacy in biological systems (Copeland et al., 2006; Tummino and Copeland, 2008).
The next step in the signaling cascade after receptor activation is receptor-G-protein coupling. To investigate the kinetics, we expressed M3-AChR-YFP together with CFP-Gγ2 and followed the basic approach published for other receptors (Hein et al., 2005, 2006; Jensen et al., 2009). Figure 3 shows that ligand stimulation caused a moderate but significant increase in receptor-G-protein coupling. At the saturating ligand concentration, the coupling occurred with τ values of 90 ms, similar to receptor activation kinetics for both ligands (Fig. 3C). This result is in good agreement with previously published data for receptor-G-protein coupling of other G-protein subtypes (Hein et al., 2005, 2006; Jensen et al., 2009).
When agonist superfusion was terminated, receptor-G-protein coupling rapidly reversed. Kinetic analysis showed that stimulation with acetylcholine caused a prolonged deactivation time compared with that for carbachol (Fig. 3C), a pattern similar to receptor deactivation (Fig. 2C). Because G-proteins couple to the agonist-occupied receptor, delayed agonist dissociation from the receptors should transfer into delayed receptor-G-protein deactivation. Measurement of FRET responses in a concentration-dependent manner revealed the same 10-fold left shift for acetylcholine and for carbachol for receptor-G-protein coupling (Fig. 3D) as was observed at the receptor itself. In addition, a leftward shift compared with receptor activation itself was observed, which is indicative of receptor reserve. We performed the same set of experiments with M3-AChR-YFP-N514Y. However, when we coexpressed M3-AChR-YFP-N514Y with CFP-Gγ2, we did not observe coupling at an amplitude that could be analyzed reliably with respect to activation kinetics, although coexpression was verified (Fig. 4A). Thus, the reduced signal amplitude, of ∼0.5% total signal corresponding to only 12 ± 7% of the wild-type M3-AChR signal, cannot be due to expression problems (Fig. 4A). It has previously been shown that only a small proportion of G-proteins couple to a receptor at any given time (Azpiazu and Gautam, 2004; Hein et al., 2005). Because the N514Y mutation increases basal accumulation of inositol phosphates in HEK293 cells by 300% compared with the increase with wild-type M3-AChR (Dowling et al., 2006), this significantly increased basal receptor activity may be enough to minimize further dynamic coupling. To test this hypothesis, we used the fluorescently labeled probe YFP-PLC-δ1-PH (Stauffer et al., 1998). The PH domain of this probe binds to PtdIns(4,5)P2 and localizes to the plasma membrane but relocates to the cytosol upon Gq-coupled receptor activation. This translocation can be quantified (Várnai and Balla, 2006; Jensen et al., 2009) and was used to investigate the receptor activity. As shown in Fig. 4B, control experiments did not cause a detectable increase in PLC activity, whereas we observed a dynamic increase in PLC activity for acetylcholine and carbachol when HEK293 cells were cotransfected with M3-AChR-CFP. However, cotransfection of M3-AChR-CFP-N514Y resulted in a significantly smaller, although clearly detectable increase in PLC activity. This is consistent with a smaller increase in dynamic receptor-G-protein coupling, as seen in Fig. 4A. Similar data were observed for the M3-AChR-N514Y mutant without CFP (Fig. 4B), confirming the observation that the CFP modification of the M3-AChR does not alter the receptor properties (Li et al., 2007).
Because of the limited dynamic change in coupling between the constitutively active receptor and Gq, we could only analyze Gq activation for the wild-type M3-AChR. As shown in Fig. 5, both acetylcholine and carbachol induced a rapid decrease in the FRET signal with time constants of 450 ms. The observed signal was significantly delayed with respect to receptor activation or receptor-G-protein coupling. This result is consistent with data observed for other G-protein subtypes (Hein et al., 2005, 2006; Jensen et al., 2009) and further strengthens the notion that G-protein activation is the rate-limiting step in the signaling cascade (Lohse et al., 2012) and that the time delay may be due to a common mechanism in G-protein activation (Johnston and Siderovski, 2007; Oldham and Hamm, 2008). Of interest, similar to receptor-G-protein coupling, G-protein deactivation also depended on the ligand used (Fig. 5C). For isolated G-proteins, deactivation would primarily depend on the rate of GTP hydrolysis. However, in living cells, possibly because of the effect of receptor reserve, G-protein deactivation could become dependent on a small portion of receptors still occupied by agonist that are capable of activating G-proteins.
In summary, we have shown that mutations causing constitutive receptor activity can be studied in real time using FRET-based GPCR sensors in living cells. The effects of inverse agonism and increased agonist affinity were confirmed in our system. The dynamic studies revealed a major effect of the mutation on receptor deactivation, whereas receptor activation was mostly unaffected.
Acknowledgments
The cDNA for YFP-PLC-δ1-PH was kindly provided by Tobias Meyer (Scripps, San Diego, CA).
 The online version of this article (available at http://molpharm.aspetjournals.org) contains supplemental material.
This work was supported by the Deutsche Forschungsgemeinschaft [Sonderforschungsbereich 487 “Regulatory Membrane Proteins,” TPA1].
Article, publication date, and citation information can be found at http://molpharm.aspetjournals.org.
- GPCR
- G-protein-coupled receptor
- ACh
- acetylcholine
- AChR
- acetylcholine receptor
- TM
- transmembrane domain
- FRET
- fluorescence resonance energy transfer
- CFP
- cyan fluorescent protein
- YFP
- yellow fluorescent protein
- FlAsH
- fluorescein arsenical hairpin binder
- PLC
- phospholipase C
- PCR
- polymerase chain reaction
- PH
- plecktsrin homology
- HEK293
- human embryonic kidney cells 293
- HBSS
- Hanks' balanced salt solution
- PtdIns(4,5)P2
- phosphatidylinositol-4,5-bisphosphate.
Authorship Contributions
Participated in research design: Hoffmann, Bünemann, and Lohse.
Conducted experiments: Hoffmann, Nuber, Ziegler, Winkler, and Hein.
Contributed new reagents or analytic tools: Zabel and Berlot.
Performed data analysis: Hoffmann, Nuber, Ziegler, Winkler, and Hein.
Wrote or contributed to the writing of the manuscript: Hoffmann, Nuber, Berlot, Bünemann, and Lohse.
References
- Adan RA. (2006) Constitutive receptor activity series: endogenous inverse agonists and constitutive receptor activity in the melanocortin system. Trends Pharmacol Sci 27:183–186. [DOI] [PubMed] [Google Scholar]
- Adan RA, Kas MJ. (2003) Inverse agonism gains weight. Trends Pharmacol Sci 24:315–321. [DOI] [PubMed] [Google Scholar]
- Adjobo-Hermans MJ, Goedhart J, van Weeren L, Nijmeijer S, Manders EM, Offermanns S, Gadella TW., Jr (2011) Real-time visualization of heterotrimeric G protein Gq activation in living cells. BMC Biol 9:32. [DOI] [PMC free article] [PubMed] [Google Scholar]
- Ahuja S, Smith SO. (2009) Multiple switches in G protein-coupled receptor activation. Trends Pharmacol Sci 30:494–502. [DOI] [PubMed] [Google Scholar]
- Alvarez-Curto E, Prihandoko R, Tautermann CS, Zwier JM, Pediani JD, Lohse MJ, Hoffmann C, Tobin AB, Milligan G. (2011) Developing chemical genetic approaches to explore G protein-coupled receptor function: validation of the use of a receptor activated solely by synthetic ligand (RASSL). Mol Pharmacol 80:1033–1046. [DOI] [PMC free article] [PubMed] [Google Scholar]
- Azpiazu I, Gautam N. (2004) A fluorescence resonance energy transfer-based sensor indicates that receptor access to a G protein is unrestricted in a living mammalian cell. J Biol Chem 279:27709–27718. [DOI] [PubMed] [Google Scholar]
- Ballesteros JA, Weinstein H. (1995) Integrated methods for the construction of three-dimensional models and computational probing of structure-function relations in G protein-coupled receptors. Methods Neuroscience 25:366–428. [Google Scholar]
- Bond RA, Ijzerman AP. (2006) Recent developments in constitutive receptor activity and inverse agonism, and their potential for GPCR drug discovery. Trends Pharmacol Sci 27:92–96. [DOI] [PubMed] [Google Scholar]
- Copeland RA, Pompliano DL, Meek TD. (2006) Drug-target residence time and its implications for lead optimization. Nat Rev Drug Discov 5:730–739. [DOI] [PubMed] [Google Scholar]
- Costa T, Cotecchia S. (2005) Historical review: Negative efficacy and the constitutive activity of G-protein-coupled receptors. Trends Pharmacol Sci 26:618–624. [DOI] [PubMed] [Google Scholar]
- Costa T, Herz A. (1989) Antagonists with negative intrinsic activity at δ opioid receptors coupled to GTP-binding proteins. Proc Natl Acad Sci USA 86:7321–7325. [DOI] [PMC free article] [PubMed] [Google Scholar]
- Dowling MR, Willets JM, Budd DC, Charlton SJ, Nahorski SR, Challiss RA. (2006) A single point mutation (N514Y) in the human M3 muscarinic acetylcholine receptor reveals differences in the properties of antagonists: evidence for differential inverse agonism. J Pharmacol Exp Ther 317:1134–1142. [DOI] [PubMed] [Google Scholar]
- Ford DJ, Essex A, Spalding TA, Burstein ES, Ellis J. (2002) Homologous mutations near the junction of the sixth transmembrane domain and the third extracellular loop lead to constitutive activity and enhanced agonist affinity at all muscarinic receptor subtypes. J Pharmacol Exp Ther 300:810–817. [DOI] [PubMed] [Google Scholar]
- Goedhart J, van Weeren L, Adjobo-Hermans MJ, Elzenaar I, Hink MA, Gadella TW., Jr (2011) Quantitative co-expression of proteins at the single cell level—application to a multimeric FRET sensor. PLoS One 6:e27321. [DOI] [PMC free article] [PubMed] [Google Scholar]
- Hein P, Frank M, Hoffmann C, Lohse MJ, Bünemann M. (2005) Dynamics of receptor/G protein coupling in living cells. EMBO J 24:4106–4114. [DOI] [PMC free article] [PubMed] [Google Scholar]
- Hein P, Rochais F, Hoffmann C, Dorsch S, Nikolaev VO, Engelhardt S, Berlot CH, Lohse MJ, Bünemann M. (2006) Gs activation is time-limiting in initiating receptor-mediated signaling. J Biol Chem 281:33345–33351. [DOI] [PubMed] [Google Scholar]
- Ho SN, Hunt HD, Horton RM, Pullen JK, Pease LR. (1989) Site-directed mutagenesis by overlap extension using the polymerase chain reaction. Gene 77:51–59. [DOI] [PubMed] [Google Scholar]
- Hoffmann C, Gaietta G, Bünemann M, Adams SR, Oberdorff-Maass S, Behr B, Vilardaga JP, Tsien RY, Ellisman MH, Lohse MJ. (2005) A FlAsH-based FRET approach to determine G protein-coupled receptor activation in living cells. Nat Methods 2:171–176. [DOI] [PubMed] [Google Scholar]
- Hoffmann C, Gaietta G, Zürn A, Adams SR, Terrillon S, Ellisman MH, Tsien RY, Lohse MJ. (2010) Fluorescent labeling of tetracysteine-tagged proteins in intact cells. Nat Protoc 5:1666–1677. [DOI] [PMC free article] [PubMed] [Google Scholar]
- Hoffmann C, Zürn A, Bünemann M, Lohse MJ. (2008) Conformational changes in G-protein-coupled receptors-the quest for functionally selective conformations is open. Br J Pharmacol 153 (Suppl 1):S358–S366. [DOI] [PMC free article] [PubMed] [Google Scholar]
- Hofmann KP, Scheerer P, Hildebrand PW, Choe HW, Park JH, Heck M, Ernst OP. (2009) ztiA G protein-coupled receptor at work: the rhodopsin model. Trends Biochem Sci 34:540–552. [DOI] [PubMed] [Google Scholar]
- Hughes TE, Zhang H, Logothetis DE, Berlot CH. (2001) Visualization of a functional Gαq-green fluorescent protein fusion in living cells. Association with the plasma membrane is disrupted by mutational activation and by elimination of palmitoylation sites, but not be activation mediated by receptors or AlF4. J Biol Chem 276:4227–4235. [DOI] [PubMed] [Google Scholar]
- Jensen JB, Lyssand JS, Hague C, Hille B. (2009) Fluorescence changes reveal kinetic steps of muscarinic receptor-mediated modulation of phosphoinositides and Kv7.2/7.3 K+ channels. J Gen Physiol 133:347–359. [DOI] [PMC free article] [PubMed] [Google Scholar]
- Johnston CA, Siderovski DP. (2007) Receptor-mediated activation of heterotrimeric G-proteins: current structural insights. Mol Pharmacol 72:219–230. [DOI] [PubMed] [Google Scholar]
- Kenakin T. (2001) Inverse, protean, and ligand-selective agonism: matters of receptor conformation. FASEB J 15:598–611. [DOI] [PubMed] [Google Scholar]
- Leff P. (1995) The two-state model of receptor activation. Trends Pharmacol Sci 16:89–97. [DOI] [PubMed] [Google Scholar]
- Li B, Scarselli M, Knudsen CD, Kim SK, Jacobson KA, McMillin SM, Wess J. (2007) Rapid identification of functionally critical amino acids in a G protein-coupled receptor. Nat Methods 4:169–174. [DOI] [PubMed] [Google Scholar]
- Lohse MJ, Nuber S, Hoffmann C. (2012) Fluorescence/bioluminescence resonance energy transfer techniques to study G-protein-coupled receptor activation and signaling. Pharmacol Rev 64:299–336. [DOI] [PubMed] [Google Scholar]
- Maier-Peuschel M, Frölich N, Dees C, Hommers LG, Hoffmann C, Nikolaev VO, Lohse MJ. (2010) A fluorescence resonance energy transfer-based M2 muscarinic receptor sensor reveals rapid kinetics of allosteric modulation. J Biol Chem 285:8793–8800. [DOI] [PMC free article] [PubMed] [Google Scholar]
- Milligan G. (2003) Constitutive activity and inverse agonists of G protein-coupled receptors: a current perspective. Mol Pharmacol 64:1271–1276. [DOI] [PubMed] [Google Scholar]
- Nelson CP, Nahorski SR, Challiss RA. (2006) Constitutive activity and inverse agonism at the M2 muscarinic acetylcholine receptor. J Pharmacol Exp Ther 316:279–288. [DOI] [PubMed] [Google Scholar]
- Nikolaev VO, Hoffmann C, Bünemann M, Lohse MJ, Vilardaga JP. (2006) Molecular basis of partial agonism at the neurotransmitter α2A-adrenergic receptor and Gi-protein heterotrimer. J Biol Chem 281:24506–24511. [DOI] [PubMed] [Google Scholar]
- Nygaard R, Frimurer TM, Holst B, Rosenkilde MM, Schwartz TW. (2009) Ligand binding and micro-switches in 7TM receptor structures. Trends Pharmacol Sci 30:249–259. [DOI] [PubMed] [Google Scholar]
- Oldham WM, Hamm HE. (2008) Heterotrimeric G protein activation by G-protein-coupled receptors. Nat Rev Mol Cell Biol 9:60–71. [DOI] [PubMed] [Google Scholar]
- Pauwels PJ, Wurch T. (1998) Review: Amino acid domains involved in constitutive activation of G-protein-coupled receptors. Mol Neurobiol 17:109–135. [DOI] [PubMed] [Google Scholar]
- Rosenbaum DM, Rasmussen SG, Kobilka BK. (2009) The structure and function of G-protein-coupled receptors. Nature 459:356–363. [DOI] [PMC free article] [PubMed] [Google Scholar]
- Samama P, Cotecchia S, Costa T, Lefkowitz RJ. (1993) A mutation-induced activated state of the β2-adrenergic receptor. Extending the ternary complex model. J Biol Chem 268:4625–4636. [PubMed] [Google Scholar]
- Scheerer P, Park JH, Hildebrand PW, Kim YJ, Krauss N, Choe HW, Hofmann KP, Ernst OP. (2008) Crystal structure of opsin in its G-protein-interacting conformation. Nature 455:497–502. [DOI] [PubMed] [Google Scholar]
- Seifert R, Wenzel-Seifert K. (2002) Constitutive activity of G-protein-coupled receptors: cause of disease and common property of wild-type receptors. Naunyn Schmiedebergs Arch Pharmacol 366:381–416. [DOI] [PubMed] [Google Scholar]
- Smit MJ, Vischer HF, Bakker RA, Jongejan A, Timmerman H, Pardo L, Leurs R. (2007) Pharmacogenomic and structural analysis of constitutive G protein-coupled receptor activity. Annu Rev Pharmacol Toxicol 47:53–87. [DOI] [PubMed] [Google Scholar]
- Spalding TA, Burstein ES. (2006) Constitutive activity of muscarinic acetylcholine receptors. J Recept Signal Transduct Res 26:61–85. [DOI] [PubMed] [Google Scholar]
- Spalding TA, Burstein ES, Wells JW, Brann MR. (1997) Constitutive activation of the m5 muscarinic receptor by a series of mutations at the extracellular end of transmembrane 6. Biochemistry 36:10109–10116. [DOI] [PubMed] [Google Scholar]
- Standfuss J, Edwards PC, D'Antona A, Fransen M, Xie G, Oprian DD, Schertler GF. (2011) The structural basis of agonist-induced activation in constitutively active rhodopsin. Nature 471:656–660. [DOI] [PMC free article] [PubMed] [Google Scholar]
- Stauffer TP, Ahn S, Meyer T. (1998) Receptor-induced transient reduction in plasma membrane PtdIns(4,5)P2 concentration monitored in living cells. Curr Biol 8:343–346. [DOI] [PubMed] [Google Scholar]
- Strange PG. (2002) Mechanisms of inverse agonism at G-protein-coupled receptors. Trends Pharmacol Sci 23:89–95. [DOI] [PubMed] [Google Scholar]
- Tate CG, Schertler GF. (2009) Engineering G protein-coupled receptors to facilitate their structure determination. Curr Opin Struct Biol 19:386–395. [DOI] [PubMed] [Google Scholar]
- Tummino PJ, Copeland RA. (2008) Residence time of receptor-ligand complexes and its effect on biological function. Biochemistry 47:5481–5492. [DOI] [PubMed] [Google Scholar]
- Várnai P, Balla T. (2006) Live cell imaging of phosphoinositide dynamics with fluorescent protein domains. Biochim Biophys Acta 1761:957–967. [DOI] [PubMed] [Google Scholar]
- Vilardaga JP, Bünemann M, Feinstein TN, Lambert N, Nikolaev VO, Engelhardt S, Lohse MJ, Hoffmann C. (2009) GPCR and G proteins: drug efficacy and activation in live cells. Mol Endocrinol 23:590–599. [DOI] [PMC free article] [PubMed] [Google Scholar]
- Vilardaga JP, Bünemann M, Krasel C, Castro M, Lohse MJ. (2003) Measurement of the millisecond activation switch of G protein-coupled receptors in living cells. Nat Biotechnol 21:807–812. [DOI] [PubMed] [Google Scholar]
- Vilardaga JP, Steinmeyer R, Harms GS, Lohse MJ. (2005) Molecular basis of inverse agonism in a G protein-coupled receptor. Nat Chem Biol 1:25–28. [DOI] [PubMed] [Google Scholar]
- Ziegler N, Bätz J, Zabel U, Lohse MJ, Hoffmann C. (2011) FRET-based sensors for the human M1-, M3-, and M5-acetylcholine receptors. Bioorg Med Chem 19:1048–1054. [DOI] [PubMed] [Google Scholar]
- Zürn A, Zabel U, Vilardaga JP, Schindelin H, Lohse MJ, Hoffmann C. (2009) Fluorescence resonance energy transfer analysis of α2a-adrenergic receptor activation reveals distinct agonist-specific conformational changes. Mol Pharmacol 75:534–541. [DOI] [PubMed] [Google Scholar]