Abstract
Purpose:
To define “strong” versus “weak” anti-VEGF treatment response in eyes with center-involved diabetic macular edema (CI-DME).
Methods:
Exploratory analyses of three DRCR Retina Network randomized trials of eyes with CI-DME treated with aflibercept, bevacizumab, or ranibizumab. Thresholds of 5, 10, and 15-letter gain defined strong visual acuity (VA) response when baseline VA was 20/25–20/32, 20/40–20/63, or 20/80–20/320, respectively. Thresholds of 50, 100, or 200-μm reduction defined strong anatomic response when baseline central subfield thickness (CST) was <75, ≥75 to <175, or ≥175-μm above standard thresholds. Additional thresholds from regression equations were calculated.
Results:
At 24 weeks, outcomes for strong response were achieved by 476 of 958 eyes (50%) for VA and 505 eyes (53%) for CST. At 104 weeks among the 32% of eyes with strong VA and CST response at 24 weeks, 195 of 281 (69%) maintained strong VA and CST response, whereas 20 (7%) had neither strong VA nor strong CST response. Outcomes rates were similar across protocols and when defined using regression equations.
Conclusions:
These phenotypes are suitable for efforts to identify predictive biomarkers for response to anti-VEGF therapy for DME and might facilitate comparison of treatment response among diverse cohorts with DME.
Keywords: anti-vascular endothelial growth factor, diabetic macular edema, phenotypes
Summary statement:
Standardized phenotypes for visual and anatomic response to anti-VEGF treatment for center-involved diabetic macular edema were developed from three DRCR Retina Network randomized clinical trials. These phenotypes are suitable for identifying predictive biomarkers for response to anti-VEGF treatment and might facilitate comparison of treatment response among diverse cohorts with DME.
Introduction
Although anti-vascular endothelial growth factor (anti-VEGF) therapy is generally effective treatment for center-involved diabetic macular edema (CI-DME) and results in improvement of visual acuity (VA) and central retinal thickening, many eyes do not achieve 20/20 vision or complete resolution of DME.1–3 A major unmet need in the development of new therapies for DME is the identification of biomarkers associated with future response to anti-VEGF treatment. Addressing this issue has been handicapped by lack of agreement on standardized phenotypes for treatment response that allow comparison across studies, treatments, and methods of evaluation.
Change from baseline in VA letter score and optical coherence tomography (OCT) central subfield thickness (CST) are commonly used to assess treatment response in clinical trials.4,5 Continuous outcomes are generally preferred over binary outcomes as primary endpoints because of greater statistical efficiency, which results in a smaller required sample size. Means, however, describe a population and not an individual response. Therefore, binary outcomes, such as gain of 15 or more letters of VA, are often reported as secondary outcomes to help clinicians and patients understand the results. One limitation of binary outcomes created from a continuous distribution is that the likelihood of meeting the outcome is highly dependent upon the baseline level. For example, an eye starting with VA of 55 letters (Snellen equivalent 20/80) is more likely to gain 15 or more letters than an eye starting at 80 letters (Snellen equivalent 20/25). Thus, if comparing outcome rates across trials, the distribution of baseline VA in each trial will be a confounding factor. In addition, a gain of 15 letters might be clinically relevant for an eye starting at 20/80, but a gain of as little as 5 letters may be clinically important for an eye starting with vision as good as 20/25.
The purpose of these analyses is to characterize visual and anatomic outcomes in eyes treated with anti-VEGF therapy for CI-DME among eyes enrolled in DRCR Retina Network trials and to develop standardized phenotypes for future translational, clinical, genetic, and artificial intelligence-based studies of treatment response in eyes with CI-DME.
Methods
All studies adhered to tenets of the Declaration of Helsinki. Participants provided written informed consent. Institutional review boards approved the study protocols, which are available on the DRCR Retina Network website (www.drcr.net). The original publications provide additional details.1,6,7
Inclusion Criteria
Participants included in these analyses were enrolled in a DRCR Retina Network trial of anti-VEGF for CI-DME (Protocols I, T, or V), randomly assigned to anti-VEGF treatment, and had VA and OCT CST measurements available at baseline and 24 weeks. In Protocols I and T, participants had baseline VA of 78 to 24 letters (approximate Snellen equivalent 20/32 to 20/320). In Protocol V, participants had baseline VA of 79 letters or greater (approximate Snellen equivalent 20/25 or better); however, only eyes having baseline VA of 79 to 83 letters (approximate Snellen equivalent 20/25) were evaluated herein because eyes starting at ≥20/20 were not considered to have reduced VA. All participants had center-involved diabetic macular edema confirmed on clinical examination and OCT, defined as CST greater than or equal to the DRCR Retina Network CI-DME thresholds (Zeiss Stratus, 250 μm; Zeiss Cirrus, 290/305 μm for females/males; Heidelberg Spectralis, 305/320 μm for females/males).8,9 One study eye per participant was included from the following treatment groups: ranibizumab + prompt focal/grid laser and ranibizumab + deferred focal/grid laser groups from Protocol I; aflibercept, ranibizumab, and bevacizumab groups from Protocol T; aflibercept group from Protocol V. Two-year visit completion among surviving participants was ≥90% in each study.
Outcomes
The following outcomes were evaluated: change in VA, change in VA area under the curve (calculated using the trapezoidal rule),10 VA gain of at least 5, 10, and 15 letters, change in CST, change in CST relative to baseline, and reduction in CST from of at least 50, 100, and 200 μm.
Statistical Analyses
For calculation of change in VA area under curve, missing interim data were interpolated. Equations that estimate the expected change in VA and CST based on starting level were derived via linear regression to determine threshold values that define strong versus weak treatment response for specific levels of baseline visual acuity and CST. Composite categorical outcomes were chosen based on the observed median change in VA and CST among participants with mild, moderate, and severe visual impairment (20/25–20/32, 20/40–20/63, and 20/80–20/320, respectively) or retinal thickening (0–<75 μm, 75–<175 μm, and ≥175 μm above the standard sex/machine-specific thresholds for CI-DME8,9). Analyses were conducted using SAS 9.4 (SAS Institute Inc., Cary, NC, USA).
Results
Baseline Characteristics
The study cohort included 958 participants, 592 (62%) from Protocol T, 303 (32%) from Protocol I, and 63 (7%) from Protocol V (Table 1). Participants included more males (516 [54%]) than females (442 [46%]), and 305 (32%) were minorities (non-White race or Hispanic ethnicity). Regarding anti-VEGF agent, 492 (51%) received ranibizumab, 268 (28%) received aflibercept, and 198 (21%) received bevacizumab. Median baseline VA in the study eye was 68 letters (interquartile range [IQR], 74–59) and VA was 20/25 to 20/32 in 247 (26%), 20/40 to 20/63 in 487 (51%), and 20/80 to 20/320 in 224 (23%). Median baseline CST (Zeiss Stratus equivalent)11 was 378 μm (IQR, 309–476). Approximately one-third of eyes were 0 to <75 μm, 75 to <175 μm, or ≥175 μm above the previously published Network sex/machine-specific thresholds for CI-DME.8,9
Table 1.
Baseline Characteristics
| Protocol | ||||
|---|---|---|---|---|
| All | I | T | V | |
| No. of participants | ||||
| N | 958 | 303 | 592 | 63 |
| Participant Characteristics | ||||
| Age, years | ||||
| Median (IQR) | 61 (54, 68) | 63 (57, 70) | 60 (54, 67) | 60 (54, 67) |
| Sex | ||||
| Female | 442 (46%) | 135 (45%) | 272 (46%) | 35 (56%) |
| Male | 516 (54%) | 168 (55%) | 320 (54%) | 28 (44%) |
| Race/Ethnicity | ||||
| White | 648 (68%) | 216 (71%) | 394 (67%) | 38 (60%) |
| Black/African American | 145 (15%) | 49 (16%) | 87 (15%) | 9 (14%) |
| Hispanic or Latino | 135 (14%) | 30 (10%) | 93 (16%) | 12 (19%) |
| Asian | 10 (1%) | 2 (<1%) | 6 (1%) | 2 (3%) |
| Native Hawaiian/Other Pacific Islander | 5 (<1%) | 1 (<1%) | 4 (<1%) | 0 |
| More than one race | 10 (1%) | 2 (<1%) | 6 (1%) | 2 (3%) |
| Unknown/not reported | 5 (<1%) | 3 (<1%) | 2 (<1%) | 0 |
| Diabetes type | ||||
| Type 1 | 72 (8%) | 22 (7%) | 47 (8%) | 3 (5%) |
| Type 2 | 866 (90%) | 275 (91%) | 532 (90%) | 59 (94%) |
| Uncertain | 20 (2%) | 6 (2%) | 13 (2%) | 1 (2%) |
| Duration of diabetes, years | ||||
| Median (IQR) | 16 (10, 23) | 17 (10, 23) | 16 (10, 23) | 15 (10, 21) |
| Insulin used | ||||
| No | 334 (35%) | 123 (41%) | 192 (32%) | 19 (30%) |
| Yes | 624 (65%) | 180 (59%) | 400 (68%) | 44 (70%) |
| Hemoglobin A1c, % | ||||
| Median (IQR) | 7.6 (6.7, 8.8) | 7.3 (6.6, 8.4) | 7.7 (6.8, 8.9) | 7.6 (6.7, 9.0) |
| Study Eye Characteristics | ||||
| Visual acuity, letters | ||||
| Median (IQR) | 68 (59, 74) | 65 (56, 72) | 69 (59, 73) | 82 (80, 83) |
| Visual acuity, Snellen equivalent | ||||
| Median (IQR) | 20/50 (20/63, 20/32) |
20/50 (20/80, 20/40) |
20/40 (20/63, 20/40) |
20/25 (20/25, 20/25) |
| Visual acuity category | ||||
| 20/25 to 20/32 (83 to 74 letters) | 247 (26%) | 52 (17%) | 132 (22%) | 63 (100%) |
| 20/40 to 20/63 (74 to 59 letters) | 487 (51%) | 165 (54%) | 322 (54%) | 0 |
| 20/80 to 20/320 (58 to 24 letters) | 224 (23%) | 86 (28%) | 138 (23%) | 0 |
| OCT central subfield thickness (Zeiss Stratus equivalent), μm | ||||
| Median (IQR) | 378 (309, 476) | 389 (324, 486) | 388 (310, 479) | 295 (271, 319) |
| OCT central subfield thickness relative to CI-DME threshold* | ||||
| <75 μm | 303 (32%) | 76 (25%) | 179 (30%) | 48 (76%) |
| 75 μm to <175 μm | 325 (34%) | 110 (36%) | 204 (34%) | 11 (17%) |
| ≥175 μm | 330 (34%) | 117 (39%) | 209 (35%) | 4 (6%) |
| Anti-VEGF agent | ||||
| Aflibercept | 268 (28%) | 0 | 205 (35%) | 63 (100%) |
| Bevacizumab | 198 (21%) | 0 | 198 (33%) | 0 |
| Ranibizumab | 492 (51%) | 303 (100%) | 189 (32%) | 0 |
| Lens status | ||||
| AC IOL | 2 (<1%) | 2 (<1%) | 0 | 0 |
| PC IOL | 244 (25%) | 90 (30%) | 140 (24%) | 14 (22%) |
| Phakic | 712 (74%) | 211 (70%) | 452 (76%) | 49 (78%) |
Abbreviations: AC IOL = anterior chamber intraocular lens; CI-DME = center-involved diabetic macular edema; DME = diabetic macular edema; IQR = interquartile range; OCT = optical coherence tomography; PC IOL = posterior chamber intraocular lens; VEGF = vascular endothelial growth factor.
Zeiss Stratus, 250 μm; Zeiss Cirrus, 290 μm for females and 305 μm for males; Heidelberg Spectralis, 305 μm for females and 320 μm for males.
Visual Acuity Outcomes at 24 Weeks
Baseline VA affected the magnitude and variability of change in VA observed at 24 weeks; eyes with worse baseline VA were more likely to experience greater visual improvement on average but had greater variability in their response. Mean change in VA letter score from baseline to 24 weeks was 5 (standard deviation [SD], 6), 9 (SD, 8), and 15 (SD, 12) when baseline VA was 20/25 to 20/32 (mild impairment), 20/40 to 20/63 (moderate impairment), and 20/80 to 20/320 (severe impairment), respectively; mean change in VA letter score area under the curve was 3 (SD, 4), 6 (SD, 5), and 11 (SD, 9) for these groups (Figure 1A). Likewise, the probability of gaining at least 5, 10, or 15 letters of vision was dependent upon baseline VA (Figure 1B). For example, the proportion of eyes gaining at least 15 letters of VA was 8 of 247 (3%), 105 of 487 (22%) and 116 of 224 (52%) when baseline VA impairment was mild, moderate, and severe whereas the proportions gaining at least 5 letters of vision were 135 (55%), 349 (72%), and 186 (83%), respectively. Therefore, we defined strong VA response as at least 5, 10, or 15-letter gain when baseline VA was 20/25 to 20/32, 20/40 to 20/63, or 20/80 to 20/320, respectively. Eyes that did not meet these thresholds for VA gain were categorized as having weak VA response. A strong VA response was achieved in 476 of 958 (50%) overall and 135 (55%), 225 (46%), and 116 (52%) when baseline VA impairment was mild, moderate, or severe (Figure 1B). Overall, strong visual acuity response was seen in 131 of 303 (43%) eyes in Protocol I, 316 of 592 (53%) eyes in Protocol T, and 29 of 63 (46%) eyes in Protocol V.
Figure 1. Changes in Visual Acuity and Central Subfield Thickness from Baseline at 24 Weeks (A - D).
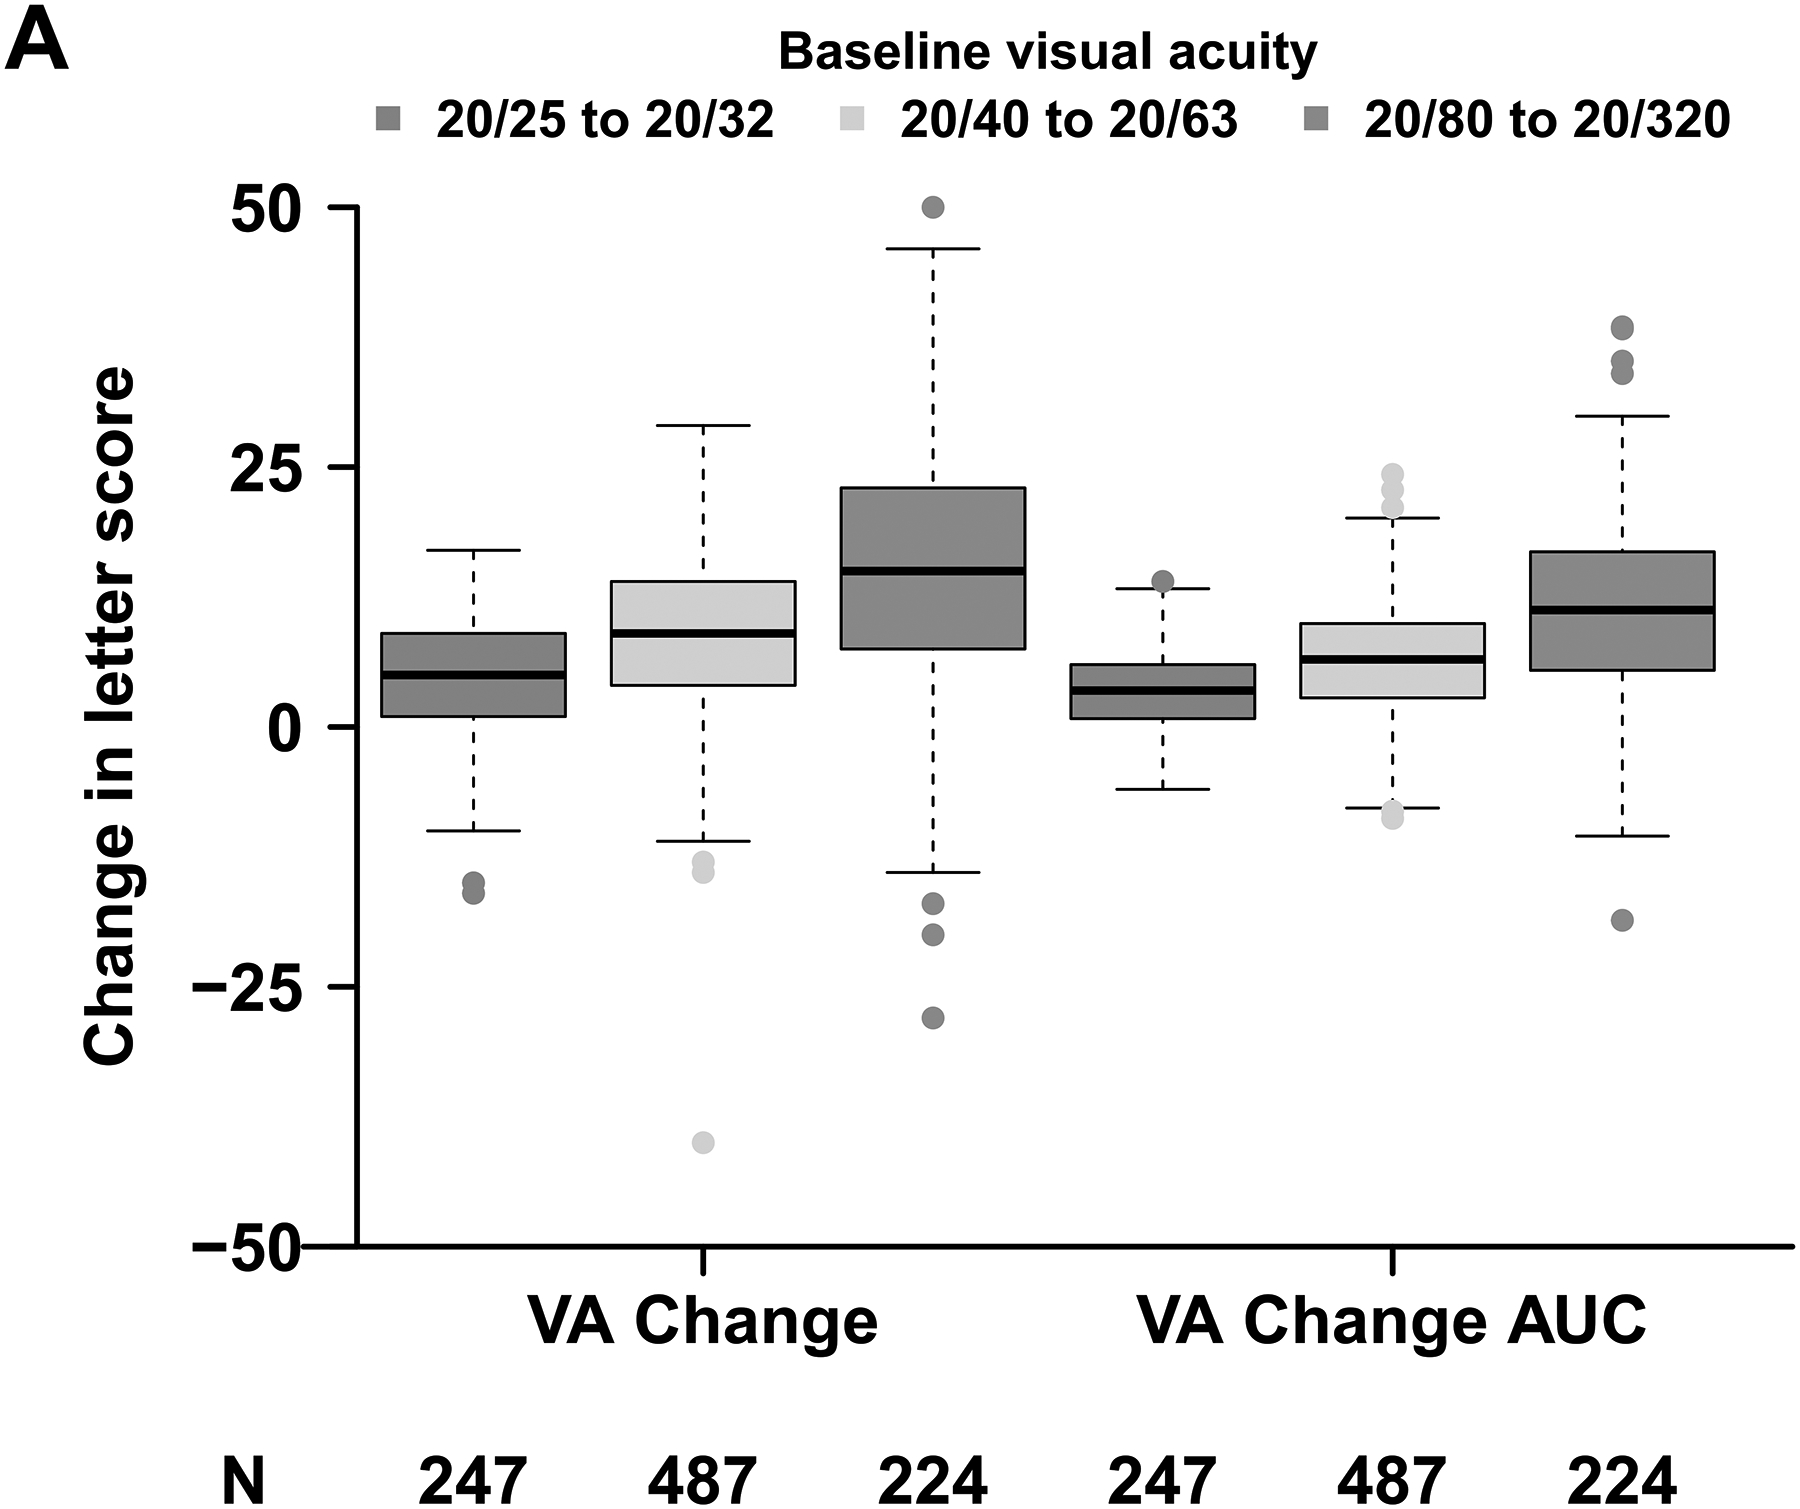
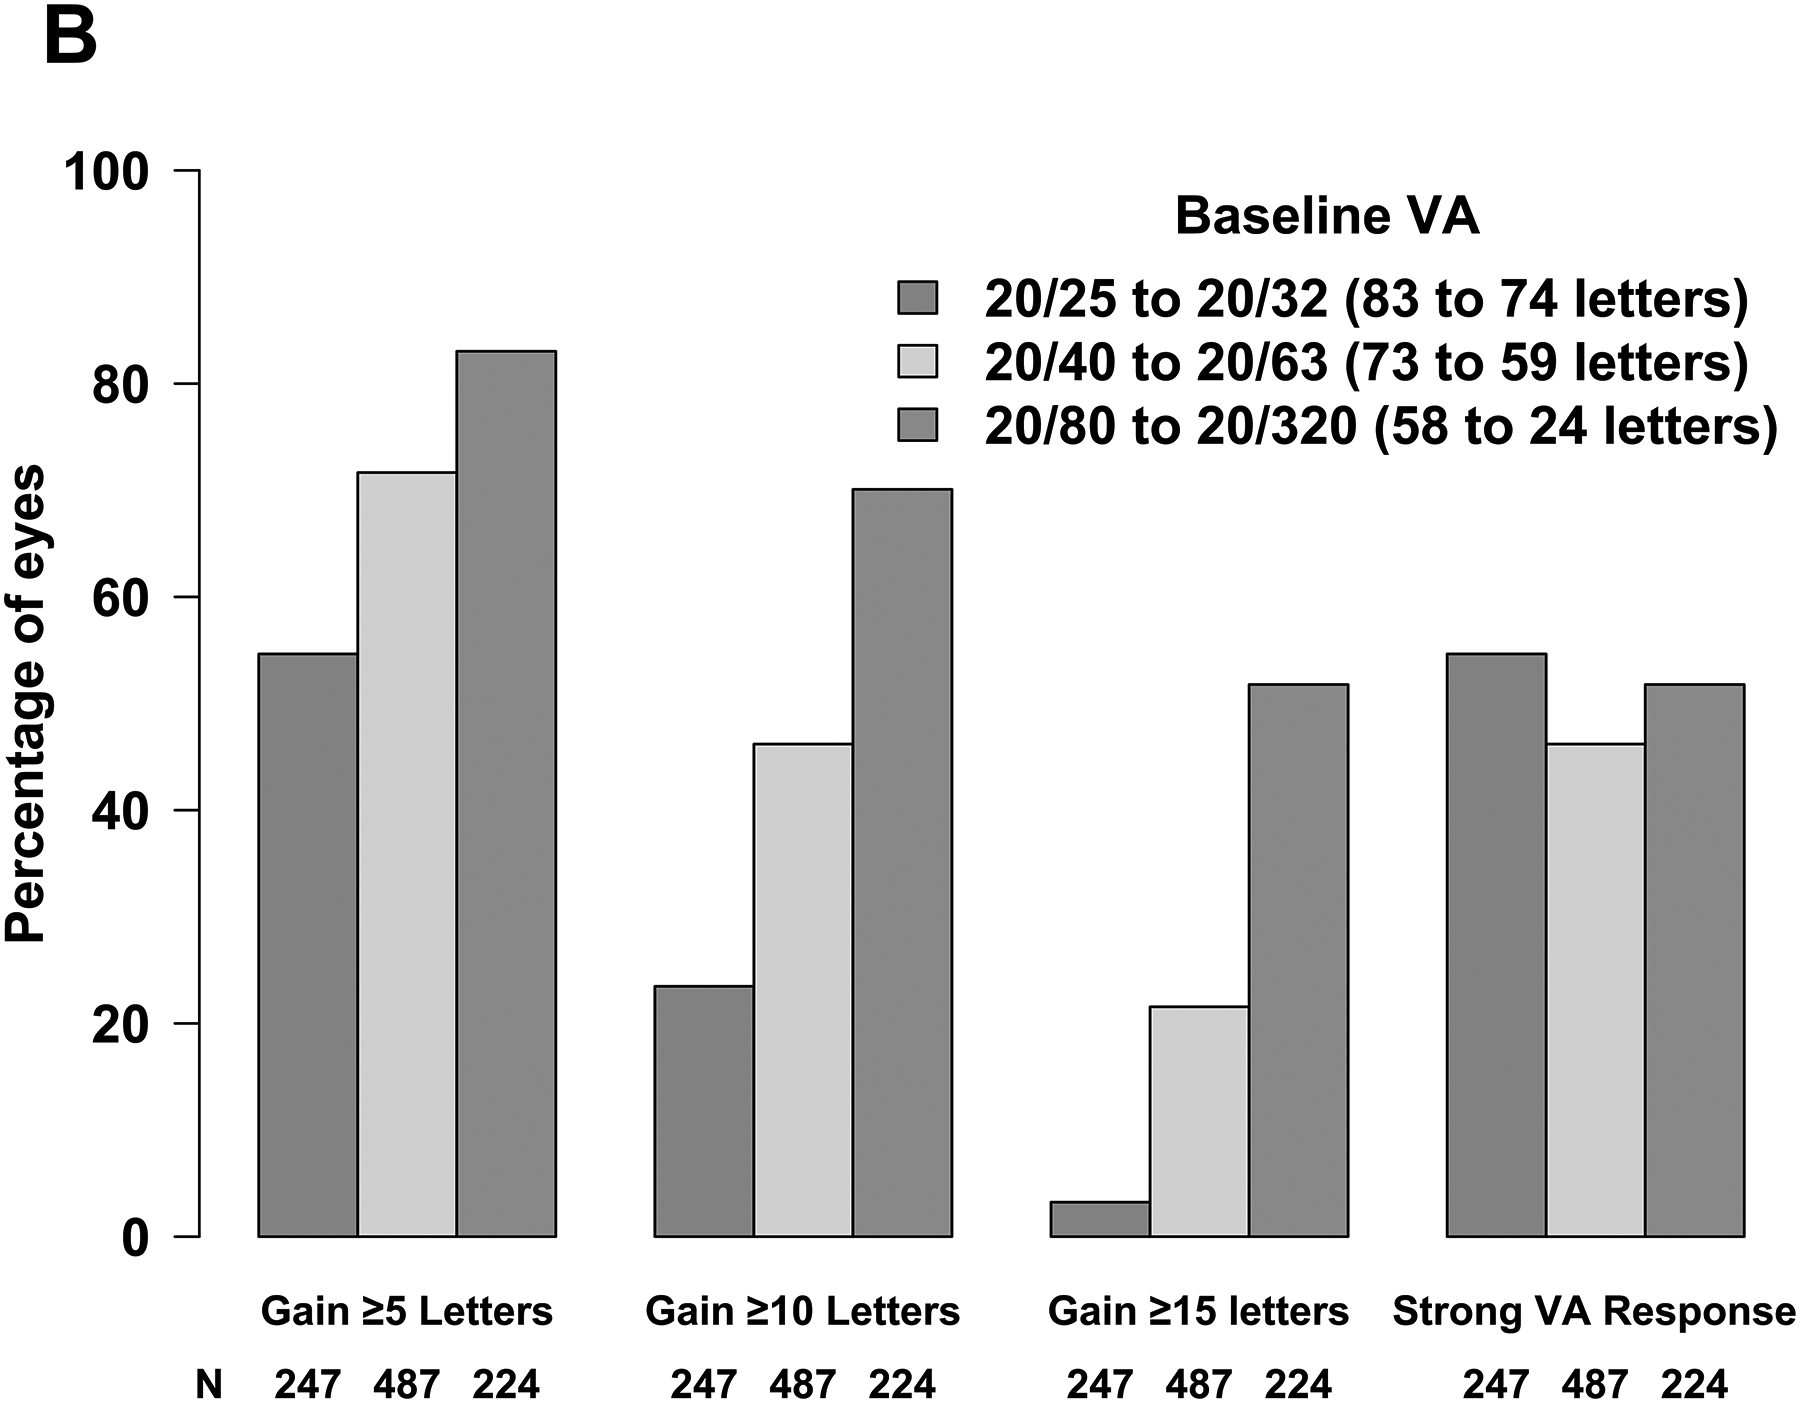
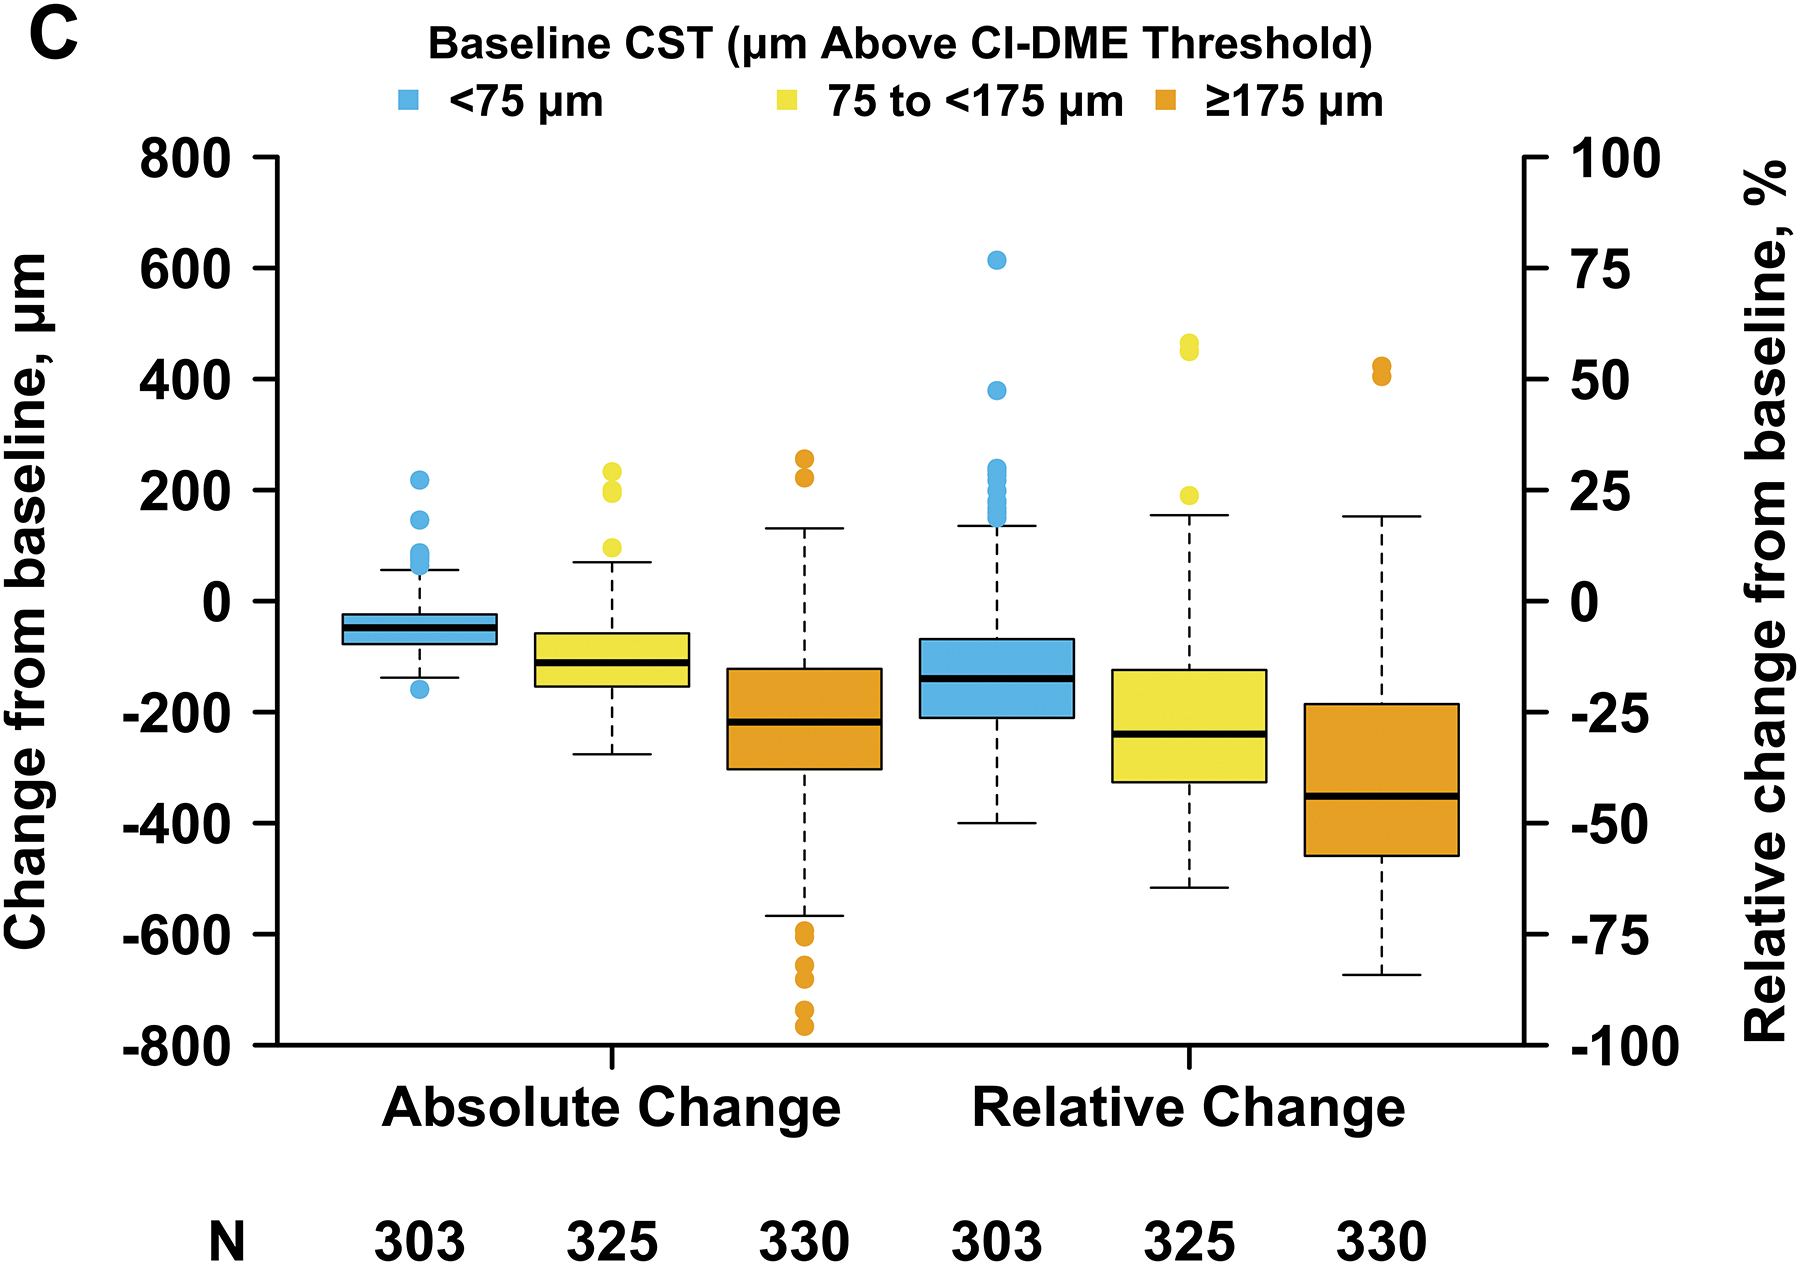
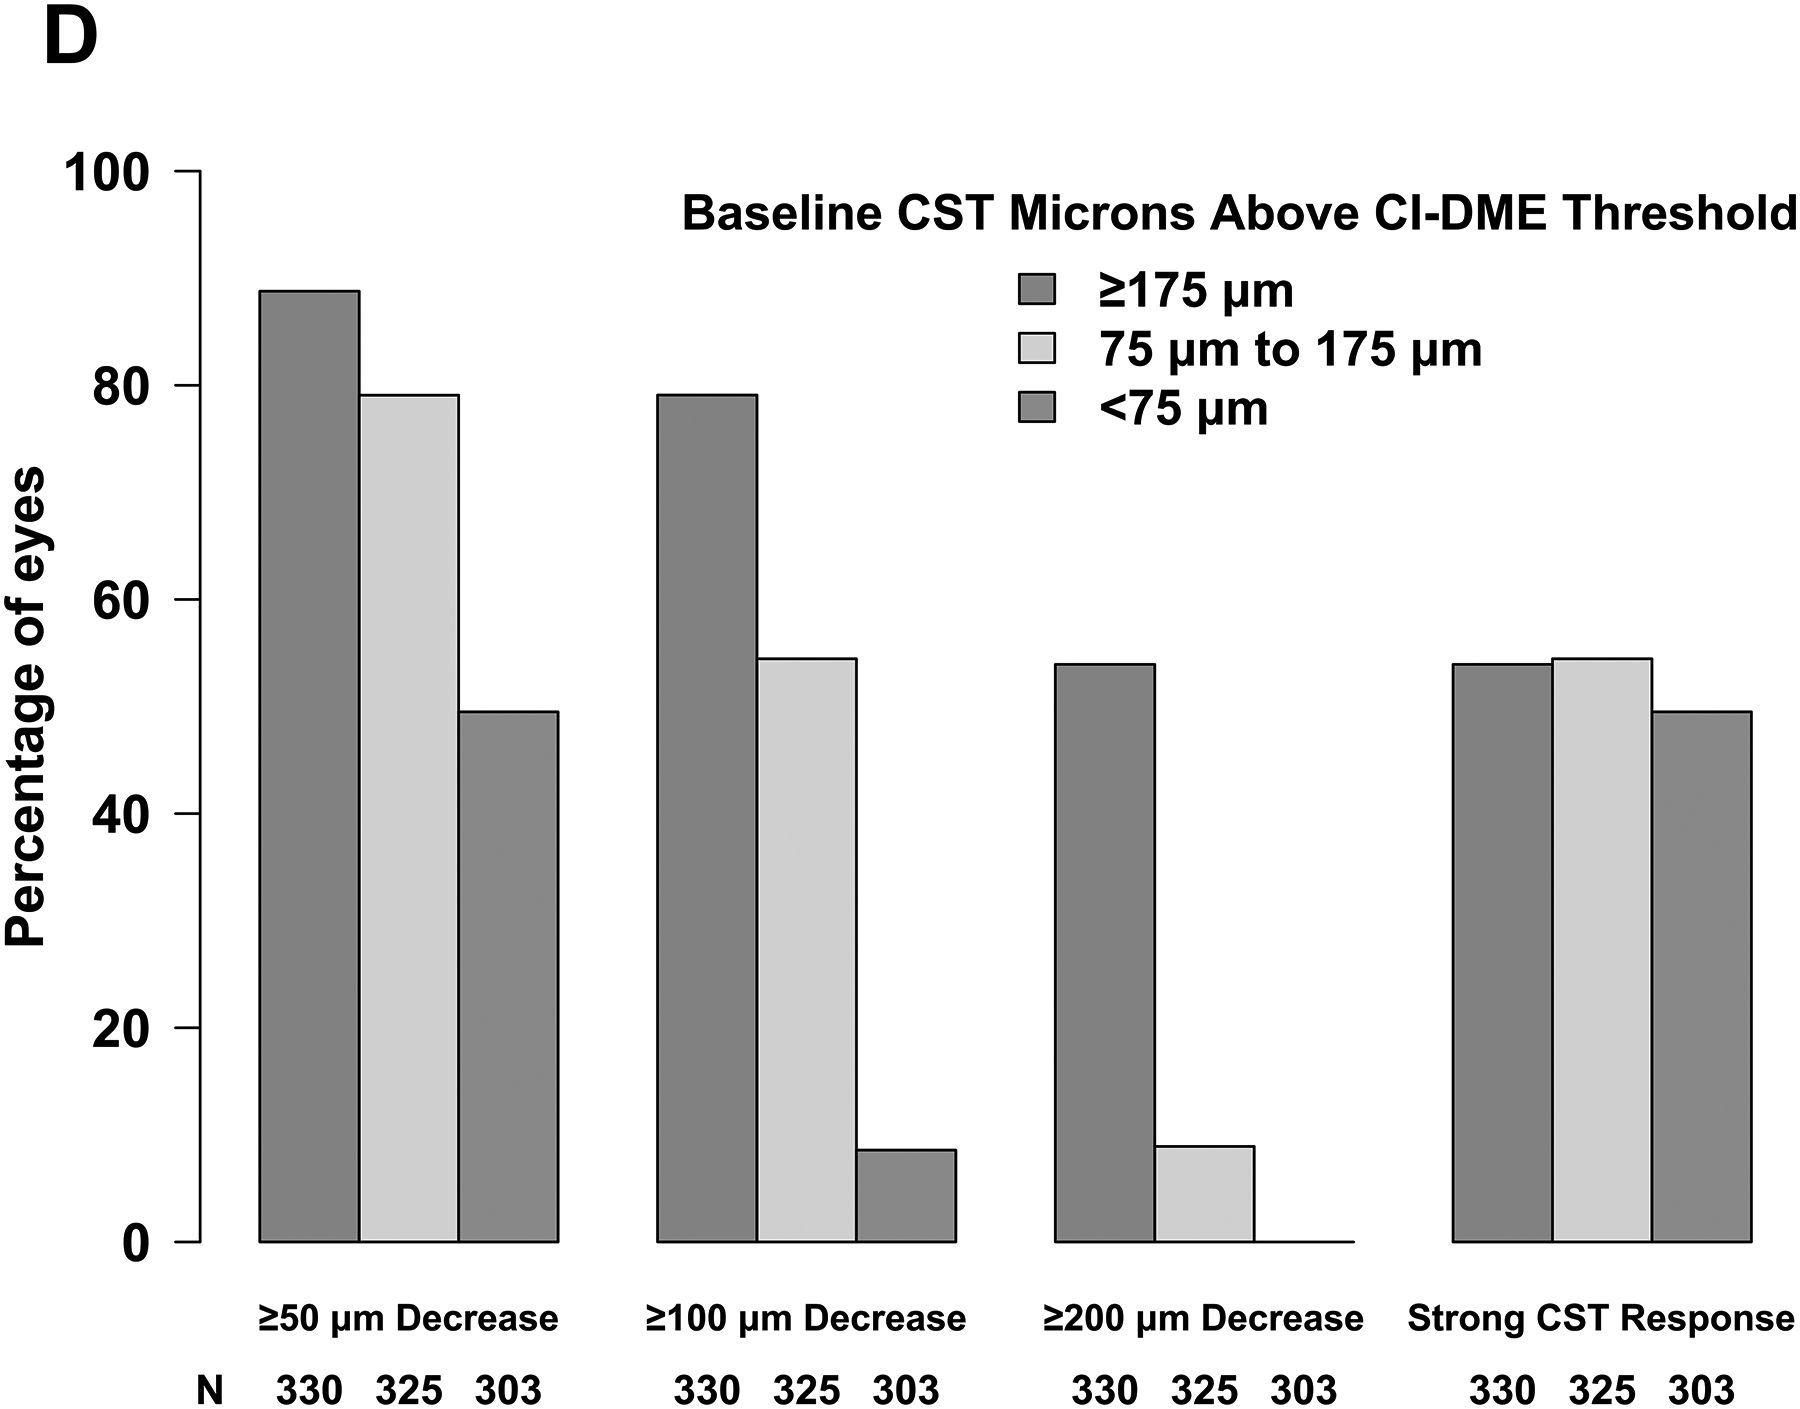
Abbreviations: AUC = area under the curve; CI-DME = center-involved diabetic macular edema; CST = central subfield thickness; VA = visual acuity. Strong VA response was defined as at least 5-letter gain when baseline VA was 20/25 to 20/32, at least 10-letter gain when baseline VA was 20/40 to 20/63, and at least 15-letter gain when baseline VA was 20/80 to 20/320. (B) Thresholds for CI-DME are defined as follows: Heidelberg Spectralis, at least 305 μm for women and at least 320 μm for men; Zeiss Cirrus, at least 290 μm for women and at least 305 μm for men; Zeiss Stratus at least 250 μm for women and men. (C, D)
Retinal Thickening Outcomes at 24 Weeks
Baseline CST affected the magnitude and variability of change in CST observed at 24 weeks; eyes with thicker baseline CST were more likely to experience greater reduction in CST on average but had greater variability in their response. Mean change in CST from baseline to 24 weeks was −45 μm (SD, 48 μm), −103 μm (SD, 75 μm), and −224 μm (SD, 150 μm) when baseline CST was <75 μm (mild edema), 75 to <175 μm (moderate edema), and ≥175 μm (severe edema) above the CI-DME threshold, respectively; mean relative change in CST from baseline was −16% (SD, 16%), −27% (SD, 19%), and −39% (SD, 23%) for these groups (Figure 1C). Likewise, the probability of thinning by at least 50, 100, or 200 μm was dependent upon baseline CST (Figure 1D). For example, the proportion of eyes thinning by at least 200 μm was 0 of 303 (0%), 29 of 325 (9%) and 178 of 330 (54%) when baseline edema was mild, moderate, and severe whereas the proportion thinning by at least 50 μm was 150 (50%), 257 (79%), and 293 (89%), respectively. Therefore, we defined strong CST response as at least 50, 100, or 200-μm reduction in CST when baseline CST was <75 μm, 75 to <175 μm, and ≥175 μm, respectively, above the CI-DME threshold. Eyes that did not meet these thresholds for CST reduction were categorized as having weak CST response. A strong CST response was achieved in 505 of 958 (53%) overall and 150 (50%), 117 (54%), and 178 (54%) when baseline edema was mild, moderate, or severe (Figure 1D). Overall, strong CST response was seen in 164 of 303 (54%) eyes in Protocol I, 309 of 592 (52%) eyes in Protocol T, and 32 of 63 (51%) eyes in Protocol V.
Association Between 24-Week and 104-Week Outcomes
At 24 weeks, 303 of 958 (32%) had strong VA and CST response (per our composite definitions), 173 (18%) had strong VA but weak CST response, 202 (21%) had strong CST but weak VA response, and 280 (29%) had weak response in both VA and CST (Figure 2A). Outcomes rates were similar across the 3 protocols. At 104 weeks and among eyes with strong VA and CST response at 24 weeks, 195 of 281 (69%) still had strong VA and CST response whereas only 20 (7%) had neither strong VA nor CST response (Figure 2B). Among eyes that had a weak VA and CST at 24 weeks, 100 of 247 (40%) had a weak VA and CST response at 104 weeks, but 51 (21%) had a strong VA and CST response. The mean changes in VA from 24 to 104 weeks among eyes with strong vs weak VA and CST response at 24 weeks are provided in eTable 1 by 104-week VA and CST response status.
Figure 2. Visual Acuity and Central Subfield Thickness Status at 24 and 104 Weeks.
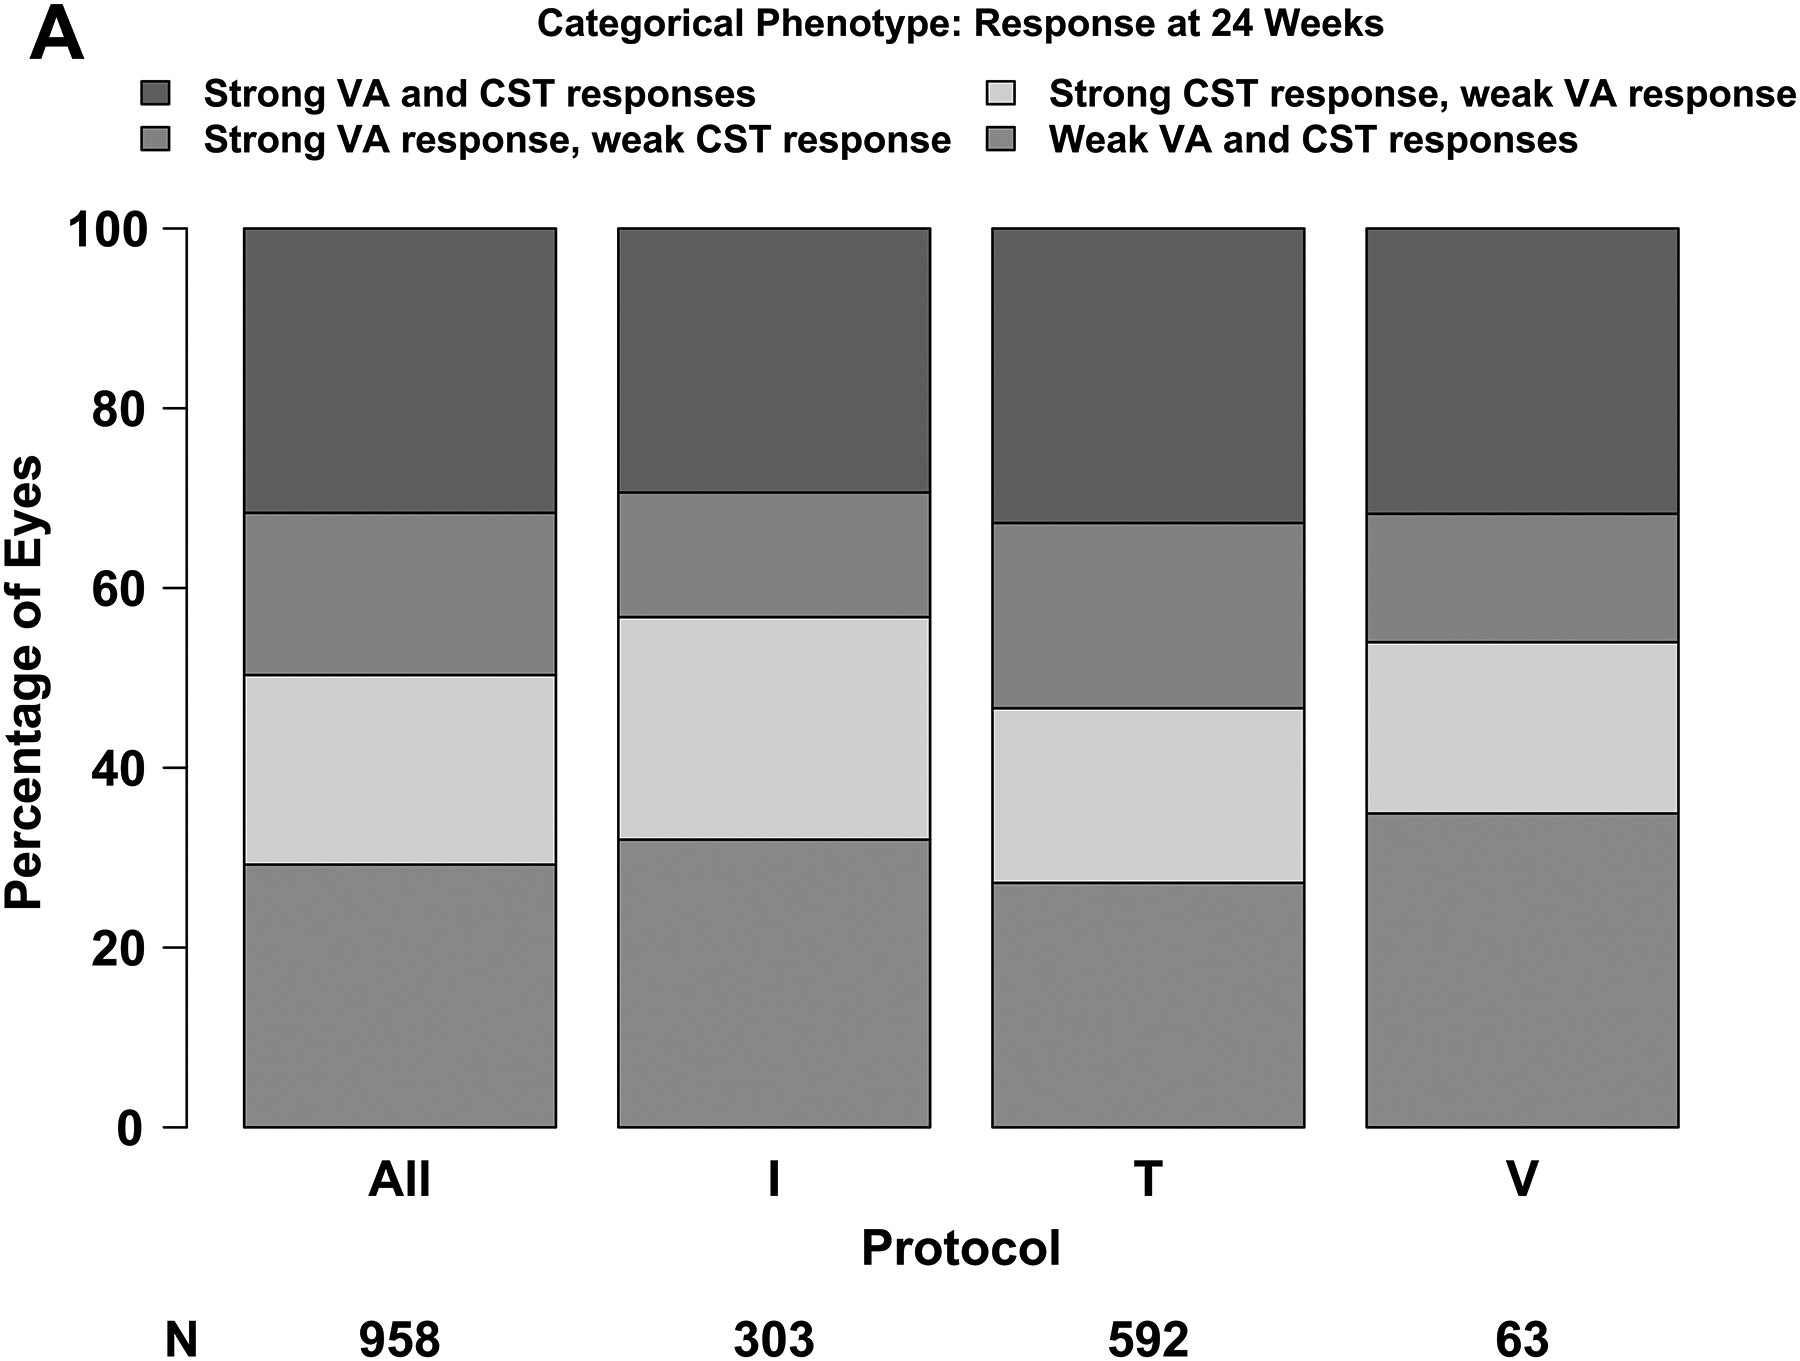
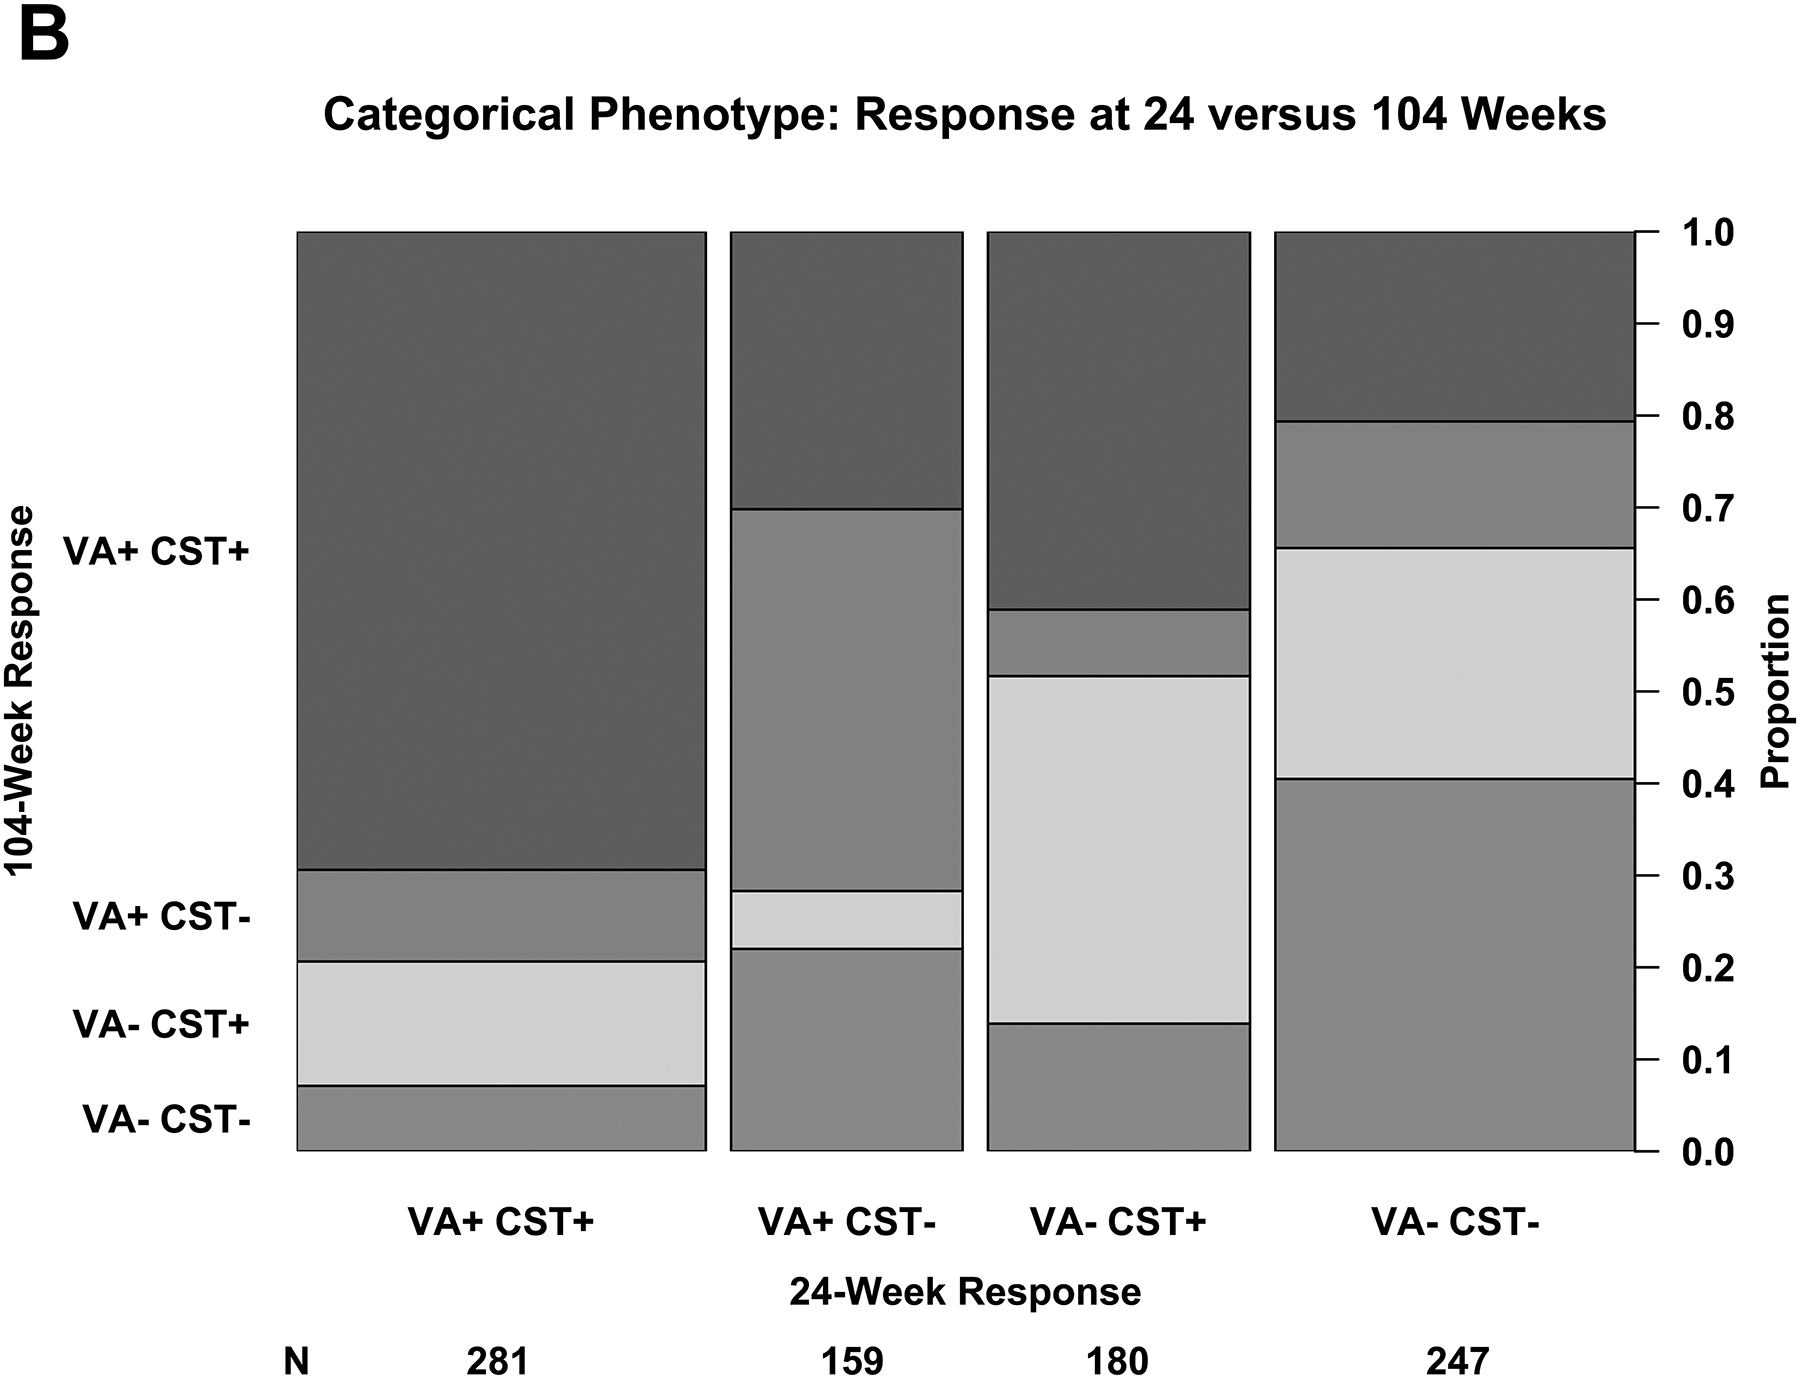
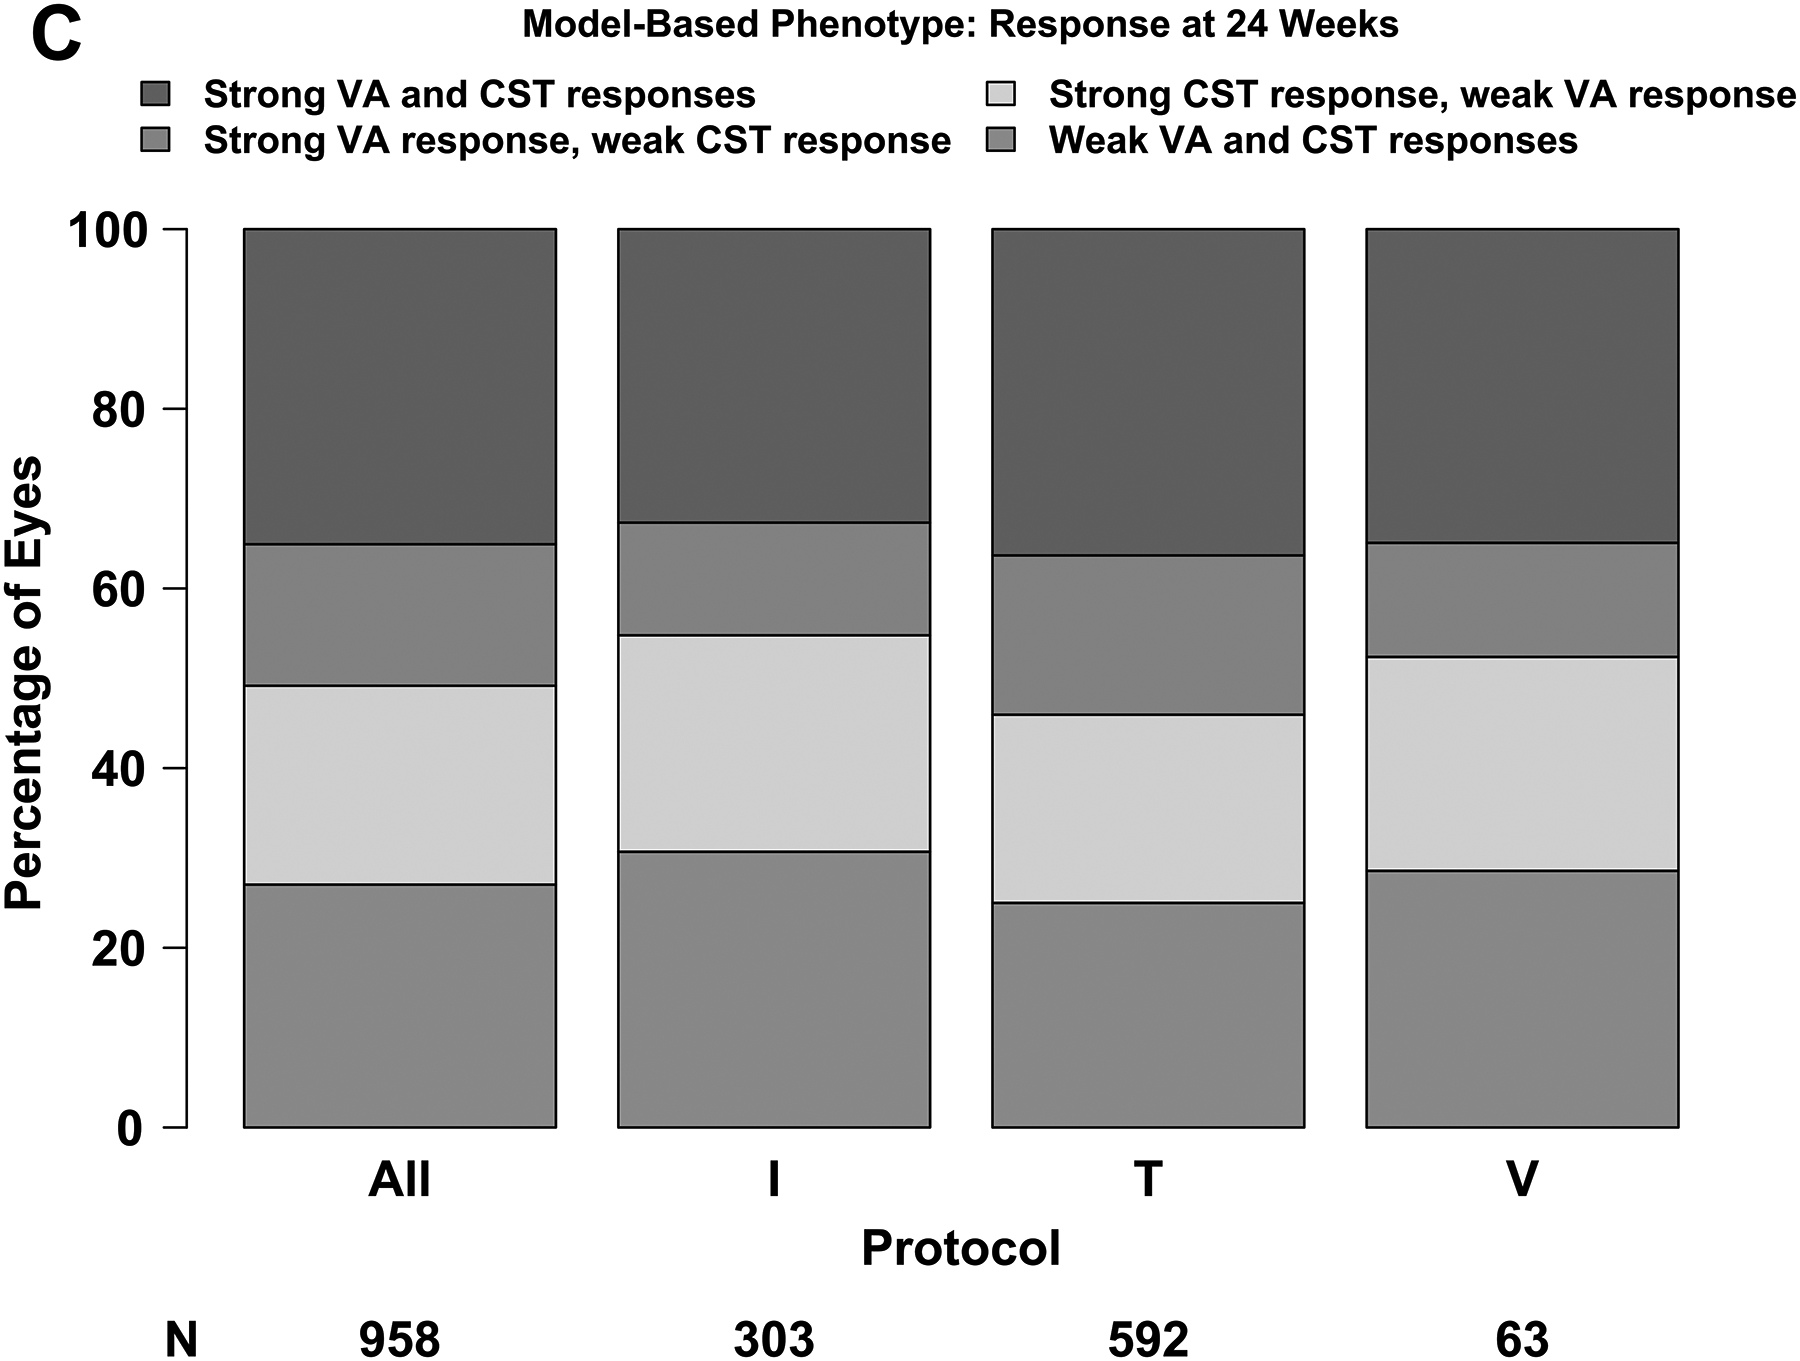
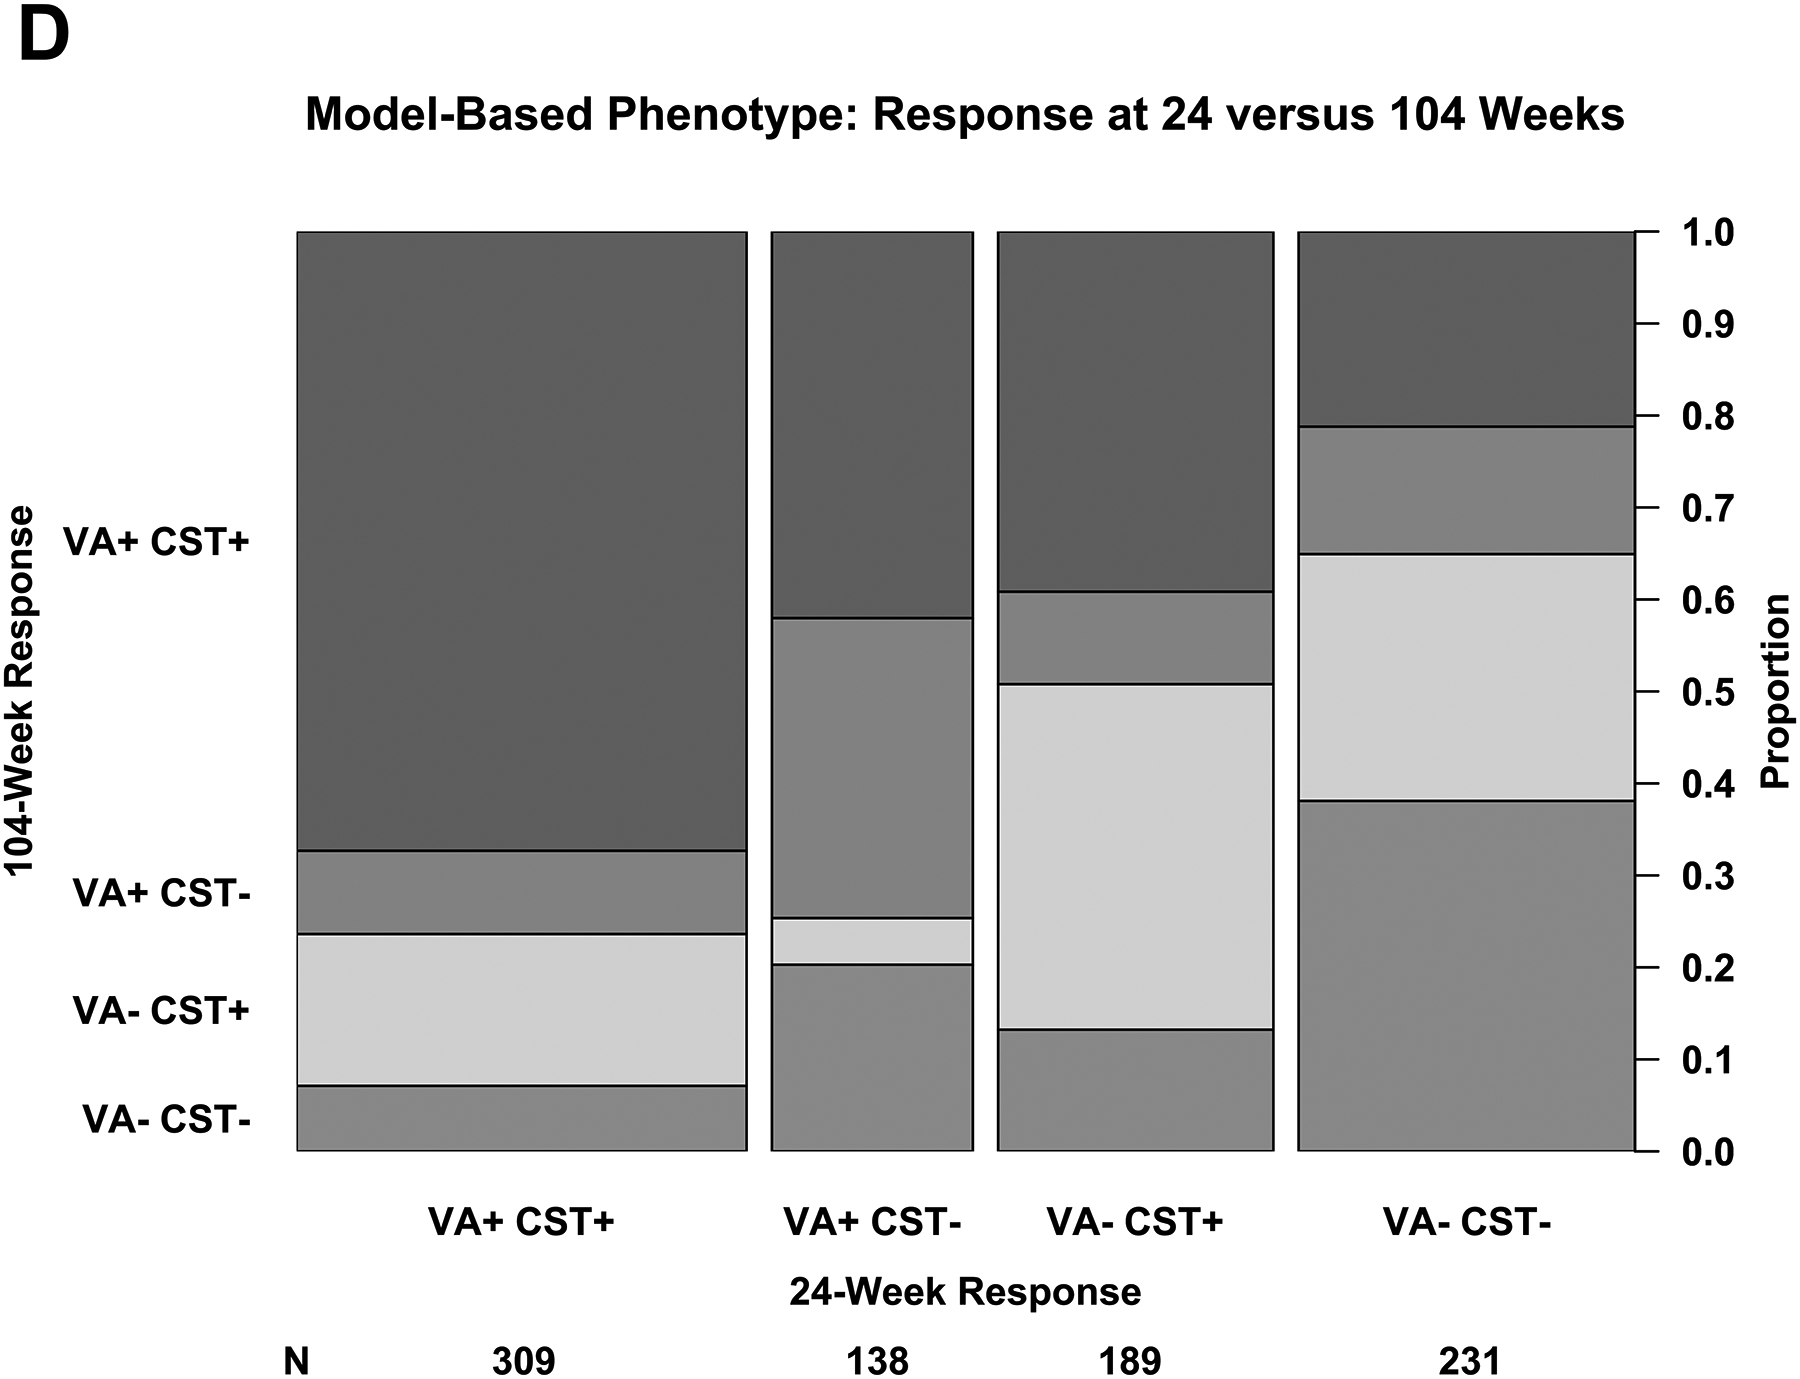
(A – D) Plus symbols (“+”) indicate strong response and minus symbols (“-”) indicate weak response. Strong visual acuity (VA) response was defined as at least a 5-, 10-, or 15-letter gain when baseline VA was 20/25 to 20/32, 20/40 to 20/63, and 20/80 to 20/320, respectively. (A, B) Strong central subfield thickness (CST) response was defined as a reduction of at least 50-, 100-, or 200-μm when baseline CST was <75 μm, 75 μm to <175 μm, and ≥175 μm above the CI-DME threshold at baseline. Thresholds for CI-DME are defined as follows: Heidelberg Spectralis, at least 305 μm for women and at least 320 μm for men; Zeiss Cirrus, at least 290 μm for women and at least 305 μm for men; Zeiss Stratus at least 250 μm for women and men. Strong response defined according to the thresholds and equations in eTable 2 and eTable 3. (C, D)
The total number of anti-VEGF injections received through 104 weeks varied by protocol and had no clear relationship to treatment response (eFigure 1A). This is likely because the retreatment algorithms in Protocols I, V and T required additional injections if eyes were improving or worsening but deferred when stability criteria were met.
Among eyes that had strong VA response regardless of CST at 24 weeks, 337 of 440 (77%) maintained a strong response at 104 weeks and 172 of 427 (40%) with a weak response at 24 weeks had a strong response at 104 weeks. Among eyes that had a strong CST response regardless of VA at 24 weeks, 375 of 461 (81%) maintained a strong response at 104 weeks and 171 of 406 (42%) with a weak response at 24 weeks had a strong response at 104 weeks.
Regression Equations for Visual Acuity and Retinal Thickening Outcomes
To classify eyes as having strong versus weak response with greater precision than the subgroups defined above, we fit regression equations to estimate change in VA and CST at 24 weeks as a continuous function of baseline VA and CST, respectively, with strong response defined as meeting or exceeding the expected value from the regression equation. Thresholds for strong response and the equations are given in eTable 2 and eTable 3 for change in VA and CST, respectively.
Figure 3A shows the observed change in VA at 24 weeks versus baseline VA and the regression line defining strong vs weak response. The median absolute difference between the observed and expected change in VA was 5.0 letters (IQR, 2.3–8.7 letters) and the R2 value was .18. Figure 3B shows the observed change in CST versus baseline thickening and the regression line defining strong vs weak response. The median absolute difference between the observed and expected values was 49 μm (IQR, 21–90 μm) and the R2 value was .50. There was agreement between the subgroup definitions and regression equation definitions of VA and CST response at 24 weeks among 790 of 958 eyes (82%).
Figure 3. Changes in Visual Acuity and Central Subfield Thickness at 24 Weeks: Model-Based Phenotype.
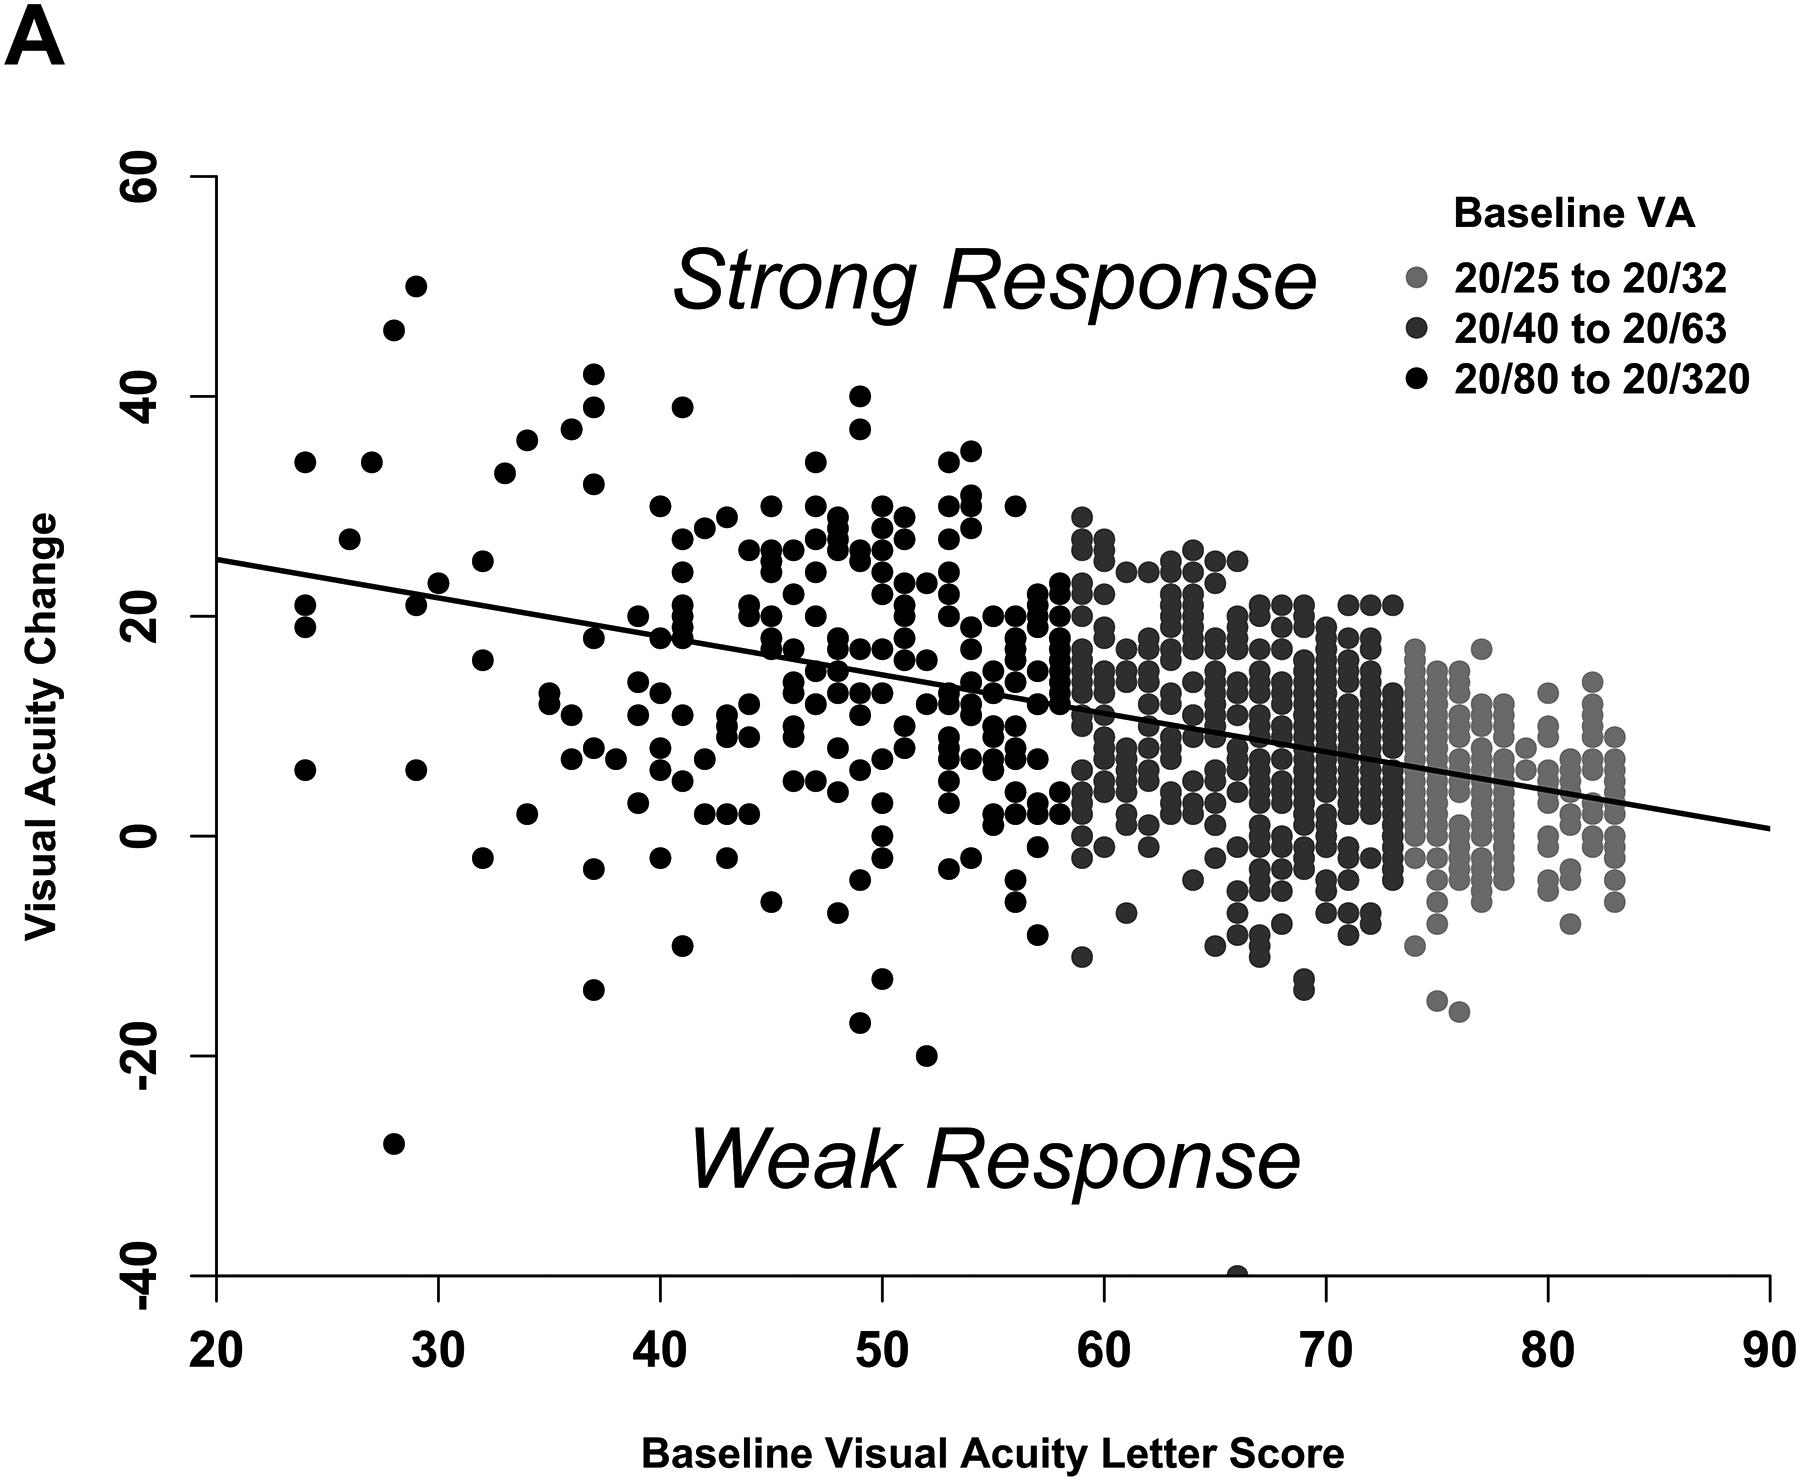
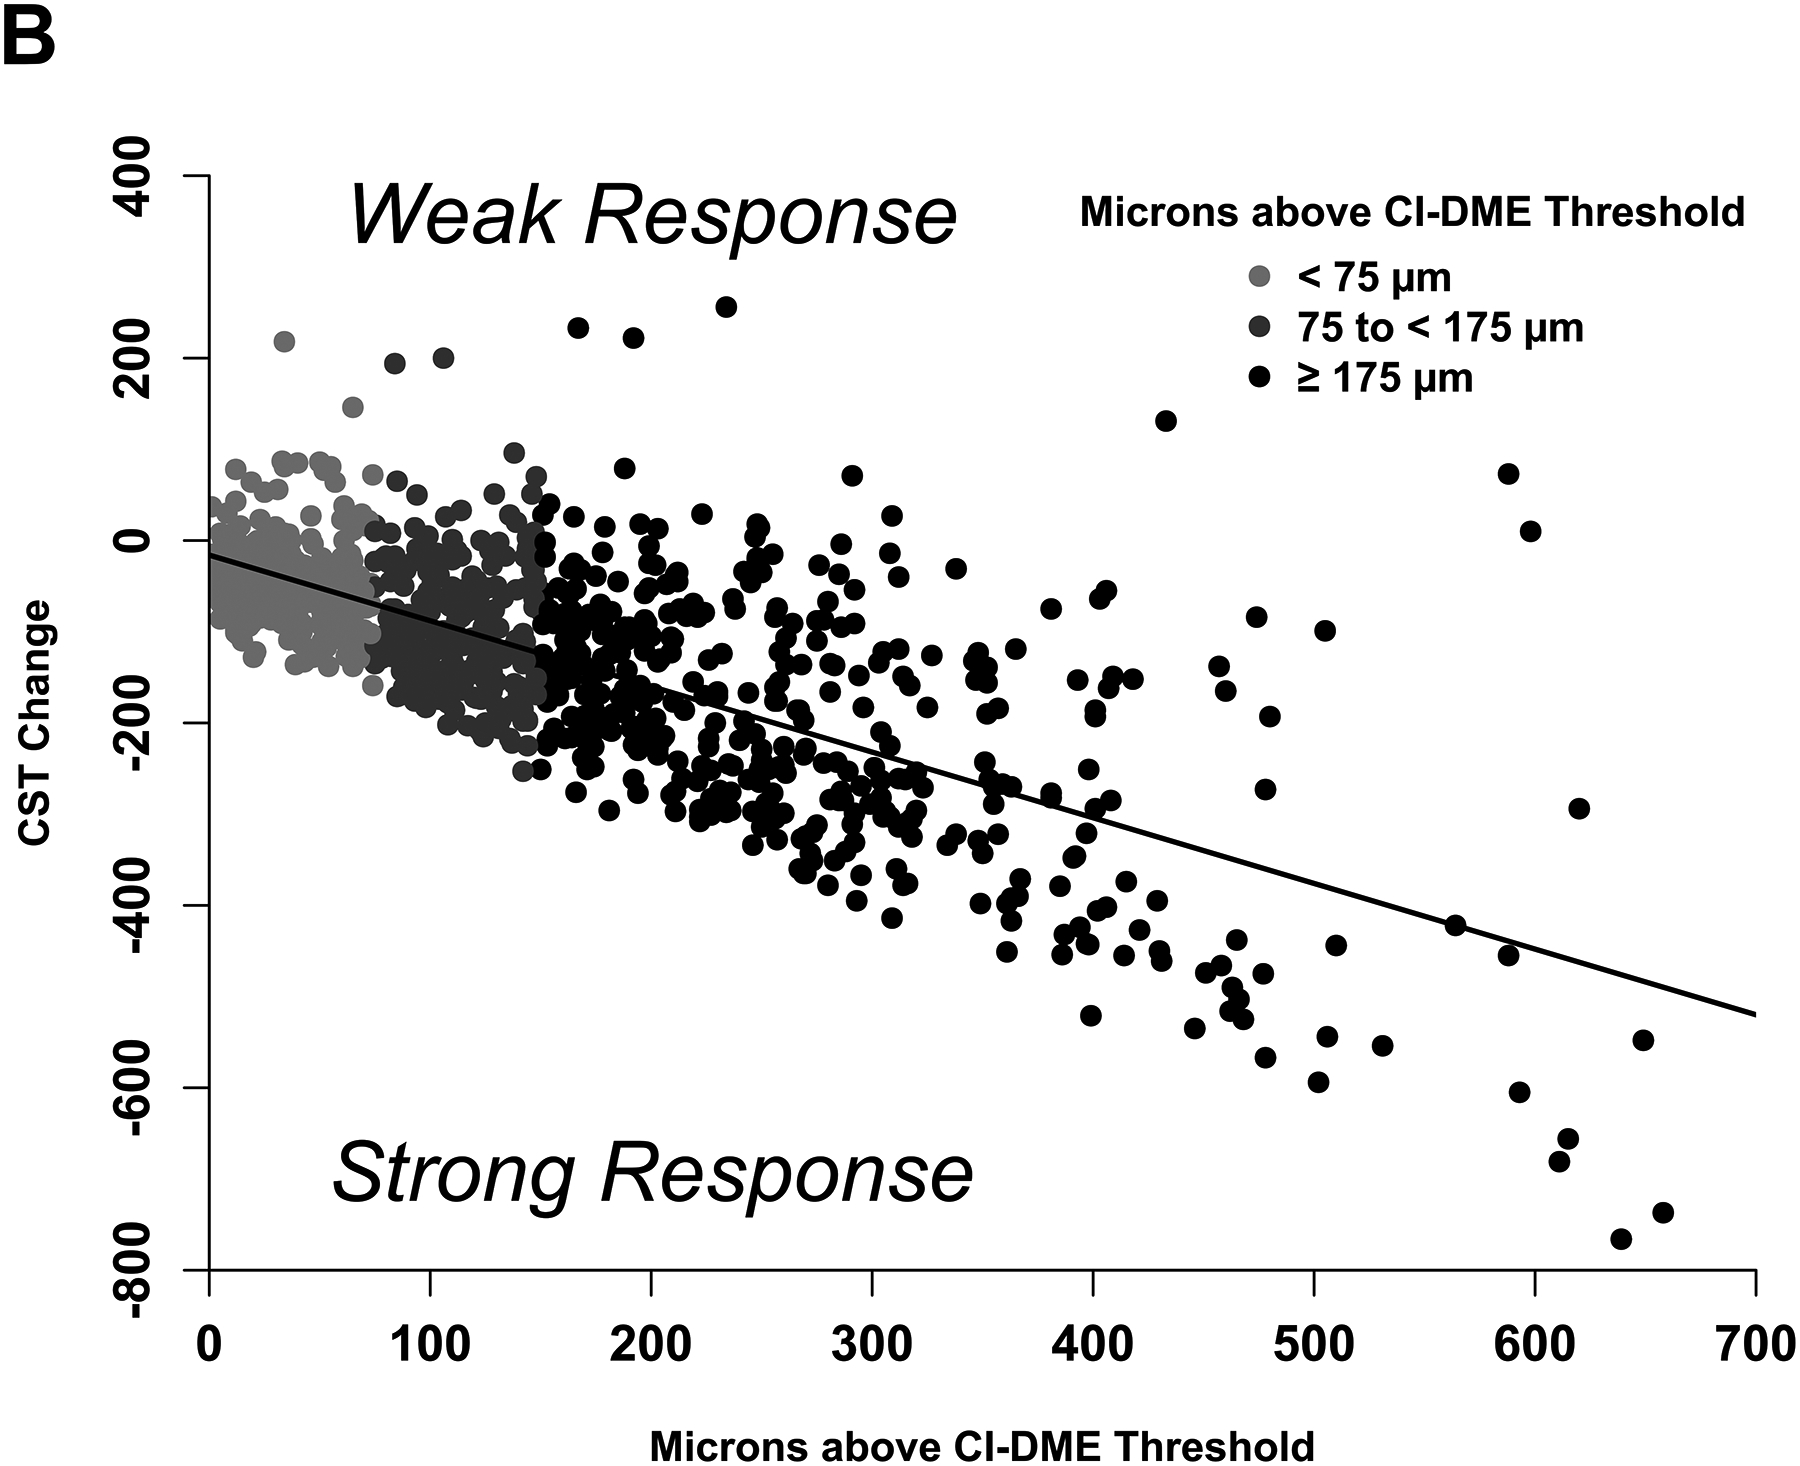
(A-B) Scatterplots showing the observed change in (A) visual acuity and (B) central subfield thickness at 24 weeks with least squares regression lines that define the model-based phenotype for strong and weak response.
The proportion of eyes with strong response on VA and/or CST at 24 weeks is shown in Figure 2C and the relationship between 24-week and 104-week outcomes based on the regression equations is shown in Figure 2D. The proportion of eyes with a strong response at 24 weeks and the relationship between 24-week and 104-week responses with the regression equation definitions were similar with the proportions observed with the categorical phenotypes outlined above. The number of injections by response and protocol is shown in eFigure 1B.
Using the definitions from the regression equation and among eyes that had strong VA response regardless of CST at 24 weeks, 339 of 447 (76%) maintained a strong response at 104 weeks and 174 of 420 (41%) that had a weak response at 24 weeks had a strong response at 104 weeks. Among eyes that had strong CST response regardless of VA at 24 weeks, 404 of 498 (81%) maintained a strong response at 104 weeks and 176 of 369 (48%) that had a weak response at 24 weeks had a strong response at 104 weeks.
Using data from Protocol T only, additional regression equations that incorporated anti-VEGF agent were created (eTable 2, eTable 3). Outcome rates at 24 weeks, 104 weeks, and number of injections by response are shown in eFigure 1 and eFigure 2
Discussion
This paper proposes standardized methods to categorize treatment responses of eyes undergoing anti-VEGF therapy for DME. Both VA and CST thresholds for strong response to anti-VEGF were presented because, depending on future questions, functional and/or anatomic response may be relevant to defining a successful treatment response. For ease of use, we have provided 3 major subgroups of baseline vision and retinal thickness with associated thresholds used to define strong versus weak response. We have also developed regression equations that can be used to determine threshold values for changes in vision and retinal thickness to define strong treatment response for more granular levels of baseline function and anatomy. These equations are available with and without interaction effects for anti-VEGF agent type.
Although the regression equations used to develop thresholds for defining strong treatment response might be useful to set expectations for mean changes in VA or CST and proportion improving across a population of eyes receiving anti-VEGF therapy for DME, they cannot be used to reliably predict individual outcomes. The R2 values associated with the regression equations for VA and CST were only 0.18 and 0.50, respectively, indicating that less than half of the variance in these outcomes can be explained by participants’ baseline values.
The phenotypes presented above can be judged by their ability to meet several key criteria for usefulness including clinical relevance, stability over time, and stability across diverse cohorts. These phenotypes are clinically relevant in that they provide thresholds of VA gain and CST reduction that are specific to different baseline values of VA and CST. Most eyes that met categorical phenotype criteria for a strong response at 24 weeks maintained a strong response (77% for VA and 81% for CST) at 104 weeks. Rates of strong versus weak response to anti-VEGF treatment also were similar between the cohorts from Protocols I, T, and V.
This study has limitations. First, these phenotypes were developed based on outcomes in eyes assigned to treatment with anti-VEGF for DME, and so may not be applicable to other treatment modalities, such as macular laser or intravitreal steroid, or to different diseases, such as age-related macular degeneration. Second, these methods do not consider patient characteristics associated with treatment response, such as age and hemoglobin A1c. The regression equations provided could be readily modified to incorporate additional factors by including these variables in statistical models as covariates.12–14 Third, although these phenotypes rely upon CST measurements that are common in both clinical practice and research settings, the ETDRS protocol refraction and electronic ETDRS VA test used in the DRCR Retina Network are not frequently employed in retinal clinical practice; thus, the baseline VA subgroups and thresholds of vision gain discussed in this paper may not be applicable to patients who undergo less rigorous methods of VA assessment. Finally, data splits besides the median and least squares regression were not evaluated; other splits may be better suited for some analyses.
The development of standardized methods to categorize eyes as having strong versus weak response to anti-VEGF treatment will be beneficial for future research efforts addressing eyes with DME. Additional validation studies will address to what extent these phenotypes can facilitate comparison of treatment response among cohorts with DME that differ in baseline VA and CST characteristics. Presently, these phenotypes are suitable for clinical research efforts to identify predictive biomarkers for response to anti-VEGF therapy for DME. By establishing standardized subgroups of strong versus weak responders to anti-VEGF, these phenotypes might aid efforts to identify targets beyond VEGF for future therapeutic investigations. We anticipate that these definitions of treatment response will be useful in subsequent DRCR Retina Network pharmacogenetic studies, in efforts to identify predictive biomarkers from blood, fluid, or tissue samples, and in artificial intelligence initiatives to predict anti-VEGF treatment response from retinal images.
Supplementary Material
Funding Support:
Research reported in this publication was supported by the National Eye Institute and the National Institute of Diabetes and Digestive and Kidney Diseases of the National Institutes of Health under Award Number UG1EY014231. The content is solely the responsibility of the authors and does not necessarily represent the official views of the National Institutes of Health. Regeneron provided funding and aflibercept for Protocols T and V; Genentech provided funding and ranibizumab for Protocols I and T (bevacizumab compounded by a central pharmacy was used off-label in protocol T); Allergan provided funding and study drug for Protocol I. The DRCR Retina Network had complete control over the design of the protocol, ownership of the data, all editorial content of presentations and publications related to the protocol, and the decision to submit for publication.
Role of the Sponsor:
The funding organization (National Institutes of Health) participated in oversight of the conduct of the study and review of the manuscript but not directly in the design or conduct of the study, nor in the collection, management, analysis, or interpretation of the data, or in the decision to submit for publication or the preparation of the manuscript.
References
- 1.Diabetic Retinopathy Clinical Research Network. Randomized trial evaluating ranibizumab plus prompt or deferred laser or triamcinolone plus prompt laser for diabetic macular edema. Ophthalmology. 2010;117(6):1064–1077 e1035. [DOI] [PMC free article] [PubMed] [Google Scholar]
- 2.Nguyen QD, Brown DM, Marcus DM, et al. Ranibizumab for diabetic macular edema: Results from 2 phase III randomized trials: RISE and RIDE. Ophthalmology. 2012;119(4):789–801. [DOI] [PubMed] [Google Scholar]
- 3.Korobelnik JF, Do DV, Schmidt-Erfurth U, et al. Intravitreal aflibercept for diabetic macular edema. Ophthalmology. 2014;121(6):2247–2254. [DOI] [PubMed] [Google Scholar]
- 4.Beck RW, Maguire MG, Bressler NM, Glassman AR, Lindblad AS, Ferris FL. Visual acuity as an outcome measure in clinical trials of retinal diseases. Ophthalmology. 2007;114(10):1804–1809. [DOI] [PubMed] [Google Scholar]
- 5.Browning DJ, Glassman AR, Aiello LP, et al. Optical coherence tomography measurements and analysis methods in optical coherence tomography studies of diabetic macular edema. Ophthalmology. 2008;115(8):1366–1371, 1371 e1361. [DOI] [PMC free article] [PubMed] [Google Scholar]
- 6.Diabetic Retinopathy Clinical Research Network, Wells JA, Glassman AR, et al. Aflibercept, bevacizumab, or ranibizumab for diabetic macular edema. N Engl J Med. 2015;372(13):1193–1203. [DOI] [PMC free article] [PubMed] [Google Scholar]
- 7.Baker CW, Glassman AR, Beaulieu WT, et al. Effect of initial management with aflibercept vs laser photocoagulation vs observation on vision loss among patients with diabetic macular edema involving the center of the macula and good visual acuity: a randomized clinical trial. JAMA. 2019;321(19):1880–1894. [DOI] [PMC free article] [PubMed] [Google Scholar]
- 8.Chalam KV, Bressler SB, Edwards AR, et al. Retinal thickness in people with diabetes and minimal or no diabetic retinopathy: Heidelberg Spectralis optical coherence tomography. Invest Ophthalmol Vis Sci. 2012;53(13):8154–8161. [DOI] [PMC free article] [PubMed] [Google Scholar]
- 9.Writing Committee for the Diabetic Retinopathy Clinical Research Network, Gross JG, Glassman AR, et al. Panretinal photocoagulation vs intravitreous ranibizumab for proliferative diabetic retinopathy: A randomized clinical trial. JAMA. 2015;314(20):2137–2146. [DOI] [PMC free article] [PubMed] [Google Scholar]
- 10.Bell ML, King MT, Fairclough DL. Bias in Area Under the Curve for Longitudinal Clinical Trials With Missing Patient Reported Outcome Data: Summary Measures Versus Summary Statistics. SAGE Open. 2014;4(2):2158244014534858. [Google Scholar]
- 11.Bressler SB, Edwards AR, Chalam KV, et al. Reproducibility of spectral-domain optical coherence tomography retinal thickness measurements and conversion to equivalent time-domain metrics in diabetic macular edema. JAMA ophthalmology. 2014;132(9):1113–1122. [DOI] [PMC free article] [PubMed] [Google Scholar]
- 12.Glassman AR, Baker CW, Beaulieu WT, et al. Assessment of the DRCR Retina Network Approach to Management With Initial Observation for Eyes With Center-Involved Diabetic Macular Edema and Good Visual Acuity: A Secondary Analysis of a Randomized Clinical Trial. JAMA Ophthalmology. 2020;138(4):341–349. [DOI] [PMC free article] [PubMed] [Google Scholar]
- 13.Bressler SB, Odia I, Maguire MG, et al. Factors Associated With Visual Acuity and Central Subfield Thickness Changes When Treating Diabetic Macular Edema With Anti–Vascular Endothelial Growth Factor Therapy: An Exploratory Analysis of the Protocol T Randomized Clinical Trial. JAMA Ophthalmology. 2019;137(4):382–389. [DOI] [PMC free article] [PubMed] [Google Scholar]
- 14.Bressler SB, Qin H, Beck RW, et al. Factors associated with changes in visual acuity and central subfield thickness at 1 year after treatment for diabetic macular edema with ranibizumab. Arch Ophthalmol. 2012;130(9):1153–1161. [DOI] [PMC free article] [PubMed] [Google Scholar]
Associated Data
This section collects any data citations, data availability statements, or supplementary materials included in this article.


