

Abstract
Background
Chronic disease management is a major health issue worldwide. With the paradigm shift to preventive medicine, disease prediction modeling using machine learning is gaining importance for precise and accurate medical judgement.
Objective
This study aimed to develop high-performance prediction models for 4 chronic diseases using the common data model (CDM) and machine learning and to confirm the possibility for the extension of the proposed models.
Methods
In this study, 4 major chronic diseases—namely, diabetes, hypertension, hyperlipidemia, and cardiovascular disease—were selected, and a model for predicting their occurrence within 10 years was developed. For model development, the Atlas analysis tool was used to define the chronic disease to be predicted, and data were extracted from the CDM according to the defined conditions. A model for predicting each disease was built with 4 algorithms verified in previous studies, and the performance was compared after applying a grid search.
Results
For the prediction of each disease, we applied 4 algorithms (logistic regression, gradient boosting, random forest, and extreme gradient boosting), and all models show greater than 80% accuracy. As compared to the optimized model’s performance, extreme gradient boosting presented the highest predictive performance for the 4 diseases (diabetes, hypertension, hyperlipidemia, and cardiovascular disease) with 80% or greater and from 0.84 to 0.93 in area under the curve standards.
Conclusions
This study demonstrates the possibility for the preemptive management of chronic diseases by predicting the occurrence of chronic diseases using the CDM and machine learning. With these models, the risk of developing major chronic diseases within 10 years can be demonstrated by identifying health risk factors using our chronic disease prediction machine learning model developed with the real-world data–based CDM and National Health Insurance Corporation examination data that individuals can easily obtain.
Keywords: common data model, chronic disease, prediction model, machine learning, disease management, data model, disease prediction, prediction, risk prediction, risk factors, health risk
Introduction
World Health Organization’s Global Action Plan (2013-2020) for noninfectious diseases aims to reduce the premature death rate stemming from chronic diseases by 25% by 2025 [1]. The plan also urges the establishment of national policies and management of performance indicators.
Accordingly, the Ministry of Health and Welfare of South Korea has designated cardiovascular disease, diabetes, chronic respiratory disease, and cancer as chronic diseases to be managed by the government [2] and established a chronic disease management system centered on local hospitals. In March 2014, a community primary care pilot project for high blood pressure and patients with diabetes was initiated. In September 2016, the chronic disease management pilot project was carried out. From January 2019 to the present, a primary medical chronic disease management pilot project was conducted. Nevertheless, chronic diseases remain the primary cause of mortality and increasing medical expenses. According to the Korea Centers for Disease Control and Prevention, in 2020, chronic diseases were responsible for 7 out of 10 deaths in the country, accounting for 83.7% of total medical expenses [3].
Chronic diseases develop from metabolic syndrome that are caused by lifestyle or individual genetic and environmental factors [4]. The development of chronic disease leads to various complications or requires long-term treatment [5]. Therefore, it is important to take preemptive measures along with the prevention of metabolic syndrome. In this respect, it is necessary to develop various disease prediction models to reduce the risk of complications and medical costs.
Fortunately, early-stage disease prediction is gaining momentum with the use of real-world data combined with machine learning technology. Lee et al [6] predicted the risk of metabolic syndrome (area under the curve [AUC]=0.879) using machine learning techniques, and Choi et al [7] predicted disease occurrence using recurrent neural networks (diagnosis up to 79%). Lipton et al [8] predicted the probability of chronic disease by applying long short-term memory (AUC=0.81-0.99). However, the disease occurrence prediction models developed in South Korea used traditional statistical techniques, and most international predictive models were developed for Western White populations and therefore have reduced applicability to other countries and racial groups.
Although there are already many studies using electronic medical record (EMR) and machine learning, they have limitations in requiring a definition of medical terms or preprocessing for standardization in multicentered studies, entailing that these studies cannot be synchronized with other prediction models. There are relatively few papers on predictive model development using the common data model (CDM; although version 6.0 was release recently, version 5.4 of the Observational Medical Outcomes Partnership CDM is supported by the Observational Health Data Sciences and Informatics suite of tools and methods), which can overcome these limitations. In this paper, we aimed to develop a scalable chronic disease prediction model using the CDM.
Methods
Subjects
We used the data of 790,822 subjects with at least one year of hospital records among subjects aged ≥20 years who had also visited a tertiary hospital in South Korea (Ajou University Hospital in Suwon) from 1999 to 2020. To predict the risk of developing chronic diseases for the subjects as they age, patients with chronic diseases (type 2 diabetes, high blood pressure, hyperlipidemia, and cardiovascular disease) as the underlying disease were excluded (Figure 1).
Figure 1.
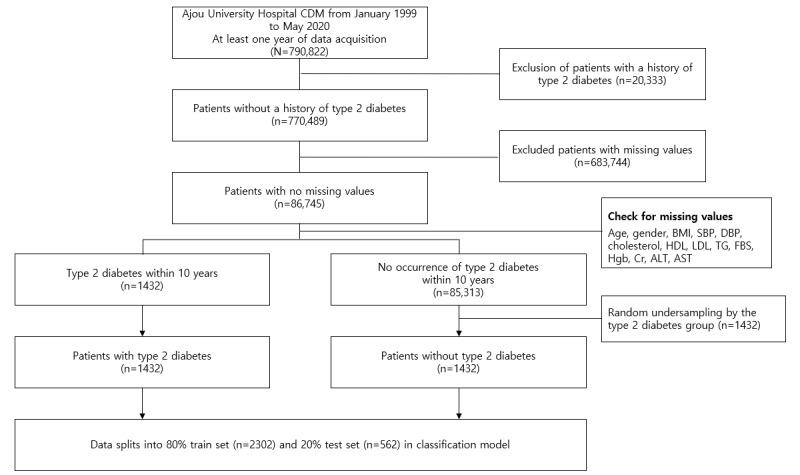
The process of selecting subjects for the type 2 diabetes study. ALT: alanine aminotransferase; AST: aspartate aminotransferase; CDM: common data model; Cr: creatinine; DBP: diastolic blood pressure; FBS: fasting blood glucose; HDL: high-density lipoprotein; Hgb: hemoglobin; LDL: low-density lipoprotein; SBP: systolic blood pressure; TG: triglyceride.
Select Model Variables
The public health checkup is a test for adults aged >18 years in South Korea, and anyone can use it for free. Variables were selected based on the general examination of items from the National Health Insurance Service. A total of 19 variables were included, such as basic information, measurement information, lifestyle information, and history of diseases.
Data Extraction
The data used in the predictive model were extracted using the Atlas analysis tool (Observational Health Data Sciences and Informatics—a nonprofit consortium that allows researchers to perform design, characterization, and analysis). A cohort for chronic diseases was created through Atlas design for the variables used in the cohort. Concept IDs following the Systematized Nomenclature Of Medicine–Clinical Terms terminology were used, which are mapped to the International Classification of Diseases, 10th Revision code and currently used as a diagnostic name in clinical practice. Systematized Nomenclature Of Medicine–Clinical Terms were developed to meet the various needs and expectations of clinicians around the world, and it is an international standard terminology system used in more than 80 countries, helping to consistently express clinical contents in medical information records. Additionally, concept IDs following the Local Laboratory Result Code terminology, mapped with the managed local code, was used. Local Laboratory Result Code refers to international standard test terms, and medical terms are defined and standardized for the standardization of test codes. Table 1 shows the concept IDs used in the defined cohort group.
Table 1.
Concept ID information.
| Variables | Concept ID | Concept name | Type | Vocabulary |
| Type 2 diabetes |
|
Type 2 diabetes mellitus | Factor | SNOMED-CTa |
| Hypertension |
|
Hypertensive disorder | Factor | SNOMED-CT |
| Hyperlipidemia |
|
Hyperlipidemia | Factor | SNOMED-CT |
| Cardiovascular disease |
|
Disorder of cardiovascular system | Factor | SNOMED-CT |
| BMI |
|
Body mass index (ratio) | Numeric | LOINCb |
| SBPc |
|
Systolic blood pressure | Numeric | LOINC |
| DBPd |
|
Diastolic blood pressure | Numeric | LOINC |
| Total cholesterol |
|
Cholesterol (mass/volume) in serum or plasma | Numeric | LOINC |
| HDLe |
|
Cholesterol in high-density lipoprotein (mass/volume) in serum or plasma | Numeric | LOINC |
| LDLf |
|
Cholesterol in low-density lipoprotein (mass/volume) in serum or plasma | Numeric | LOINC |
| TGg |
|
Triglyceride (mass/volume) in serum or plasma | Numeric | LOINC |
| FBSh |
|
Fasting glucose (mass/volume) in serum or plasma | Numeric | LOINC |
| Hgbi |
|
Hemoglobin (mass/volume) in blood | Numeric | LOINC |
| Crj |
|
Creatinine (mass/volume) in serum or plasma | Numeric | LOINC |
| ASTk |
|
Aspartate aminotransferase (enzymatic activity/volume) in serum or plasma | Numeric | LOINC |
| ALTl |
|
Alanine aminotransferase (enzymatic activity/volume) in serum or plasma | Numeric | LOINC |
aSNOMED-CT: Systematized Nomenclature Of Medicine–Clinical Terms.
bLONIC: Local Laboratory Result Code.
cSBP: systolic blood pressure.
dDBP: diastolic blood pressure.
eHDL: high-density lipoprotein.
fLDL: low-density lipoprotein.
gTG: triglyceride.
hFBS: fasting blood glucose.
iHgb: hemoglobin.
jCr: creatinine.
kAST: aspartate aminotransferase.
lALT: alanine aminotransferase.
The defined cohort group was divided into a disease-occurring group and a nonoccurring group according to the presence or absence of a diagnosed chronic disease within 10 years from the index date (when the criteria for participation in the study were met). Cohort generation and data extraction were performed according to the design criteria shown in Textbox 1.
Design criteria.
Target group
Patients who visited the hospital from January 1, 1999, to May 31, 2020
Patients with data for 180 days before and after the index date
Patients diagnosed with chronic diseases (type 2 diabetes, hypertension, hyperlipidemia, or cardiovascular disease) within 10 years from the index date
Comparator group
Patients who visited the hospital from January 1, 1999, to May 31, 2020
Patients with data for 180 days before and after the index date
Patients who have not been diagnosed with chronic diseases (type 2 diabetes, hypertension, hyperlipidemia, or cardiovascular disease) within 10 years from the index date.
Exclusion criteria
A history of chronic diseases (diabetes, high blood pressure, hyperlipidemia, or cardiovascular disease) for any period before the selection duration
Missing basic information, examination, and questionnaire items that were selected as essential items in the study for the development of the chronic disease prediction model
Data Preparation
We used the patient information, medical treatment, and examination data from a tertiary hospital in South Korea for the CDM. If the missing value was a numeric variable, it was replaced with the median of the matching gender for each age group (stratified into 5-year units), and in the case of a categorical variable, it was replaced with the mode of the matching gender for each age group. Since the number of samples between the 2 groups was unbalanced, random undersampling was performed in the nondiabetic group within 10 years to match the size of the diabetic group. Although data balancing can be hidden from the actual prevalence in practice, it ensures model performance for new data by preventing biased learning from highly imbalanced class problems.
Statistical Analysis
The descriptive statistics of each group (target group and comparator group) are shown in Table 2.
Table 2.
Descriptive statistics.
| Feature | Processed data | Target | Comparator | |
| Sex, n | ||||
|
|
Female | 1157 | 586 | 571 |
|
|
Male | 1691 | 838 | 853 |
| Age (years), mean (SD) | 47.56 (15.03) | 54.94 (12.50) | 40.17 (13.60) | |
| BMI, mean (SD) | 24.59 (5.68) | 25.69 (7.05) | 23.50 (3.55) | |
| SBPa, mean (SD) | 128.1 (16.95) | 132.5 (17.49) | 123.6 (14.86) | |
| DBPb, mean (SD) , mean (SD) | 79.29 (11.89) | 81.56 (12.04) | 77.03 (11.16) | |
| Total cholesterol, mean (SD) | 189.4 (39.84) | 192.9 (42.40) | 185.8 (36.76) | |
| HDLc, mean (SD) | 51.45 (12.52) | 47.55 (10.82) | 55.36 (13.01) | |
| LDLd, mean (SD) | 111.9 (29.57) | 114 (28.95) | 109.7 (30.13) | |
| TGe, mean (SD) | 143.1 (55.0) | 145.0 (59.06) | 115.2 (43.63) | |
| FBSf, mean (SD) | 116.4 (45.64) | 136.7 (54.40) | 96.04 (20.31) | |
| Hgbg, mean (SD) | 14.27 (1.70) | 14.18 (1.83) | 14.36 (1.56) | |
| Crh, mean (SD) | 0.99 (0.68) | 1.045 (0.92) | 0.93 (0.26) | |
| ASTi, mean (SD) | 27.93 (9.64) | 31.71 (8.91) | 24.15 (11.20) | |
| ALTj, mean (SD) | 31.16 (11.89) | 37.46 (8.19) | 24.87 (14.87) | |
aSBP: systolic blood pressure.
bDBP: diastolic blood pressure.
cHDL: high-density lipoprotein.
dLDL: low-density lipoprotein.
eTG: triglyceride.
fFBS: fasting blood glucose.
gHgb: hemoglobin.
hCr: creatinine.
iAST: aspartate aminotransferase.
jALT: alanine aminotransferase.
Models
Overview
In this study, to select the most suitable model for disease prediction, we used the following 4 algorithms: logistic regression (LR), random forest (RF), gradient boosting model (GBM), and extreme gradient boosting (XGBoost). LR using binary classification in the statistics field and the other 3 machine learning algorithms had shown better performance than similar prior research [9]. Afterward, the prediction performance was compared. Model validation was conducted with the same 80% training data and 20% validation data derived from the entire data set. Accuracy, sensitivity, specificity, and AUC were used as model performance indicators. The prediction model flow is shown in Figure 2.
Figure 2.
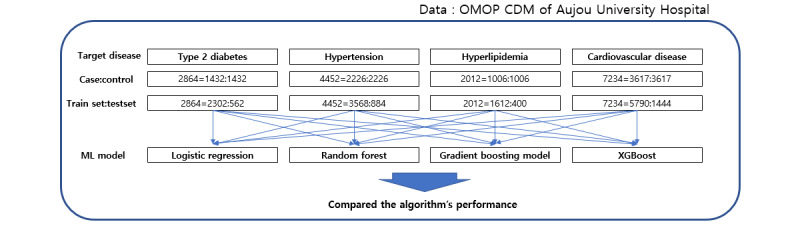
Prediction model flow. CDM: common data model; ML: machine learning; OMOP: Observational Medical Outcomes Partnership; XGBoost: extreme gradient boosting.
LR Algorithm
LR was devised by Cox [10] as a regression model that predicts the probability of the occurrence of an event with respect to a binary dependent variable. Unlike general linear regression analysis, the range of LR is limited to 0-1 because the dependent variable is dichotomous, and the conditional probability of the occurrence of an event also follows a binomial distribution. That is, if the estimated value following the logistic function satisfying the above assumption is less than 0.5, the predicted value is classified as “nonoccurring,” and if it is greater than 0.5, then the predicted value is classified as “occurring.” Although LR was developed in 1970, it is still being used for statistical analysis and predictive research in various fields.
RF Algorithm
RF is a tree-based ensemble model capable of both classification and regression and selects the most appropriate forest model by collecting the results of randomly generated independent decision trees [11]. Bagging-based training data inputted to the tree provides model diversity, and the randomness of variable combinations constituting the tree can prevent model noise and the risk of overfitting. The fact that RF is less sensitive to missing values than other algorithms is also an advantage.
GBM Algorithm
GBM is a tree-based ensemble model similar to RF, but unlike RF, it creates a tree using a boosting method. The boosting method increases the performance of classification or prediction by sequentially combining several small models [12]. GBM reduces the errors generated by the previous model. Although GBM shows high performance in prediction, it may take a lot of time to fit the model because training requires extensive computation. In recent years, GBM-based algorithms such as LightGBM [13], CatBoost, and XGBoost have been developed to overcome the shortcomings of GBM.
XGBoost Algorithm
XGBoost is a representative tree-based ensemble model devised by Chen and Guestrin [14]. It is a machine learning algorithm actively used in prediction and classification research because of its powerful performance and has many advantages such as fast learning due to parallel processing, overfitting regulation, and linkage with other algorithms. Since XGBoost is based on GBM, it optimizes the model by assigning weights using a boosting method, reducing the residual error of the model created with classification and regression tree algorithm–based trees.
Grid Search
Unlike LR analysis, machine learning algorithms support various parameters (hyperparameters) so that users can optimize the model. Grid search is a technique to find the parameter value when the model has the highest performance by sequentially applying the parameter values set by the user. We optimized the model by applying grid search to the above 3 algorithms (RF, GBM, and XGBoost). Table S1 in Multimedia Appendix 1 presents the parameters and ranges used in the grid search for each algorithm.
Results
Model Results
Comparing model performance by chronic disease, the predictive model using XGBoost based on accuracy showed superior performance in all diseases compared to the other 3 models (Table 3).
Table 3.
Performance comparison of disease prediction models.
| Parameter, chronic disease | LRa | RFb | GBMc | XGBoostd | |
| Accuracy | |||||
|
|
Type 2 Diabetes | 0.877 | 0.8743 | 0.8743 | 0.8824 |
|
|
Hypertension | 0.7783 | 0.793 | 0.7896 | 0.8213 |
|
|
Hyperlipidemia | 0.8125 | 0.82 | 0.8325 | 0.8325 |
|
|
Cardiovascular disease | 0.7941 | 0.8162 | 0.8235 | 0.8429 |
| Sensitivity | |||||
|
|
Type 2 Diabetes | 0.8852 | 0.8804 | 0.8684 | 0.8705 |
|
|
Hypertension | 0.7758 | 0.7758 | 0.7783 | 0.7934 |
|
|
Hyperlipidemia | 0.8141 | 0.8556 | 0.8077 | 0.8182 |
|
|
Cardiovascular disease | 0.8143 | 0.8644 | 0.8030 | 0.8243 |
| Specificity | |||||
|
|
Type 2 Diabetes | 0.8691 | 0.8684 | 0.8804 | 0.8950 |
|
|
Hypertension | 0.7808 | 0.7808 | 0.8019 | 0.8550 |
|
|
Hyperlipidemia | 0.8109 | 0.8122 | 0.8333 | 0.8482 |
|
|
Cardiovascular disease | 0.8333 | 0.7792 | 0.7857 | 0.8636 |
aLR: logistic regression.
bRF: random forest.
cGBM: gradient boosting model.
dXGBoost: extreme gradient boosting.
Model Validation Results
Table 4 shows the parameter values of each disease model outputted by the XGBoost grid search.
Table 4.
Extreme gradient boosting grid search result.
| Target disease | Subsamplea | Max depthb | Min childc | Etad |
| Type 2 diabetes | 0.7 | 7 | 2 | 0.1 |
| Hypertension | 0.9 | 3 | 2 | 0.01 |
| Hyperlipidemia | 1 | 3 | 2 | 0.01 |
| Cardiovascular disease | 0.9 | 3 | 1 | 0.01 |
aSubsample: sample’s rate of each tree.
bMax depth: maximum depth of Tree.
cMin child: minimum sum of weights for all observations needed in the child.
dEta: learning rate.
The model evaluation indicators used were accuracy, sensitivity, specificity, and AUC. Over 80% prediction accuracy was achieved for all diseases, with AUC from 0.84 to 0.93. The XGBoost model performance by disease is shown in Table 5 and Figure 3.
Table 5.
Predictive performance by model.
| Target disease | Accuracy | Sensitivity | Specificity | AUCa |
| Type 2 diabetes | 0.8824 | 0.8705 | 0.8950 | 0.9303 |
| Hypertension | 0.8213 | 0.7934 | 0.8550 | 0.8704 |
| Hyperlipidemia | 0.8325 | 0.8182 | 0.8432 | 0.8442 |
| Cardiovascular disease | 0.8429 | 0.8243 | 0.8636 | 0.8726 |
aAUC: area under the curve.
Figure 3.
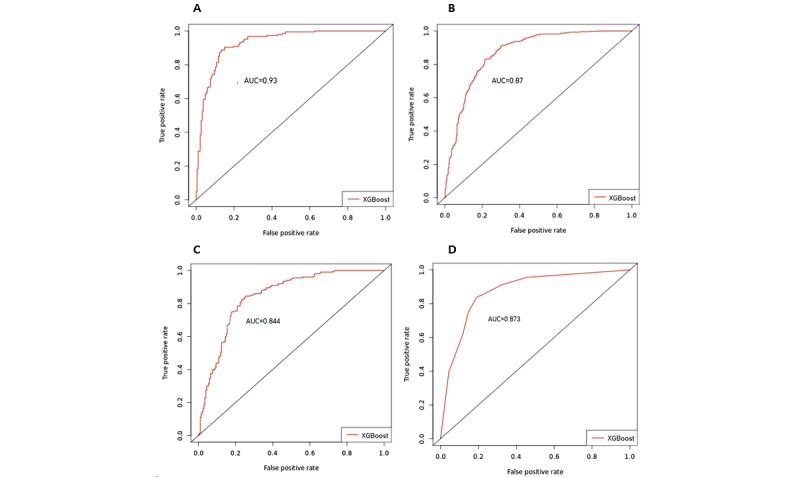
Receiver operating characteristic curves for XGBoost (A) type 2 diabetes model, (B) hypertension model, (C) hyperlipidemia model, and (D) cardiovascular disease model. AUC: area under the curve; XGBoost: extreme gradient boost.
Shapley Additive Explanations Model Variable Importance
In open-source program languages (eg, Python and R), the XGBoost package shows model feature importance using its own library. However, small models are more combined and complicated, and the feature importance of small models becomes inconsistent. Therefore, we used the Shapley additive explanations (SHAP) method to represent the model’s feature importance, which had high consistency and accuracy [15]. SHAP’s feature importance used the weighted average of marginal contribution for each feature (Shapley value). It gave the importance of the features and the positive or negative effect of each feature. The formula of Shapley value is a follows:
| Contribution of featurei = βixi – E(βixi) = βixi – βiE(xi) |
 |
where Øi is the Shaley value of datai, F is the full set, S is the subsets in total set excluding datai,  is the contribution of the full set including datai, and fS (xS) is the contribution of subsets excluding datai.
The SHAP value graph of the fitted model for each disease is presented in Figure 4.
Figure 4.
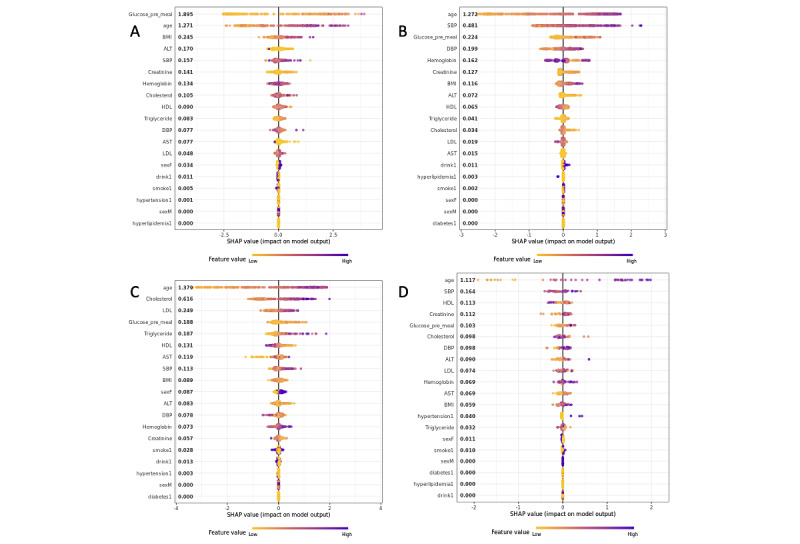
Shapley additive explanations (SHAP) value graph of the fitted model for the importance of (A) type 2 diabetes variables, (B) hypertension variables, (C) hyperlipidemia variables, and (D) cardiovascular disease variables. ALT: alanine aminotransferase; AST: aspartate aminotransferase; DBP: diastolic blood pressure; HDL: high-density lipoprotein; LDL: low-density lipoprotein; SBP: systolic blood pressure.
In the case of type 2 diabetes, fasting blood glucose (Shapley value=1.895), age (1.271), and BMI (0.245) influenced the occurrence of diabetes within 10 years [16]. For hypertension, hyperlipidemia (1.272), cardiovascular disease (1.379), and age (1.117) had the greatest influence on disease occurrence. Furthermore, in the case of hyperlipidemia, it was found that among the variables excluding age, total cholesterol (0.616) and low-density lipoprotein (0.249) influenced disease occurrence, in the order presented [17]. In case of cardiovascular disease, systolic blood pressure (0.164) and high-density lipoprotein (0.113) had the second highest influence on disease occurrence. These results are consistent with the results of previous studies that studied the risk factors of the 4 chronic diseases [16,17].
Discussion
Principal Findings
This study develops a disease prediction model with more than 80% accuracy by using the 16 National Health Insurance system test variables from the real-world data of a tertiary hospital in South Korea. Our study:
Presents the possibility of predicting diseases with universal and useful information on public health examinations,
Explains the ability of model prediction results, and
Presents the external verification and scalability using other organizations’ CDM.
By observing recent research trends relating to disease prediction models using a CDM, the number of cases focusing on multicenter studies rather than single-center studies is increasing. Lee et al [18] established an artificial intelligence (AI) learning platform for multicenter clinical research focusing on CDM linkage. Using data from Gachon University Gil Hospital to develop a machine learning model that predicts 5-year risk in patients with inflammatory bowel disease who started biologics, Choi et al [19] externally validated the model with CDM data (Ministry of Food and Drug Safety). Johnston et al [20] developed a model to predict whether patients will stop taking antihyperglycemic drugs within 1 to 2 years after laparoscopic metabolic surgery. Using psychiatric patient notes at Ajou University Hospital, Lee et al [21] developed an NLP model that predicts the onset of psychosis in patients by learning, which is a representative case. As such, if the same cohort criterion is applied to multiple institutions in an expanded form along with disease prediction model construction and cross-validation, a more universal and robust model can be developed.
Research is being conducted globally to reduce medical costs by predicting disease occurrence using AI. As the AI industry has gone bigger, AI can reduce costs in providing care and increase the efficiency of medical jobs [22]. In 2019, researchers from the Boston Institute of Technology and Boston Health Center conducted joint research using electronic health records and lifelog big data with AI in an attempt to prevent disease outbreaks and medical fraud. The findings may help reduce hospitalization costs, which account for a substantial portion of US medical expenses [23]. The model developed through this study is expected to evolve into a similar system for South Koreans, by predicting the risk of future disease development and aiding self-health management.
Comparison With Prior Work
With the recent development of AI and data processing technology, research on disease prediction model development using National Health Insurance Service data [9] or single-institution EMR data [24] is steadily progressing. In this study, we developed chronic disease prediction models with relatively high performance compared to previous papers. A difference between this study and existing work is that the models have been developed using the CDM, so that we can expect improved precision through variable expansion and by simultaneously using multiorganizational data.
Limitations
A limitation of this study is that it uses a single-institution CDM from a tertiary hospital. Therefore, it cannot ensure generalizability. Additionally, the demographic variables (educational level, residential area, marital status, etc.) are insufficient compared to the health insurance service examination items. They are limited due to the focus on South Korean public checkups; by using more features related with the disease (hemoglobin A1C and biopsy data), the model becomes more accurate. Lastly, the model was trained using the cross-sectional data of patients. If the model is trained using time-series data (eg, the cohort of patients’ information that includes changes of laboratory results as time goes by), it could be much more comprehensive.
Conclusions
In this study, 4 metabolic chronic diseases were selected, and disease prediction models were developed using the Ajou University Hospital CDM. To obtain a model suitable for disease prediction, the predictive performance of each model for disease occurrence was compared using the LR, GBM, RF, and XGBoost algorithms. The XGBoost model shows the best performance for all diseases. The performance of the XGBoost model was calculated as 0.9303, 0.8704, 0.8442, and 0.8726 AUC standards for type 2 diabetes, hypertension, hyperlipidemia, and cardiovascular disease, respectively. In addition, the importance of the variables was calculated through modeling, and the results are in line with previous clinical studies. We have confirmed that chronic diseases can be predicted, not just using single-institution EMR or public clinical data, but using the CDM in each local hospital.
Abbreviations
- AI
artificial intelligence
- AUC
area under the curve
- CDM
common data model
- EMR
electronic medical record
- GBM
gradient boosting model
- LR
logistic regression
- RF
random forest
- SHAP
Shapley additive explanations
- XGBoost
extreme gradient boosting
Model’s hyperparameter range for grid search.
Footnotes
Conflicts of Interest: None declared.
References
- 1.World Health Organization. Regional Office for Europe Action plan for the prevention and control of noncommunicable diseases in the WHO European Region. World Health Organization. 2016. [2022-12-09]. https://apps.who.int/iris/handle/10665/341522 .
- 2.Song E, Kim YE, Ji S. Impact of a primary health care chronic diseases management pilot program. Article in Korean. Korean J Med. 2021 Feb 1;96(1):7–12. doi: 10.3904/kjm.2021.96.1.7. [DOI] [Google Scholar]
- 3.Jeong EK. 2020 chronic disease fact sheet. Article in Korean. Korean Disease Control and Prevention Agency. 2021. Jan 26, [2022-12-14]. https://www.kdca.go.kr/gallery.es?mid=a20503020000&bid=0003&act=view&list_no=144928 .
- 4.Jung C, Son JW, Kang S, Kim WJ, Kim H, Kim HS, Seo M, Shin H, Lee S, Jeong SJ, Cho Y, Han SJ, Jang HM, Rho M, Lee S, Koo M, Yoo B, Moon J, Lee HY, Yun J, Kim SY, Kim SR, Jeong I, Mok J, Yoon KH. Diabetes fact sheets in Korea, 2020: an appraisal of current status. Diabetes Metab J. 2021 Jan 13;45(1):1–10. doi: 10.4093/dmj.2020.0254. https://europepmc.org/abstract/MED/33434426 .dmj.2020.0254 [DOI] [PMC free article] [PubMed] [Google Scholar]
- 5.Jang JS, Lee MJ, Lee TR. Development of T2DM prediction model using RNN. Article in Korean. Journal of Digital Convergence. 2019 Aug 28;17(8):249–255. doi: 10.14400/JDC.2019.17.8.249. [DOI] [Google Scholar]
- 6.Lee S, Lee H, Choi JR, Koh SB. Development and validation of prediction model for risk reduction of metabolic syndrome by body weight control: a prospective population-based study. Sci Rep. 2020 Jun 19;10(1):10006. doi: 10.1038/s41598-020-67238-5. doi: 10.1038/s41598-020-67238-5.10.1038/s41598-020-67238-5 [DOI] [PMC free article] [PubMed] [Google Scholar]
- 7.Choi E, Bahadori MT, Schuetz A, Stewart WF, Sun J. Doctor AI: Predicting Clinical Events via Recurrent Neural Networks. JMLR Workshop Conf Proc. 2016 Aug;56:301–318. https://europepmc.org/abstract/MED/28286600 . [PMC free article] [PubMed] [Google Scholar]
- 8.Lipton ZC, Kale DC, Elkan C, Wetzel R. Learning to diagnose with LSTM recurrent neural networks. arXiv. doi: 10.48550/arXiv.1511.03677. Preprint posted online on November 11, 2015. [DOI] [Google Scholar]
- 9.Kim JO(, Jeong Y, Kim JH, Lee J, Park D, Kim H. Machine learning-based cardiovascular disease prediction model: a cohort study on the Korean National Health Insurance Service Health Screening Database. Diagnostics (Basel) 2021 May 25;11(6):943. doi: 10.3390/diagnostics11060943. https://www.mdpi.com/resolver?pii=diagnostics11060943 .diagnostics11060943 [DOI] [PMC free article] [PubMed] [Google Scholar]
- 10.Cox DR. Regression models and life-tables. Journal of the Royal Statistical Society: Series B (Methodological) 2018 Dec 05;34(2):187–202. doi: 10.1111/j.2517-6161.1972.tb00899.x. [DOI] [Google Scholar]
- 11.Louppe G. Understanding random forests: from theory to practice. arXiv. doi: 10.48550/arXiv.1407.7502. Preprint posted online on July 28, 2014. [DOI] [Google Scholar]
- 12.Bühlmann P, Hothorn T. Boosting algorithms: regularization, prediction and model fitting. Statist Sci. 2007 Nov 1;22(4):477–505. doi: 10.1214/07-STS242. [DOI] [Google Scholar]
- 13.Wang C, Chang L, Liu T. Predicting student performance in online learning using a highly efficient gradient boosting decision tree. IIP 2022: Intelligent Information Processing XI; May 27-30, 2022; Qingdao, China. 2022. pp. 508–521. [DOI] [Google Scholar]
- 14.Chen T, Guestrin C. XGBoost: a scalable tree boosting system. KDD '16: 22nd ACM SIGKDD International Conference on Knowledge Discovery and Data Mining; August 13-17, 2016; San Francisco, CA. 2016. Aug 13, pp. 785–794. [DOI] [Google Scholar]
- 15.Lundberg SM, Lee SI. A unified approach to interpreting model predictions. NIPS 2017: 31st Conference on Neural Information Processing Systems; December 4-9, 2017; Long Beach, CA. 2017. https://papers.nips.cc/paper/2017/hash/8a20a8621978632d76c43dfd28b67767-Abstract.html . [Google Scholar]
- 16.Kim SA, Yu SJ, Choi D. Prevalence and risk factors of type 2 diabetes according to gender among Korean employees. Article in Korean. Journal of the Korea Academia-Industrial cooperation Society. 2015 Nov 30;16(11):7589–7598. doi: 10.5762/KAIS.2015.16.11.7589. [DOI] [Google Scholar]
- 17.Kim KY. Risk factors for hypertension in elderly people aged 65 and over, and adults under age 65. Article in Korean. Journal of the Korea Academia-Industrial cooperation Society. 2019 Jan 31;20(1):162–69. doi: 10.5762/KAIS.2019.20.1.162. [DOI] [Google Scholar]
- 18.Lee CS, Kim JE, No SH, Kim TH, Yoon KH, Jeong CW. Construction of artificial intelligence training platform for multi-center clinical research. Article in Korean. KIPS Transactions on Computer and Communication Systems. 2020 Oct 31;9(10):239–246. doi: 10.3745/KTCCS.2020.9.10.239. [DOI] [Google Scholar]
- 19.Choi YI, Park SJ, Chung JW, Kim KO, Cho JH, Kim YJ, Lee KY, Kim KG, Park DK, Kim YJ. Development of machine learning model to predict the 5-year risk of starting biologic agents in patients with inflammatory bowel disease (IBD): K-CDM network study. J Clin Med. 2020 Oct 26;9(11):3427. doi: 10.3390/jcm9113427. https://www.mdpi.com/resolver?pii=jcm9113427 .jcm9113427 [DOI] [PMC free article] [PubMed] [Google Scholar]
- 20.Johnston SS, Morton JM, Kalsekar I, Ammann EM, Hsiao C, Reps J. Using machine learning applied to real-world healthcare data for predictive analytics: an applied example in bariatric surgery. Value Health. 2019 May;22(5):580–586. doi: 10.1016/j.jval.2019.01.011. https://linkinghub.elsevier.com/retrieve/pii/S1098-3015(19)30073-7 .S1098-3015(19)30073-7 [DOI] [PubMed] [Google Scholar]
- 21.Lee DY, Kim C, Lee S, Son SJ, Cho S, Cho YH, Lim J, Park RW. Psychosis relapse prediction leveraging electronic health records data and natural language processing enrichment methods. Front Psychiatry. 2022 Apr 5;13:844442. doi: 10.3389/fpsyt.2022.844442. https://europepmc.org/abstract/MED/35479497 . [DOI] [PMC free article] [PubMed] [Google Scholar]
- 22.Davenport T, Kalakota R. The potential for artificial intelligence in healthcare. Future Healthc J. 2019 Jun 13;6(2):94–98. doi: 10.7861/futurehosp.6-2-94. https://europepmc.org/abstract/MED/31363513 .futurehealth [DOI] [PMC free article] [PubMed] [Google Scholar]
- 23.Raven MC, Doran KM, Kostrowski S, Gillespie CC, Elbel BD. An intervention to improve care and reduce costs for high-risk patients with frequent hospital admissions: a pilot study. BMC Health Serv Res. 2011 Oct 13;11(1):270. doi: 10.1186/1472-6963-11-270. https://bmchealthservres.biomedcentral.com/articles/10.1186/1472-6963-11-270 .1472-6963-11-270 [DOI] [PMC free article] [PubMed] [Google Scholar]
- 24.Twick I, Zahavi G, Benvenisti H, Rubinstein R, Woods MS, Berkenstadt H, Nissan A, Hosgor E, Assaf D. Towards interpretable, medically grounded, EMR-based risk prediction models. Sci Rep. 2022 Jun 15;12(1):9990. doi: 10.1038/s41598-022-13504-7. doi: 10.1038/s41598-022-13504-7.10.1038/s41598-022-13504-7 [DOI] [PMC free article] [PubMed] [Google Scholar]
Associated Data
This section collects any data citations, data availability statements, or supplementary materials included in this article.
Supplementary Materials
Model’s hyperparameter range for grid search.