Abstract
S-Adenosylmethionine decarboxylase (SAMDC; EC 4.1.1.50) is a key rate-limiting enzyme located in the polyamine biosynthesis pathway. When compared with other organisms, the plant SAMDC genes possess some distinct features because they are devoid of introns in the main open reading frame (ORF) but have an intron(s) in their 5′ untranslated leader sequences, in which two overlapping tiny and small upstream ORFs (uORFs) are present. Our results show that the presence of the 5′ leader sequence plays important roles in transcriptional and posttranscriptional regulation of SAMDC expression. This sequence may help to keep the transcript of its downstream cistron at a relatively low level and function together with its own promoter in response to external stimuli or internal changes of spermidine and spermine to initiate and regulate SAMDC expression. Under stress and high spermidine or spermine conditions, the tiny uORF shows the same function as its overlapping small uORF, which is involved in translational repression and feedback controlled by polyamines. The presence of introns is necessary for the SAMDC up-regulation process when the internal spermidine level is low. Our results suggest that plants have evolved one network to adjust SAMDC activity through their 5′ leader sequences, through which transcriptional regulation is combined with an extensive posttranscriptional control circuit.
S-Adenosylmethionine decarboxylase (SAMDC; EC 4.1.1.50) is a key enzyme in higher polyamine (PA) biosynthesis (Janne et al., 1978; Pegg et al., 1988). An understanding of how SAMDC genes are regulated is important for elucidating the molecular basis of PA biosynthesis and the role of PAs in plant growth and development.
Plant SAMDC is initially synthesized as an inactive proenzyme and is autocatalytically processed to produce the mature form of the enzyme. This process is very rapid and, unlike the mammalian enzymes, is not regulated by the higher PA precursor putrescine (Put; Xiong et al., 1997). Characterization of SAMDC genes reveals the common feature of a long transcript leader sequence that carries upstream open reading frames (uORFs; Hill and Morris, 1992; Franceschetti et al., 2001). Evidence from several studies indicates that uORFs are involved in translational repression of mammalian SAMDC (Ruan et al., 1996; Pegg et al., 1998; Law et al., 2001). In plants, SAMDCs possess a highly conserved overlapping tiny and small uORFs, consisting of 3 and 52 to 53 codons, respectively (Franceschetti et al., 2001). In all cases, both the tiny and small uORFs are overlapped in such a manner that the last nucleotide A of the tiny uORF stop codon is the first nucleotide of the initiating ATG of the small uORF. The small uORF has also been shown to be responsible for the translational repression of the SAMDC gene (Hanfrey et al., 2002). Apart from the uORFs, the plant SAMDCs are not interrupted by introns through their main ORF but have an intron(s) in their untranslated 5′ leader sequences, which is in contrast with SAMDCs from other organisms, including human, rat, mouse, and Drosophila (Franceschetti et al., 2001). Until now, the role of tiny uORF and introns in plant SAMDC regulation were not yet clarified. Similarly, information regarding transcriptional regulation of SAMDC also was limited. As plant SAMDCs turn over very rapidly in vivo (Pegg et al., 1988), we posed the questions of whether and how their unique 5′ untranslated leader sequences regulate SAMDC activity in general.
By isolating SAMDC genes from the mustard (Brassica juncea) cDNA library, we found that SAMDC in mustard is encoded by a gene family, which was further confirmed by Southern analysis. All these members showed similar expression patterns when mustard was treated with external stimuli. In this study, we characterize the functions of the 5′ leader sequence from BJSAMDC2, which possesses the typical features for the plant SAMDC gene. Our results show that the BJSAMDC2 5′ leader sequence, together with its own promoter, functions in initiating and regulating SAMDC expression at the transcriptional level. Under stress conditions, the 5′ tiny uORF performs the same function as its overlapping small uORF to repress the translation of its downstream cistron. Further studies demonstrate that the introns present in the 5′ leader sequence play crucial roles in up-regulating SAMDC activity when plant internal spermidine (Spd) is low. Our results indicate that the plant SAMDC 5′ leader sequence participates in gene regulation at both the transcriptional and posttranscriptional levels, which enables plants to sense their internal PA or environmental changes.
RESULTS
Functional Analysis of the BJSAMDC2 5′ Leader Sequence
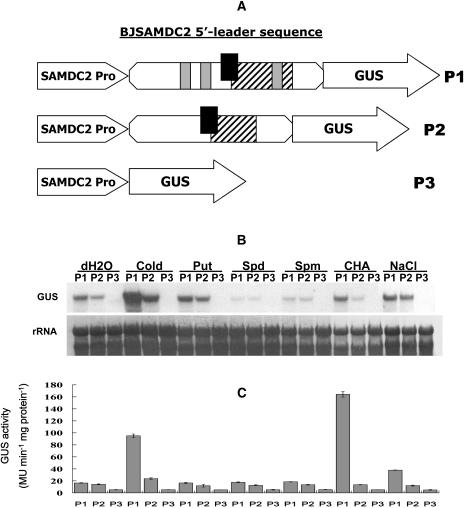
To investigate the function of the BJSAMDC2 5′ leader sequence, several chimeric genes consisting of the β-glucuronidase (GUS) coding sequence under the control of the BJSAMDC2 upstream regulation sequence were constructed. They included the BJSAMDC2 promoter (−2,322 to +1) that has been confirmed by 5′ RACE results (data not shown) in the absence (P3) and presence of the BJSAMDC2 5′ untranslated leader sequence (P1) or with the 5′ untranslated region (UTR) of BJSAMDC2 (P2; Fig. 1A). The vector with the cauliflower mosaic virus 35S∷GUS fusion (PBI121) served as the positive control. Multiple transgenic lines for each construct with a single transgenic insertion were evaluated. With respect to the 15 P3 (BJSAMDC2∷GUS) transgenic plants, 10 (66.7%) showed the GUS staining was generally low with high activity localized at serrated tips of the leaves after 12 h of incubation with 5-bromo-4-chloro-3-indolyl-β-glucuronic acid solution (Fig. 2, P3-12). And the accumulation of GUS product was further observed by prolonged incubation of plants to 36 h (Fig. 2, P3-36).
Figure 1.
Schematic representation of chimeric genes consisting of the GUS coding sequence with or without the SAMDC 5′ leading sequence under the control of BJSAMDC2 promoter (A), and the levels of GUS transcript and enzyme activity in different transgenic plants in response to external stimuli. A, The construct consists of the wild-type BJSAMDC2 5′ leader sequence (P1) or 5′ UTR (P2) flanking between the BJSAMDC2 promoter and GUS, or GUS driven by the BJSAMDC2 promoter in the absence of 5′ leader sequence (P3). The overlapping tiny and small uORFs are represented by black and hatched boxes, respectively. The introns in the 5′ leader sequence of P1 are indicated by gray boxes. Detached Arabidopsis leaves were incubated for 12 h at room temperature in water, 10 mm Put, 10 mm Spd, 10 mm Spm, 50 mm CHA, and 0.4 m NaCl. For cold treatment, leaves were incubated in water at 4°C for 12 h. B, RNA gel-blot analysis for the GUS transcript in various treated leaves by probing the total RNA isolated from the leaf tissue with DIG-labeled GUS-specific probe. C, The GUS activity in differently treated leaves was determined by using GUS fluorometric assay method. Bars represent mean ± se of three independent experiments from the same transformant.
Figure 2.
Histochemical assay for the GUS activity in various transgenic Arabidopsis plants. Three-week-old wild-type and transgenic plants expressing 35S∷GUS (PBI121), BJSAMDC2∷5′ leader sequence/GUS (P1), BJSAMDC2∷5′ UTR/GUS (P2), and BJSAMDC2∷GUS (P3) chimeric genes were incubated with 5-bromo-4-chloro-3-indolyl-β-glucuronic acid solution for 12 h (P1-12, P2-12, P3-12, and PBI121-12) or 36 h (WT-36 and P3-36). The figure shows differential GUS activity in the representative leaves of wild-type and different transgenic plants.
To investigate whether transgenic expression was affected by the presence or absence of the BJSAMDC2 5′ leader sequence or the 5′ UTR, the GUS activity of various transgenic plants (PBI121, P1, P2, and P3) was compared. The leaves from 16 out of 18 (88.9%) and 15 out of 20 (75%) individual transgenic lines for P1 and P2, respectively, together with the 10 previously identified P3 transgenic lines, showed the same pattern of the GUS activity that was higher in old leaves compared with young ones. In roots, the high GUS activity was mainly shown in the root tips (data not shown). This pattern was different from that in the positive control PBI121, in which GUS was evenly distributed in both young and old leaves. The major difference was that the GUS activity was generally highest in the P1 leaves, whereas the activity in P2 was intermediate and in P3 was lowest (Fig. 2).
To further investigate whether the variation in the GUS activity among transgenic plants was associated with the level of transcript concentration and enzyme activity, northern analysis and enzyme activity assay were conducted. Results showed that the GUS transcript was detected in both P1 and P2 plants incubated for 12 h in water but was barely detectable in P3 (Fig. 1B), which was consistent with the pattern of the GUS enzyme activity (Fig. 1C).
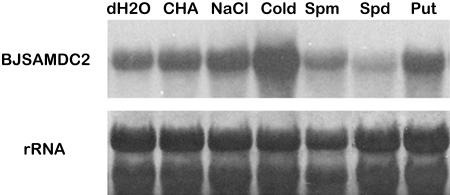
Attempts were also made to investigate the effect of external stimuli on transgene expression in P1, P2, and P3 plants. Northern analysis revealed a great variation in the GUS transcript abundance in response to various treatments. The transcripts in both P1 and P2 were up-regulated markedly in response to cold, with more substantial increase in P1 than in P2 (Fig. 1B). Both plants also showed a slight increase in the transcript after treatments with exogenous Put and NaCl. While application of dicyclohexylamine (CHA) appeared to exert little effect on GUS expression in P1 and P2, the expression was suppressed in the presence of exogenous Spd and spermine (Spm; Fig. 1B). The expression patterns for P1 and P2 were the same as the previous BJSAMDC2 expression under the same treatment in mustard (Fig. 3). With respect to P3, GUS transcript was barely detected in all treatments. The up-regulated GUS activity in P1 and P2 by cold treatment also corresponded to the pattern of their transcript accumulation (Fig. 1, B and C). Similar increase of GUS activity also was observed in P1 in response to NaCl. However, treatment with CHA resulted in a marked increase in the GUS activity in P1 (Fig. 1C), although the transcript level was not affected. Other treatments appeared to have little effect on the GUS activity in transgenic tissues compared to those incubated with water.
Figure 3.
Effect of different treatments on BJSAMDC2 expression in mustard leaves. Detached mustard leaves were incubated for 12 h at room temperature in water, 10 mm Put, 10 mm Spd, 10 mm Spm, 50 mm CHA, and 0.4 m NaCl. Leaves were incubated in water and kept in a fridge at 4°C for the cold treatment.
Gene Expression Conferred by the Cauliflower Mosaic Virus 35S Promoter with or without the SAMDC 5′ Leader Sequence
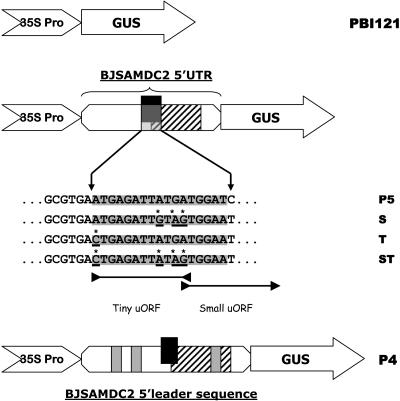
Increased transcript accumulation and/or enzyme activity of GUS in P1 and P2 plants in response to different treatments (Fig. 1, B and C) indicate the implication of the 5′ leader sequence/5′ UTR in gene regulation. To delineate the regulatory roles of the 5′ leader sequence/5′ UTR, several chimeric genes consisting of the GUS coding sequence under the control of the 35S promoter in the absence (PBI121) or presence of the 5′ leader sequence (P4) or 5′ UTR (P5) were constructed. In P5, several constructs also were prepared based on the mutation of the start codons in uORFs (ATGAGATTATGA), where the last adenine was the overlapped nucleotide between the stop codon in the tiny uORF and the first nucleotide of the translation codon in the small uORF. These constructs included S (ATGAGATTGTAG), T (CTGAGATTATGA), and ST (CTGAGATTGTAG), where mutated nucleotides are underlined (Fig. 4).
Figure 4.
Schematic representation of different chimeric genes consisting of the wild type and mutated 5′ UTR flanking by the 35S promoter and GUS coding sequence. The binary vector PBI121 was inserted with the wild type (P5 without intron; P4 with intron) or mutated BJSAMDC2 5′ UTR (S, T, and ST). In the mutated 5′ UTR, mutagenized nucleotides in the uORFs are underlined and marked with an asterisk. The tiny and small uORFs are indicated as black and hatched boxes, respectively.
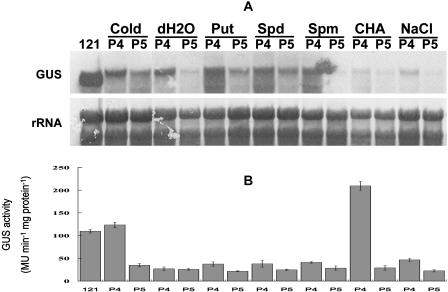
Transgenic Arabidopsis (Arabidopsis thaliana) plants expressing various chimeric genes were selected and verified using Southern analysis (data not shown). A comparative study on the levels of GUS transcript and enzyme activity in PBI121, P4, and P5 plants was conducted to determine the effect of the 5′ leader sequence and the 5′ UTR on gene expression in response to external stimuli. Results showed that the GUS transcript was most abundant in PBI121, while the transcript level was considerably lower in P4 and P5 regardless of the treatment (Fig. 5A, dH2O). At the same time, the transcript accumulation in P4 and P5 was almost unaffected by different treatments. With respect to GUS activity, the level in PBI121 was considerably higher than in both P4 and P5 incubated in water. Although the GUS transcript in P4 was more abundant than in P5, their enzyme levels were comparable (Fig. 5B). P4 also was responsive to cold, in which its GUS activity was markedly up-regulated to a level comparable to that in PBI121. The response of P4 to CHA was most striking as CHA was shown to increase the enzyme activity to the maximum in P4 (Fig. 5B). On the other hand, the enzyme activity in other treated P4 and P5 tissues was comparable to that of the control (water).
Figure 5.
Levels of GUS transcript and enzyme activity in different transgenic plants with PBI121, P4, and P5 constructs in response to different treatments. Detached leaves were incubated for 12 h at room temperature in water (dH2O), 10 mm Put, 10 mm Spd, 10 mm Spm, 50 mm CHA, and 0.4 m NaCl. For the cold treatment, leaves were incubated for 12 h in water at 4°C. Leaves from transgenic plants with PBI121 (121) were incubated in water for 12 h as a positive control. Bars represent mean ± se of three independent experiments.
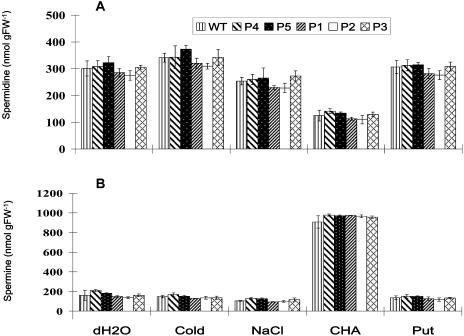
Both wild-type and various transgenic plants (P1–P5) subjected to different treatments also were analyzed for the content of cellular Spd and Spm. It was found that the PA content between the wild-type and transgenic plants within a given treatment was similar but varied among the treatments (Fig. 6). Although most treatments (water, cold, NaCl, and Put) resulted in the comparable PA content in the tissues, application of CHA significantly decreased the level of Spd but increased Spm (Fig. 6).
Figure 6.
Levels of endogenous Spd (A) and Spm (B) in wild-type and different transgenic Arabidopsis plants in response to external stimuli. Detached leaves were incubated for 12 h at room temperature in water (dH2O), 10 mm Put, 50 mm CHA, and 0.4 m NaCl. For the cold treatment, leaves were incubated for 12 h in water at 4°C. Leaves from the wild type (WT) were incubated in water for 12 h as positive control. Bars represent mean ± se of three independent experiments.
Gene Expression in Relation to uORFs
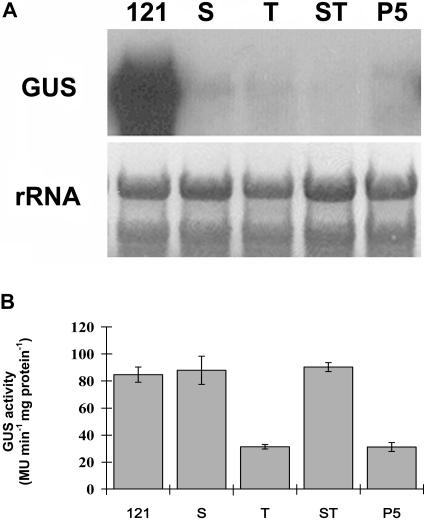
To evaluate the effect of uORFs on gene expression, the GUS transcript abundance of transgenic plants harboring the introduced 5′ leader sequence (P4) or 5′ UTR with original (P5) and mutated uORFs (S, T, and ST) was compared. Results of northern analysis revealed that no GUS transcript was detected in the nontransformed wild-type plant but accumulated at a high level in PBI121, which confirmed the results of a previous study (Figs. 5 and 7). Although the GUS transcript also was detected in S, T, ST, P4, and P5 plants, the level was much lower than that in PBI121. Among these transgenic plants, transcript appeared to be more abundant in P4 (data not shown). Although the transcript level in S, T, ST, and P5 plants was generally low (Fig. 7A), the pattern of GUS activity in these plants differed greatly. A comparably high level of enzyme activity was detected in PBI121, S, and ST, whereas the activity in T and P5 was significantly lower (Fig. 7B).
Figure 7.
Levels of GUS transcript and enzyme activity in different transgenic plants. A, Total RNA (10 μg per lane) isolated from transgenic plants with PBI121 (121, positive control), S, T, ST, and P5 was hybridized with DIG-labeled GUS-specific probe. B, The GUS activity in each transgenic plant was determined by GUS fluorometric assay. Bars represent mean ± se of three measurements.
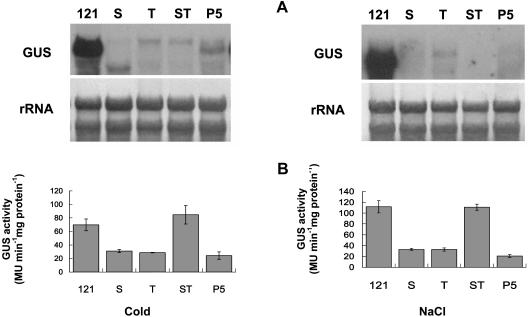
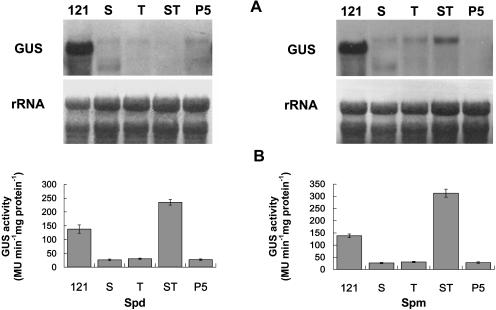
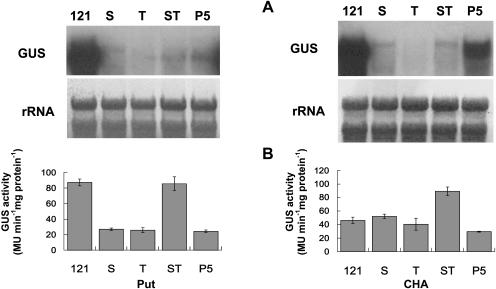
A similar study was also conducted for various transgenic plants under stress. Transgene expressed at a lower level in T, ST, and P5 in response to cold but was barely detectable under salt stress (Fig. 8A). However, the pattern of GUS activity between the two treatments was similar. While a high level of enzyme activity was detected in both PBI121 and ST, the activity in S, T, and P5 was low (Fig. 8B). Similar variation also was observed in transgenic plants treated with exogenous PAs. All transgenic plants, except PBI121, showed equally low transcript abundance in response to Spd, whereas Spm treatment stimulated expression in ST (Fig. 9A). Furthermore, both exogenous Spd and Spm were able to up-regulate the GUS activity in ST, whose level was significantly higher than that in PBI121 (Fig. 9B). The activity in other transgenic plants was significantly lower. All plants treated with exogenous Put showed a pattern of transcript accumulation and GUS activity similar to that treated with Spd, except the GUS activity in PBI121 and ST (Fig. 10, A and B). Unlike the effect of PAs, application of CHA up-regulated gene expression in P5, although expression in S, T, and ST remained low (Fig. 10A). By contrast, the enzyme activity in P5 was significantly lower than that in other plants, among which ST was the highest and the activity in PBI121, S, and T was comparable (Fig. 10B).
Figure 8.
Levels of GUS transcript and enzyme activity in different transgenic plants in response to NaCl or cold treatment. Detached Arabidopsis leaves were incubated for 12 h at room temperature in 0.4 m NaCl. For cold treatment, leaves were incubated in water at 4°C for 12 h. A, Total RNA (10 μg per lane) isolated from transgenic plants with PBI121 (121, positive control), S, T, ST, and P5 was hybridized with DIG-labeled GUS-specific probe. B, The GUS activity in each transgenic plant was determined by GUS fluorometric assay. Bars represent mean ± se of three replicate assays.
Figure 9.
Levels of GUS transcript and enzyme activity in different transgenic plants in response to Spd or Spm treatment. Detached Arabidopsis leaves were incubated for 12 h at room temperature in 10 mm Spd or 10 mm Spm. A, Total RNA (10 μg per lane) isolated from transgenic plants with PBI121 (121, positive control), S, T, ST, and P5 was hybridized with DIG-labeled GUS-specific probe. B, The GUS activity in each transgenic plant was determined by GUS fluorometric assay. Bars represent mean ± se of three measurements.
Figure 10.
Levels of GUS transcript and enzyme activity in different transgenic plants in response to Put and CHA. Detached Arabidopsis leaves were incubated for 12 h at room temperature in 10 mm Put or 50 mm CHA. A, Total RNA (10 μg per lane) isolated from transgenic plants with PBI121 (121, positive control), S, T, ST, and P5 was hybridized with DIG-labeled GUS-specific probe. B, The GUS activity in each transgenic plant was determined by GUS fluorometric assay. Bars represent mean ± se of three measurements.
DISCUSSION
Role of the 5′ Leader Sequence in Transcriptional Regulation of SAMDC
Evidence from several lines of study indicates that SAMDC expression is regulated at the translational level (Ruan et al., 1996; Hanfrey et al., 2002), but information regarding transcriptional regulation of SAMDC has been limited. To understand whether SAMDC is transcriptionally regulated, in this study the function of the BJSAMDC2 promoter, which was fused to the GUS coding sequence in the absence or presence of BJSAMDC2 5′ leader sequence, was analyzed in transgenic Arabidopsis.
Results show that transgene activity in BJSAMDC2∷GUS plants is detectable, although the activity is very low regardless of the treatments. This is contrary to the positive control PBI121 (35S∷GUS) plant, in which the transgene was constitutively and strongly expressed in all organs. Further analysis of the promoter region using the PLACE database search (Higo et al., 1999) revealed the presence of cis-acting responsive elements, including several putative transcriptional repressor motifs (data not shown). Nevertheless, this observation indicates that the BJSAMDC2 promoter is functional. Results also suggest that transcriptional regulation of SAMDC may not be controlled solely by the promoter. This view is supported by the increased transcript accumulation and enzyme activity of the transgene in P1 and P2 plants, in which the 5′ leader sequence with or without introns was inserted between the BJSAMDC2 promoter and the GUS gene. It suggests that transcriptional regulation of SAMDC may be controlled, at least in part, at its 5′ untranslated leader sequence. The regulatory role of the leader sequence also is exemplified by the response of P4 and P5 plants, in which transcription is repressed by the presence of the leader sequence with or without introns under the control of the 35S promoter. However, this leader sequence cannot work solely as a sensor to external signals and confer the regulatory characters to an unrelated promoter (i.e. 35S promoter). Results of this study show that the leader sequence is mandatory for transcriptional regulation of SAMDC.
PAs have been suggested to play a protective role in plants against stress because PA biosynthesis enzymes and cellular PA levels usually increase in response to stress (Bouchereau et al., 1999). It has been reported that zucchini (Cucurbita pepo) fruit preconditioned at 10°C for 2 d before being exposed to 2.5°C resulted in Spd and Spm accumulation and a decrease in chilling injury (Kramer and Wang, 1989). Spd accumulation also was associated with cold tolerance in cucumber (Cucumis sativus; Shen et al., 2000). It has been speculated that Spd and Spm accumulation may be due to increased SAMDC activity. Results of a recent study appear to support this view. Pillai and Akiyama (2004) reported that a cold-tolerant rice (Oryza sativa) cultivar exposed to cold stress showed increased SAMDC expression up to 72 h, concomitant with Spd accumulation. Cold-induced gene expression also has been observed in this study, as P1 plants showed the up-regulated levels of GUS transcript and enzyme activity in leaves after cold treatment. This is in line with the increased BJSAMDC2 expression in mustard in response to cold. Apart from cold stress, salt stress also induced transgene expression in P1 in this study. Up-regulation of SAMDC expression may be important for Spd and Spm synthesis to protect the plant against salt stress. This has been reported in rice (Krishnamurthy and Bagwat, 1989) and tomato (Lycopersicon esculentum; Willadino et al., 1996), in which higher Spd and/or Spm content and lower ratios of Put/Spd plus Spm are associated with salt tolerance, although Spd and Spm accumulation may also attributed to increased Arg decarboxylase expression (Chattopadhyay et al., 1997; Roy and Wu, 2001). Unlike cold and salt treatments, transgene expression is inhibited by exogenous application of Spd and Spm, whereas Put is stimulatory. However, changes in the GUS transcript have no effect on the level of enzyme activity, indicating that gene expression may be regulated posttranscriptionally. The response of P1 and P4 plants to CHA also shows the possible posttranscriptional regulation, as CHA has no effect on GUS transcript accumulation but markedly increases the enzyme activity.
The Function of the SAMDC Tiny uORF
Translational regulation of SAMDC expression in relation to uORFs has been investigated extensively for the last 10 years. The role of uORFs in translational regulation of SAMDC has been reviewed recently (Hanfrey et al., 2003). In mammals, SAMDC possesses only one uORF in its 5′ UTR, and the uORF has been shown to be responsible for translational repression of the downstream gene (Ruan et al., 1996). In plant SAMDCs, the tiny and small uORFs have been identified, with the last nucleotide of the stop codon in the former overlapped with the first nucleotide of the start codon in the latter (Franceschetti et al., 2001). In view of the presence of a poor Kozak sequence in the tiny but good in small uORF (Kozak, 1989), it has been speculated that the scanning ribosome may recognize only the translation start codon of the latter. The role of the small uORF has been demonstrated in transgenic tobacco (Nicotiana tabacum) plants, in which the presence of the small uORF in the chimeric gene reduced the translation efficiency of SAMDC (Hanfrey et al., 2002). On the other hand, elimination of the small uORF from the SAMDC cDNA has resulted in a significant increase in SAMDC translation with altered PA metabolism and growth perturbation (Hanfrey et al., 2002). The similar translational repression phenomenon also has been observed in the transgenic S plant in this study, in which mutagenesis of the small uORF abolishes translation repression (Fig. 7). However, repression is not affected by the presence of the tiny uORF, as demonstrated in the T plant. This response may be explained by the presence of the poor Kozak sequence for tiny uORF. It also suggests that repression abrogation in the ST plant, in which both tiny and small uORFs are mutated, may be attributed to the presence of the nonfunctional small uORF. The repression observed in both T and P5 plants may be due to the presence of the functional small uORF. In this study, results are in agreement with the previous findings showing that the small but not the tiny uORF is responsible for translational repression of SAMDC under normal growth conditions.
Results of this study also demonstrate that the tiny uORF plays a role in translation repression when plants are under stress. This is evidenced by the low transgene activity in the S plant in response to cold and salt stress (Fig. 8). The stress treatments also down-regulate the transgene activity in T and P5 plants but not in the ST plant, whose activity is comparable to that in the positive control (PBI121). These results indicate that, unlike plants grown under non-stress conditions, both the tiny and small uORFs are involved in translational repression in response to stress. Similar repression in S, T, and P5 plants also has been observed in treatments with exogenous PAs (Put, Spd, and Spm), suggesting that the presence of a functional tiny or small uORF is sufficient for translation repression in the presence of excess PAs. This result is in line with the high transgene activity in the ST plant treated with PAs. Study on the suppressive role of PAs in mammalian SAMDC has led to the proposed model that PAs regulate ribosome pausing at the uORF, thus controlling ribosome access to the downstream SAMDC ORF (Pegg et al., 1998). It is possible that stress-induced repression may be mediated through PA synthesis because stress, including cold and salinity, stimulates PA accumulation in plants (Bouchereau et al., 1999).
Essential Role of Introns within the 5′ Leader Sequence in Posttranscriptional Regulation of SAMDC
Although transgene expression in P1 and P2 plants can be modulated by external stimuli, P3 (BJSAMDC2∷GUS) plants lacking the 5′ leader sequence were not responsive to the treatments employed. These results confirm the pivotal role of the leader sequence in SAMDC expression. Previous study on the characterization of SAMDC genes from several plant species (Franceschetti et al., 2001), including soybean (Glycine max; Tian et al., 2004), shows the presence of introns in the 5′ leader sequence. However, the role of introns in the 5′ leader sequence is not clear, although introns present in the protein coding sequence have been shown to be important for gene transcription and RNA processing (Lacy-Hulbert et al., 2001; Furger et al., 2002). The introns also play a role in gene regulation to increase protein diversity (Smith and Valcarcel, 2000; Graveley, 2001). In this study, the presence of introns appears to be important for SAMDC expression because the absence of these introns in the leader sequence results in transgene attenuation, as shown in P2 and P5 plants. The low enzyme activity in P2 and P5 may be due in part to lower levels of transcript. Results of this study show that the introns in the leader sequence are involved in regulation of SAMDC transcription. The implication of introns in the 5′ UTR in gene regulation also has been reported previously (Bouvet and Wolffe, 1994; Braddock et al., 1994). It has been speculated that these introns may facilitate RNA processing and, as a result, enable mRNA to escape from the nucleus-specific translational repression pathway.
Spd synthase and Spm synthase are aminopropyl transferases and have much longer half-lives. Although usually present in excess, they are limited by the very low concentration of decarboxylated S-adenosylmethionine (dcSAM). CHA, which is a potent inhibitor of Spd synthase, can lead to Spd reduction and an increase in dcSAM up to 10-fold (Balint and Cohen, 1985). The increased availability of dcSAM may be used for Spm synthesis catalyzed by Spm synthase. In spite of the presence of CHA, the reduced production of Spd is extensively converted into Spm. This is supported by our results showing that CHA treatment reduces the level of Spd up to 40% of its normal level and the Spm content is increased 5-fold. In P1 and P4 plants, CHA stimulates GUS activity, but it has no effect on P2 and P5 plants in which the introns are absent. Hence, these results may be explained by the requirement of the splicing process rather than the presence of intronic sequences in the pre-mRNA for mediating the translation up-regulation (Matsumoto et al., 1998), as observed in the P1 and P4 plants. It is likely that the low Spd level may counteract the translation suppression effect from the BJSAMDC2 5′ uORFs when the introns are present in the 5′ leader sequence, which may feedback control the SAMDC activity other than simply function as a repressor to downstream translation. When combined with the transgene expression in P5 under normal growth conditions (Fig. 7), it indicates that the basal level of Spd is sufficient to repress SAMDC at the translational level, and inhibition of Spd synthesis below the basal level may result in increased enzyme synthesis and/or activity.
In conclusion, our results show that SAMDC, as an important rate-limiting gene located in the PA biosynthesis pathway, is extensively controlled at the transcriptional and posttranscriptional levels, which may help plants respond to a world of limited resources and transient abiotic stresses. In view of the short life span of SAMDC, its regulation at the posttranscriptional level by its 5′ untranslated leader sequence enables plants to achieve plasticity in controlling gene expression, which transcriptional regulation alone cannot provide. This might be one of the regulatory mechanisms making plants rapidly respond to environmental perturbations, especially when plants are under stress.
MATERIALS AND METHODS
Plasmid Construction
The BJSAMDC promoter fragment and promoter with the BJSAMDC 5′ leader sequence (with introns; the size for each intron is 120, 249, and 88 bp, respectively) were PCR amplified using the primer DC2pp1 (5′-ACGCGTCGACTTATCTTTTATAAATGGC-3′; SalI site underlined) plus primer DC2pp3 (5′-TAGCGGATCCTTAAGAGTAGAAGGAGAGGC-3′) or DC2pp2 (5′-TAGCGGATCCGAGAGGAAAAGATGCGAG-3′; BamHI site underlined) with the previously isolated BJSAMDC2 gDNA (GenBank accession no. AY444341). After digestion, the SalI-BamHI fragments were ligated into the Agrobacterium tumefaciens binary vector PBI 101 (CLONTECH, Palo Alto, CA), which was precut with the same enzymes, and the constructs were named as P3 (BJSAMDC2 promoter + GUS) and P1 (BJSAMDC2 promoter + 5′ leader sequence [913 bp] + GUS; Fig. 1), respectively. Primers DC2pp4 (5′-TAGCGGATCCTCTAGACCAAATCATAAGCCGCTC-3′; BamHI and XbaI sites underlined) and DC2pp2 were used to amplify the BJSAMDC2 cDNA clones (GenBank accession no. U80916) to get the 5′ UTR (411 bp), which was ligated into the P3 construct between the BJSAMDC2 promoter and the GUS reporter gene to make the construct P2 (BJSAMDC2 promoter + 5′ UTR + GUS; Fig. 1A).
The BJSAMDC2 gDNA clone was PCR amplified by primers DC2pp2 and DC2pp4 to get its 5′ leader sequence. Together with the 5′ UTR fragment, they were cut with BamHI and ligated into A. tumefaciens binary vector pBI121 (CLONTECH), which was precut with BamHI and dephosphorylated. The resulting constructs were sequenced to identify the correct orientation and named as P4 (35S promoter + 5′ leader sequence + GUS) and P5 (35S promoter + 5′ UTR + GUS; Fig. 1A). All the PCR reactions were conducted using the Advantage II polymerase (CLONTECH), and the PCR products were checked for errors by sequencing.
Site-Directed Mutagenesis
Various tiny and small uORF start-site deletion mutants of the BJSAMDC2 5′ UTR fragments were produced by PCR. Mutagenic primers employed for tiny uORF were DC2pp5 (5′-GCGTGA*CTGAGATTATGATGG-3′) and DC2pp6 (5′-CCATCATAATCTCAG*TCACGC-3′; asterisks represent the mutated points). Primers DC2pp6 with DC2pp4 plus DC2pp2 with DC2pp5 were used to amplify two overlapping fragments with the deletion of the tiny uORF start site for the 5′ and 3′ halves of the BJSAMDC2 5′ UTR. These two fragments were purified with the Qiagen PCR purification kit (Qiagen, Hilden, Germany), and approximately 40 ng of each fragment was added into another reaction tube together with primers DC2pp2 and DC2pp4 again and amplified with Advantage II polymerase. The PCR products were separated with agarose gel. Bands with the expected size were purified from the agarose gel by using the Qiagen gel purification kit (Qiagen) and cloned into the pGEM-T vector (Promega, Madison, WI). Mutations were confirmed by DNA sequencing. Then the mutated 5′ UTR fragment was cut out from pGEM-T with BamHI and ligated into the PBI121 binary vector, which was precut with the same enzyme and dephosphorylated. The resulting positive clones were double confirmed by PCR and DNA sequencing and named T, representing the tiny uORF start codon has been removed.
Using the same strategy, primers DC2pp7 (5′-GCGTGAATGAGATT*GT*A*GTGG-3′) and DC2pp8 (5′-CCA*C*TA*CAATCTCATTCACGC-3′) were used to remove the start site of small uORF. Subsequently, DC2pp9 (5′-GCGTGA*CTGAGATT*GT*A*GTGG-3′) and DC2pp10 (5′-CCA*C*TA*CAATCTCA*GTCACGC-3′) were used to remove the start codons for the tiny and small uORFs simultaneously. Finally, these two 5′ uORF mutated fragments were cloned into the binary vector PBI121, which was precut with BamHI, and named S and ST, respectively (Fig. 7).
Plant Transformation and Growth Conditions
All the PBI101 and PBI121 constructs were introduced into A. tumefaciens strain LBA4404 and AGL1, respectively, and used to transform wild-type Arabidopsis (Arabidopsis thaliana) in the Col-0 background by the vacuum-infiltration method, as described previously (Clough and Bent, 1998). Transgenic seeds were selected on selective medium with related antibiotics. Ten days later, the germinated healthy seedlings were transferred to soil in one growth chamber and grown at 22°C with a 16-h light period. PCR was performed to identify whether they were the real transformants for different constructs. For Southern-blot analysis, genomic DNA from different transgenic plants, which have been confirmed by PCR, were cut with EcoRI and XbaI and hybridized with the digoxigenin (DIG)-labeled NPT II probe. Only the single-insertion transformants were allowed to flower and self-fertilize. The segregation ratio for their progenies is in a Mendelian manner into transgenic progeny containing the transgene and syngeneic progeny without the transgene to further prove that they are the single-insertion transformants. The homozygous transgenic plants from 15 to 20 independent lines for each construct were selected from their T3 generations and used for further experiments.
RNA Isolation and Gel-Blot Analysis
About 20 to 25 leaves from different transgenic Arabidopsis plants were excised and transferred to 2-mL Eppendorf tubes with 1.5 mL of solution containing different chemicals. Three sets of independent experiments were performed. Leaves impregnated with water were used as controls. After incubation, the treated and untreated Arabidopsis leaves were ground to fine powder in liquid nitrogen, an aliquot was set aside at −80°C for GUS activity assay, and the remainder was used to prepare total RNA using the TRI reagent method as described (Chomczynski and Mackey, 1995). For RNA gel-blot analysis, 10 μg of total RNA was treated with glyoxal, as described (Sambrook et al., 1989), and size-fractionated on 1% agarose gels in 0.01 m sodium phosphate buffer, pH 7.0. Electrophoresis was performed at 10 V cm−1 for 1.5 h with constant cycling of the buffer. Then, the total RNA was blotted onto a positively charged nylon membrane (Roche, Mannheim, Germany) accordingly. The membrane was fixed by UV light under optimal conditions using an UV crosslinker (Spectrolinker XL-1500UV crosslinker; Spectronics, Lincoln, NE).
GUS Enzyme Activity Assay
The fluorometric GUS assay was performed according to the method of Jefferson et al. (1987), with some modifications. Fifty to 100 mg of ground plant tissue was homogenized in 200 μL of GUS extraction buffer. The protein content of extracts was measured using the Bradford method (Bradford, 1976). The subsequent assay was performed by incubation of 5 μL of 100 times-diluted extract with 200 μL of 2 mm 4-methylumbelliferyl glucuronide at 37°C for 10 min, then the reaction was terminated with 0.2 m Na2CO3. The GUS activity was expressed as nanomol 4-methylumbelliferyl per milligram of protein.
Measurement of Polyamines
PAs were extracted from 100 mg of ground leaf powder in 5% (w/v) ice-cold trichloroacetic acid and incubated on ice for 1 h as described previously (Flores and Galston, 1982). PAs were dansylated overnight in the dark, and sample aliquots of 200 μL were incubated with 100 μL of Pro (100 mg/mL) at room temperature for 30 min to remove excess dansyl reagent. The reaction was then extracted with 0.5 mL of benzene. Dansylated PAs were separated on silica gel thin-layer chromatography plates (Whatman LK6D; Middlesex, UK), which were developed for about 70 min in chloroform:triethylamine (25:2, v/v). The plates were dried for 5 min at 100°C, and the dansyl-PA bands were identified under UV light, scraped, and eluted with 2 mL of ethylacetate. PAs in the eluant were quantified using a fluorescent spectrophotometer (RF-1501; Shimadzu, Kyoto) with excitation at 350 nm and emission at 495 nm. The standard curve for each PA was plotted by quantifying known concentrations of Put dihydrochloride, Spd trihydrochloride, and Spm tetrahydrochloride (Sigma, St. Louis).
Sequence data from this article have been deposited with the EMBL/GenBank data libraries under accession numbers AY444341 and U80916.
Acknowledgments
We thank Dr. Yu Hao and Dr. Low Boon Chuan of the Department of Biological Sciences for critically reviewing this manuscript.
This work was supported by the National University of Singapore (research grant no. R–154–000–143–112). W.-W.H. and H.G. are scholarship recipients of the National University of Singapore.
Article, publication date, and citation information can be found at www.plantphysiol.org/cgi/doi/10.1104/pp.104.056770.
References
- Balint R, Cohen SS (1985) The effects of dicyclohexylamine on polyamine biosynthesis and incorporation into turnip yellow mosaic virus in Chinese cabbage protoplasts infected in vitro. Virology 144: 194–203 [DOI] [PubMed] [Google Scholar]
- Bouchereau A, Aziz A, Larher F, Martin-Tanguy J (1999) Polyamines and environmental challenges: recent development. Plant Sci 140: 103–125 [Google Scholar]
- Bouvet P, Wolffe AP (1994) A role for transcription and FRGY2 in masking maternal mRNA within Xenopus oocytes. Cell 77: 931–941 [DOI] [PubMed] [Google Scholar]
- Braddock M, Muckenthaler M, White MR, Thorburn AM, Sommerville J, Kingsman AJ, Kingsman SM (1994) Intron-less RNA injected into the nucleus of Xenopus oocytes accesses a regulated translation control pathway. Nucleic Acids Res 22: 5255–5264 [DOI] [PMC free article] [PubMed] [Google Scholar]
- Bradford MM (1976) A rapid and sensitive method for the quantitation of microgram quantities of protein utilizing the principle of protein-dye binding. Anal Biochem 72: 248–254 [DOI] [PubMed] [Google Scholar]
- Chattopadhyay MK, Gupta S, Sengupta DN, Ghosh B (1997) Expression of arginine decarboxylase in seedlings of indica rice (Oryza sativa L.) cultivars as affected by salinity stress. Plant Mol Biol 34: 477–483 [DOI] [PubMed] [Google Scholar]
- Chomczynski P, Mackey K (1995) Short technical reports. Modification of the TRI reagent procedure for isolation of RNA from polysaccharide- and proteoglycan-rich sources. Biotechniques 19: 942–945 [PubMed] [Google Scholar]
- Clough SJ, Bent AF (1998) Floral dip: a simplified method for Agrobacterium-mediated transformation of Arabidopsis thaliana. Plant J 16: 735–743 [DOI] [PubMed] [Google Scholar]
- Flores HE, Galston AW (1982) Polyamine and plant stress: activation of putrescine biosynthesis by osmotic shock. Science 217: 1259–1261 [DOI] [PubMed] [Google Scholar]
- Franceschetti M, Hanfrey C, Scaramagli S, Torrigiani P, Bagni N, Burtin D, Michael AJ (2001) Characterization of monocot and dicot plant S-adenosyl-l-methionine decarboxylase gene families including identification in the mRNA of a highly conserved pair of upstream overlapping open reading frames. Biochem J 353: 403–409 [DOI] [PMC free article] [PubMed] [Google Scholar]
- Furger A, O'Sullivan JM, Binnie A, Lee BA, Proudfoot NJ (2002) Promoter proximal splice sites enhance transcription. Genes Dev 16: 2792–2799 [DOI] [PMC free article] [PubMed] [Google Scholar]
- Graveley BR (2001) Alternative splicing: increasing diversity in the proteomic world. Trends Genet 17: 100–107 [DOI] [PubMed] [Google Scholar]
- Hanfrey C, Franceschetti M, Mayer MJ, Illingworth C, Elliott K, Collier M, Thompson B, Perry B, Michael AJ (2003) Translational regulation of the plant S-adenosylmethionine decarboxylase. Biochem Soc Trans 31: 424–427 [DOI] [PubMed] [Google Scholar]
- Hanfrey C, Franceschetti M, Mayer MJ, Illingworth C, Michael AJ (2002) Abrogation of upstream open reading frame-mediated translational control of a plant S-adenosylmethionine decarboxylase results in polyamine disruption and growth perturbations. J Biol Chem 277: 44131–44139 [DOI] [PubMed] [Google Scholar]
- Higo K, Ugawa Y, Iwamoto M, Korenaga T (1999) Plant cis-acting regulatory DNA elements (PLACE) database: 1999. Nucleic Acids Res 27: 297–300 [DOI] [PMC free article] [PubMed] [Google Scholar]
- Hill JR, Morris DR (1992) Cell-specific translation of S-adenosylmethionine decarboxylase mRNA. Regulation by the 5′ transcript leader. J Biol Chem 267: 21886–21893 [PubMed] [Google Scholar]
- Janne J, Poso H, Raina A (1978) Polyamines in rapid growth and cancer. Biochim Biophys Acta 473: 241–293 [DOI] [PubMed] [Google Scholar]
- Jefferson RA, Kavanagh TA, Bevan MW (1987) GUS fusions: beta-glucuronidase as a sensitive and versatile gene fusion marker in higher plants. EMBO J 6: 3901–3907 [DOI] [PMC free article] [PubMed] [Google Scholar]
- Kozak M (1989) The scanning model for translation: an update. J Cell Biol 108: 229–241 [DOI] [PMC free article] [PubMed] [Google Scholar]
- Kramer FG, Wang CY (1989) Correlation of reduced chilling injury with increased spermine and spermidine levels in zucchini squash. Physiol Plant 76: 479–484 [Google Scholar]
- Krishnamurthy R, Bagwat KA (1989) Polyamines as modulators of salt tolerance in rice cultivars. Plant Physiol 91: 500–504 [DOI] [PMC free article] [PubMed] [Google Scholar]
- Lacy-Hulbert A, Thomas R, Li XP, Lilley CE, Coffin RS, Roes J (2001) Interruption of coding sequences by heterologous introns can enhance the functional expression of recombinant genes. Gene Ther 8: 649–653 [DOI] [PubMed] [Google Scholar]
- Law GL, Raney A, Heusner C, Morris DR (2001) Polyamine regulation of ribosome pausing at the upstream open reading frame of S-adenosylmethionine decarboxylase. J Biol Chem 276: 38036–38043 [DOI] [PubMed] [Google Scholar]
- Matsumoto K, Wassarman KM, Wolffe AP (1998) Nuclear history of a pre-mRNA determines the translational activity of cytoplasmic mRNA. EMBO J 17: 2107–2121 [DOI] [PMC free article] [PubMed] [Google Scholar]
- Pegg AE, Stanley B, Pajunen A, Crozat A, Janne OA (1988) Properties of human and rodent S-adenosylmethionine decarboxylase. Adv Exp Med Biol 250: 101–109 [DOI] [PubMed] [Google Scholar]
- Pegg AE, Xiong H, Feith DJ, Shantz LM (1998) S-Adenosylmethionine decarboxylase: structure, function and regulation by polyamines. Biochem Soc Trans 26: 580–586 [DOI] [PubMed] [Google Scholar]
- Pillai MA, Akiyama T (2004) Differential expression of an S-adenosyl-L-methionine decarboxylase gene involved in polyamine biosynthesis under low temperature stress in japonica and indica rice genotypes. Mol Genet Genomics 271: 141–149 [DOI] [PubMed] [Google Scholar]
- Roy M, Wu R (2001) Arginine decarboxylase transgene expression and analysis of environmental stress tolerance in transgenic rice. Plant Sci 160: 869–875 [DOI] [PubMed] [Google Scholar]
- Ruan H, Shantz LM, Pegg AE, Morris DR (1996) The upstream open reading frame of the mRNA encoding S-adenosylmethionine decarboxylase is a polyamine-responsive translational control element. J Biol Chem 271: 29576–29582 [DOI] [PubMed] [Google Scholar]
- Sambrook J, Fritsch EF, Maniatis T (1989) Molecular Cloning: A Laboratory Manual, Ed 2. Cold Spring Harbor Laboratory Press, Cold Spring Harbor, NY
- Shen WY, Nada K, Tachibana S (2000) Involvement of polyamines in the chilling tolerance of cucumber cultivars. Plant Physiol 124: 431–439 [DOI] [PMC free article] [PubMed] [Google Scholar]
- Smith CW, Valcarcel J (2000) Alternative pre-mRNA splicing: the logic of combinatorial control. Trends Biochem Sci 25: 381–388 [DOI] [PubMed] [Google Scholar]
- Tian AG, Zhao JY, Zhang JS (2004) Genomic characterization of the S-adenosylmethionine decarboxylase genes from soybean. Theor Appl Genet 108: 842–850 [DOI] [PubMed] [Google Scholar]
- Willadino L, Camara T, Boget N, Claparols I, Santos M, Torne JM (1996) Polyamine and free amino acid variations in NaCl-treated embryogenic maize callus from sensitive and resistant cultivars. J Plant Physiol 149: 179–185 [Google Scholar]
- Xiong H, Stanley BA, Tekwani BL, Pegg AE (1997) Processing of mammalian and plant S-adenosylmethionine decarboxylase proenzymes. J Biol Chem 272: 28342–28348 [DOI] [PubMed] [Google Scholar]


