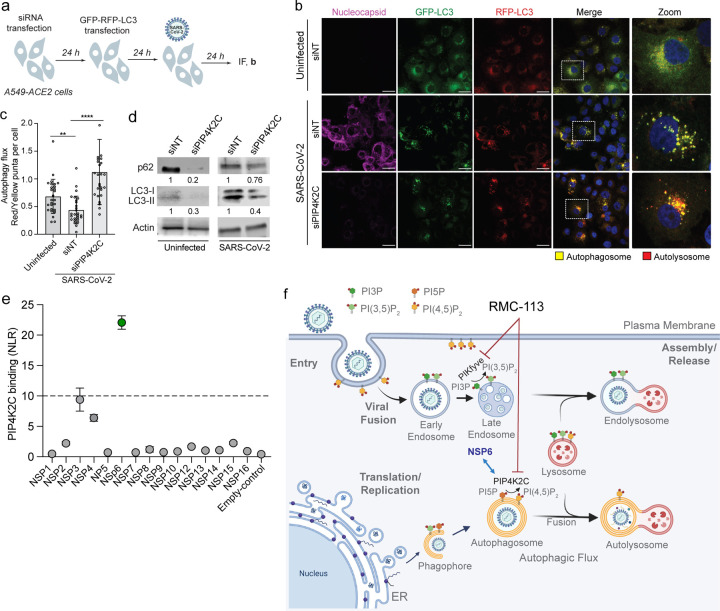
Fig. 6: PIP4K2C binds SARS-CoV-2 NSP6 and mediates virus-induced impairment of autophagic flux.
a, Schematic of the experiment shown in b.
b, Representative confocal microscopic images of A549-ACE2 cells transfected with the indicated siRNAs and GFP-RFP-LC3 tandem plasmid, and infected with SARS-CoV-2 (MOI = 0.5) for 24 hours and stained for nucleocapsid (violet). Representative merged images at x40 magnification are shown. Scale bars: 10 μm. Zoomed-in images show autophagosomes (yellow) and autolysosomes (red).
c, Autolysosome-to-autophagosomes ratio (autophagy flux) in 27 single cells (b).
d, Expression levels of p62, LC3I and LC3II following transfection of the indicated siRNAs in uninfected A549-ACE2 cell lysates (left panel) and SARS-CoV-2-infected cells at 24 hpi (MOI = 0.5) (right panel). Numbers represent the expression signal relative to DMSO averaged from 3 membranes.
e, PIP4K2C interactions with 15 SARS-CoV-2 nonstructural proteins and empty plasmid as measured via protein-fragment complementation assay (PCAs) in HEK 293T cells. Dots depict the mean normalized luminescence ratio (NLR) values generated from 2 independent experiments with 3 replicates each. The dotted line depicts the cutoff (NLR>10) used to define PIP4K2C-interacting proteins (depicted in green), representing greater than two SDs above the mean NLR of a non-interacting reference set. NLR, normalized luminescence ratio.
f, Proposed model for the roles of PIP4K2C and PIKfyve in SARS-CoV-2 infection and the mechanism of antiviral action of RMC-113.
Data is a representative (b, d, e) of 2 independent experiments. Data are relative to siNT (c, d). Means ± SD are shown (c). **P < 0.001, ****P <0.0001 by 1-way ANOVA followed by Dunnett’s multiple comparison test (c).

