

Abstract

To provide a theoretical basis for the frozen storage of potato-oat composite dough and its products, this investigation examines changes in the quality of potato-oat composite dough and its resulting product during freeze–thaw cycles. The study measured key aspects such as moisture content, dynamic rheological properties, water state, protein secondary structure, color, and sensory assessment. The influence of these factors on the product’s quality is analyzed. The findings revealed that the freeze–thaw treatment caused a reduction in water content, freezable water, and deeply bound water, as well as an increase in weakly bound water, β-sheet, random coil, and α-helix, and a decreased β-turn of the potato-oat composite dough. Additionally, the dough treated by freeze–thaw cycles resulted in darker color, and the sensory properties of the product were affected significantly after exceeding three freeze–thaw cycles. Moreover, an increase in the number of freeze–thaw cycles resulted in an upward trend of moisture content for the composite dough, whereas G′ initially increased and then decreased. The G″ of the composite dough peaked after the third freeze–thaw cycle. Overall, the composite dough quality significantly deteriorated at the fourth freeze–thaw cycle. There was a significant increase in the freezable water content, the largest modulus of elasticity, and the smallest tan δ. Therefore, the usage of the potato-oat composite dough should not exceed three cycles.
1. Introduction
Fresh products have a short shelf life when stored at room temperature, and deterioration occurs during storage. Therefore, consumer acceptance of the product decreases.1 This, coupled with the increased demand for frozen nonfermented dough in the Chinese market as the economy develops, has led to a constant search for ways to control the quality of the product. As a result, the freezing technique has emerged.2 The origins of frozen dough can be traced back to the 20th century, and since then, it has experienced rapid evolution. The widespread adoption of frozen dough by both producers and consumers can be attributed to its numerous benefits, such as its convenience for transportation, its time-saving properties, and its high production efficiency.3 Examining the quality transformations that occur during frozen dough storage makes it feasible to improve the taste and freshness of the end product. During the freezing process, both mechanical and thermal stresses are exerted on the dough as the water expands during the formation of ice crystals, which subsequently disrupts the gluten network structure and alters the moisture distribution within the dough.4 These alterations could directly affect the dough quality directly.
The cultivation of potatoes dates back approximately 8000 years, making it one of the oldest food crops. Currently, it ranks as the third most significant food crop globally, following rice and wheat.5 Notably, China stands out as the largest producer of potatoes and has witnessed substantial growth in potato consumption. Given the increasing demands of a growing population, potatoes are assuming greater importance as a staple food crop.6 Since 2015, a potato staple food strategy has been implemented in China, with a primary focus on processing potatoes into staple food products such as steamed buns and noodles.7 This strategic initiative seeks to maximize the utilization and worth of potatoes in meeting the dietary needs of the people. Oats, a cereal crop cultivated worldwide, exhibit a higher potential to prosper in marginal settings than other grains.8 Besides being grown for grain production, oats are also commonly used as a forage crop for cereal and livestock farming. They are highly valued for their nutritional content, which benefits both human and animal diets.9 Both potatoes and oats are significant crops, with widespread cultivation and utilization worldwide. Potatoes serve as an energy source and contain numerous essential nutrients, including vitamin C and potassium, and are high in essential amino acids in protein.10 On the other hand, oats possess a high level of dietary fiber and carbohydrates, predominantly consisting of unsaturated fats. Both crops present various nutritional advantages and make a valuable contribution to enhancing human health.11 It was demonstrated that adding oat flour significantly increased β-glucan levels, resulting in lower postprandial blood glucose levels compared to wheat flour alone (p < 0.05).12 Additionally, adding potato flour increased dietary fiber, ash, and antioxidant activity, while decreasing the estimated glycemic index compared to wheat flour alone.13 Potato-oat yu is a dish with a special place in the culinary traditions of Hebei, Inner Mongolia, and Shanxi in China. It is known for its soft and springy texture and is shaped like a fish. The unique delicacy is primarily made using a combination of potatoes and oats and is commonly served in a cooked form, either hot or cold.
This experiment analyzed the quality indicators of potato and oat dough through 0 to 4 freeze–thaw cycles (wherein freezing at −18 °C was done for 15 days, followed by thawing at 25 °C for 2 h, constituting a single cycle). The study aimed to investigate the impact of freeze–thaw cycles on potato-oat composite dough quality and deterioration. At the same time, the effect of the freeze–thaw cycle on the quality of potato-oat yu, an important product of the composite dough, was also investigated in detail. These provide a reference for the preservation and transportation of the dough and lay the foundation for further research on the protection mechanism.
2. Materials and Methods
2.1. Materials
Oat flour: Liangcheng County Century Grain Company Limited from Ulanqab, Inner Mongolia, produced in Inner Mongolia.
Potato: The species belongs to “Chinese potato no. 2”, originally from Luoyang City, Henan Province, China.
2.2. Preparation of Potato-Oat Composite Dough
The potatoes underwent a series of preparation steps including washing, peeling, and slicing. Subsequently, they were placed into a steamer once the water reached the boiling point. The potatoes were then steamed for a duration of 15 min, after which they were carefully removed from the steamer and mashed to achieve a uniform consistency, then quickly added the oat flour, and mixed well to make a potato-oat composite fresh dough (according to previous studies, the share of potatoes was 22.5%). The fresh dough was sealed in a polypropylene bag and immediately frozen at −18 °C for 15 days (the total thickness of the double layer of the bag is 12 mm, and the size is 19 × 14 cm, from Guangzhou Yuexingkun Manufacturing Co.), then thawed at 25 °C for 2 h. Composite dough without freeze–thaw cycles and after 1, 2, 3, and 4 freeze–thaw cycles are denoted by 0, 1, 2, 3, and 4, respectively. The same freezing and thawing process was repeated four times consecutively. Finally, the dough samples were steamed in a dedicated steamer for a duration of 20 min. The resulting product, known as potato-oat yu (Figure 1), was obtained following this extensive process.
Figure 1.

Photo of potato-oat yu.
The mentioned controls refer to fresh dough that has not undergone freeze–thawing and potato-oat yu made from fresh dough.
2.3. Moisture Content Analysis of Compound Dough
The moisture content of the potato-oat composite dough was determined via the method described by Ding et al.14 with slight adjustments. In the initial stage of the experiment, an aluminum box was dried at 105 °C until it reached a constant weight, and its mass referred to as M0 (g) was determined. Subsequently, 1 g of the dough sample was thawed at room temperature until it reached a temperature of 24 °C, and its mass was recorded as M1 (g). The dried dough’s final mass was measured as M2 (g) after undergoing drying in an oven at 105 °C until it reached a stable weight. Calculation of the dough’s moisture content followed eq 1:
| 1 |
2.4. Dynamic Rheological Properties Analysis of Compound Dough
Dynamic frequency scans were carried out on each sample to determine the frequency parameters, including energy storage modulus (G′) and loss modulus (G″) and tan δ (tan δ = G″/G′). Test parameters were slightly modified according to the method of Wang et al.:15 the scan frequency interval was set between 0.1 and 40.0 Hz, and the plate diameter was configured as 40 mm with a parallel plate spacing of 1 mm. The tests were conducted at a temperature of 25 °C with a strain of 0.5%.
Temperature scans were recorded between 25 and 80 °C, with an increase of 5 °C per minute. The storage modulus (G′) and loss modulus (G″) were measured at a constant strain of 0.5% and a frequency of 1 Hz.
2.5. Content of Freezable Water (FW) in Dough
The freezable water content (FW) of frozen dough was determined utilizing Waleed’s method16 with minor adjustments. To achieve this, samples were frozen at a rate of 10 °C/min commencing at 20 °C, until reaching −30 °C. Then, they were held for 2 min at −30 °C and subsequently heated to 0 °C at a rate of 10 °C/min. The calculation of FW followed the given formula given in eq 2:
| 2 |
where FW is the freezable water content (%), ΔH is the latent heat of melting of ice in the sample, and the latent heat of ice melting ΔH0 = 334 J/g.
2.6. Water State Analysis of Composite Dough
The moisture state of the composite dough was analyzed using low-field NMR (Niu Mai Electronic Technology Co., Ltd., Shanghai), following the methodology of Nawaz et al.17 The weight of the sample for each test is 3 g. To avoid any loss of moisture, the sample was carefully wrapped with a cling film. Afterward, the wrapped sample was placed inside the tube of low-field nuclear magnetic resonance and positioned in an LF-NMR instrument for analysis. The test parameters used for the determination included a total of 89,992 sampling points (TD), 3000 echoes (NECH), and 16 repetitions (NS).
2.7. FTIR Analysis of Composite Dough
The protein secondary structure of composite dough was determined using the method reported by Li et al.18 The sample was ground to a homogeneous powder by placing the sample in a mortar and pestle with potassium bromide at a mass ratio of 1:100. The resulting sheet was then measured using Fourier transform infrared (FTIR) (VERTEX70, Bruker Corporation, Karlsruher, Germany) spectroscopy in transmission mode, employing the following parameters: for further analysis, spectra between 1600 and 1700 cm–1 were selected from a scanning range of 400–4000 cm–1. The collected spectra were subjected to fitting analysis using Peak Fitv4.12 software.
2.8. Microstructure Analysis of Composite Dough
Observation of the microstructure of potato-oat composite dough by SEM (FlexSEM1000, HITACHI) at 1000×, according to the method of Guo et al.19 After vacuum freeze-drying (wet base moisture content below 10%), small pieces of dough with a smooth surface in the middle of the dough were taken and observed using a scanning electron microscope.
2.9. Color Analysis of Potato-Oat Yu
The color of potato-oat yu, in terms of ΔE, C*, H*, and browning index (BI), was determined by a colorimeter (X-rite Co., USA) following the method of Liu et al.20 The calculation formula of each index is as follows:
| 3 |
| 4 |
| 5 |
| 6 |
where L* for lightness, a* for redness, b* for yellowness, and the total color (ΔE) variation index, hue (H*), chroma (C*), and browning index (BI) calculated by these equations.
2.10. Sensory Determination of Potato-Oat Yu
After cooking, the potato-oat yu was cooled at room temperature for 30 min and then evaluated by 50 trained sensory evaluators in terms of color, smoothness, smell, elasticity, hardness, and chewiness with reference to Table 1.
Table 1. Score Scoring Criteria of Potato-Oat Yu.
| indicator | total | score scoring criteria |
|---|---|---|
| color | 15 | light brown, uniform color (12–15); darker but acceptable color (6–11); dark brown or dark spots (0–5) |
| smoothness | 10 | smooth and delicate surface without folds or bumpy spots (8–10); smooth surface with low gloss (4–7); uneven surface and poor gloss (0–3) |
| odor | 15 | fresh and pleasant without odor (12–15); odor is not easily detected (5–11); no fragrance or odor (0–5) |
| elasticity | 20 | fast recovery after pressing, no deformation (16–20); faster recovery, small deformation (12–15); poor recovery (0–11) |
| hardness | 20 | moderate softness (16–20); slightly hard or soft (12–15); limp or difficult to chew (0–11) |
| chewiness | 20 | chewing time is close to normal chewing time (16–20); easier to chew or more resistant to chewing (12–15); no chewiness or too long chewing time (0–11) |
2.11. Statistical Analysis
Unless otherwise stated, all experiments were conducted in triplicate and the experimental data were analyzed by ANOVA with 95% confidence according to the new Duncan method. SPASS software (version 20, IBM, USA) was used for data analysis.
3. Results and Discussion
3.1. Effect of Freeze–Thaw Cycles on the Moisture Content of Potato-Oat Composite Dough
The moisture content of the composite dough made from potatoes and oats was evaluated with varying freeze–thaw cycles, as shown in Figure 2. The data indicates a significant decline in moisture content after the third freeze–thaw cycle (p < 0.05). This may be attributed to the creation of ice crystals, which can hamper the physical makeup of the dough, particularly the network of gluten protein arrangement.21 It should be emphasized that this impaired structure could have an adverse effect on the dough quality. The phenomenon results in a decrease in the water-holding capacity of gluten protein, thereby decreasing the dough’s water-holding capacity. Damage to the dough is further amplified by subsequent freeze–thaw cycles,22 which further diminishes its water-holding capacity. This process induces water to migrate from the interior of the dough to its surface, leading to moisture loss and, consequently, a reduction in water content.23
Figure 2.

Effect of freeze–thaw cycles on the moisture content of the potato-oat composite dough.
3.2. Effect of Freeze–Thaw Cycles on the Rheological Properties of Potato-Oat Dough
The effects of varying numbers of freeze–thaw cycles on the storage modulus (G′) and loss modulus (G″) of the samples, as well as the calculation results of tan δ (tan δ = G″/G′) for the composite doughs, are illustrated in Figure 3.
Figure 3.

(A–F) Effect of freeze–thaw cycles on the rheological properties of potato-oat dough.
According to Figure 3A–C, with the increase of frequency, the G′ and G″ of the composite dough show a gradual increase, suggesting that the viscoelasticity of the dough is improved by the freeze–thaw treatment.24 The swelling of the dough stemming from the growth of ice crystals inside along with reduced gluten cross-linking and redistribution of water can be linked to this phenomenon.25 As a consequence, the volume of the loose dough expands during ice crystal growth and melting, resulting in a gradual increase in G′. On the other hand, as the frequency increased, the G″ of each dough displays a declining and then increasing trend. For the frequencies below 0.25, G″ (4) > G″ (3) > G″ (2) > G″ (0) > G″ (1). However, for the frequencies exceeding 0.25, the composite dough exhibits a trend of decreasing G″ values in the order G″ (3) > G″ (4) > G″ (2) > G″ (0) > G″ (1). Additionally, the G′ values of the composite dough are consistently higher than G″ at any given frequency, with tan δ remaining below 1. These results suggest that the composite dough behaves as a viscoelastic solid with a greater tendency for elasticity than viscosity.
The thermal characteristics of the composite dough were investigated by heating experiments with a rheometer, as shown in Figure 3D–F. During the heating process, as the temperature increased, the dough’s G′ and G″ decreased initially, subsequently increased, and decreased again. The storage and loss modulus of the composite dough dropped within the temperature range of around 25–45 °C, probably because the starch molecules dissolved and absorbed water as the temperature increased. From about 45–75 °C, the G′ exhibited a rapid increase, reaching a peak, and subsequently declining. This might be because the G″ of the composite dough expanded further and formed more cross-linked structures as the temperature continued to rise, resulting in a gradual increase in the elastic and viscous moduli.26 Consequently, the G′ began to increase, indicating that the pasting of starch and the destabilization of protein due to thermal denaturation.27 Following the attainment of the maximum value of the G′ and G″ of the composite dough was reached, the subsequent decrease in these parameters signifies the denaturation and pasting of the protein and starch constituents within the dough.28 With an increase in the number of freeze–thaw cycles, the peak temperature observed during the heating experiments progressively decreased. This trend is probably caused by the extended freeze–thaw period that destabilizes the protein in the composite dough, thus changing its thermal features.
3.3. Effect of Freeze–Thaw Cycles on the Freezable Water Content of Potato-Oat Dough
Figure 4 presents an illustration of the impact of freeze–thaw cycles on the free water content of potato and oat dough. Freezable water includes free water and partially freezable combined water.29 The existence of freezable water affects frozen dough’s quality, as it decides the formation of ice crystals. Notably, significant variations (p < 0.05) in freezable water concentration were identified after diverse freeze–thaw cycle counts. The redistribution and migration of water molecules within the composite dough due to freeze–thaw cycles alters its water distribution, resulting in a notable increase in freezable water content. This, in turn, indicates the formation of more ice crystals and physical damage to the dough. Previous studies by Lu and Grant30 show that as the number of freezing days increases, the gluten network within the dough becomes disrupted, resulting in the release of water from the gluten and starch matrix. Consequently, the free water content increases. A higher freezable water content indicates greater damage to the composite dough during freeze–thaw processes.31 With the increase of freezing and thawing times, the gluten network is destroyed, causing some bound water to become free and resulting in an increase in the freezable water content.
Figure 4.

Effect of freeze–thaw cycles on the freezable water content of potato-oat dough.
3.4. Effect of Freeze–Thaw Cycles on Water Migration in Potato-Oat Dough
Three distinct peaks were identified in the low-field NMR spectrum of the composite dough and labeled as A21, A22, and A23, where A21 represents deeply bound water, which corresponds to water molecules surrounded by macromolecular chemical structures such as proteins; A22 corresponds to weakly bound water, which refers to water molecules located away from macromolecules and exists in a relatively free form; and A23 corresponds to free water, which displays higher mobility.32
Figure 5 and Table 2 demonstrate the significant impact of freeze–thaw cycles on the transverse relaxation times (A21, A22, and A23) of the composite dough. After undergoing freeze–thaw cycles, the A22 value of the composite dough was significantly larger compared to that of the fresh dough samples (p < 0.05). Additionally, the A21 value of the composite dough significantly decreased after different numbers of freeze–thaw cycles (p < 0.05), which aligns with the findings reported by Tang et al.33 The separation of water from gluten occurs during the freeze–thaw cycle, and during thawing, the resulting aqueous phase interacts with the gluten matrix. This interaction reduces the gluten’s ability to bind water, thereby leading to a decrease in A21.34 Moreover, the freeze–thaw cycle induces changes in protein conformation, resulting in an increased protein surface area and weakened binding between protein and water molecules.35 This phenomenon leads to the transfer of deeply bound water to semibound water, indicating a weakening of the interaction between protein and water molecules during the freeze–thaw cycle.
Figure 5.
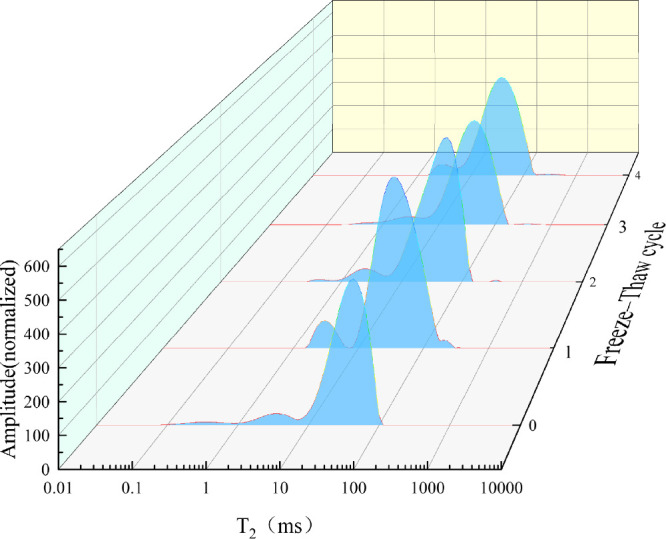
Effect of freeze–thaw cycles on water migration in potato-oat dough.
Table 2. Effect of Freeze–Thaw Cycles on Water Migration in Potato-Oat Dougha.
| freeze–thaw cycle | A21 (%) | A22 (%) | A23 (%) |
|---|---|---|---|
| 0 | 8.94 ± 0.25a | 90.96 ± 0.22a | 0.13 ± 0.07c |
| 1 | 7.01 ± 0.12b | 92.18 ± 0.13b | 0.82 ± 0.01a |
| 2 | 6.90 ± 0.16bc | 92.94 ± 0.16b | 0.16 ± 0.00c |
| 3 | 6.29 ± 0.40c | 93.19 ± 0.26c | 0.52 ± 0.14b |
| 4 | 5.08 ± 0.18d | 94.43 ± 0.06d | 0.49 ± 0.12b |
Note: Different lowercase letters in the same column indicate significant differences (p < 0.05).
3.5. Effect of Freeze–Thaw Cycles on the Secondary Structure of Potato-Oat Dough Proteins
Figure 6 and Table 3 present the structural contents of the β-sheet, random coil, α-helix, and β-turn in the potato-oat composite dough. The amide I band appears in the wavenumber range between 1700 and 1610 cm–1 and is an important component of protein secondary structure FTIR spectra.36 The composite dough without any freeze–thaw cycles exhibited 25.56% β-sheet, 12.11% random coil, 24.44% α-helix, and 23.53% β-turn. Interestingly, after three freeze–thaw cycles, the content of random coil and α-helix significantly increased by 2.4 and 2.33%, respectively (p < 0.05). Conversely, the β-turn content decreased significantly by 6.97% (p < 0.05).
Figure 6.

Effect of freeze–thaw cycles on the secondary structure of potato-oat dough.
Table 3. Effect of Freeze–Thaw Cycles on the Secondary Structure of Potato-Oat Dough Proteinsa.
| protein secondary structure (%) |
||||
|---|---|---|---|---|
| freeze–thaw cycle | β-sheet | random coil | α-helix | β-turn |
| 0 | 25.56 ± 0.04b | 12.11 ± 0.04b | 24.44 ± 0.01b | 23.53 ± 0.15a |
| 1 | 25.66 ± 0.11ab | 12.20 ± 0.09b | 24.29 ± 0.22b | 23.61 ± 0.05a |
| 2 | 26.68 ± 1.86ab | 12.85 ± 0.93ab | 25.67 ± 1.87ab | 20.04 ± 5.19ab |
| 3 | 27.92 ± 0.17ab | 13.51 ± 0.01a | 26.77 ± 0.02a | 16.56 ± 0.01b |
| 4 | 27.79 ± 0.24a | 13.73 ± 0.19a | 26.93 ± 0.02a | 16.59 ± 0.15b |
Note: Different lowercase letters in the same column indicate significant differences (p < 0.05).
The reduction in β-turn content is particularly noteworthy, as the β-turn structure contributes to the elongation of the dough.37 Freezing and thawing processes appear to decrease the elongation properties of the composite dough. This implies that the β-turn structure, which involves a reversal of the polypeptide chain by 180°, cannot be effectively maintained and is transformed into a β-sheet structure. Additionally, the increase in α-helix content is known to result in enhanced adhesion of the dough,38 which aligns with the rheological properties discussed earlier regarding the composite dough. During the freeze–thaw process, a positive correlation was observed between the β-sheet and the values of A21. This suggests that changes in the secondary structure of proteins are related to water rearrangement during freezing and thawing.
3.6. Effect of Freeze–Thaw Cycles on the Microstructure of Potato-Oat Composite Doughs
Figure 7 shows the effect of freeze–thaw cycles on the microstructure of potato-oat composite dough. The microscopic network structure of the composite dough was dense and orderly before it underwent freeze–thaw cycles. However, with an increase in the number of cycles, the structure became increasingly loose and disordered, with more small holes appearing and partial detachment of the starch-encapsulated network structure. The increase in free water after a freeze–thaw cycle can lead to an increase in crystalline ice, which damages the network structure.35 During the freeze–thaw cycle, the water crystallizes, melts, and recrystallizes, causing repetitive damage to the network structure.39
Figure 7.

Effect of freeze–thaw cycles on the microstructure of potato-oat composite doughs.
3.7. Effect of Freeze–Thaw Cycles on the Color of Potato-Oat Yu
Table 4 presents the impact of the number of freeze–thaw cycles on the color difference of potato-oat yu. Following the first cycle of freeze–thaw, ΔE significantly decreased (p < 0.05) compared to the nonfreeze–thaw treated samples. Additionally, after the second freeze–thaw cycle, H* was significantly reduced, while no significant changes were observed in C* and BI after the freeze–thaw cycles. With an increase in the number of freeze–thaw cycles, the L* value of potato-oat yu gradually decreased, indicating a tendency for the dough to become darker. When compared to the fresh potato-oat yu samples, the L* values of potato-oat yu treated with freeze–thaw cycles were consistently smaller, indicating a significant decrease in brightness at the fourth freeze–thaw cycle (p < 0.05).
Table 4. Effect of Freeze–Thaw Cycles on the Color of Potato-Oat Yua.
| freeze–thaw cycle | L* | a* | b* | ΔE | C* | H* | BI |
|---|---|---|---|---|---|---|---|
| 0 | 73.28 ± 0.39a | –0.39 ± 0.32c | 22.27 ± 1.14a | - | 22.28 ± 1.62a | 1.55 ± 0.02a | 1.55 ± 0.02a |
| 1 | 71.95 ± 2.28a | –0.46 ± 0.23c | 21.55 ± 1.29a | 7.62 ± 2.74a | 21.56 ± 1.83a | 1.55 ± 0.01a | 1.55 ± 0.01a |
| 2 | 71.20 ± 0.86ab | 0.62 ± 0.17b | 23.63 ± 2.04a | 3.78 ± 1.81b | 23.64 ± 2.89a | 1.54 ± 0.01a | 1.54 ± 0.01a |
| 3 | 70.04 ± 0.66ab | 2.60 ± 0.23a | 25.08 ± 1.96a | 3.83 ± 1.61b | 25.21 ± 2.79a | 1.47 ± 0.00b | 1.47 ± 0.00a |
| 4 | 68.40 ± 0.08b | 2.88 ± 0.15a | 25.85 ± 1.43a | 2.71 ± 1.25b | 26.01 ± 2.03a | 1.46 ± 0.00b | 1.46 ± 0.00a |
Note: Different lowercase letters in the same column indicate significant differences (p < 0.05).
The a* value exhibited a gradual increase as the number of freeze–thaw cycles increased, indicating a transition to a reddish hue in potato-oat yu. Consequently, the dynamic freeze–thaw cycles evidently influenced the brightness and redness of the dough. This can be attributed to the temperature fluctuations caused by the freeze–thaw cycles, which disrupt the gluten network structure and reduce its density.
3.8. Effect of Freeze–Thaw Cycles on the Sensory Determination of Potato-Oat Yu
Figure 8 and Table 5 illustrate the impact of different numbers of freeze–thaw cycles on the sensory evaluation of potato-oat yu. As demonstrated, sensory scores of potato-oat yu declined systematically as the number of freeze–thaw cycles increased, and a sharp drop was noted after the third cycle. Notably, degradation of potato-oat yu texture is thought to be responsible for the reported decrease in sensory scores following freezing and thawing. The freeze–thaw process can alter the gluten and protein structures of the dough, resulting in a softer and suboptimal texture. This can potentially compromise the overall eating experience. Furthermore, repeated freezing and thawing could also influence the flavor characteristics of the potato-oat yu, leading to reduced freshness owing to changes in moisture content. In summary, an increased number of freeze–thaw cycles can have a negative impact on the sensory evaluation of potato-oat yu.
Figure 8.

Effect of freeze–thaw cycles on the sensory determination of potato-oat yu.
Table 5. Effect of Freeze–Thaw Cycles on the Sensory Determination of Potato-Oat Yua.
| freeze–thaw cycle | color | smoothness | odor | elasticity | hardness | chewiness | total score |
|---|---|---|---|---|---|---|---|
| 0 | 14.90 ± 0.14a | 9.05 ± 0.21a | 14.13 ± 0.62a | 19.45 ± 0.13a | 19.45 ± 0.21a | 18.52 ± 1.90a | 95.50 ± 0.71a |
| 1 | 14.85 ± 0.07a | 8.95 ± 0.07a | 13.70 ± 0.28a | 19.17 ± 0.04b | 18.55 ± 0.35b | 18.27 ± 1.18a | 93.50 ± 0.71ab |
| 2 | 14.20 ± 0.14b | 8.40 ± 0.14b | 13.55 ± 0.35b | 19.02 ± 0.11bc | 18.31 ± 0.09b | 15.97 ± 2.81a | 90.00 ± 1.41b |
| 3 | 13.50 ± 0.28c | 7.80 ± 0.14c | 13.40 ± 0.14c | 18.82 ± 0.11c | 17.94 ± 0.48bc | 14.54 ± 1.34a | 86.00 ± 1.41c |
| 4 | 12.15 ± 0.21d | 6.50 ± 0.28d | 12.85 ± 0.07d | 18.25 ± 0.07d | 17.40 ± 0.14c | 16.35 ± 0.79a | 83.50 ± 0.71c |
Note: Different lowercase letters in the same column indicate significant differences (p < 0.05).
4. Conclusions
In this study, the impact of freeze–thaw cycles on the moisture content, G′, G″, and freezable water content, and potato-oat composite dough’s water migration is assessed. Additionally, the color difference, texture characteristics, and sensory evaluation of potato-oat yu are examined. The moisture content and Tanδ of the potato-oat composite dough altered significantly after three freeze–thaw cycles. Sensory evaluation indicated that the sensory score of potato-oat yu noticeably declined after the third cycle (p < 0.05). As a result, to maintain the quality of the composite dough and its products, it is advisable not to exceed the three freeze–thaw cycles limit.
Acknowledgments
We acknowledge the financial support from the Major Science and Technology Project of Henan Province (no. 221100110800); the Key Science and Technology Program of Henan Province (nos. 232102110161 and 232102110159); the Leading Talents of Science and Technology in the Central Plain of China (no. 234200510020); the Doctor Scientific Research Start-up Fund of Henan University of Science and Technology (nos. 13480086, 13480077, and 13480074); the Special Program for the Introduction of Foreign Intelligence in Henan Province (Foreign Experts Project) (nos. HNGD2023011 and HNGD2022055); and the Young Key Teachers in University in Henan Province (no. 2020GGJS072).
Author Contributions
X.Z.: investigation, methodology, writing (original draft), and writing (review and editing). G.R.: methodology, writing (review and editing), and funding acquisition. W.L.: methodology and writing (review and editing). L.L.: methodology and formal analysis. W.C.: methodology and supervision. L.W.: conceptualization and writing (review and editing). X.D.: conceptualization, supervision, writing (review and editing), and funding acquisition.
The authors declare no competing financial interest.
References
- Yang J.; Zhang Y.; Jiang J.; Zhang B.; Li M.; Guo B. Effects of Frozen Storage Time, Thawing Treatments, and Their Interaction on the Rheological Properties of Non-Fermented Wheat Dough. Foods 2023, 12 (23), 4369. 10.3390/foods12234369. [DOI] [PMC free article] [PubMed] [Google Scholar]
- Selomulyo V. O.; Zhou W. Frozen bread dough: Effects of freezing storage and dough improvers. Journal of Cereal Science 2007, 45 (1), 1–17. 10.1016/j.jcs.2006.10.003. [DOI] [Google Scholar]
- Ban C.; Yoon S.; Han J.; Kim S. O.; Han J. S.; Lim S.; Choi Y. J. Effects of freezing rate and terminal freezing temperature on frozen croissant dough quality. LWT 2016, 73, 219–225. 10.1016/j.lwt.2016.05.045. [DOI] [Google Scholar]
- Hu S.; Luo Y.; Cui J.; Lu W.; Wang H.; You J.; Shen H. Effect of silver carp (H ypophthalmichthys molitrix) muscle hydrolysates and fish skin hydrolysates on the quality of common carp (C yprinus carpio) during 4° C storage. International journal of food science & technology 2013, 48 (1), 187–194. 10.1111/j.1365-2621.2012.03176.x. [DOI] [Google Scholar]
- Bandana D. K.; Kumar P.; Rawal S.; Saini N.; Sharma V. Influence of source of nutrition on potato (Solanum tuberosum) tuber quality in elevated temperature storage. Indian J. Agric. Sci. 2018, 88 (9), 1371–1377. 10.56093/ijas.v88i9.83360. [DOI] [Google Scholar]
- Birch P. R.; Bryan G.; Fenton B.; Gilroy E. M.; Hein I.; Jones J. T.; Prashar A.; Taylor M. A.; Torrance L.; Toth I. K. Crops that feed the world 8: potato: are the trends of increased global production sustainable?. Food Security 2012, 4, 477–508. 10.1007/s12571-012-0220-1. [DOI] [Google Scholar]
- Wang Q.; Zhang H.; Zhu W.; Li C.; Xu Y.; Ding X.; Zhou X. Physicochemical properties and nutritional quality of pre-fermented red bean steamed buns as affected by freeze-thaw cycling. International Journal of Food Properties 2022, 25 (1), 748–763. 10.1080/10942912.2022.2060252. [DOI] [Google Scholar]
- Astiz V.; Guardianelli L. M.; Salinas M. V.; Brites C.; Puppo M. C. High β-Glucans oats for healthy wheat breads: Physicochemical properties of dough and breads. Foods 2023, 12 (1), 170. 10.3390/foods12010170. [DOI] [PMC free article] [PubMed] [Google Scholar]
- Brodführer S.; Mohler V.; Stadlmeier M.; Okoń S.; Beuch S.; Mascher M.; Tinker N. A.; Bekele W. A.; Hackauf B.; Herrmann M. H. Genetic mapping of the powdery mildew resistance gene Pm7 on oat chromosome 5D. Theor. Appl. Genet. 2023, 136 (3), 53. 10.1007/s00122-023-04288-z. [DOI] [PMC free article] [PubMed] [Google Scholar]
- Yang L.; Zhang H.; Huang B.; Hao S.; Li S.; Li P.; Yu H. Studying the Role of Potato Powder on the Physicochemical Properties and Dough Characteristics of Wheat Flour. Gels 2023, 9 (2), 73. 10.3390/gels9020073. [DOI] [PMC free article] [PubMed] [Google Scholar]
- Starowicz M.; Arpaci S.; Topolska J.; Wronkowska M. Phytochemicals and antioxidant activity in oat-buckwheat dough and cookies with added spices or herbs. Molecules 2021, 26 (8), 2267. 10.3390/molecules26082267. [DOI] [PMC free article] [PubMed] [Google Scholar]
- Krochmal-Marczak B.; Tobiasz-Salach R.; Kaszuba J. The effect of adding oat flour on the nutritional and sensory quality of wheat bread. British Food Journal 2020, 122 (7), 2329–2339. 10.1108/BFJ-07-2019-0493. [DOI] [Google Scholar]
- Qiu-Ping C.; Chang-Hong L.; Huang Z.; Han-You Z.. Effect of bacterial alpha amylase on dough characteristics and quality of steamed bread during staling. Food Sci. Technol. 2017. [Google Scholar]
- Ding X.; Zhang H.; Wang L.; Qian H.; Qi X.; Xiao J. Effect of barley antifreeze protein on thermal properties and water state of dough during freezing and freeze-thaw cycles. Food Hydrocolloids 2015, 47, 32–40. 10.1016/j.foodhyd.2014.12.025. [DOI] [Google Scholar]
- Wang Y.; Guo J.; Wang C.; Li Y.; Bai Z.; Luo D.; Hu Y.; Chen S. Effects of konjac glucomannan and freezing on thermal properties, rheology, digestibility and microstructure of starch isolated from wheat dough. LWT 2023, 177, 114588 10.1016/j.lwt.2023.114588. [DOI] [Google Scholar]
- Waleed A.-A.; Fadhl J. A.; Abdullah A. B.; Al-Adeeb A.; Mahdi A. A.; Al-Maqtari Q. A.; Mushtaq B. S.; Fan M.; Li Y.; Qian H. Effect of highland barely germination on thermomechanical, rheological, and micro-structural properties of wheat-oat composite flour dough. Food Biosci. 2023, 53, 102521 10.1016/j.fbio.2023.102521. [DOI] [Google Scholar]
- Nawaz A.; Li E.; Khalifa I.; Irshad S.; Walayat N.; Mohammed H. H. H.; Zhang Z.; Ahmed S.; Simirgiotis M. J. Evaluation of fish meat noodles: physical property, dough rheology, chemistry and water distribution properties. International journal of food science & technology 2021, 56 (2), 1061–1069. 10.1111/ijfs.14761. [DOI] [Google Scholar]
- Li Y.; Chen Y.; Li S.; Gao A.; Dong S. Structural changes of proteins in fresh noodles during their processing. International journal of food properties 2017, 20 (sup1), S202–S213. 10.1080/10942912.2017.1295253. [DOI] [Google Scholar]
- Guo W.-T.; Yang X.-F.; Ji Y.-S.; Hu B.; Li W.-G.; Zhong X.-Y.; Jiang S.-T.; Zheng Z. Effects of transglutaminase and glucose oxidase on the properties of frozen dough: Water distribution, rheological properties, and microstructure. Journal of Cereal Science 2023, 111, 103689 10.1016/j.jcs.2023.103689. [DOI] [Google Scholar]
- Liu H.; Liang Y.; Guo P.; Liu M.; Chen Z.; Qu Z.; He B.; Zhang X.; Wang J. Understanding the influence of Curdlan on the quality of frozen cooked noodles during the cooking process. LWT 2022, 161, 113382 10.1016/j.lwt.2022.113382. [DOI] [Google Scholar]
- Sharadanant R.; Khan K. Effect of hydrophilic gums on the quality of frozen dough: II. Bread characteristics. Cereal Chem. 2003, 80 (6), 773–780. 10.1094/CCHEM.2003.80.6.773. [DOI] [Google Scholar]
- Dai Y.; Gao H.; Tian X.; Huang K.; Liu Y.; Zeng J.; Wang M.; Qin Y. Effect of freeze-thaw cycles at different temperatures on the properties of gluten proteins in unfermented dough. Cereal Chem. 2022, 99 (5), 1039–1048. 10.1002/cche.10563. [DOI] [Google Scholar]
- Omedi J. O.; Huang W.; Zhang B.; Li Z.; Zheng J. Advances in present-day frozen dough technology and its improver and novel biotech ingredients development trends—A review. Cereal chemistry 2019, 96 (1), 34–56. 10.1002/cche.10122. [DOI] [Google Scholar]
- Bhattacharya M.; Langstaff T. M.; Berzonsky W. A. Effect of frozen storage and freeze–thaw cycles on the rheological and baking properties of frozen doughs. Food Research International 2003, 36 (4), 365–372. 10.1016/S0963-9969(02)00228-4. [DOI] [Google Scholar]
- Cui T.; Liu R.; Wu T.; Sui W.; Zhang M. Influence of konjac glucomannan and frozen storage on rheological and tensile properties of frozen dough. Polymers 2019, 11 (5), 794. 10.3390/polym11050794. [DOI] [PMC free article] [PubMed] [Google Scholar]
- Addo K.; Xiong Y.; Blanchard S. Thermal and dynamic rheological properties of wheat flour fractions. Food research international 2001, 34 (4), 329–335. 10.1016/S0963-9969(00)00171-X. [DOI] [Google Scholar]
- Aprodu I.; Vasilean I.; Muntenită C.; Patrascu L. Impact of broad beans addition on rheological and thermal properties of wheat flour based sourdoughs. Food chemistry 2019, 293, 520–528. 10.1016/j.foodchem.2019.05.007. [DOI] [PubMed] [Google Scholar]
- Yang S.; Jeong S.; Lee S. Elucidation of rheological properties and baking performance of frozen doughs under different thawing conditions. Journal of Food Engineering 2020, 284, 110084 10.1016/j.jfoodeng.2020.110084. [DOI] [Google Scholar]
- Matuda T. G.; Chevallier S.; de Alcântara Pessôa Filho P.; LeBail A.; Tadini C. C. Impact of guar and xanthan gums on proofing and calorimetric parameters of frozen bread dough. Journal of cereal science 2008, 48 (3), 741–746. 10.1016/j.jcs.2008.04.006. [DOI] [Google Scholar]
- Lu W.; Grant L. Effects of prolonged storage at freezing temperatures on starch and baking quality of frozen doughs. Cereal chemistry 1999, 76 (5), 656–662. 10.1094/CCHEM.1999.76.5.656. [DOI] [Google Scholar]
- Wang X.; Pei D.; Teng Y.; Liang J. Effects of enzymes to improve sensory quality of frozen dough bread and analysis on its mechanism. Journal of food science and technology 2018, 55, 389–398. 10.1007/s13197-017-2950-8. [DOI] [PMC free article] [PubMed] [Google Scholar]
- Zhang Z.; Hu E.; Peng C.; Huang Z. Experimental and kinetic study on ignition delay times of diethyl ether. SAE International Journal of Fuels and Lubricants 2015, 8 (1), 111–118. 10.4271/2015-01-0897. [DOI] [Google Scholar]
- Tang X.; Liu N.; Huang W.; Cheng X.; Wang F.; Zhang B.; Chen J.; Jiang H.; Omedi J. O.; Li Z. Syneresis rate, water distribution, and microstructure of wheat starch gel during freeze-thaw process: Role of a high molecular weight dextran produced by Weissella confusa QS 813 from traditional sourdough. Cereal Chem. 2018, 95 (1), 117–129. 10.1094/CCHEM-08-17-0174-R. [DOI] [Google Scholar]
- Chen X.; Wu J.-h.; Li L.; Wang S.-y. The cryoprotective effects of antifreeze peptides from pigskin collagen on texture properties and water mobility of frozen dough subjected to freeze–thaw cycles. European Food Research and Technology 2017, 243, 1149–1156. 10.1007/s00217-016-2830-x. [DOI] [Google Scholar]
- Li Y.; Wang Y.; Qiu X.; Fan M.; Wang L.; Qian H. Effect of Lactylated Gluten and Freeze-Thaw Cycles on Frozen Dough: From Water State and Microstructure. Foods 2023, 12 (19), 3607. 10.3390/foods12193607. [DOI] [PMC free article] [PubMed] [Google Scholar]
- Jeong S.; Kim H. W.; Lee S. Rheological and secondary structural characterization of rice flour-zein composites for noodles slit from gluten-free sheeted dough. Food Chem. 2016, 1539. 10.1016/j.foodchem.2016.10.139. [DOI] [PubMed] [Google Scholar]
- Belton P. Mini review: on the elasticity of wheat gluten. Journal of cereal science 1999, 29 (2), 103–107. 10.1006/jcrs.1998.0227. [DOI] [Google Scholar]
- Zhang Y.; Li Y.; Liu Y.; Zhang H. Effects of multiple freeze–thaw cycles on the quality of frozen dough. Cereal Chem. 2018, 95 (4), 499–507. 10.1002/cche.10053. [DOI] [Google Scholar]
- Chen N.; Yang Q.; Zhang C.-C.; Chen H.-Q. Impact of basil seed gum on the textural, rheological properties, water state, gluten depolymerization and microstructure of frozen dough. Journal of Cereal Science 2023, 112, 103728 10.1016/j.jcs.2023.103728. [DOI] [Google Scholar]