

Abstract
Background:
Olaparib is an inhibitor of the human poly-(ADP-ribose)-polymerase enzymes (PARP1/2) needed to repair single-strand DNA breaks. It is used in breast, ovarian, prostate and pancreatic cancer.
Objectives:
This work aimed to describe the pharmacokinetics/pharmacodynamics (PK/PD) relationship between olaparib plasma concentrations and common adverse effects (i.e. anaemia and hypercreatininaemia), in a real-life setting, to propose a target concentration for therapeutic drug monitoring.
Methods:
Two PK/PD models describing the evolution of haemoglobinaemia and creatininaemia as a function of time were developed, based on data from, respectively, 38 and 37 patients receiving olaparib. The final model estimates were used to calculate the incidence of anaemia and creatinine increase according to plasma trough concentrations for 1000 virtual subjects to define target exposure.
Results:
The final models correctly described the temporal evolution of haemoglobinaemia and creatininaemia for all patients. The haemoglobinaemia PK/PD model is inspired by Friberg’s model, and the creatininaemia PK/PD model is an indirect response model. Model parameters were in agreement with physiological values and close to literature values for similar models. The mean (population) plasma haemoglobin concentration at treatment initiation, as estimated by the model, was 11.62 g/dL, while creatinine concentration was 71.91 µmol/L. Using simulations, we have identified a target trough concentration of 3500–4000 ng/mL, above which more than 20% of patients would report grade ≥3 anaemia.
Conclusion:
Based on real-world data, we were able to properly describe the time course of haemoglobinaemia and plasma creatininaemia during olaparib treatment.
Keywords: anaemia, creatinine increase, modelling, olaparib, ovarian cancer, PK/PD
Introduction
Olaparib is an inhibitor of the catalytic activity of the human poly-(ADP-ribose)-polymerase enzymes (PARP1 and PARP2) needed to repair single-strand DNA breaks (SSB). It interferes with the DNA repair process and induces cancer cell death.1–5 Actually, six primary pathways of DNA damage response are identified. They are variably involved in dealing with double-strand DNA breaks (DSB) and single-strand DNA break damage from a variety of mechanisms of injury. To repair SSB, one way is base excision repair, which implies PARP 1 and 2 enzymes. Olaparib, by inhibiting PARP enzymes, causes the accumulation of SSB in the cell leading to an increase in DSB in DNA. Homologous recombination (HR) and nonhomologous end joining (NHEJ) recombination are the two major pathways responsible for repairing DSB. HR pathways become active in the S/G2 phase due to the availability of a sister chromatid, whereas NHEJ repairs DSB throughout all cell cycle phases except the M phase. NHEJ is faster than HR and mainly occurs in the G1 phase. Beyond the already-known proteins, such as Ku70/80, DNA-pharmacokinetics (PKcs), Artemis, DNA pol λ/μ, DNA ligase IV-XRCC4 and XLF, s proteins are involved in the NHEJ. Among them, MRI/CYREN has a dual role, as it stimulates NHEJ in the G1 phase of the cell cycle, while it inhibits the pathway in the S and G2 phases. Mutations in genes may lead to HR deficiency. Among them, BRCA1/2 mutations are the most frequent. 6 Olaparib is used in breast, ovarian, prostate and pancreatic cancer7–14 in case of mutations in the BRCA1/2 genes. PARP inhibition is not effective in healthy cells, because they can use the HR mechanism to repair DNA.4,5 It is only in cells with defects in HR, due to, for example, BRCA1 or 2 mutations, that PARP inhibitors are particularly effective.
The SOLO1 trial (5-year follow-up of a randomized, double-blind, placebo-controlled, phase III trial) in newly diagnosed advanced ovarian cancer showed a progression-free survival of 56 months with olaparib versus 13.8 months with placebo. 15 Beyond DNA repair mechanisms, other functions of PARP1 have been identified, notably its role in stimulating angiogenesis, thus contributing to tumour shrinkage. This is why it justifies the combination of PARP inhibitors with anti-angiogenic agents such as bevacizumab for the maintenance treatment of patients with advanced ovarian cancer.2,7,16 Other angiogenic pathways are studied such as the PI3K (phosphoinositide 3-kinase) pathway, which is frequently upregulated in epithelial ovarian cancer and plays an important role in cell survival, chemoresistance and preservation of genomic stability, as it is implicated in many processes of DNA replication and cell cycle regulation. The inhibition of the PI3K may lead to genomic instability through a decrease in the spindle assembly checkpoint protein Aurora kinase B activity and, consequently, an increase in the occurrence of lagging chromosomes during prometaphase. 17
The recommended dose for olaparib (tablet) is 300 mg twice daily. Currently, dosage adjustments are based on the occurrence of adverse events which implies a link between olaparib plasma concentrations and the onset of toxicities.18–20 The most common adverse events are anaemia (20% of grade 3 and 2% of grade 4), neutropenia (8% of grade 3 and <1% of grade 4), asthenia, nausea, vomiting, diarrhoea or blood creatinine increase. 19 Velev et al. 21 showed, based on ‘real-world’ data, a significant association between olaparib predicted through concentrations and the occurrence of adverse events, and identified an upper limit for residual concentration of 2500 ng/mL. Otherwise, at present, only one PK/pharmacodynamics (PD) study has investigated the relationship between olaparib plasma concentrations and the onset or progression of anaemia, 22 and no PK/PD model describing the relationship between olaparib and creatinine plasma concentrations has been developed.
This work aimed to describe the PK/PD relationships between olaparib concentrations and common adverse effects (i.e. anaemia and hypercreatininaemia), in a real-life setting, to propose therapeutic concentration targets.
Patients and methods
Our study methodology follows ESMO-GROW (Guidance for reporting oncology real world evidence) recommandation 23 (Supplemental Material).
Patient and sampling
Between March 2015 and December 2021, all consecutive patients treated with olaparib and who benefited from therapeutic drug monitoring (TDM) at the Georges-François Leclerc Center (Dijon Clinical Cancer Center) or in selected hospitals in the Paris area (cf. affiliation of investigators) were included in this retrospective study. TDM of olaparib was performed as part of routine clinical practice.
Data collection
Patients’ data were retrieved retrospectively from medical records. Patients with incomplete dosing history or insufficient PD data (minimum of three observations per patient over 3–6 months) were not included in the PK/PD analysis. A complete list of variables included in the study was disponible in Supplemental Material 1.
Analytical methods are detailed in Supplemental Material 2.
Population PK/PD model development
Pharmacokinetic/pharmacodynamic models
A population pharmacokinetic (popPK) model and two PK/PD models were developed to describe the relationships between olaparib plasma concentrations and haemoglobin and creatinine kinetics during the first 3 and 6 months of treatment, respectively (cf. Supplemental Material 3). PK and PD modelling were done sequentially, that is, individual pharmacokinetic parameters estimated using the popPK model for olaparib were used as individual constants (regressors in Monolix®) in the PK/PD models. The development of the popPK model is described in Supplemental Material 4.
Estimation model and software
To develop the popPK and the PK/PD models, a non-linear mixed effect modelling approach was used. For this step, Monolix® version 2023R1 software was used (Lixoft SAS, a Simulations Plus company, Antony, France). Population parameters were estimated using the Stochastic Approximation Expectation–Maximization (SAEM) algorithm. Inter-individual variability (IIV) was coded as follows: with the value of the individual parameter, the typical value of the population and η the random effect that follows a normal distribution centred on 0 and of standard deviation ω. All PD data were log-transformed. Covariate analysis is detailed in Supplemental Material 5.
Model evaluation
Selection of the final model was based on the comparison between model objective function values (OFV), relative standard error (RSE, i.e. precision) of parameter estimates and the associated IIV and graphical diagnostics.
Graphical diagnostics include observed versus population or individual predicted concentrations, prediction corrected visual predictive check (pcVPC) and the plot of normalized prediction distribution error as a function of time or population prediction concentrations.
Simulations
Based on the final PK/PD models, simulations were performed to identify olaparib trough concentration associated with an increased onset of anaemia ⩾.grade 3 and an increase in hypercreatininaemia superior to 20% than baseline at treatment instauration. Using Simulx2023R1® software (Lixoft SAS, Simulations Plus Company, Antony, France), 1000 simulations of changes in plasma haemoglobin and creatinine concentrations over 42 days for several residual concentrations (Cmin,ss) of olaparib (1000–7000 ng/mL) were carried out. The proportions of patients with grade 3 and grade 4 anaemia defined according to the CTCAE v5 (Common Terminology Criteria for Adverse Event) classification and of patients with plasma creatinine increase by more than 20% of the initial serum creatinine concentrations were calculated for each Cmin,ss level. To determine target concentrations, a threshold of 20% of patients presenting the adverse effect was chosen.
Results
Patients and data
Of the 87 patients for whom at least one olaparib plasma assay was available between July 2015 and December 2021, one was excluded because the time between the last olaparib intake and sampling was not reported. A total of 86 patients were included in the PK analysis, 38 in the PK/PD study for haemoglobin and 37 for creatinine (cf. Supplemental Material 6). Baseline patients’ characteristics are detailed in Table 1.
Table 1.
Patient characteristics.
| Population used to build the popPK model | Population used to build the haemoglobin model | Population used to build the creatinine model | |
|---|---|---|---|
| Value median (min–max) or number (%) |
Value median (min–max) or number (%) |
Value median (min–max) or number (%) |
|
| Number of patients | 86 | 38 | 37 |
| Patients’ characteristics at olaparib initiation | |||
| Sex | |||
| Male | 5 (5.8%) | 1 (2.7%) | 1 (2.7%) |
| Female | 81 (94.2%) | 36 (97.3%) | 36 (97.3%) |
| Age | 64.5 (28–89) | 64.5 (28–89) | 64.8 (28–89) |
| Weight (kg) | 56 (43–84) | 57.6 (43–84) | 57.6 (43–84) |
| Number of patients with missing data | 58 (67.4%) | 0 | 0 |
| Size (cm) | 159 (150–173) | 161 (150–173) | 161 (150–173) |
| Number of patients with missing data | 60 (69.8%) | 0 | 0 |
| Haemoglobin (g/dL) | 11.2 (8.6–13.6) | 11.3 (7.9–13.6) | 11.3 (7.9–13.6) |
| Number of patients with missing data | 31 (36%) | 0 | 0 |
| Creatinine (µmol/L) | 64 (38–125.7) | 71 (38–125.7) | 71 (38–125.7) |
| Number of patients with missing data | 33 (38.4%) | 0 | 0 |
| Bilirubin (µmol/L) | 7.1 (2.6–17.3) | 6.8 (2.6–17.3) | 6.8 (2.6–17.3) |
| Number of patients with missing data | 58 (67.4%) | 0 | 0 |
| ASAT (U/L) | 21 (6–55) | 23 (13–45) | 23 (13–45) |
| Number of patients with missing data | 40 (46.5%) | 0 | 0 |
| ALAT (U/L) | 14 (5–60) | 20 (5–44) | 20 (5–44) |
| Number of patients with missing data | 38 (44.2%) | 0 | 0 |
| GGT (U/L) | 30.5 (14–523) | 54 (14–229) | 54 (14–229) |
| Number of patients with missing data | 58 (67.44%) | 0 | 0 |
| ALP (U/L) | 76 (36–160) | 79 (36–160) | 79 (36–160) |
| Number of patients with missing data | 58 (67.4%) | 0 | 0 |
| ECOG | |||
| 0 | 11 (12.8%) | 7 (18.9%) | 7 (18.9%) |
| 1 | 31 (36%) | 16 (43.2%) | 17 (45.9%) |
| 2 | 8 (9.3%) | 4 (10.9%) | 4 (10.9%) |
| Unknown | 36 (41.9%) | 10 (27%) | 9 (24.3%) |
| Cancer characteristics at olaparib initiation | |||
| Mutation | |||
| BRCA1/2 | 80 (93%) | 35 (92.1%) | 34 (91.9%) |
| HRD+/BRCA− | 6 (7%) | 3 (7.9%) | 3 (8.1%) |
| Treatment line | |||
| 1 | 43 (50%) | 27 (72.9%) | 27 (72.9%) |
| 2 | 12 (13.9%) | 8 (21.7%) | 8 (21.7%) |
| 3 and + | 1 (1.16%) | 2 (5.4%) | 2 (5.4%) |
| Unknown | 30 (34.9%) | ||
| Type of primary cancer | |||
| Ovarian cancer | 67 (77.9%) | 30 (79%) | 31 (83.7%) |
| Breast cancer | 7 (8.3%) | 4 (10.5%) | 4 (10.9%) |
| Pancreas cancer | 1 (1.1%) | 1 (2.6%) | 1 (2.7%) |
| Prostate cancer | 2 (2.3%) | 0 (0%) | 0 (0%) |
| Unknown | 3 (3.5%) | 0 (0%) | 0 (0%) |
| Other | 6 (6.9%) | 3 (7.9%) | 1 (2.7%) |
| Metastatic at diagnosis | |||
| Yes | / | 7 (18.9%) | 8 (21.6%) |
| No | 30 (81.1%) | 29 (78.4%) | |
| Recurrence | |||
| Yes | / | 13 (35.2%) | 13 (35.2%) |
| No | 24 (64.8%) | 24 (64.8%) | |
| Olaparib treatment characteristics | |||
| Olaparib formulation | / | ||
| Capsule | 24 (28%) | / | |
| Tablet | 62 (72%) | ||
| Co-treatment (bevacizumab) | |||
| Yes | / | 9 (24.4%) | 9 (24.4%) |
| No | 28 (75.6%) | 28 (75.6%) | |
ALAT, alanine aminotransferase; ALP, alkaline phosphatase; ASAT, aspartate aminotransferase; BRCA, (BRCA1 and BRCA2) genes most frequently affected in hereditary breast and ovarian cancer; ECOG, eastern cooperative oncology group; GGT, gamma-glumatyltranspeptidase; HRD, homologous recombination deficiency ; popPK, population pharmacokinetic
Population PK model
Olaparib PK data were described using a one-compartment model with distinct first-order absorption kinetics for capsules and tablets, and a first-order elimination (Figure 1).
Figure 1.

Pharmacokinetic/pharmacodynamic model describing olaparib effect on haemoglobinaemia and creatininaemia.
Conc, olaparib concentration; Cl/F, olaparib apparent clearance; CREAT, compartment corresponding to the circulating creatinine; EDRUG, drug effect; γ, feedback mechanism; HB, compartment corresponding to the circulating haemoglobin; HB0, haemoglobin at time 0 in HB compartment; HBt, haemoglobin at time t in HB compartment; ka capsule, olaparib absorption constant for capsule formulation; ka tablet, olaparib absorption constant for tablet formulation; kHB, rate of elimination of haemoglobin from the systemic circulation; Kin, input rate of creatinine from the systemic circulation, Kout, rate of elimination of creatinine from the systemic circulation; kPROL, rate of stem cell proliferation; kTR, maturation rate; MTT, mean transit time; PROL, proliferation compartment; SlopeHB/CREAT, sensitivity to olaparib-induced anaemia or creatinine increase; V/F, olaparib apparent volume of distribution.
The residual error was described using a proportional model and was 39%. The final parameter estimates are summarized in Table 2.
Table 2.
Final olaparib population PK model parameter estimates.
| Parameter | Description | Final model without covariate | Final model | |||
|---|---|---|---|---|---|---|
| Estimate | RSE (%) | Estimate | RSE (%) | |||
| Fixe effect | Ka capsule pop | Absorption rate constant for capsule (h−1) | 0.71 | 17.3 | 0.598 | 17 |
| Ka tablet pop | Absorption rate constant for the tablet (h−1) | 1.28 | 10.4 | 1.17 | 9.76 | |
| Cl/Fpop | Apparent clearance (L/h) | 5.74 | 5.72 | 5.95 | 5.63 | |
| V/Fpop | Apparent volume of distribution (L) | 47.54 | 9.84 | 49.8 | 11.3 | |
| βCl-logt(Age) | Effect of age on Cl/F | / | / | −0.957 | 26.3 | |
| Random effect | IIVCL | Inter-individual variability in Cl/F (CV%) | 42.5 | 11.9 | 40.4 | 13.4 |
| IIVV | Inter-individual variability in V/F (CV%) | 32.3 | 30.2 | 25 | 52.8 | |
| Residual error | B | Proportional error | 0.39 | 7.22 | 0.404 | 7.08 |
| OFV | Objective function value | 752.1 | 741.99 | |||
IIV is given by the coefficient of variation (CV in %), which is equal to CV = ω being the standard deviation of the random effect.
CV, coefficient of variation; IIV, inter-individual variability; PK, pharmacokinetics.
Age was the only covariate significantly associated with apparent clearance (CL/F). CL/F decreases by 1.08% each year. The model was validated using model diagnostics such as the result of pcVPC [Figure 2(a)] showing that the 5th, 50th and 95th percentiles of the observed concentrations were within the 95% confidence interval of the predicted concentration, demonstrating the accuracy and adaptability of the model (cf. Supplemental Material 4).
Figure 2.

Prediction corrected visual predictive checks based on 1000 simulations of study design. (a) pcVPC of olaparib concentrations for the final popPK model. (b) pcVPC of haemoglobin concentrations for the final PK/PD model. (c) pcVPC of creatinine concentrations for the final PK/PD model. Dark dots represent the observed data. The dark red area represents a deviation of the model predictions from mimicking the observed data. Solid lines refer to the median, 10th and 90th percentiles of observed data. The dark grey area is the median 90% confidence interval and light grey areas are the 90% confidence interval for the 10th and 90th percentiles of the model predictions.
pcVPC, prediction corrected visual predictive check; PD, pharmacodynamics; PK, pharmacokinetics; popPK, population pharmacokinetic.
PK/PD model
Haemoglobin model
The most relevant model is the one developed based on Friberg’s model with a linear drug effect (Figure 1). Because of convergence issues, mean transit time (MTT) was fixed to the physiological value of red cell maturation (5 days or 120 h). 24 All the parameters were estimated with relatively low RSE values (below 50%) and are presented in Table 3.
Table 3.
Final population haemoglobin PK/PD models parameter estimates.
| Parameter | Description | Final model | ||
|---|---|---|---|---|
| Estimate | RSE (%) | |||
| Fixed effect | HB0pop | Baseline haemoglobin value (g/dL) | 11.62 | 1.35 |
| MTTpop | Mean transit time (h) | 120 (Fixed) | ||
| SLOPEHBpop | Slope of the sensitivity to olaparib-induced anaemia (L/mg) | 0.00056 | 30.3 | |
| γpop | Feedback effect on the proliferation process | 0.027 | 43.2 | |
| Random effect | IIVHB0 | Inter-individual variability in HB0 (CV %) | 5.54 | 22.6 |
| IIVSLOPE_HB | Inter-individual variability in SLOPE_HB (CV %) | 124.26 | 23.1 | |
| Residual error | B | Proportional error | 0.097 | 5.28 |
| OFV | Objective function value | 759.17 | ||
IIV is given by the CV (in %), which is equal to CV = ω being the standard deviation of the random effect.
CV, coefficient of variation; IIV, inter-individual variability; OFV, objective function value; PD, pharmacodynamics; PK, pharmacokinetics; RSE, relative standard error.
Regarding covariates, ‘type of cancer’ (ovarian cancer versus breast and pancreatic cancers) was the only significant covariate associated with HB0, resulting in a drop in OFV of 20.61 points compared to the base model, whereas the IIV of the HB0 parameter dropped by 0.76%. However, this impact was not retained as clinically significant. Graphical diagnostics of the final haemoglobinaemia model are presented in Supplemental Material 7. Overall, the model showed acceptable goodness of fits and no model misspecification could be observed. The pcVPC [Figure 2(b)] showed that the 5th, 50th and 95th percentiles of the observed haemoglobin concentrations are within the 95% confidence interval of the predicted concentration, allowing us to validate the final model.
Creatinine model
An indirect response model was used to describe creatinine kinetics (Figure 1). The parameters estimated by Monolix® are presented in Table 4.
Table 4.
Final population creatininaemia PK/PD model parameter estimates.
| Parameter | Description | Final model | ||
|---|---|---|---|---|
| Estimate | RSE (%) | |||
| Fixed effect | CREAT0 pop | Baseline value creatininaemia (µmol/L) | 71.91 | 4.10 |
| KOUT pop | Elimination rate constant of creatinine (h−1) | 0.0011 | 55.9 | |
| SLOPECREATpop | Slope of the sensitivity to olaparib-induced hypercreatininaemia (L/mg) | 0.041 | 19.6 | |
| Random effect | IIVCREAT_0 | Inter-individual variability in CREAT0 | 0.23 | 37.6 |
| IIVKOUT | Inter-individual variability in KOUT | 1.1 | 12.3 | |
| IIVSLOPE_CREAT | Inter-individual variability in SLOPECREAT | 0.48 | 29.2 | |
| Residual error | B | Proportional error | 0.1 | 4.93 |
| OFV | Objective function value | 2118.79 | ||
IIV is given by the CV (in %), which is equal to: CV = ω being the standard deviation of the random effect.
CV, coefficient of variation; IIV, inter-individual variability; OFV, objective function value; PD, pharmacodynamics; PK, pharmacokinetics; RSE, relative standard error.
Regarding covariates, no significant covariate was found.
Final model diagnostics are presented in Supplemental Material 8 and showed no major model misspecifications. Figure 2(c) presents the pcVPC of the final creatininaemia model which showed that the 5th, 50th and 95th percentiles of the observed creatinine concentrations were within the 95% confidence interval of the predicted concentration, further validating the model.
Simulation
Figure 3 presents the incidence of grade 3 or 4 anaemia at the nadir or the incidence of blood creatinine increase superior to 20% from baseline according to Cmin,ss. These results show that 20% of simulated patients with Cmin,ss between 3500 and 4000 ng/mL developed grade 3/4 anaemia.
Figure 3.
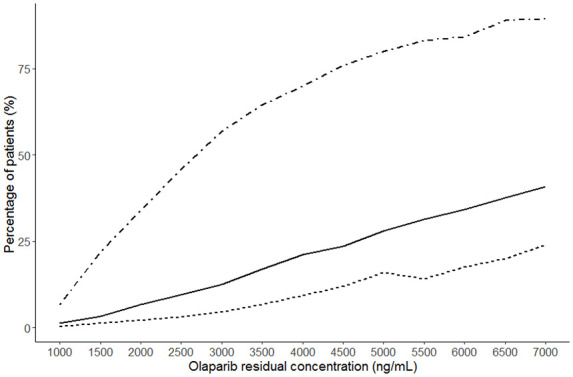
Risk of grade 3 or grade 3/4 anaemia and creatinine increase superior to 20% from baseline depending on the residual concentration at steady-state. Thousand simulations of haemoglobinaemia and creatininaemia kinetics were simulated at every Cmin,ss to 0 at 7000 ng/mL. The dotted line represents an increase in creatinine of more than 20% from baseline. Solid line represents ≥ grade 3 anaemia. The dashed line represents grade 4 anaemia.
Discussion
Nowadays, the maximum tolerated dose or the one just below is generally the dose used to treat patients. 25 However, in clinical trials, patients are selected based on numerous inclusion criteria that are not representative of the general population, thus limiting the generalizability of the chosen dose. In addition, a high IIV is observed with oral antineoplastic agents leading to large differences in plasma drug exposure. 26 Olaparib is no exception to this variability1,20 which means that the approved dose may lead to plasma sub-therapeutic exposure in some patients, leading to loss of efficacy, whereas others will present supra-therapeutic plasma concentrations with risks of toxicities. Anaemia is one of the most common side effects of olaparib with more than 20% of grade ≥3.27,28 This severe side effect can then lead to a discontinuation or an interruption of the treatment which could be deleterious for the patient. It is necessary to develop tools to predict these toxicities and be able to anticipate them to avoid them. Studying the kinetics of haemoglobinaemia and creatininaemia during olaparib treatment can help to better understand the exposure–toxicity relationships. For the first time, we have described the evolution of haemoglobinaemia and creatininaemia in patients treated with olaparib, using PK and PD models. The long follow-up of patients, 3 months for haemoglobin and 6 months for creatinine, has enabled us to understand and describe the entire phenomena observed.
Our models are semi-physiological, with estimated parameters conforming to physiological values. Indeed, for haemoglobin, HB0, which represents the baseline haemoglobin concentration at the start of treatment, is equal to 11.62 g/dL, which is slightly lower than physiological values, but this can be explained by the fact that for some of our patients, olaparib is not the first line of treatment. Baseline creatininaemia (71.91 µmol/L) is also consistent with the physiological range. Concerning creatinine, the historical marker of choice for assessing renal function, it is now known that it is partly secreted in the kidney by the organic cation transporter 2 (OCT2) and the multidrug and toxin extrusion proteins MATE 1 and MATE2-K.29,30 Studies have shown that olaparib is an inhibitor of the OCT2 transporter and the MATE 1 and MATE2K extrusion proteins, and is therefore involved in tubular creatinine secretion.1,29 Thus, the increase in blood creatinine observed with olaparib could be related to the inhibition of renal transporters by the drug. With our model, which is semi-physiological, we have succeeded in capturing this mechanism of inhibition. Nowadays, however, it is impossible to distinguish, based on a single plasma creatinine assay, the part of creatininaemia increases due to renal transporter inhibition and impaired renal function. Another endogenous marker, cystatin C, can also be used to assess renal function. It is freely filtered by the glomerulus, completely reabsorbed and metabolized by proximal tubule cells, is not secreted by renal transporters and is unaffected by age, sex, changes in diet or muscle mass, unlike creatinine.31,32 A study by Bruin et al. concluded that an alternative renal marker such as cystatin C should be used to accurately calculate glomerular filtration rate in patients taking olaparib, 29 as this assay would discriminate the portion of the increase in blood creatinine due to inhibition of renal transporters or impairment of glomerular filtration. It would therefore be interesting to set a threshold for the increase in creatinine in relation to the initial value, above which it could be said that it is very strongly a question of impaired renal function and not only an effect of olaparib on the transporters. Future investigations should address this issue. Based on our models and simulations, we identified a minimum target olaparib plasma concentration of 3500–4000 ng/mL, above which more than 20% of patients would develop grade 3 and/or 4 anaemia. In the study by Velev et al., a minimum concentration of 2500 ng/mL was associated with a higher risk of developing serious adverse events. 21 We believe that the difference in target concentrations is due to the inclusion of all types of grade 3 adverse events in the Velev study. In a preliminary analysis of our data, we found no association between the onset of asthenia and olaparib exposure (data not shown), which may suggest that the inclusion of this adverse event in the study may lower the target concentration.
Today, for PARP inhibitors, and especially olaparib, there is no real target range to predict efficacy and toxicity. Currently, it is the concentrations obtained in clinical trials which are used. Very few real-life studies have been carried out, which is why our study, and more specifically the determination of a minimum target concentration beyond which more than 20% of patients would present a grade ⩾3 anaemia, will enable us to refine the recommendations that will be made within the framework of TDM in routine clinical practice.
Our study has its limitations, as it involves a small number of patients and is a retrospective study, which complicates the collection of all data. Finally, our study focused on the relationship between olaparib exposure and toxicity, while efficacy data were not available. The PK/PD relationship for olaparib efficacy should be further investigated to establish a minimum efficacy concentration threshold to guide individual dose adjustments based on both efficacy and toxicity thresholds.
Conclusion
Two PK/PD models describing the evolution of haemoglobinaemia and creatinaemia as a function of time, based on real-life data, have been developed. These models have helped us to define target concentrations (3500–4000 ng/mL) of olaparib to prevent the risk of anaemia which could be used to guide individual dose adjustment. Further studies should investigate the link between olaparib plasma exposure and increased serum creatinine and cystatin C levels to determine a concentration threshold linked to the onset of renal failure.
Supplemental Material
Supplemental material, sj-docx-1-tam-10.1177_17588359241248328 for Improving olaparib exposure to optimize adverse effects management by Marylise Sterlé, Alicja Puszkiel, Chloé Burlot, Eva Pereira, Audrey Bellesoeur, Sixtine De Percin, Guillaume Beinse, Jean-David Fumet, Laure Favier, Julie Niogret, Benoit Blanchet, Bernard Royer, Leïla Bengrine-Lefevre and Antonin Schmitt in Therapeutic Advances in Medical Oncology
Acknowledgments
None.
Footnotes
ORCID iDs: Marylise Sterlé  https://orcid.org/0009-0000-0645-8934
Chloé Burlot
https://orcid.org/0000-0001-9779-6591
Antonin Schmitt
https://orcid.org/0000-0002-3132-7730
Supplemental material: Supplemental material for this article is available online.
Contributor Information
Marylise Sterlé, Pharmacy Department, Centre Georges-François Leclerc, Dijon, France; INSERM U1231, University of Burgundy Franche-Comté, Dijon, France; Groupe de Pharmacologie Clinique Oncologique GPCO, Paris, France.
Alicja Puszkiel, Biologie du Médicament – Toxicologie, Hôpital Cochin, Assistance Publique-Hôpitaux de Paris, Paris, France; Université Paris Cité, UMR-S1144, Paris, France; Groupe de Pharmacologie Clinique Oncologique GPCO, Paris, France.
Chloé Burlot, Pharmacy Department, Centre Georges-François Leclerc, Dijon, France; INSERM U1231, University of Burgundy Franche-Comté, Dijon, France; Groupe de Pharmacologie Clinique Oncologique GPCO, Paris, France.
Eva Pereira, Biologie du Médicament – Toxicologie, Hôpital Cochin, Assistance Publique-Hôpitaux de Paris, Paris, France.
Audrey Bellesoeur, Institut Curie, Département d’Oncologie Médicale, Paris, France; Institut Curie, Département de Radio-Pharmacologie, Saint-Cloud, France; Groupe de Pharmacologie Clinique Oncologique GPCO, Paris, France.
Sixtine De Percin, Oncology Department, Cochin Hospital (AP-HP), CARPEM, Paris, France.
Guillaume Beinse, Oncology Department, Cochin Hospital (AP-HP), CARPEM, Paris, France; Cordeliers Research Center, Paris-Sorbonne University, INSERM, Team Personalized Medicine, Pharmacogenomics and Therapeutic Optimization, Paris, France.
Jean-David Fumet, Oncology Department, Centre Georges-François Leclerc, INSERM U1231, UFR des Sciences de Santé, Dijon, France.
Laure Favier, Oncology Department, Centre Georges-François Leclerc, INSERM U1231, UFR des Sciences de Santé, Dijon, France.
Julie Niogret, Oncology Department, Centre Georges-François Leclerc, INSERM U1231, UFR des Sciences de Santé, Dijon, France.
Benoit Blanchet, Biologie du Médicament – Toxicologie, Hôpital Cochin, Assistance Publique-Hôpitaux de Paris, Paris, France; Groupe de Pharmacologie Clinique Oncologique GPCO, Paris, France.
Bernard Royer, Pharmacology and Toxicology Laboratory, CHRU Besançon, Besançon, France; Groupe de Pharmacologie Clinique Oncologique GPCO, Paris, France.
Leïla Bengrine-Lefevre, Oncology Department, Centre Georges-François Leclerc, INSERM U1231, UFR des Sciences de Santé, Dijon, France.
Antonin Schmitt, Pharmacy Department, Centre Georges-François Leclerc, 1 rue Pr Marion, Dijon 21079, France; INSERM U1231, University of Burgundy Franche-Comté, Dijon, France; Groupe de Pharmacologie Clinique Oncologique GPCO, France.
Declarations
Ethics approval and consent to participate: According to French legislation, retrospective studies do not require an ethical committee authorization but have to be compliant with the CNIL (‘Commission Nationale de l’Informatique et des Libertés’) guidelines. As appropriate, patients did not object to the use of their data.
Consent for publication: Consent is not required.
Author contributions: Marylise Sterlé: Conceptualization; Data curation; Formal analysis; Methodology; Supervision; Writing – original draft.
Alicja Puszkiel: Investigation; Writing – review & editing.
Chloé Burlot: Investigation; Writing – review & editing.
Eva Pereira: Investigation; Writing – review & editing.
Audrey Bellesoeur: Investigation; Writing – review & editing.
Sixtine De Percin: Investigation; Writing – review & editing.
Guillaume Beinse: Investigation; Writing – review & editing.
Jean-David Fumet: Investigation; Writing – review & editing.
Laure Favier: Investigation; Writing – review & editing.
Julie Niogret: Investigation; Writing – review & editing.
Benoit Blanchet: Investigation; Writing – review & editing.
Bernard Royer: Investigation; Writing – review & editing.
Leïla Bengrine-Lefevre: Investigation; Writing – review & editing.
Antonin Schmitt: Conceptualization; Supervision; Writing – original draft.
Funding: The authors disclosed receipt of the following financial support for the research, authorship and/or publication of this article: This research, as part of the STARTER-BFC platform, was funded by ‘Agence Régionale de Santé Bourgogne-Franche-Comté’ and ‘Omedit Bourgogne–Franche-Comté’.
A.S. received a travel grant from AstraZeneca and MSD. A.P. received speaking fees from Bristol Myers Squibb, Pierre Fabre Oncology and EISAI. All the other authors have no conflict of interest.
Availability of data and materials: Upon request.
References
- 1. Bruin MAC, Sonke GS, Beijnen JH, et al. Pharmacokinetics and pharmacodynamics of PARP inhibitors in oncology. Clin Pharmacokinet 2022; 61: 1649–1675. [DOI] [PMC free article] [PubMed] [Google Scholar]
- 2. Konstantinopoulos PA, Matulonis UA. PARP inhibitors in ovarian cancer: a trailblazing and transformative journey. Clin Cancer Res 2018; 24: 4062–4065. [DOI] [PubMed] [Google Scholar]
- 3. Eberst L, Brahmi M, Cassier PA. Nouvelles perspectives dans le ciblage thérapeutique de la réparation de l’ADN. Bull Cancer (Paris) 2017; 104: 988–998. [DOI] [PubMed] [Google Scholar]
- 4. Cook SA, Tinker AV. PARP inhibitors and the evolving landscape of ovarian cancer management: a review. BioDrugs 2019; 33: 255–273. [DOI] [PubMed] [Google Scholar]
- 5. Ohmoto A, Yachida S. Current status of poly(ADP-ribose) polymerase inhibitors and future directions. OncoTargets Ther 2017; 10: 5195–5208. [DOI] [PMC free article] [PubMed] [Google Scholar]
- 6. Boussios S, Rassy E, Moschetta M, et al. BRCA mutations in ovarian and prostate cancer: bench to bedside. Cancers 2022; 14: 3888. [DOI] [PMC free article] [PubMed] [Google Scholar]
- 7. Arora S, Balasubramaniam S, Zhang H, et al. FDA approval summary: olaparib monotherapy or in combination with bevacizumab for the maintenance treatment of patients with advanced ovarian cancer. Oncologist 2021; 26: e164–e172. [DOI] [PMC free article] [PubMed] [Google Scholar]
- 8. Ray-Coquard I, Pautier P, Pignata S, et al. Olaparib plus bevacizumab as first-line maintenance in ovarian cancer. N Engl J Med 2019; 381: 2416–2428. [DOI] [PubMed] [Google Scholar]
- 9. Cecere SC, Giannone G, Salutari V, et al. Olaparib as maintenance therapy in patients with BRCA 1–2 mutated recurrent platinum sensitive ovarian cancer: real world data and post progression outcome. Gynecol Oncol 2020; 156: 38–44. [DOI] [PubMed] [Google Scholar]
- 10. Tutt ANJ, Garber JE, Kaufman B, et al. Adjuvant olaparib for patients with BRCA1- or BRCA2-mutated breast cancer. N Engl J Med 2021; 384: 2394–2405. [DOI] [PMC free article] [PubMed] [Google Scholar]
- 11. Robson M, Im S-A, Senkus E, et al. Olaparib for metastatic breast cancer in patients with a germline BRCA mutation. N Engl J Med 2017; 377: 523–533. [DOI] [PubMed] [Google Scholar]
- 12. de Bono J, Mateo J, Fizazi K, et al. Olaparib for metastatic castration-resistant prostate cancer. N Engl J Med 2020; 382: 2091–2102. [DOI] [PubMed] [Google Scholar]
- 13. Sabouret A, Beuzeboc P. Nouvelles AMM : olaparib en combinaison à l’abiratérone dans le cancer de la prostate métastatique résistant à la castration. Bull Cancer (Paris) 2023; 110: 339–341. [DOI] [PubMed] [Google Scholar]
- 14. Hilmi M, Neuzillet C. Nouvelle AMM : olaparib – cancer du pancréas avec mutation germinale de BRCA. Bull Cancer (Paris) 2020; 107: 961–962. [DOI] [PubMed] [Google Scholar]
- 15. Banerjee S, Moore KN, Colombo N, et al. Maintenance olaparib for patients with newly diagnosed advanced ovarian cancer and a BRCA mutation (SOLO1/GOG 3004): 5-year follow-up of a randomised, double-blind, placebo-controlled, phase 3 trial. Lancet Oncol 2021; 22: 1721–1731. [DOI] [PubMed] [Google Scholar]
- 16. Ray-Coquard I, Leary A, Pignata S, et al. Olaparib plus bevacizumab first-line maintenance in ovarian cancer: final overall survival results from the PAOLA-1/ENGOT-ov25 trial. Ann Oncol 2023; 34: 681–692. [DOI] [PubMed] [Google Scholar]
- 17. Aliyuda F, Moschetta M, Ghose A, et al. Advances in ovarian cancer treatment beyond PARP inhibitors. Curr Cancer Drug Targets 2023; 23: 433–446. [DOI] [PubMed] [Google Scholar]
- 18. Summary of product characteristics – lynparza 150 mg. https://www.ema.europa.eu/en/documents/product-information/lynparza-epar-product-information_en.pdf (accessed 22 April 2024). [Google Scholar]
- 19. Pujade-Lauraine E, Ledermann JA, Selle F, et al. Olaparib tablets as maintenance therapy in patients with platinum-sensitive, relapsed ovarian cancer and a BRCA1/2 mutation (SOLO2/ENGOT-Ov21): a double-blind, randomised, placebo-controlled, phase 3 trial. Lancet Oncol 2017; 18: 1274–1284. [DOI] [PubMed] [Google Scholar]
- 20. Pilla Reddy V, Bui K, Scarfe G, et al. Physiologically based pharmacokinetic modeling for olaparib dosing recommendations: bridging formulations, drug interactions, and patient populations. Clin Pharmacol Ther 2019; 105: 229–241. [DOI] [PMC free article] [PubMed] [Google Scholar]
- 21. Velev M, Puszkiel A, Blanchet B, et al. Association between olaparib exposure and early toxicity in BRCA-mutated ovarian cancer patients: results from a retrospective multicenter study. Pharmaceuticals 2021; 14: 804. [DOI] [PMC free article] [PubMed] [Google Scholar]
- 22. Zhou D, Li J, Learoyd M, et al. Efficacy and safety exposure-response analyses of olaparib capsule and tablet formulations in oncology patients. Clin Pharmacol Ther 2019; 105: 1492–1500. [DOI] [PubMed] [Google Scholar]
- 23. Castelo-Branco L, Pellat A, Martins-Branco D, et al. ESMO guidance for reporting oncology real-world evidence (GROW). ESMO Real World Data Digit Oncol 2023; 1: 100003. [DOI] [PubMed] [Google Scholar]
- 24. Skadberg O, Brun A, Sandberg S. Human reticulocytes isolated from peripheral blood: maturation time and hemoglobin synthesis. Lab Hematol 2023; 9: 198–206. [PubMed] [Google Scholar]
- 25. Le Tourneau C, Lee JJ, Siu LL. Dose escalation methods in phase I cancer clinical trials. J Natl Cancer Inst 2009; 101: 708–720. [DOI] [PMC free article] [PubMed] [Google Scholar]
- 26. Mueller-Schoell A, Groenland SL, Scherf-Clavel O, et al. Therapeutic drug monitoring of oral targeted antineoplastic drugs. Eur J Clin Pharmacol 2021; 77: 441–464. [DOI] [PMC free article] [PubMed] [Google Scholar]
- 27. DiSilvestro P, Banerjee S, Colombo N, et al. Overall survival with maintenance olaparib at a 7-year follow-up in patients with newly diagnosed advanced ovarian cancer and a BRCA mutation: the SOLO1/GOG 3004 trial. J Clin Oncol 2023; 41: 609–617. [DOI] [PMC free article] [PubMed] [Google Scholar]
- 28. Poveda A, Floquet A, Ledermann JA, et al. Olaparib tablets as maintenance therapy in patients with platinum-sensitive relapsed ovarian cancer and a BRCA1/2 mutation (SOLO2/ENGOT-Ov21): a final analysis of a double-blind, randomised, placebo-controlled, phase 3 trial. Lancet Oncol 2021; 22: 620–631. [DOI] [PubMed] [Google Scholar]
- 29. Bruin MAC, Korse CM, van Wijnen B, et al. A real or apparent decrease in glomerular filtration rate in patients using olaparib? Eur J Clin Pharmacol 2021; 77: 179–188. [DOI] [PMC free article] [PubMed] [Google Scholar]
- 30. McCormick A, Swaisland H. In vitro assessment of the roles of drug transporters in the disposition and drug–drug interaction potential of olaparib. Xenobiotica Fate Foreign Compd Biol Syst 2017; 47: 903–915. [DOI] [PubMed] [Google Scholar]
- 31. Dharnidharka VR, Kwon C, Stevens G. Serum cystatin C is superior to serum creatinine as a marker of kidney function: a meta-analysis. Am J Kidney Dis 2002; 40: 221–226. [DOI] [PubMed] [Google Scholar]
- 32. Tenstad O, Roald AB, Grubb A, et al. Renal handling of radiolabelled human cystatin C in the rat. Scand J Clin Lab Invest 1996; 56: 409– 414. [DOI] [PubMed] [Google Scholar]
Associated Data
This section collects any data citations, data availability statements, or supplementary materials included in this article.
Supplementary Materials
Supplemental material, sj-docx-1-tam-10.1177_17588359241248328 for Improving olaparib exposure to optimize adverse effects management by Marylise Sterlé, Alicja Puszkiel, Chloé Burlot, Eva Pereira, Audrey Bellesoeur, Sixtine De Percin, Guillaume Beinse, Jean-David Fumet, Laure Favier, Julie Niogret, Benoit Blanchet, Bernard Royer, Leïla Bengrine-Lefevre and Antonin Schmitt in Therapeutic Advances in Medical Oncology