Abstract
Impaired redox metabolism is a key contributor to the etiology of many diseases, including primary mitochondrial disorders, cancer, neurodegeneration, and aging. However, mechanistic studies of redox imbalance remain challenging due to limited strategies that can perturb redox metabolism in various cellular or organismal backgrounds. Most studies involving impaired redox metabolism have focused on oxidative stress; consequently, less is known about the settings where there is an overabundance of NADH reducing equivalents, termed reductive stress. Here, we introduce a soluble transhydrogenase from E. coli (EcSTH) as a novel genetically encoded tool to promote reductive stress in living cells. When expressed in mammalian cells, EcSTH, and a mitochondrially-targeted version (mitoEcSTH), robustly elevated the NADH/NAD+ ratio in a compartment-specific manner. Using this tool, we determined that metabolic and transcriptomic signatures of the NADH reductive stress are cellular background specific. Collectively, our novel genetically encoded tool represents an orthogonal strategy to promote reductive stress.
Keywords: genetically encoded tools, NADH/NAD+, NADPH/NADP+, reductive stress, cellular metabolism, mitochondrial biology
INTRODUCTION:
The driving force for many critical metabolic reactions is provided by two pyridine nucleotide coenzymes: NAD(H) and NADP(H) (1–3). The redox potentials of the NADH/NAD+ and NADPH/NADP+ coenzyme couples are derived from the concentrations of their oxidized and reduced forms, which is in turn linked to concentrations of reactants and products of metabolic reactions they participate in. The NADH/NAD+ pool is maintained with a surplus of oxidized NAD+. In contrast, the NADPH/NADP+ pool is maintained with a surplus of reduced NADPH. The large excess of NADPH supports numerous biosynthetic and antioxidant reactions as well as ROS-producing NADPH oxidases.
In recent years, oxidative stress has been widely studied, and we have previously reported the development of genetic tools that can be expressed in mammalian cells to induce a pro-oxidative stress through the depletion of NADH (4) or NADPH (5), respectively. Of equal or greater physiological importance are circumstances that result in an overabundance of reducing equivalents, as seen with mitochondrial dysfunction, oxygen limitation, over-nutrition or aging. However, strategies to create reductive stress in cellular or organismal models have remained limited (6, 7). Two methods to generate NADH reductive stress (defined as an elevated NADH/NAD+ ratio) are pharmacological inhibition of the electron transport chain (ETC) and ethanol supplementation. But ETC inhibition pharmacologically precludes studies of reductive stress in the context of an intact oxidative phosphorylation and mitochondrial ATP generation. Ethanol supplementation promotes reductive stress through the action of cytosolic alcohol dehydrogenases (ADHs) that convert ethanol and NAD+ to acetaldehyde and NADH; mitochondrial aldehyde dehydrogenases (ALDHs) can further contribute to NADH production by converting acetaldehyde and NAD+ to acetate and NADH (8). In a recent study, alcohol supplementation was used in mice to show that an elevated hepatic NADH/NAD+ ratio is linked to increased levels of 2-hydroxybutyrate (2HB), a biomarker of reductive stress associated with multiple human pathologies, including mitochondrial disorders and impaired glucose tolerance (9–12). Although ethanol effectively increases the NADH/NAD+ ratio, produced acetaldehyde and acetate each have independent metabolic fates that are potentially confounding, in addition; ethanol supplementation depends on expression levels of multiple ADHs and ALDHs (13).
Previous attempts to generate reductive stress using genetic tools have primarily been the overexpression of glucose-6-phosphate dehydrogenase (G6PD), to elevate NADPH levels, and expression of a point mutant of αB-crystallin, to elevate GSH levels (6). We turned our attention to bacterial soluble transhydrogenases (STHs) that catalyze the interconversion of NAD+ + NADPH to NADH + NADP+ (Fig. 1a). STH enzymes have been previously used in multiple metabolic engineering applications in bacteria and yeast because of their ability to shuttle reducing equivalents between NADH and NADPH pools (14–17). In this respect, STHs possess several major advantages: i). they are soluble enzymes (unlike mitochondrial NNT); ii). they do not require additional co-substrates and therefore do not produce or consume metabolites outside the pyridine nucleotide coenzyme couples; iii). they are expected to operate in the direction of NADH overproduction when ectopically expressed in mammalian cells because of the inherently reduced NADP pool.
Figure 1. Screening of bacterial soluble transhydrogenases (STHs) for their ability to elevate NADH levels in mammalian cells.
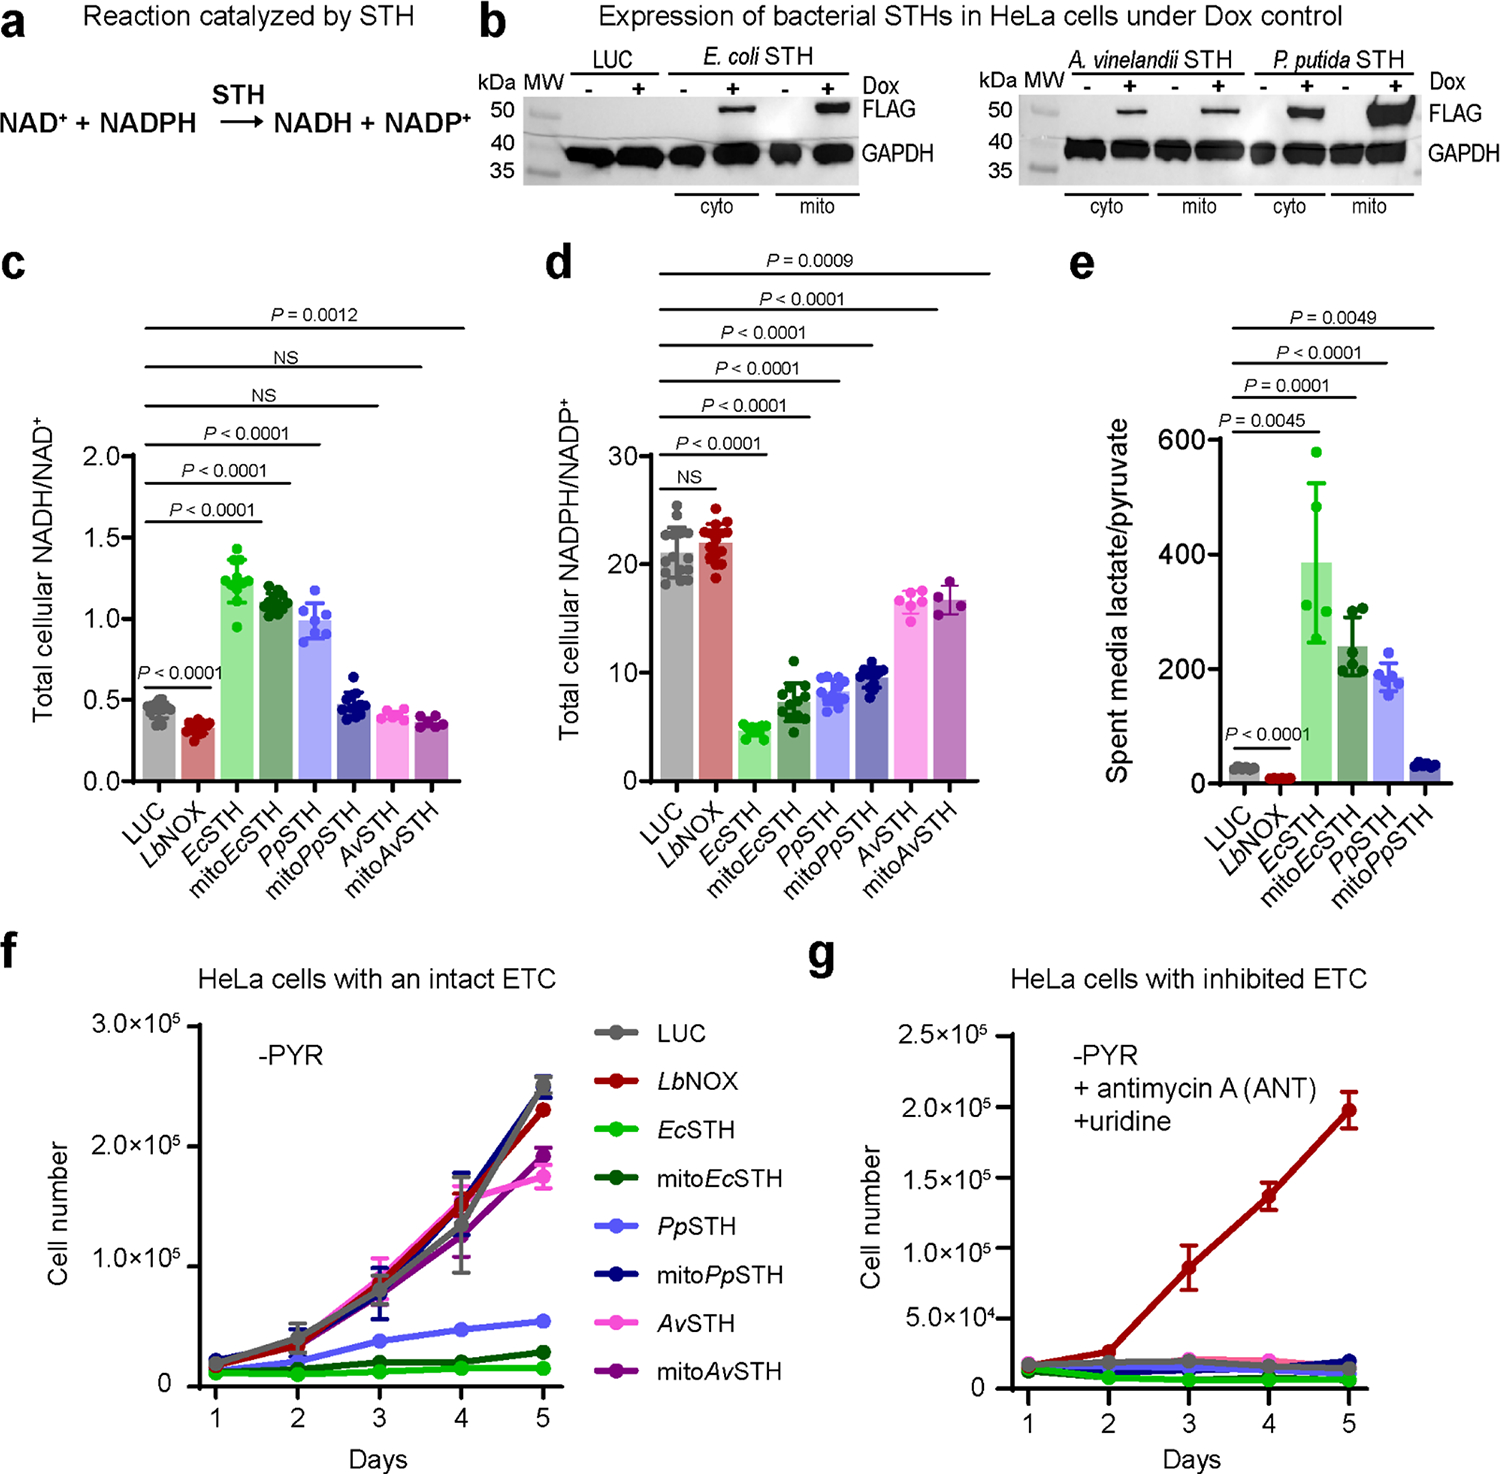
(a) The reaction catalyzed by a soluble transhydrogenase (STH). (b) Western blot analysis of HeLa cells expressing untargeted (cyto) and mitochondrially targeted (mito) bacterial STHs from E. coli, A. vinelandii, and P. putida with a C-terminal FLAG tag under doxycycline (Dox) control. Representative blots are shown. The total cellular NADH/NAD+ (c) and NADPH/NADP+ (d) ratios measured in HeLa cells expressing untargeted and mitochondrially targeted STHs from E. coli, P. putida, and A. vinelandii. (e) The lactate/pyruvate ratio measured in pyruvate-free DMEM+dFBS media, which was incubated for 3 hours with HeLa cells expressing untargeted and mitochondrially targeted STHs from E. coli and P. putida. (f) The effect of expression of untargeted and mitochondrially targeted STHs from E. coli, P. putida, and A. vinelandii on proliferation in pyruvate-free (-PYR) DMEM+dFBS. (g) The same as in (f) but in the presence of 1 μM antimycin A (ANT) and 200 μM uridine. Luciferase (LUC) and L. brevis water-forming NADH oxidase (LbNOX) expressing HeLa cells were used as controls in (b-g). Values are mean ± s.d.; n = 15, 15, 11, 12, 7, 12, 6, 6 in (c), n = 15, 15, 11, 12, 12, 12, 6, 4 in (d), n = 6, 6, 5, 6, 6, 6 in (e) biologically independent samples. Statistically significant differences were calculated by using a Welch ANOVA followed by unpaired t test. NS, no significant difference. For growth curves (f-g), error bars represent mean ± s.d.; n = 3 biologically independent samples.
Here we introduce a soluble transhydrogenase from E. coli (EcSTH) as a novel genetically encoded tool to elevate the NADH/NAD+ ratio and induce reductive stress in mammalian cells. We show that EcSTH expression robustly increases the cellular NADH/NAD+ ratio at the expense of NADPH. Using both untargeted and mitochondrially targeted EcSTH, we characterize metabolomic and transcriptomic signatures of the NADH reductive stress in mammalian cells. We also demonstrate that overproduction of NADH leads to the antiproliferative effect that is dependent on the cellular background. In addition, we confirm using both cell culture and in vivo experiments in mice that elevated GDF15 expression is a biomarker of the NADH reductive stress (18). Together, these data present a new strategy to produce a pro-reductive shift with temporal and spatial resolution. We anticipate that our new tool will be useful for investigating redox metabolism in various cellular and organismal contexts and disease states, including aging-associated metabolic changes.
RESULTS:
Bacterial STHs modulate reductive stress in mammalian cells
We screened three bacterial soluble transhydrogenases (from Escherichia coli, Azotobacter vinelandii, and Pseudomonas putida) for their ability to modulate the NADH/NAD+ ratio when expressed in mammalian cells. STH constructs which included a C-terminal FLAG tag, with or without a mitochondrial targeting sequence, were expressed in HeLa cells under a doxycycline (Dox)-inducible promoter (Fig. 1b). Our experiments were performed in pyruvate-free DMEM supplemented with dialyzed FBS (DMEM+dFBS) to ensure exogenous pyruvate was not available to rebalance the cytosolic NADH/NAD+ ratio via lactate dehydrogenase (LDH)-mediated conversion of pyruvate to lactate. We observed that total cellular NADH/NAD+ ratios were elevated by the expression of the EcSTH, mitoEcSTH, and PpSTH constructs (Fig. 1c, Supplementary Fig. 1a–c). We hypothesized that the high NADPH/NADP+ ratio in mammalian cells would drive bacterial STHs exclusively in the direction of NADH production. In support of this, we observed a decrease in the whole cell NADPH/NADP+ ratio with STH constructs expression (Fig. 1d, Supplementary Fig. 1d–f). This observation also has physiological relevance as mitochondrial dysfunction and the associated elevated NADH/NAD+ ratio has been linked to decreased NADPH levels (i.e. a pro-reductive shift in NADH redox metabolism coexists with a pro-oxidative NADPH shift) (19). The observed increase in the NADH/NAD+ ratio with EcSTH and PpSTH constructs expression exceeded that obtained by treating control wild-type HeLa cells with piercidin A, antimycin A or oligomycin A, inhibitors of mitochondrial complexes I, III or V, respectively (Supplementary Fig. 1g–h). To further confirm that cells expressing STHs were experiencing reductive stress, we measured lactate and pyruvate levels in spent medium since the extracellular lactate/pyruvate ratio is a proxy for the cytosolic NADH/NAD+ ratio (Fig. 1e, Supplementary Fig. 2a–b). This corroborated the NADH-producing activity of the three most active constructs (EcSTH, mitoEcSTH, and PpSTH) and suggested that the LDH-mediated conversion of pyruvate to lactate is active but insufficient to rebalance the NADH/NAD+ ratio under these conditions.
Interestingly, the proliferation of HeLa cells expressing the three most active STHs was blunted (Fig. 1f, Supplementary Fig. 2c). The most parsimonious explanation for the observed anti-proliferative effect under conditions of NADH overproduction is that cells cannot maintain adequate levels of oxidized NAD+, a well-recognized redox requirement of proliferation (4, 20, 21). In support of this interpretation, the proliferation of HeLa cells expressing all STH constructs or luciferase (LUC) was blunted by treatment with antimycin A (Fig. 1g, Supplementary Fig. 2d). Under these conditions, only LbNOX (a water-forming NADH oxidase from Lactobacillus brevis), rescued proliferation by directly catalyzing the conversion of NADH to NAD+ (with uridine present in the medium to bypass coenzyme Q-dependent dihydroorotate dehydrogenase (DHODH)) (4, 22). Together, these results suggest that, when expressed in HeLa cells, STHs catalyze the forward NADH-producing reaction using reducing equivalents from NADPH, even when the NADH/NAD+ ratio is elevated by ETC inhibition. Since EcSTH and mitoEcSTH generated the most pronounced increase in NADH/NAD+ ratio and blunted proliferation, we selected these constructs to investigate further.
Biochemical properties of recombinant EcSTH
Recombinant EcSTH purified from E. coli had a yellow color in solution with a characteristic UV-Visible absorption spectrum of the FAD cofactor (λmax = 370 and 444 nm) (Fig. 2a). We employed thio-NADH and thio-NAD+ analogs in our kinetics experiments as thio-NADH can be monitored by absorption changes at 398 nm (ε398 = 11,300 M−1 cm−1) and does not overlap with 340 nm peak of NADH or NADPH. Using combinations of regular nucleotides and their thio-analogs, we were able to determine the kinetic parameters of EcSTH in both the forward and reverse direction (Fig. 2b–c, Supplementary Fig. 3a–d). The determined KM’s for NAD+, NADPH and NADH were (68 ± 8, 32 ± 3 and 79 ± 8 μM) while kcat’s were (11 ± 2, 30 ± 1 and 64 ± 7 s−1), respectively, indicating that neither the forward nor reverse direction are strongly favored, and the direction of the EcSTH catalyzed reaction is determined by the relative abundance of the pyridine nucleotide reactants.
Figure 2. Determination of EcSTH kinetic parameters and visualization of EcSTH activity in live cells using genetically encoded sensors.
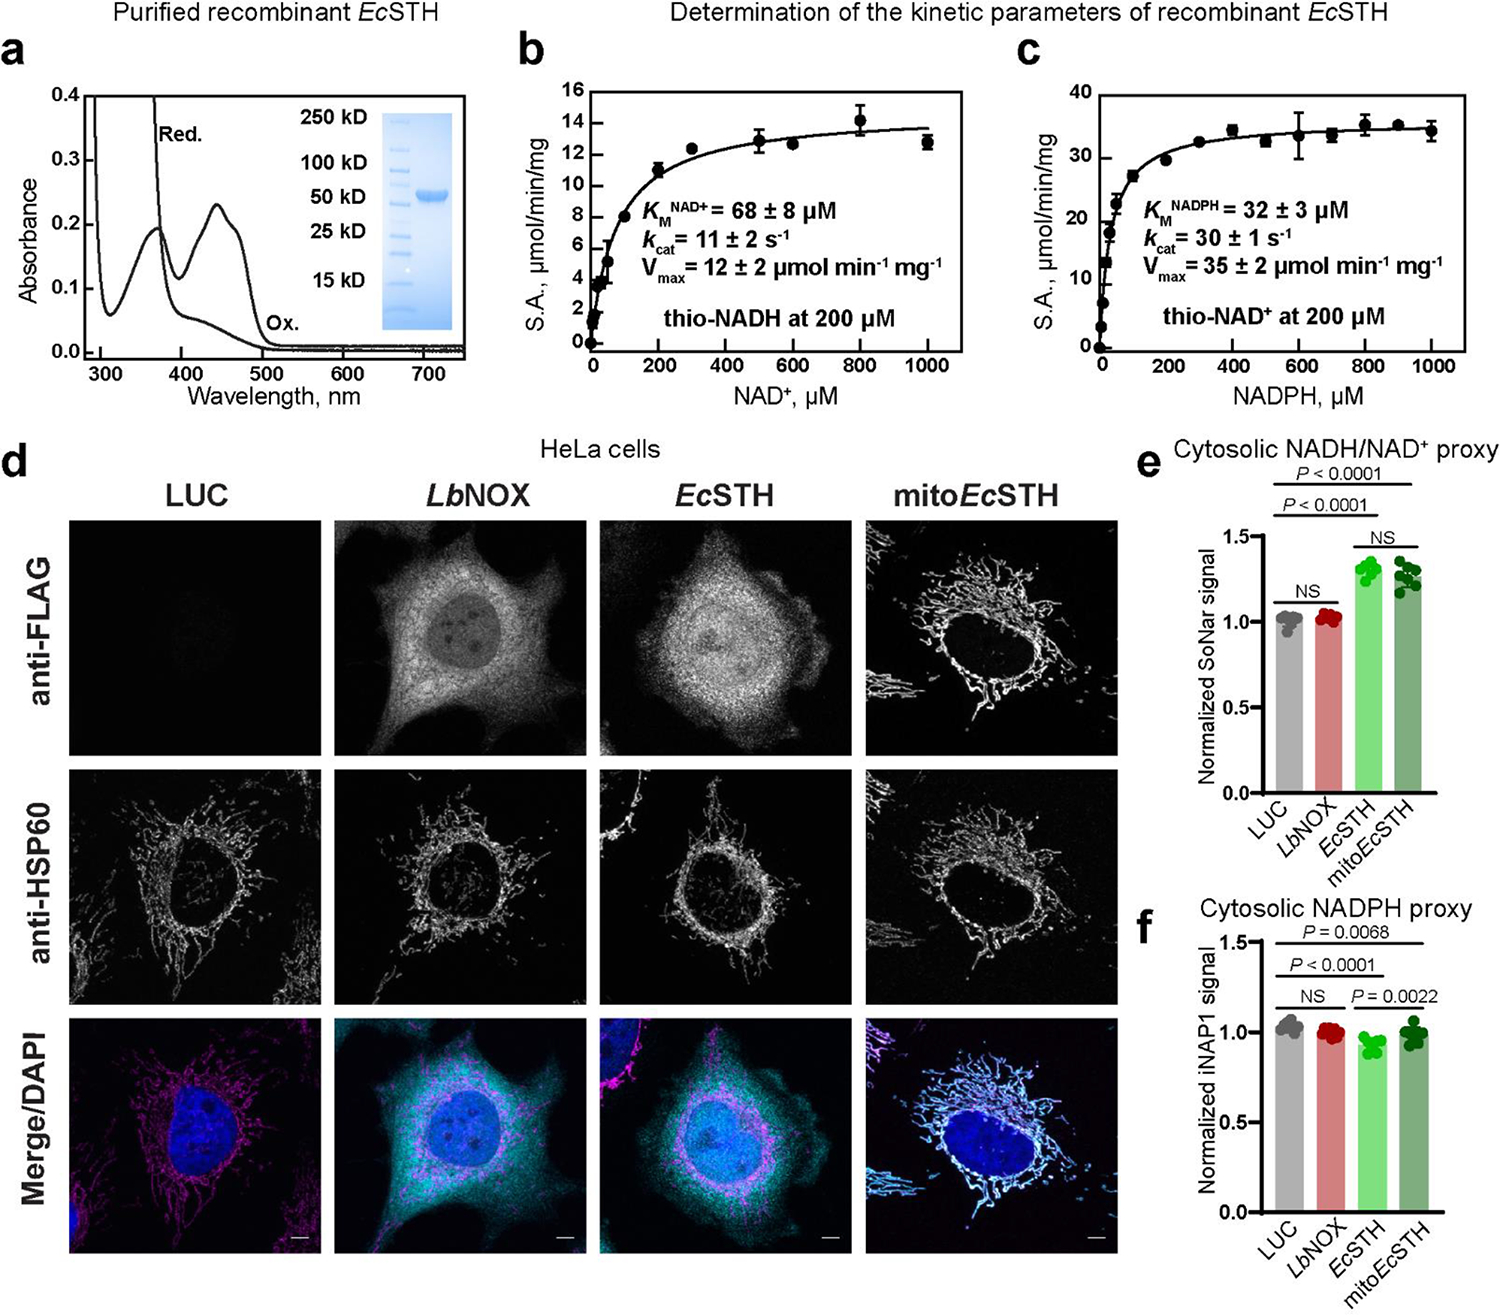
(a) UV-Visible spectrum of recombinant STH from E. coli (EcSTH) as purified at 20 μM FAD of active sites (Ox.) and after addition of excess of sodium dithionite (Red.). Insert: the SDS-PAGE of purified EcSTH. A representative SDS-PAGE is shown. Michaelis-Menten analysis of the reaction catalyzed by EcSTH with NAD+ (b) or NADPH (c). Reported values for Vmax, kcat and KM for NAD+ (thio-NADH was fixed at 200 μM) and NADPH (thio-NAD+ was fixed at 200 μM) are from Supplementary Fig. 3d. (d) Subcellular localization of untargeted EcSTH and mitochondrially targeted EcSTH (mitoEcSTH) in HeLa cells determined by fluorescence microscopy. HeLa cells expressing FLAG-tagged LbNOX, EcSTH, and mitoEcSTH proteins were co-stained for FLAG tag, HSP60 (mitochondrial marker) and DAPI (nucleus marker). Scale bars: 5 μm. Cytosolic NADH/NAD+ ratios (e) and NADPH levels (f) measured using genetically encoded sensors SoNar and iNAP1 in HeLa cells expressing EcSTH and mitoEcSTH. Values are mean ± s.d.; n = 2 in (b-c), n = 7, 6, 6, 7 in (e), n = 8, 8, 7, 8 in (f) biologically independent samples. The statistical significance indicated for (e-f) represents a One-Way ANOVA followed by uncorrected Fisher’s least significant difference test. NS, no significant difference.
Visualization of EcSTH activity in live cells
We employed fluorescence microscopy to confirm cellular localization of FLAG-tagged EcSTH and mitoEcSTH in HeLa cells (Fig. 2d). Untargeted EcSTH localized diffusely throughout the cytoplasm and the nucleus. In contrast, untargeted LbNOX was partially excluded from the nucleus, and mitoEcSTH was exclusively localized in mitochondria, as evidenced by the overlap with the mitochondrial marker HSP60. Using stimulated emission depletion (STED) super resolution microscopy, we confirmed that mitoEcSTH is exclusively localized inside the mitochondria (Supplementary Fig. 4a–d).
We used untargeted (cytosolic) versions of genetically encoded sensors for the NADH/NAD+ ratio (SoNar) and NADPH levels (iNAP1) to confirm the activity of EcSTH and mitoEcSTH in live cells (Fig. 2e–f, Extended Data Fig. 1a–c, Extended Data Fig. 2a–e, Supplementary Fig. 5a–c)(23, 24). We show that while both EcSTH and mitoEcSTH robustly impacted the cytosolic NADH/NAD+ ratio, the impact of EcSTH on cytosolic NADPH was much more pronounced compared to mitoEcSTH. This can be explained by recent findings demonstrating that there is no direct NADPH shuttle between cytoplasm and mitochondria and that ultimately re-balancing between NADH and NADPH pools communicates the changes in corresponding redox potentials between different compartments (25).
Impact of EcSTH expression on oxygen and GSH metabolism
Oxygen consumption rate (OCR) was mildly decreased in HeLa cells with expression of both EcSTH and mitoEcSTH (Extended Data Fig. 3a–b, Supplementary Fig. 6a–b). As expected, extracellular acidification rate (ECAR) was robustly elevated following the addition of antimycin A or oligomycin A in LUC and LbNOX expressing controls, but this increase was not observed in cells expressing EcSTH and mitoEcSTH. This suggests glycolysis is operating at the maximum capacity in cells expressing EcSTH and mitoEcSTH, likely due to limited NAD+ availability, and cannot be further upregulated in response to ETC inhibition.
We next observed that expression of EcSTH and mitoEcSTH did not impact the total cellular GSH/GSSG ratio (Supplementary Fig. 6c–d). At the same time, superoxide and H2O2 were only slightly accumulated in HeLa cells expressing EcSTH compared to a robust impact of menadione (Supplementary Fig. 6e–m). These results show that, despite a sizable decrease in the total NADPH/NADP+ ratio, EcSTH and mitoEcSTH expression do not significantly alter intracellular GSH/GSSG ratio or ROS production. This result also agrees with previous studies showing that NADPH and GSH pools are not in equilibrium (1, 26).
We next sought to establish how EcSTH catalyzed reaction is impacted under conditions of inhibited ETC or hypoxia by measuring whole-cell NADH/NAD+ and NADPH/NADP+ ratios in HeLa cells expressing EcSTH and mitoEcSTH treated with piericidin A, antimycin A or by subjecting cells to 1% O2 hypoxia (Extended Data Fig. 4a–d). We observed that both EcSTH and mitoEcSTH increased the NADH/NAD+ ratio to a greater extent when used in combination with ETC inhibitors, with the largest effect observed for EcSTH combined with antimycin A; in contrast, 1% O2 hypoxia only slightly decreased the ability of EcSTH, but not mitoEcSTH, to modulate the NADH/NAD+ ratio. Importantly, the anti-proliferative effect of EcSTH and mitoEcSTH expression was also present in 1% and 3% O2 hypoxia (Supplementary Fig. 7a–f). In summary, our results clearly demonstrate that EcSTH and mitoEcSTH can be employed in conjunction with ETC inhibition or hypoxia to increase cellular NADH/NAD+ ratio.
Metabolic features of the NADH reductive stress
We next employed both untargeted and targeted metabolomics to explore how EcSTH and mitoEcSTH expression impacts the metabolome of HeLa cells (Fig. 3a–c, Extended Data Fig. 5a–c). In untargeted profiling, both EcSTH and mitoEcSTH led to more significantly altered features than LbNOX expressing cells. This suggests that the cellular metabolome of HeLa cells is substantially more impacted under conditions of reductive stress compared to the pro-oxidative redox shift established by LbNOX expression.
Figure 3. Metabolic features of the NADH reductive stress in HeLa cells.
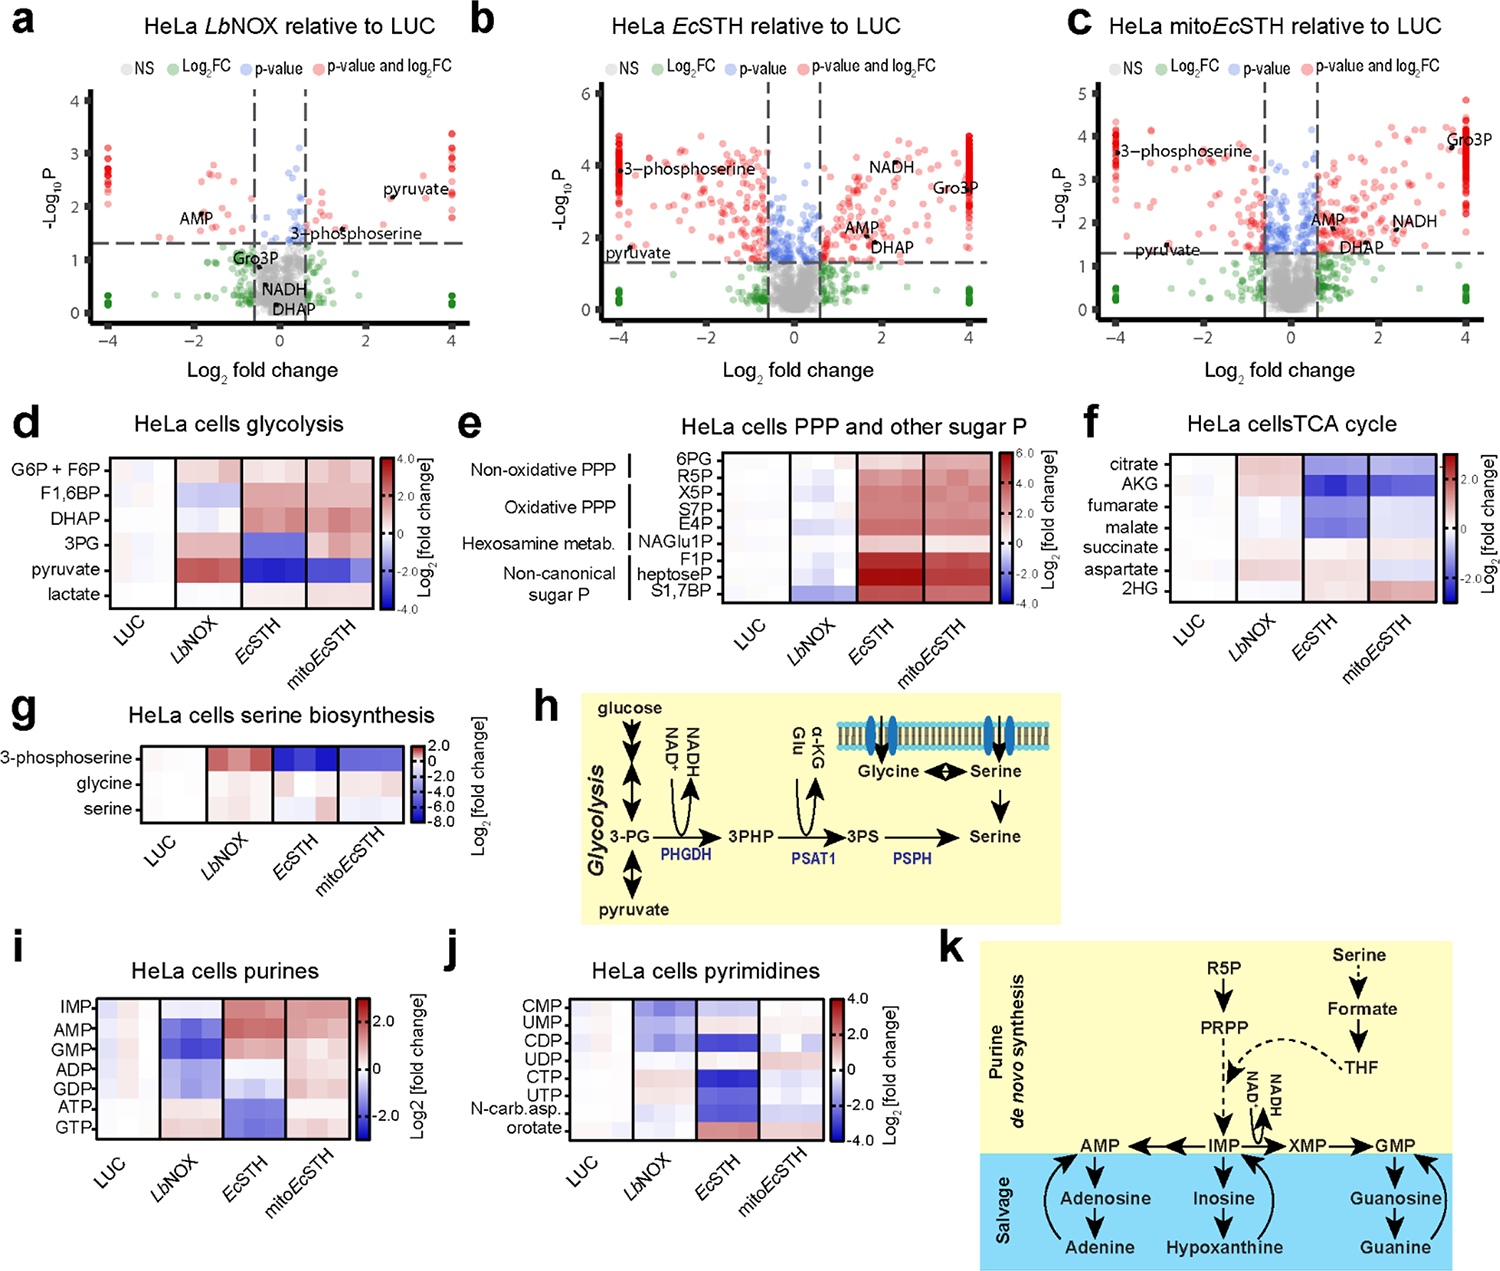
(a-c) Untargeted metabolomics of HeLa cells expressing LbNOX, EcSTH and mitoEcSTH. Heatmaps of the most impacted glycolysis (d), pentose phosphate pathway, non-canonical sugar phosphates (e), the TCA cycle (f), serine biosynthesis (g) intermediates in HeLa cells expressing EcSTH and mitoEcSTH. G6P: glucose-6-phosphate; F6P: fructose-6-phosphate; F1,6BP: fructose-1,6-biphosphate; DHAP: dihydroxyacetone phosphate; 3PG: 3-phosphoglycerate; 6PG: 6-phosphogluconate; R5P: ribose-5-phosphate; X5P: xylulose-5-phosphate; S7P: sedoheptulose-7-phosphate, E4P: erythrose-4-phosphate; NAGlu1P: N-acetylglucosamine-1-phosphate; F1P: fructose-1-phosphate; heptoseP: a putative heptose with one phosphate; S1,7BP: sedoheptulose-1,7-bisphosphate; AKG: α-ketoglutarate; 2HG: 2-hydroxyglutarate. (h) Schematic of serine cellular biosynthesis. Heatmaps of the most impacted purines (i) and pyrimidines (j) in EcSTH and mitoEcSTH expressing HeLa cells. N-car.asp.: N-carbamoyl-aspartate. (k) Schematic of purine cellular salvage and biosynthesis. Luciferase and LbNOX expressing HeLa cells were used as controls in (a-g, i, j). In heatmaps (d-g, i, j) each column represents biologically independent sample. The statistical significance indicated for (a-c) represents p value cutoff = 0.05, fold change cutoff = 1.5 and Welch t test (FDR corrected).
We observed that expression of EcSTH and mitoEcSTH led to a robust accumulation of intermediates of upper glycolysis and non-oxidative segments of the pentose phosphate pathway (PPP) (Fig. 3d–e), likely due to the reduced levels of NAD+ limiting flux though lower glycolysis (27). In these experiments, we also noticed that EcSTH expression led to a dramatically increased total signal intensity of the chromatographic region where multiple sugar phosphates elute, and this increase in signal was not completely explained by metabolites typically considered to be part of upper glycolysis and the PPP (Fig. 3e, Supplementary Fig. 8). We were able to annotate some of these additional peaks as non-canonical sugar phosphates, including fructose-1-phosphate and sedoheptulose-1,7-bisphosphate, that were highly accumulated in response to EcSTH and mitoEcSTH expression (Fig. 3e). The increase in 1-phosphate containing sugars may be explained by relaxed substrate specificity of cellular aldolases and transketolases or by overwhelming of the DUF89 family of proteins that were recently identified as damage pre-emption enzymes acting as a disposal pathway for non-canonical sugar phosphates (28, 29).
Notably, compared to the LUC control, EcSTH and mitoEcSTH expressing cells also had lower levels of the following TCA cycle intermediates: citrate, α-ketoglutarate (αKG), fumarate, and malate (Fig. 3f). This result is expected as elevated NADH levels are known to downregulate TCA cycle enzymes via inhibition of pyruvate dehydrogenase complex (PDH) activity (21, 30). We also confirmed that observed features of EcSTH expression on glycolysis, PPP and TCA cycle are much more robust compared to the metabolic impact of TPNOX expression (the water-forming NADPH oxidase which decreases cellular NADPH/NADP+ ratio) (Supplementary Fig. 9a–l) (5).
Direct measurements of glucose and glutamine consumption and lactate production in conjunction with stable isotope tracing with uniformly labeled [U-13C6]glucose and [U-13C5]glutamine further supported our initial observations that EcSTH and mitoEcSTH expression leads to downregulation of glycolysis and TCA cycle and upregulation of PPP (Supplementary Fig. 10a–g). In these experiments we observed that reduced glucose oxidation is balanced by increased glutamine anaplerosis for both EcSTH and mitoEcSTH (Supplementary Fig. 10a–c).
In agreement with the changes in spent culture media, the intracellular lactate/pyruvate ratio was substantially elevated in EcSTH and mitoEcSTH expressing cells (Extended Data Fig. 6a, Supplementary Fig. 11a–b) (18, 31). In addition to pyruvate/lactate interconversion, LDH also catalyzes production of 2-hydroxybutyrate (2HB, also known as alpha-hydroxybutyrate) from 2-ketobutyrate (2KB). As expected, we observed an increase in 2HB and a substantial decrease in 2KB levels in HeLa cells expressing EcSTH and mitoEcSTH, resulting in a substantially elevated 2HB/2KB ratio (Extended Data Fig. 6b, Supplementary Fig. 11c–d). Similar changes in 2HB and 2KB were observed in wild-type HeLa cells treated with different ETC inhibitors, with the most pronounced impact in the presence of antimycin A (Supplementary Fig. 11e–g). Another redox pair that participates in the buffering of the cellular redox environment is an equilibrium reaction between 3-hydroxybutyrate (3HB) and acetoacetate (AcAc), which is catalyzed by 3-hydroxybutyrate dehydrogenase and considered a proxy for the mitochondrial NADH/NAD+ ratio (32). We observed that EcSTH expression did not substantially impact 3HB levels, but AcAc levels were drastically reduced by expression of both EcSTH and mitoEcSTH, resulting in a significantly increased 3HB/AcAc ratio (Extended Data Fig. 6c, Supplementary Fig. 11h–i).
Evidence that the Gro3P shuttle is intact in wild-type HeLa cells was obtained by treating cells with antimycin A to block progression of electrons beyond the coenzyme Q pool. This inhibition led to a 65-fold accumulation of Gro3P (Supplementary Fig. 11j–l). In response to EcSTH and mitoEcSTH, we also observed a robust accumulation of both Gro3P and DHAP and a substantially elevated Gro3P/DHAP ratio (Extended Data Fig. 6d, Supplementary Fig. 11m–n). However, it is important to note that in HeLa cells, the Gro3P shuttle was not able to successfully vent excess of NADH through the coenzyme Q pool and ETC, as evidenced by the decreased oxygen consumption and reduced proliferation. Another NADH-consuming mechanism that was recently reported to relieve NADH-induced reductive stress is fatty acid desaturation (33), and in cells expressing mitoEcSTH, we observed an increase in the C16:1/C16:0 ratio (Extended Data Fig. 6e, Supplementary Fig. 12a–b). Aspartate levels have been directly impacted by the ETC activity and associated changes in cellular NADH/NAD+ (34). We observed that a blockade of ETC in wild-type HeLa cells diminished aspartate levels, but EcSTH and mitoEcSTH expression only slightly impacted aspartate levels compared to LUC or LbNOX controls (Supplementary Fig. 12c–d). One of the most dramatically diminished metabolites in response to EcSTH and mitoEcSTH expression was 3-phosphoserine, while glycine and serine levels were only modestly impacted (Fig. 3g–h). This can be explained by 3-phosphoglycerate dehydrogenase (PHGDH), a key enzyme in the serine biosynthesis pathway, having a Kd for NADH of 0.22 ± 0.03 μM, which is >2000-fold lower compared to a Kd for NAD+ (444 ± 18 μM) (35–37).
In addition to the already highlighted changes in central carbon metabolism, we also observed a significant impact on the levels of purines and pyrimidines (Fig. 3i–k, Extended Data Fig. 6f, Supplementary Fig. 12e–f). Since HeLa cells expressing EcSTH and mitoEcSTH are not proliferating, it is not surprising that AMP accumulated, while ATP levels diminished. Accumulation of purines such as IMP, AMP and GMP may be explained by elevated levels of ribose 5-phosphate in these cells, as the conversion of ribose 5-phosphate to phosphoribosyl pyrophosphate (PRPP) is the first committed step in IMP and purine biosynthesis (Fig. 3k)(37). We also observed that supplementation of the growth medium with pyruvate, 2KB, or oxaloacetate (OAA) completely rescued the anti-proliferative defect in HeLa cells (Extended Data Fig. 7). This suggests that, in cells with an intact ETC, providing an alternative mechanism for NAD+ recycling is sufficient to rescue the anti-proliferative effect caused by EcSTH or mitoEcSTH expression.
Collectively, our data suggest that the NADH reductive stress in HeLa cells leads to extensive metabolic remodeling that includes upregulation of non-oxidative PPP, activation of purine biosynthesis and a blockade of serine biosynthesis from 3-phosphoglycerate.
Transcriptomic signatures of the NADH reductive stress
To further explore how the NADH reductive stress impacts cellular metabolism, we performed RNA sequencing (RNA-Seq) analysis of HeLa cells expressing LbNOX, EcSTH or mitoEcSTH for 24 hours. Gene expression in cells expressing LbNOX changed modestly when compared with LUC control (Fig. 4a). By contrast, there are more than 600 upregulated and more than 700 downregulated genes identified in cells expressing EcSTH (Fig. 4b). These changes in expression mirror the conclusions from our metabolomic profiling and indicate that cells undergo a larger transcriptomic response to NADH reductive stress compared to a pro-oxidative shift with LbNOX expression. Similar results were obtained in cells expressing mitoEcSTH (Fig. 4c). Among the most significantly changed genes were the growth differentiation factor 15 (gdf15) (upregulated), which was recently suggested as a biomarker of the NADH reductive stress linked to mitochondrial disease (18). A substantial number of genes were also differentially changed in mitoEcSTH expressing cells compared with EcSTH (Fig. 4d), suggesting the cellular response to the NADH reductive stress is different depending on cellular compartment. Gene ontology (GO) enrichment analysis revealed the most significantly changed pathways were “oxidation-reduction” and “cholesterol biosynthesis” (Fig. 4e–f). Interestingly, most genes in the “cholesterol biosynthesis” pathway are transcriptionally downregulated in EcSTH-expressing cells. In a recent study where the ketogenic 3HB diet was used to induce reductive stress in mice bearing PDAC allograft tumors, the cholesterol biosynthesis was also downregulated, with 3 genes in common with our study: sqle, fdps and msmo1 (38).
Figure 4. RNA-Seq of HeLa cells expressing LbNOX, EcSTH and mitoEcSTH.
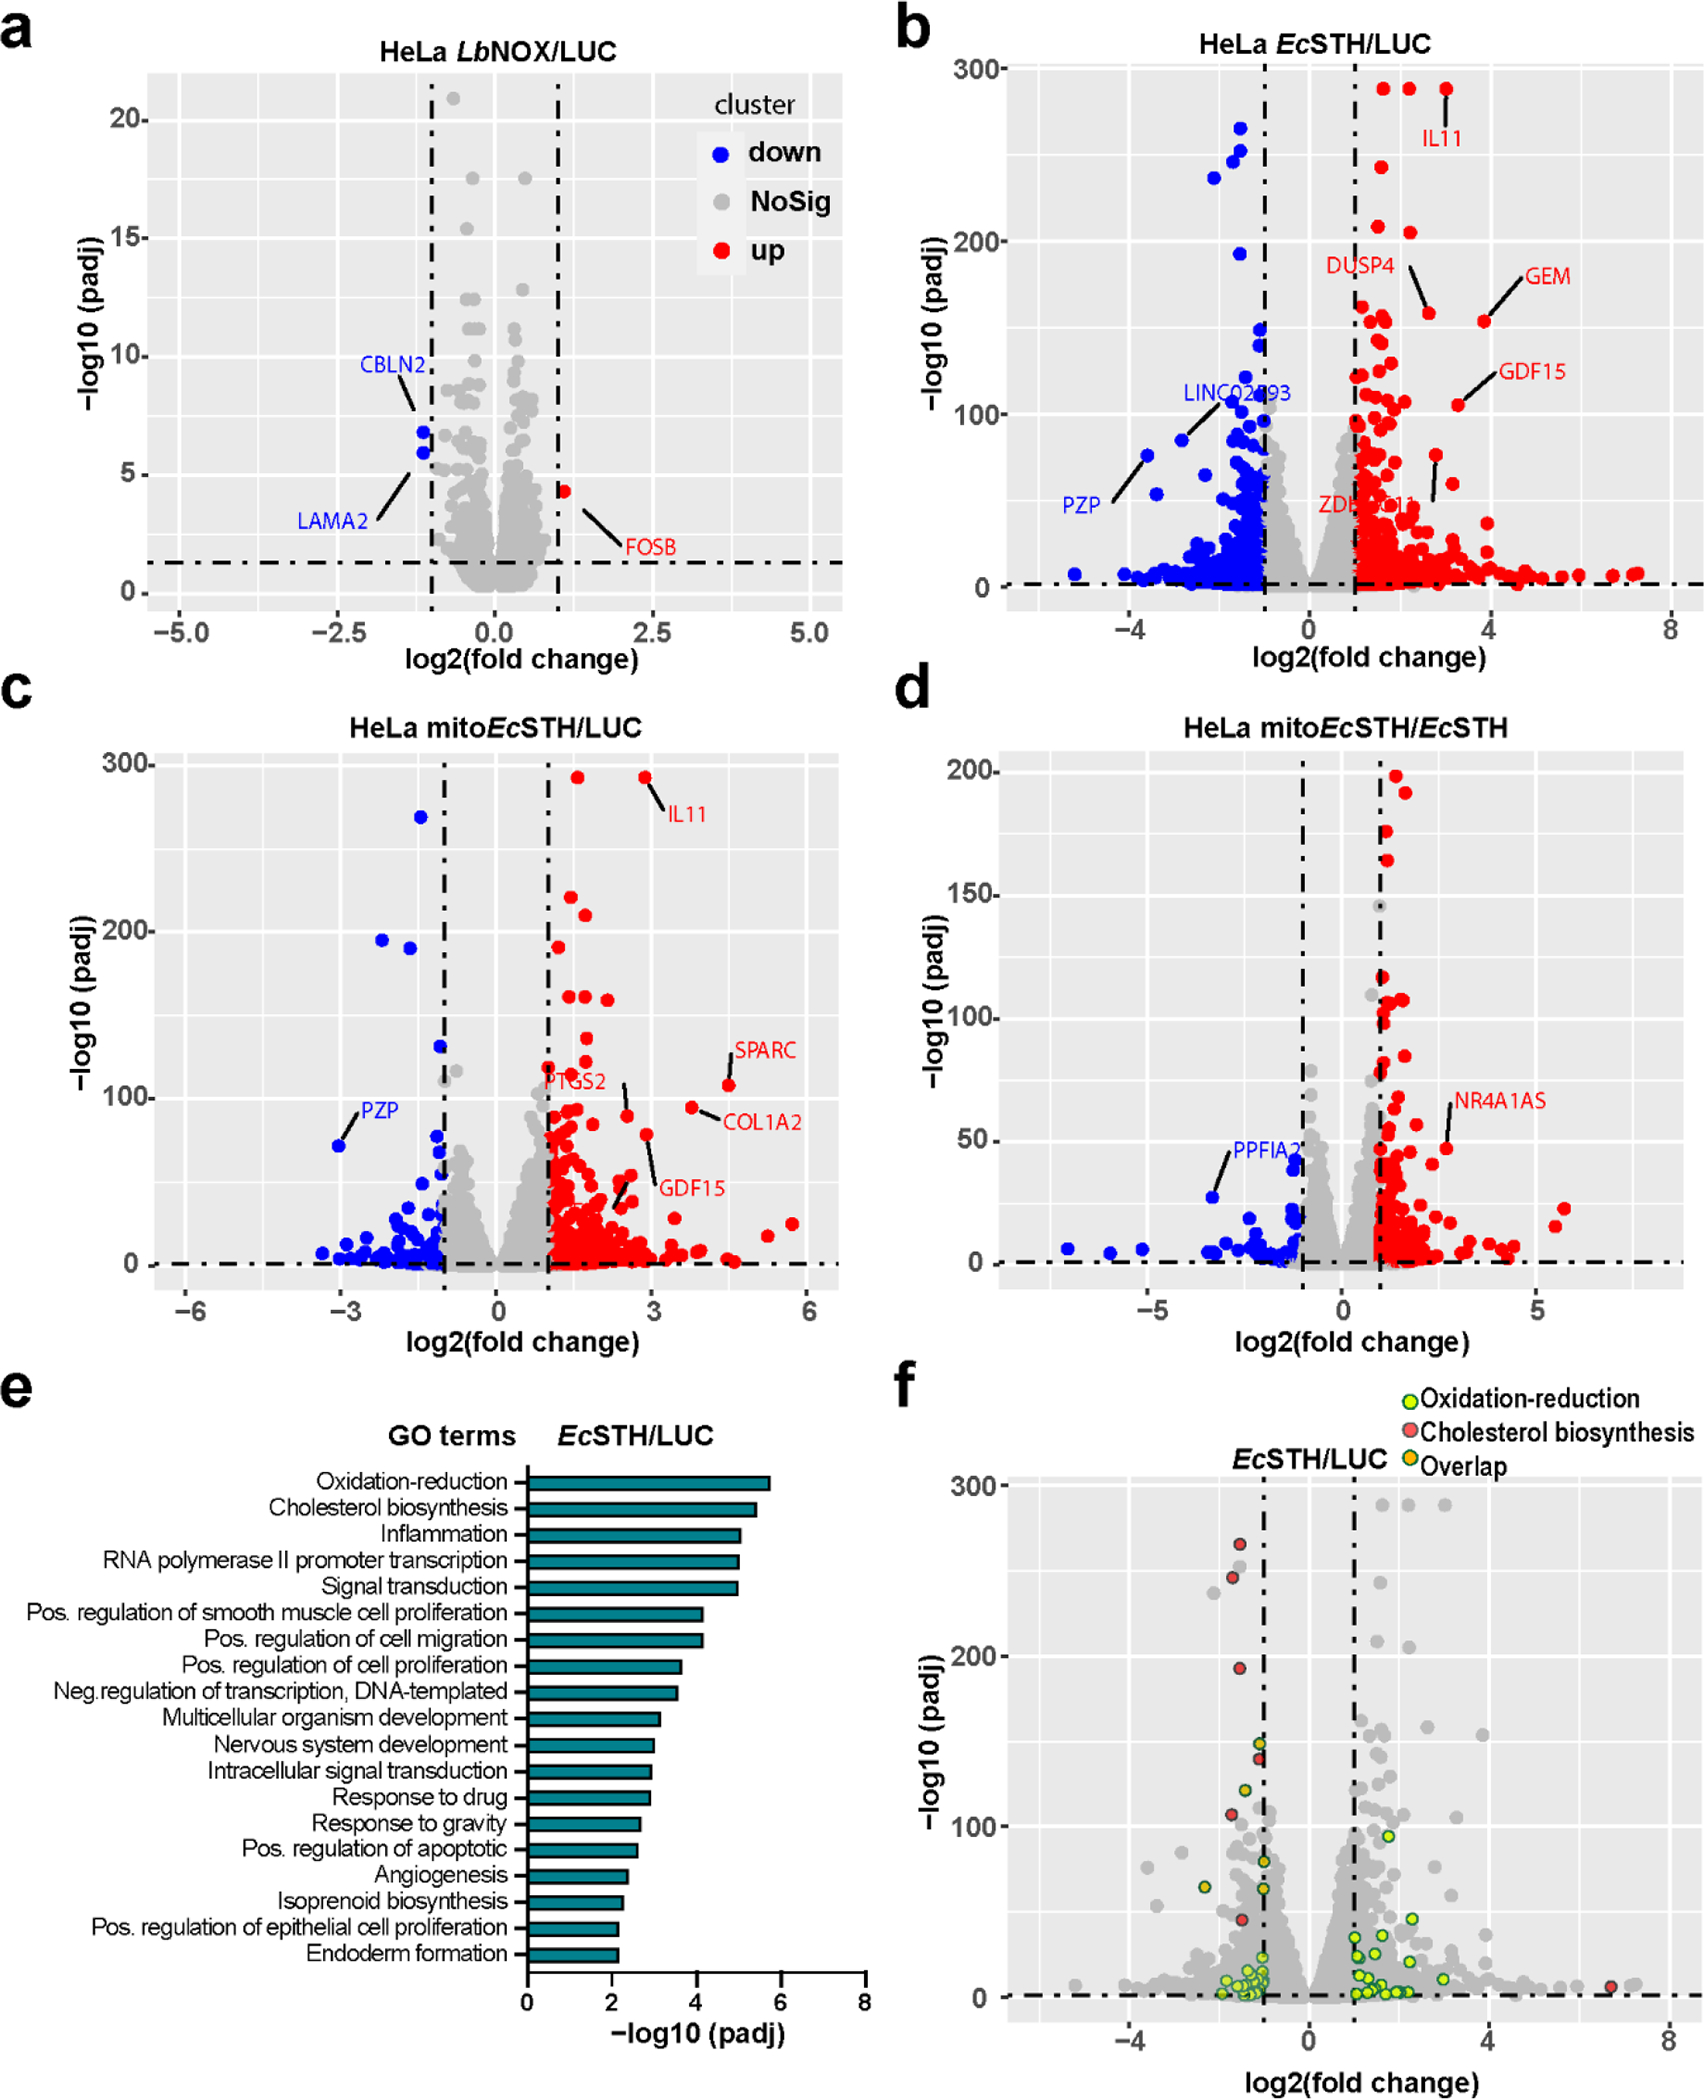
(a-d) Volcano plots that represent the indicated group’s log2 fold change (x-axis) and adjusted P-value for significance (y-axis). Genes significantly different in expression at FDR 5% are indicated in red (up-regulated genes) and blue (down-regulated genes). Gray dots represent genes without significant changes in expression. Selected genes are marked with gene names. (e) Gene ontology enrichment analysis of EcSTH vs LUC control group. (f) Volcano plot representing the top 2 GO terms in (e). Light green dots represent the “oxidation-reduction” and salmon dots represent the “cholesterol biosynthetic” pathways. Overlapping genes are highlighted in orange.
We also found that from the “oxidation-reduction” pathways gene set, nine genes encode enzymes that have clear dependence on NAD(H) or NADP(H) as co-substrates; these enzymes were recently nominated as possible NAD(P)+ recycling reactions (Extended Data Fig. 8a–b)(27). ALDHs and other enzymes in this group are poorly biochemically studied dehydrogenases that use retinoic acid, gamma-aminobutyric acid, or betaine as a co-substrate (39, 40). Interestingly, ALDH8A1 expression was shown to be induced by ethanol in the liver, and this enzyme catalyzes the reaction of 2-aminomuconate semialdehyde and NAD+ to produce 2-aminomuconate and NADH in the kynurenine pathway of tryptophan catabolism (41, 42). In summary, we identified previously uncharacterized NAD(P)-linked reactions that are important for cellular redox homeostasis and respond to an elevated cellular NADH/NAD+ reduction potential.
The anti-proliferative effect is background specific
We next asked if EcSTH and mitoEcSTH can be used in different cellular backgrounds. Expression of EcSTH and mitoEcSTH impacted the NADH/NAD+ and the NADPH/NADP+ ratios and proliferation to a different extent in C2C12, IMR-90, HEK-293T, A549, MIA PaCa-2 and PANC-1 cell lines (Fig. 5a–l, Extended Data Fig. 9a–l). Since C2C12 cells expressing EcSTH and mitoEcSTH were only marginally impacted by the anti-proliferative effect (even under 1 or 3% O2 hypoxia) despite a robust increase in the NADH/NAD+ ratio, we selected this cell line for further characterization (Supplementary Fig. 13a–h). Interestingly, while OCR of C2C12 cells with EcSTH and mitoEcSTH expression was slightly reduced, which we similarly observed in HeLa cells, ECAR in these cells had a characteristic increase under ETC inhibition (Supplementary Fig. 14a–b). Both our untargeted and targeted metabolic profiling of C2C12 cells further confirmed that an elevated NADH/NAD+ ratio due to EcSTH expression robustly impacts the metabolome (Extended Data Fig. 10a–c, Supplementary Fig. 15a–c, Supplementary Fig. 16a–f, Supplementary Fig. 17a–g). Labeling studies and direct measurements of glutamine consumption clearly demonstrated that C2C12 cells are efficient at oxidizing glucose and do not upregulate glutamine anaplerosis, which probably reflects their ability to overcome the NADH reductive stress as evidenced by the much milder effect of EcSTH expression on proliferation.
Figure 5. The anti-proliferative effect of EcSTH and mitoEcSTH expression is cellular background specific.
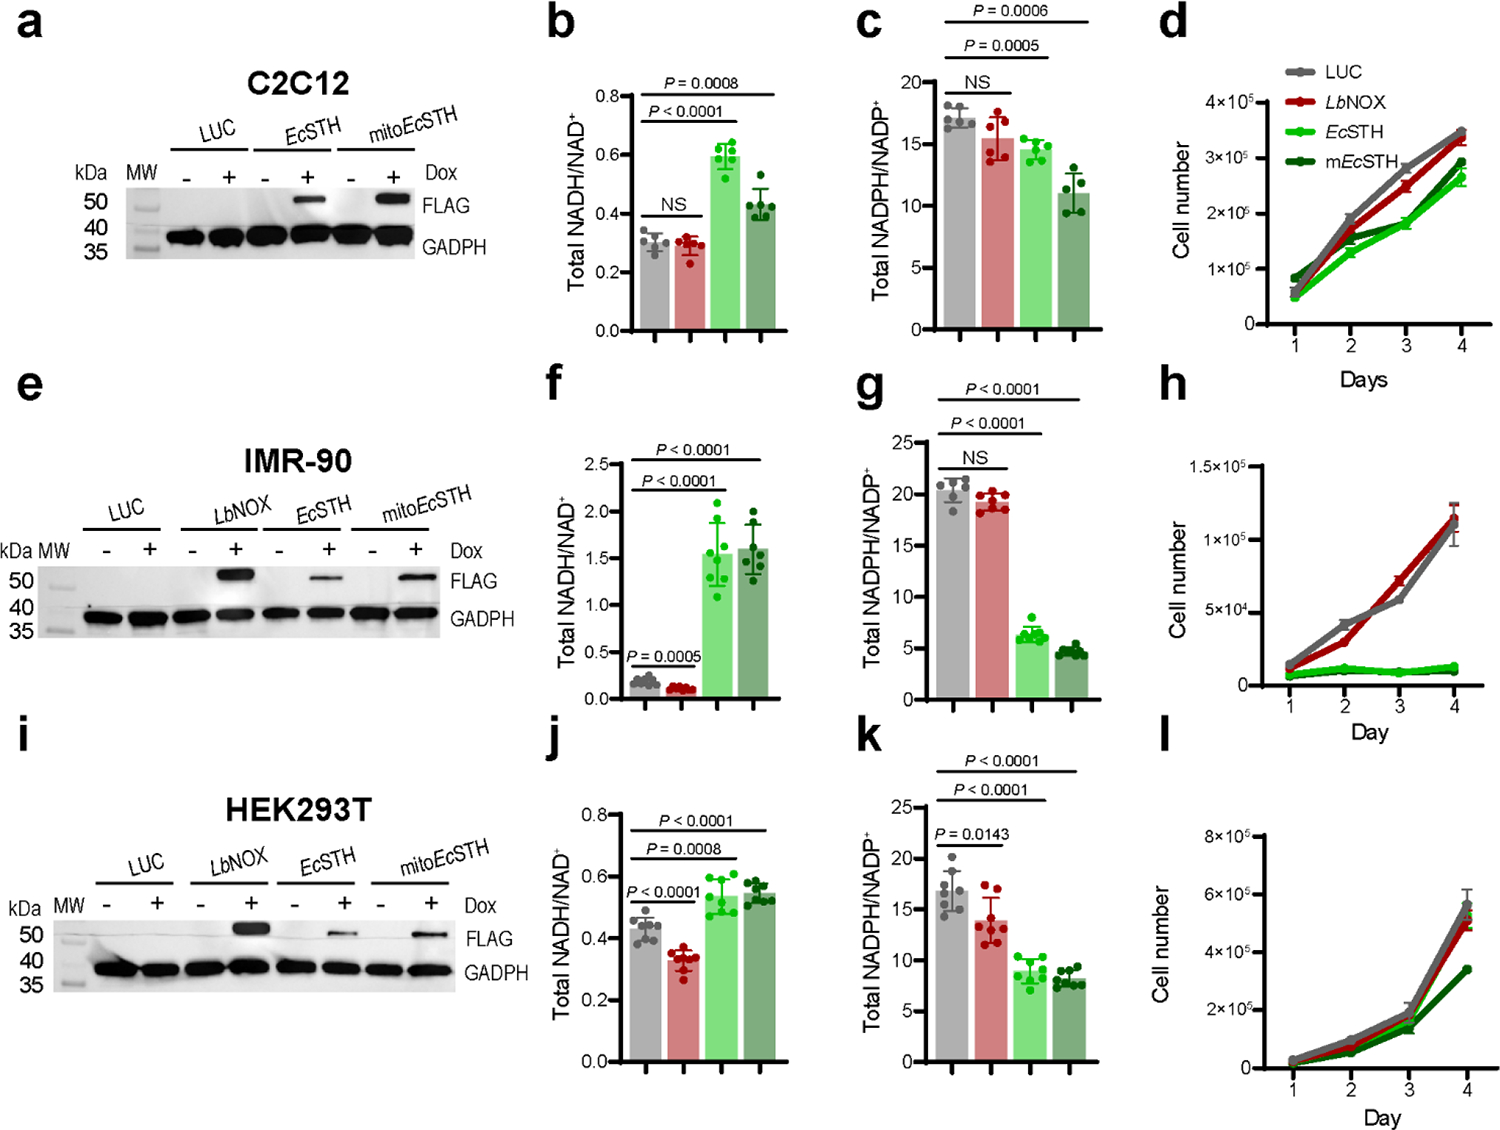
Western blot analysis of EcSTH and mitoEcSTH expression in C2C12 mouse myoblasts (a), IMR-90 human fibroblasts (e), embryonic human kidney HEK293T cells (i). (a, e, i) Representative blots are shown. The total NADH/NAD+ ratios in C2C12 myoblasts (b), IMR-90 (f), HEK293T (j) cells expressing EcSTH and mitoEcSTH. The total NADPH/NADP+ ratios in C2C12 myoblasts (c), IMR-90 (g), HEK293T (k) cells expressing EcSTH and mitoEcSTH. Proliferation of C2C12 myoblasts (d), IMR-90 (h), HEK293T (l) cells expressing EcSTH and mitoEcSTH in pyruvate-free DMEM+dFBS. LUC and LbNOX expressing HeLa cells were used as controls in (a-l). Values are mean ± s.d.; n = 6, 6, 6, 6 in (b), n = 6, 6, 6, 5 in (c), n = 8, 8, 8, 7 in (f), n = 6, 7, 8, 8 in (g), n = 8, 8, 8, 8 in (j), n = 8, 8, 8, 8 in (k) biologically independent samples. The statistical significance indicated for (b, c, f, g, j, k) represents a Welch ANOVA followed by unpaired t test. NS, no significant difference. For growth curves (d, h, l) error bars represent mean ± s.d.; n = 3 biologically independent samples.
Elevated GDF15 is a universal feature of reductive stress
Finally, to examine the utility of EcSTH in perturbing in vivo physiology, we expressed EcSTH in mouse liver (Fig. 6a). Based on our results from expressing EcSTH in cell culture, as well as previous studies that nominated GDF15 as a circulating biomarker of mitochondrial disease and associated NADH reductive stress, we examined transcriptional changes of GDF15 in these mice (Fig. 6b)(18, 43, 44). We found that hepatic-specific in vivo expression of EcSTH resulted in ~2.6-fold upregulation of GDF15 expression, confirming the ability of EcSTH to influence in vivo physiology, analogous to that of LbNOX (Fig. 6b)(31). This further highlights the role of NADH imbalance as a trigger of integrated stress response mechanistically linked to GDF15, a metabokine protein implicated in multiple disease processes (45, 46).
Figure 6. In vivo elevation of the hepatic cytosolic NADH/NAD+ ratio upregulates GDF15 expression.
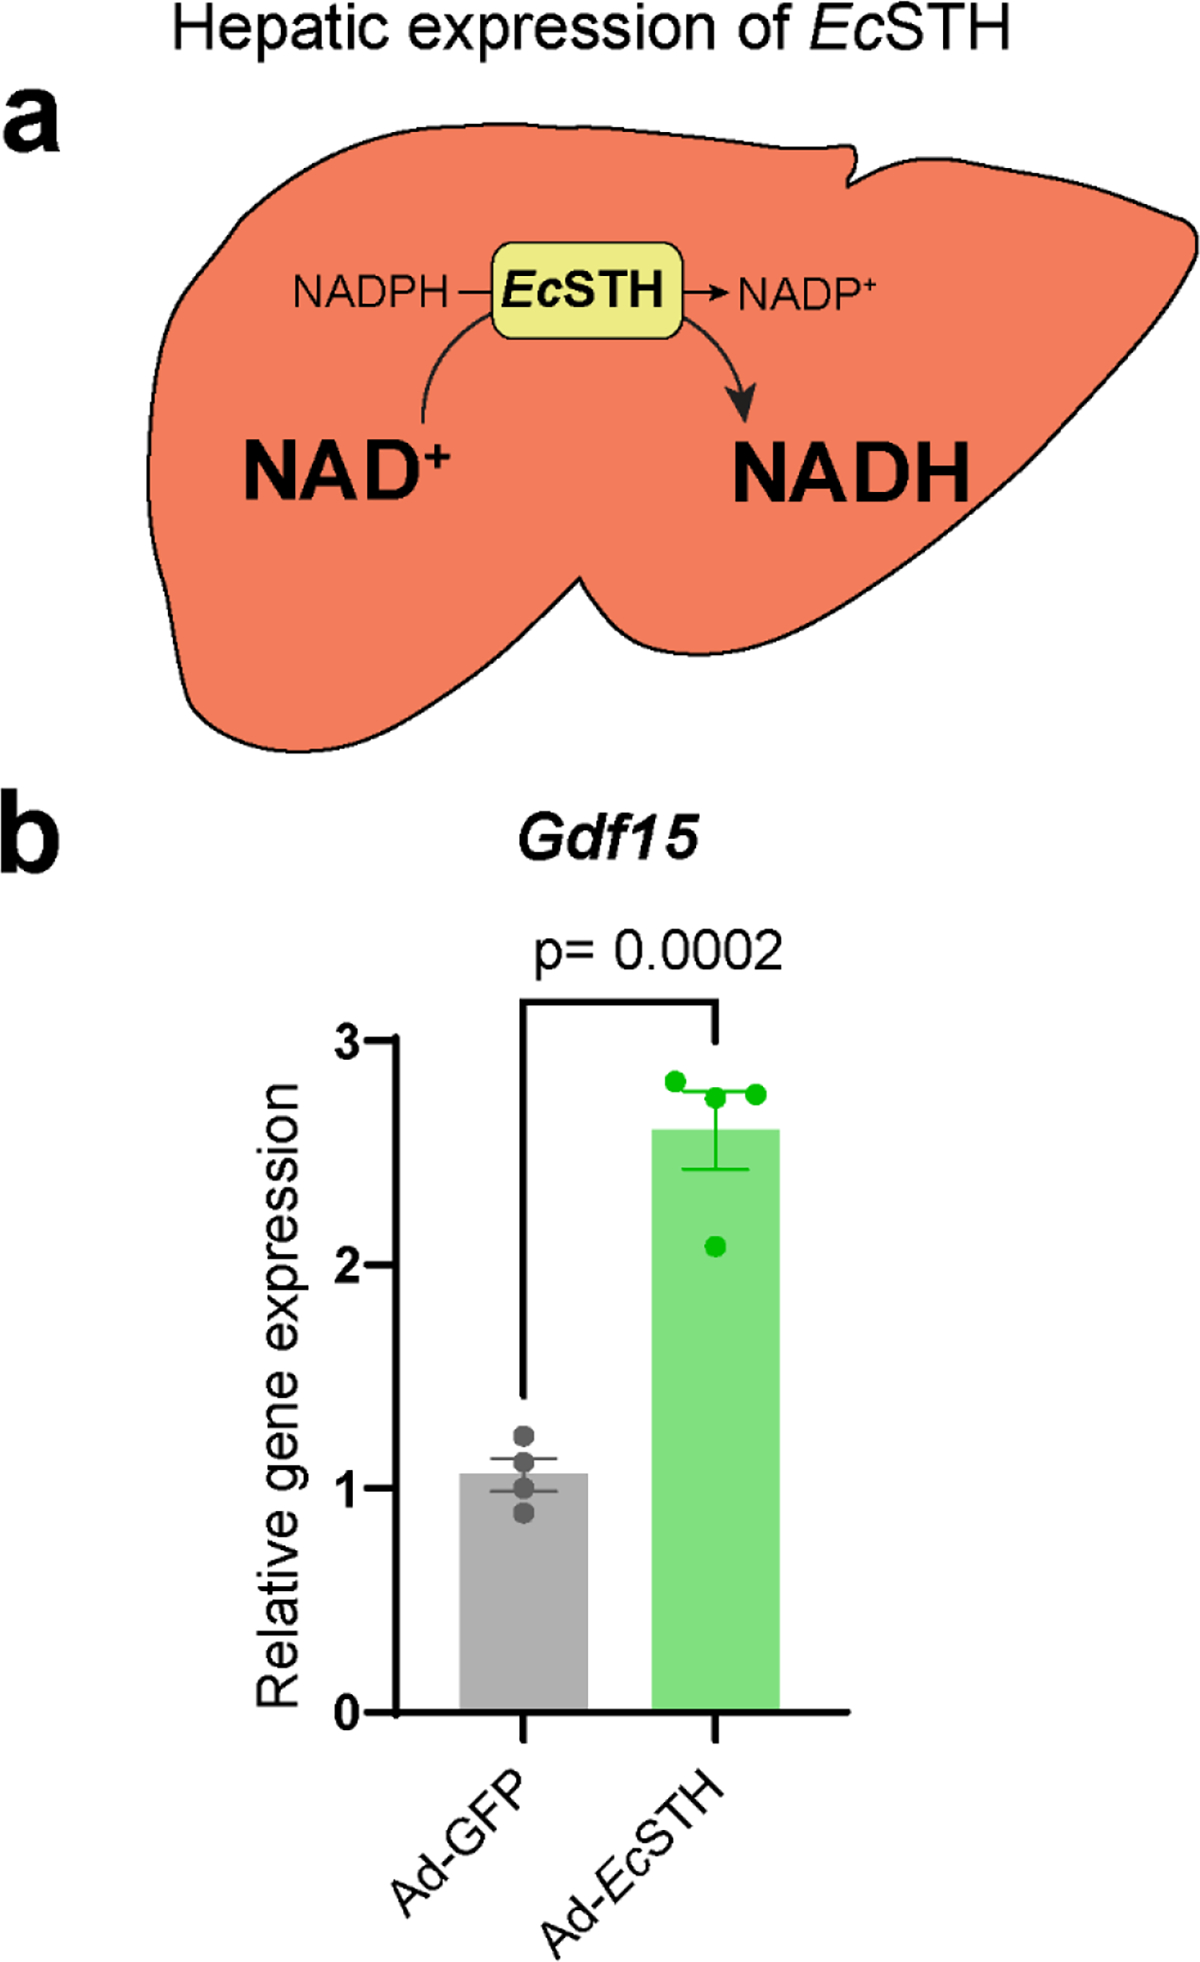
(a) Schematic representation of the experiment when adenoviral system was used to express GFP or EcSTH in liver. (b) Hepatic expression of GDF15 as quantified by qPCR. Values are mean ± s.d.; n = 4 biologically independent samples. The statistical significance represents a two-tailed unpaired t test.
DISCUSSION:
This study combines synthetic biology and metabolomics approaches to develop and validate a novel genetically encoded tool as a new strategy to model NADH reductive stress in mammalian cells. Our approach uses bacterial soluble transhydrogenases (STHs), whose physiological function is to maintain energy metabolism and redox cofactors homeostasis (47–51). We previously used a water-forming NADH oxidase from L. brevis (LbNOX), as well as a variant that we engineered to be strictly NADPH specific (TPNOX), to decrease cellular NADH/NAD+ or NADPH/NADP+ ratios, respectively (4, 5). Here, we present the development and validation of E. coli soluble transhydrogenase (EcSTH) as a third genetically encoded tool to model the NADH reductive stress in living cells by increasing the cellular NADH/NAD+ ratio (Fig. 1a).
Documenting very similar kcat/KM values for all reactions studied, as well as no activity with the NADP+ and thio-NADH pair of substrates, demonstrates agreement with previous reports that EcSTH catalyzes the NADH-producing reaction when NADPH levels are high (Supplementary Fig. 3c, d)(52). Indeed, in our experiments in mammalian cells, EcSTH catalyzes the reaction exclusively in the direction of transferring reducing equivalents from NADPH to NAD+ (in cells with intact or inhibited ETC) (Fig. 1a). This directionality is driven by the cellular state of NADPH/NADP+ reduction potential, as the majority of cellular NADP is in the reduced form (17, 32). Here we show that neither EcSTH nor mitoEcSTH rescued pyruvate auxotrophy (Fig. 1g). This suggests that although mitoEcSTH consumes NADPH, it simultaneously generates NADH, making regeneration of NAD+ via crosstalk between mitochondrial pyridine nucleotide pools infeasible (5). This is further supported by the additive effect on the NADH/NAD+ ratio observed in the presence of ETC inhibitors or 1% O2 hypoxia (Extended Data Fig. 4a–d).
Our data indicate that EcSTH promotes a robust increase in the NADH/NAD+ ratio in mammalian cells, with a clear impact on lactate/pyruvate, 2HB/2KB, 3HB/AcAc and Gro3P/DHAP redox pairs (Extended Data Fig. 6a–d). The NADH reductive stress impedes lower glycolysis, TCA cycle, and serine biosynthesis and forces carbon flux into the non-oxidative PPP, as evidenced in our metabolomic profiling in HeLa cells (Fig. 3a–g). The effect on the non-oxidative PPP is also observed with TPNOX expression (5), but the impact is much less pronounced than seen with EcSTH expression (Supplementary Fig. 9c–f). We also observed the upregulation of purine biosynthesis as one of the main features of reductive stress (Fig. 3i, k). Our findings agree with very recent studies which demonstrated that ETC inhibition and associated NADH reductive stress (53) or expression of untargeted EcSTH by another group (54) promote purine metabolites accumulation.
We also find that while a pro-oxidative shift (a decrease in NADH/NAD+ ratio) is essentially transcriptionally silent, there is a drastic transcriptional response to the elevated NADH/NAD+ ratio in HeLa cells (Fig. 4a–d). Both our metabolomics and transcriptomics data is in alignment with prior predictions of an excess of reducing equivalents being more deleterious for cells compared to a pro-oxidative shift (55). Interestingly, one of the features of the transcriptional response of EcSTH expression was the downregulation of the cholesterol biosynthesis pathway, which was also recently identified in PDAC tumors in mice that received a keto diet (38). Another prominent feature of the NADH reductive stress was the upregulation of ALDH enzymes, some of which were already known to be involved in response to ethanol-invoked reductive stress (42).
We also demonstrated that our new tool is versatile as it can be used in various cell lines or in vivo (Fig. 5a–l, Extended Data Fig. 9a–l, Fig. 6a–b). We observed that the extent to which different cell lines show a proliferation defect in response to EcSTH expression was linked to their ability to recycle NAD+. Our new tool also allowed us to identify GDF15 upregulation as a feature of the elevated NADH/NAD+ ratio in both cell culture and in vivo (Fig. 4b–c, Fig.6b). GDF15 was recently nominated as a biomarker of mitochondrial disease severity in mitochondrial encephalomyopathy, lactic acidosis and stroke-like episodes (MILAS) patients (18). However, our study is the first to show that the NADH reductive stress alone, even when ETC is intact, is sufficient to trigger GDF15 upregulation.
Collectively our data describes the development and validation of EcSTH as a genetically encoded tool to model NADH reductive stress in living cells or organs and the transcriptomic and metabolomic signatures of the reductive stress. We show that cells with an intact respiratory chain vary in their ability to withstand reductive stress, possibly by providing alternative compensatory biological pathways for NAD+ recycling. In addition, we show that under the NADH reductive stress, non-oxidative PPP, purine biosynthesis and GDF15 metabokine levels are upregulated. Another interesting implication of our work is that reductive stress can also result in the accumulation of non-canonical sugar phosphates, which are known to be toxic (56). We also hypothesize that modulation of purine biosynthesis can be one direction to counteract redox imbalance (54). In summary, our study sets the stage for developing a technology that will allow researchers to directly test how various cells, tissues or organs respond to redox imbalance linked to various disease states or aging-associated metabolic changes (7).
METHODS:
Miscellaneous Reagents
Chemicals, primers, plasmids, cell lines, cell culture media, commercial kits, antibodies, and mice used are listed in Supplementary Tables 1–5.
Cell Culture
HeLa, HEK293T, C2C12, IMR-90, A549, MIA PaCa-2 and PANC-1 cell lines were cultured in DMEM+FBS [DMEM without pyruvate and glucose supplemented with 25 mM glucose, 10% non-dialyzed FBS and 1% penicillin/streptomycin] at 37°C in 5% CO2 (IMR-90 fibroblasts were cultured in 5% CO2/3.5% O2). The Tet-On 3G system lentiviral-infected HeLa and C2C12 cell lines were cultured in DMEM+FBS supplemented with 0.5 mg/mL geneticin and 10 μg/mL puromycin. The Tet-One-Puro system lentiviral-infected IMR-90, A549, HEK293T, MIA PaCa-2, and PANC-1 cells were cultured in DMEM+FBS in the presence of 1 μg/mL puromycin. All experiments were performed in DMEM+dFBS without antibiotics [pyruvate free DMEM supplemented with 25 mM glucose and 10% dialyzed FBS] and other media components or chemical compounds as specified. All cell lines in this study were mycoplasma free.
DNA constructs
Homo sapiens codon-optimized genes encoding soluble transhydrogenases (STHs) from Escherichia coli (HAP3137380.1), Pseudomonas putida (WP_012313573), and Azotobacter vinelandii (WP_012700102) flanked by NotI and MluI restriction sites were custom synthesized by GENEWIZ. All constructs were delivered in the pUC57 vector and included, in addition to the original ORF: i) an N-terminal mitochondrial targeting sequence (MTS) of subunit IV of human cytochrome c oxidase and (ii) a C-terminal linker sequence with a FLAG-tag. After digestion with NotI and MluI, inserts were ligated into the pLVX-TRE3G vector (Clontech, CA). To remove the MTS and produce untargeted STHs, corresponding constructs were PCR amplified and ligated into the pLVX-TRE3G vector (see Supplementary Table 5). To re-clone Luciferase, EcSTH, mitoEcSTH and LbNOX into the pLVX-TetOne-Puro vector, corresponding constructs were PCR amplified from pLVX-TRE3G vectors (see Supplementary Table 5) and after digestion with EcoRI and AgeI were ligated into the pLVX-TetOne-Puro backbone. For protein characterization studies E. coli sth gene was amplified from the pLVX-TRE3G vector using primers containing the BamHI and XhoI restriction sites and ligated into the pET30a vector (EMD Millipore) (see Supplementary Table 5). The resulting construct encodes EcSTH with both an N-terminal Hisx6-tag and a C-terminal FLAG-tag.
Lentiviral Production and Infection
Lentiviruses were produced by transfecting packaging vectors psPAX2 and pMD2.G together with (i) pLVX-Tet3G regulator vector (encodes the Tet-On element), (ii) response vector pLVX-TRE3G-Luciferase, LbNOX, PpSTH, mitoPpSTH, EcSTH, mitoEcSTH, AvSTH or mitoAvSTH, or (iii) response vector pLVX-Tet-One-Puro-Luciferase, LbNOX, EcSTH or mitoEcSTH into HEK293T cells as previously described (4, 5). Forty-eight hours after transfection, media containing the virus was collected and stored at –80 °C. HeLa and C2C12 Tet3G cells were produced first using a lentivirus from the pLVX-Tet3G vector, and subsequently following selection with 0.5 mg/mL of geneticin, cells were infected with corresponding pLVX-TRE3G lentiviruses (see above). IMR-90, A549, HEK293T, MIA PaCa-2, and PANC-1 TetOne cells were produced by a single infection with corresponding pLVX-TetOne-Puro lentiviruses (see above).
Immunoblots
Two hundred thousand cells were seeded in a 6-well plate in 2 mL of DMEM+FBS. Twenty-four hours later, media was exchanged with 3 mL of DMEM+dFBS ± 300 ng/mL doxycycline (Dox). After an additional twenty-four hours, cells were washed with ice-cold PBS and were lysed with 300 μL of 50 mM HEPES, pH 7.5, 100 mM NaCl, 2 mM EDTA and 1% Triton X-100. Protein concentration was determined using the Bradford Assay, and after SDS-PAGE proteins were transferred using a Trans-Blot Turbo transfer system (Bio-Rad). Anti-FLAG (Cell Signaling, #2368S; 1:500–1000), and anti-GAPDH (Cell Signaling, #2118L; 1:10000) were used as primary antibodies. Anti-Rabbit (Cytiva NA9340; 1:2000) was used as a secondary antibody. Membranes were imaged using a Bio-Rad ChemiDoc MP gel-documentation system with Image Lab 6.0.1.
Immunofluorescence and Imaging
Ten thousand cells were seeded on a coverslip in a 6-well plate in 2 mL of DMEM+FBS. Twenty-four hours later, media was exchanged to 2 mL of DMEM+dFBS ± 300 ng/mL Dox. After an additional twenty-four hours, cells were fixed with 4% paraformaldehyde (PFA) for 15 minutes and washed 3 times with PBS. Cells were then permeabilized with 0.2% Triton X-100 in PBS for 5 minutes, followed by 3 washes in PBST (0.05% Tween20 in PBS), and incubated with blocking buffer (0.2% BSA in PBST) for 20 minutes at room temperature. Cells were incubated with primary antibodies overnight at 4 °C. The next day, cells were washed with PBST 3 times and incubated with secondary antibodies for 2 hours at room temperature. After 2 hours, cells were again washed 3 times with PBST in 5 minutes increments and rinsed with 2 mL of Milli-Q water, airdried and mounted. The following primary antibodies were used: anti-FLAG (Cell Signaling, #2368S; 1:400), anti-HSP60 (Cell Signaling, #12165; 1:2000). Alexa Fluor 488- and Alexa Fluor 568-conjugated secondary antibodies were used. VECTASHIELD mounting medium with DAPI was used to visualize nuclei. Cells were imaged using a Leica TCS SP8 confocal laser scanning microscope with HC Plan APO 63x NA 1.4 oil objective. All images were acquired in LAS X 3.5.7 and analyzed using Fiji ImageJ2 2.14.0 (57).
Stimulated Emission Depletion (STED) Microscopy
Gated STED (gSTED) imaging was acquired by a Leica TCS SP8 STED 3X microscope using a HC PL APO 100 × /1.4 oil immersion STED WHITE objective. The 488 and 647 nm wavelengths of pulsed white laser (80 MHz) were used to excite the Alexa488 and the Alexa647 plus secondary antibodies. The Alexa647 plus was depleted with the 775 nm pulsed depletion laser, while the Alexa488 was depleted with the 592 nm pulsed depletion laser, the maximum power of the laser was around 30%. Resulted images are processed using Fiji ImageJ2 2.14.0 (57). Mitochondrial localization of EcSTH was evidenced by its encapsulation by the mitochondrial outer membrane marker TOM20 as well as the overlap with the mitochondrial matrix marker HSP60 (see Supplementary Information Fig. 4a–d).
Live Cell Imaging Using Biosensors SoNar and iNAP1
Three thousand HeLa cells expressing LUC, LbNOX, EcSTH, or mitoEcSTH were seeded in a black, transparent flat bottom 96-well plates (Greiner Bio-One, 655090) in 100 μl of DMEM+FBS. Twenty-four hours later, medium was replaced with 200 μl of DMEM+dFBS supplemented with 300 ng/mL of Dox and transfected with 20 μL of the biosensor transfection mixture. The mixture contained 15 μg of pCDNA3.1-SoNar, iNAP1 and iNAPC (obtained from Dr. Yi Yang, East China University of Science and Technology, Shanghai, China) and 45 μl FuGENE 6 Transfection Reagent in 1 mL of Opti-MEM medium (typically enough to transfect 40 wells). After an additional twenty-four hours, medium was replaced with 200 μl of the imaging medium [DMEM without pyruvate, fluorescent vitamins and phenol red [DMEM (US Biological, D9800–17), 5 mM glucose, 25 mM HEPES, pH 7.4 and 1% dialyzed FBS]. The live cell imaging of biosensors was performed using BioTek Cytation 10 Confocal Imaging System (Agilent Technologies) equipped with a Sony IMX264 CMOS (WFOV) camera, gas atmosphere control and GFP (excitation 469/35nm, emission 525/39nm) and Oxidized roGFP2 (excitation 400/40nm, emission 525/39nm) imaging filters and cubes. Cells were imaged for every 30s for 5 minutes using an Olympus 20x NA 0.6 air objective, with the LED intensity set at 1. Plates were removed briefly from the instrument, washed twice and imaged again for every 30s for 5 minutes in the imaging medium with 1μM Ant A or medium with 10 mM pyruvate but no glucose. In experiments with iNAP1 and iNAPC, G6PDi-1 at 50 μM, 6-AN at 5 mM or diamide at 80 μM were used to modulate NADPH levels. The ratio of cellular mean intensity of 400/488nm was used to report the NADH/NAD+ ratio (for SoNar) or NADPH levels (for iNAP1). For each timepoint, around 8 region of interest (ROI) images containing about 10 cells were extracted for quantifications using Gen5 3.13 software (Agilent Technologies).
Proliferation Assays
Five thousand or ten thousand cells were seeded in 0.5 mL of DMEM+FBS in 24-well plates. The next day, media was exchanged with 1 mL of DMEM+dFBS supplemented with 300 ng/mL of Dox and other components as indicated. On days 1–4, cells were trypsinized and counted using a Z2 Particle Counter (Beckman Coulter). Alternatively, two thousand cells were seeded in 0.5 mL of DMEM+FBS in black 96-well plates with a transparent flat bottom. The next day media was exchanged with 200 μL of DMEM+dFBS supplemented with 300 ng/mL of Dox and other components as indicated (for hypoxia experiments, plates were transferred to an incubator set to 5% CO2 and 1% or 3% O2). On days 1–4, after media exchange, cells were fixed using 4% PFA in PBS for 15 min, washed twice with PBS, and then kept in 200 μl of PBS supplemented with 1 mg/mL Hoechst as previously described (4). Subsequently, fixed plates were imaged using BioTek Cytation 10 Confocal Imaging System (Agilent Technologies) equipped with a Sony IMX264 CMOS (WFOV) camera, DAPI (excitation 377/50nm, emission 447/60nm) and Zeiss Plan Fluorite 2.5× NA 0.12 objective. Images were processed using Gen5 3.13 software (Agilent Technologies).
Oxygen Consumption
Oxygen consumption rates (OCR) and acidification rates (ECAR) were measured with the Seahorse XFe96 Analyzer using Agilent Seahorse Wave Desktop 2.6 (Agilent Technologies). Cells were seeded at 4–6 ×10³ cells per well in Seahorse 96-well microplates in 80 μL of DMEM+FBS. The medium was replaced the next day with 200 μL of DMEM+dFBS ± 300 ng/mL of Dox. Twenty-four hours later, medium was replaced with 200 μL of the Seahorse assay medium [pyruvate free DMEM (US Biological, D9802), 10% dialyzed FBS, and 25 mM HEPES-KOH, pH 7.4]. Basal measurements were collected 6 times, and 5 measurements were collected after injection of antimycin A (final concentration 1 μM). For the stress test assay, basal measurements were collected 4 times, followed by measurements in the presence of oligomycin A, FCCP, and piericidin A + antimycin A (injected in this order at a final concentration of 1 μM). After each assay, the Seahorse 96-well plates were extensively washed with PBS, and the BCA assay was used to quantify protein content.
Determination of Total Cellular NADH/NAD+ and NADPH/NADP+ Ratios
Two-four hundred thousand cells were seeded in 6-cm dishes in 2 mL of DMEM+FBS. Twenty-four hours later, media was exchanged with 3 mL of DMEM+dFBS and 300 ng/mL of Dox, and cells were then returned to the incubator (dishes were transferred to the incubator set at 5% CO2/1% O2 for hypoxia experiments). After an additional twenty-four hours, media was exchanged with fresh DMEM+dFBS and 300 ng/mL of Dox that was incubated overnight at 5% CO2. No final media exchange was performed for hypoxia experiments. Three hours later, 6-cm dishes were placed on ice, washed with 3 mL of ice-cold PBS (no PBS wash was performed for hypoxia experiments), and lysed with 0.5 mL of 1:1 mixture of PBS and 1% dodecyltrimethylammonium bromide (DTAB) in 0.2 M NaOH. Samples were processed as previously described (5), transferred to all-white 96-well plates, and luminescence was measured over 1.5 hours using EnVision (Perkin Elmer) or Infinite 200 (Tecan) plate readers.
Determination of Total Cellular GSH/GSSG Ratios
Five thousand cells were seeded in 0.2 mL of DMEM+FBS in a black 96-well plate with a clear bottom. Twenty-four hours later, media was exchanged with 0.2 mL of DMEM+dFBS ± 300 ng/mL Dox. After an additional twenty-four hours, media was exchanged with DMEM+dFBS ± 300 ng/mL Dox that was incubated overnight at 5% CO2. To selected wells, 200 μM menadione (vitamin K3) was also added. Three hours later, cells were lysed with 60 μL of either Total Glutathione Lysis Reagent or Oxidized Glutathione Lysis Reagent (GSH/GSSG-Glo Assay kit). After lysis, 50 μL of sample was transferred to an all-white 96-well plate and topped with 50 μL of Luciferin Generation Reagent. After a 30 min incubation, 50 μL of Luciferin Detection Reagent was added to each well. Luminescence was read over 1.5 hour using Infinite 200 (Tecan) plate reader with T-control 2.0.
Measurements of Reactive Oxygen Species (ROS)
Six thousand cells were seeded in 0.2 mL of DMEM+FBS in a black 96-well plate with a clear bottom (Corning, 3904). Twenty-four hours later, media was exchanged with 0.2 mL of DMEM+dFBS ± 300 ng/ml Dox. After an additional twenty-four hours, cells were washed in the assay medium [DMEM free from phenol red, pyruvate, folic acid, niacinamide, pyridoxal, riboflavin and thiamine (US Biological, D9800–17), 25 mM HEPES-KOH, pH 7.4, 10% dialyzed FBS and 25 mM glucose]. CellROX Green Reagent was added to the assay medium (5 μM final concentration), and cells were then returned to the incubator. After 30 minutes, cells were washed three times in the assay medium, and 200 μM menadione (vitamin K3) or 2 μM antimycin A were added to selected wells. Fluorescence (Ex/Em 485 nm/535 nm) was recorded over 3 hours using Infinite 200 (Tecan) plate reader. Additional measurements were taken using MitoSOX Red mitochondrial superoxide indicator (5 μM final concentration). After incubation with MitoSOX Red for 20 min, the 96-well plate was washed 3 times with assay medium, and 200 μM K3 or 2 μM antimycin A were added to selected wells. Fluorescence (Ex/Em 485 nm/580 nm) was recorded over 3 hours using Infinite 200 (Tecan) plate reader. For H2O2 measurements to each well containing cells in 50 μL of the assay medium [± 2 μM antimycin, ± 200 μM vitamin K3], another 50 μl of solution was added [48.5 μl of the Amplex Red Hydrogen Peroxide/Peroxidase Assay Kit 1X Reaction Buffer, 0.5 μL of Amplex Red (10 mM stock) and 1 μL of HRP (10 U/mL stock)]. Fluorescence (Ex/Em 540 nm/590 nm) was recorded over 3 hours using Infinite 200 (Tecan) plate reader. For each experiment, an identical control 96-well plate was prepared and was used to determine protein content in each well using BCA assay.
Measurements of Lactate and Pyruvate in Spent Media using LC-MS
In the same experiments where cellular NADH/NAD+ and NADPH/NADP+ ratios were determined, spent media was collected (3 hours after fresh DMEM+dFBS exchange, see above). Thirty μL of spent media was mixed with 70 μL of ice-cold acetonitrile and 20 μL of internal standard mix containing: 50 μM 13C3 pyruvate and 5 mM 13C3 lactate. Tubes were vortexed for 1 min and then set at −20°C for 20 min. The samples were run on an Agilent 6495 QqQ with jet stream coupled to an Agilent 1290 LC stack with an Agilent HILIC-Z (2.1×150mm) column (Center for Mass Spectrometry and Metabolomics, TSRI). The mobile phase was composed of A= 10 mM NH4OAc, 20 μM deactivator, pH=9 and B= 85:15 ACN/H2O 10 mM NH4OAc, 20 μM deactivator, pH=9. The gradient started at 100 % B (0–1 min), decreasing to 60 % B (1–5 min) and was followed by an isocratic step (6 min – 10 min) before a 5 min post-run for column re-equilibration. The flowrate was set to 250 μL/min, and the sample injection volume was 10 μL. Operating in negative mode, the source conditions were as follows: drying gas temperature set to 200 °C with a flowrate of 11 L/min, sheath gas temp set to 300 °C with a sheath gas flowrate of 12 L/min, neb pressure set to 35 psi, cap voltage set to 3000V, and nozzle voltage set to 0V. Data was processed using Agilent MassHunter Quantitative analysis software.
Metabolomic Profiling and Stable Isotope Tracing
One-three hundred thousand HeLa or C2C12 Tet-On 3G cells were seeded in a 6-well plate in 2 mL of DMEM+FBS. Twenty-four hours after seeding, media was exchanged to 2 mL of DMEM+dFBS ± 300 ng/ml Dox. After an additional twenty-four hours, cells were removed from the incubator, placed on ice, lysed (without a PBS wash) with 1 mL of ice cold 80% methanol/20% water solution containing 1.5 μM metabolomics amino acid mix (Cambridge Isotope Laboratories, MSK-A2–1.2). Immediately after, 6-well plates were transferred to −80°C and incubated overnight. The 6-well plates were scraped the next day, and all material was transferred to 1.5 mL Eppendorf tubes and dried in a SpeedVac. For stable isotope tracing experiments, twenty-four hours following Dox addition, cells were incubated for additional eight hours in 2 mL of DMEM without glucose, glutamine, serine, glycine and pyruvate (USBiological, D9802–01) supplemented with 0.4 mM serine, 0.4 mM glycine, 2 mM glutamine, 25 mM U-13C glucose, 10% dialyzed FBS and 300 ng/ml Dox or in 2 mL of DMEM without glucose, glutamine, serine, glycine and pyruvate supplemented with 0.4 mM serine, 0.4 mM glycine, 25 mM glucose, 2 mM U-13C glutamine, 10% dialyzed FBS and 300 ng/ml Dox. For metabolomic profiling and stable isotope tracing analysis using LC-MS, dried extracts were resuspended in 60 μL of water. Samples were vortexed, incubated on ice for 20 min and clarified by centrifugation at 20,000xg for 20 min at 4 °C. Ion pair LC–MS analysis was performed on a 6230 TOF mass spectrometer (Agilent Technologies) in negative ionization mode using a XSelect HSS T3, 150 × 2.1 mm, 3.5 μm particle size (Waters), and using a gradient of solvent A (5 mM octylamine and 5 mM acetic acid in water) and solvent B (5 mM octylamine and 5 mM acetic acid in methanol), with a post-column flow consisting of a blend of acetone:DMSO (90:10) at 300 μL/min. The analytical gradient was 0–3.5 min, 1% B; 4–15 min, 35% B; 20–22 min, 100% B; 22–27 min, 1% B. Other LC parameters were as follows: flow rate: 300 μL/min, column temperature: 40°C, and injection volume: 5 μL. MS parameters were as follows: gas temp: 250°C; gas flow: 9 L/min; nebulizer pressure: 35 psi; sheath gas temp: 250°C; sheath gas flow: 12 L/min; VCap: 3500 V; and fragmentor: 125 V. Data were acquired from 50 to 1700 m/z with active reference mass correction (m/z: 119.0363 and 966.0007) infused through a second nebulizer. Peak identification and integration were done based on exact mass and retention time match to commercial standards. Data analysis for both targeted profiling and stable isotope tracing was performed with MassHunter Profinder software v10.0 (Agilent Technologies) and Skyline v22.2. Natural abundance correction for stable isotope tracing analysis was done using the R package IsoCorrectoR. The YSI 2950 Biochemistry Analyzer (SBP Discovery, La Jolla, CA) was used to measure glucose, glutamine, lactate in DMEM+dFBS media which was incubated with cells for 24 h.
Expression and Purification of Recombinant EcSTH
E. coli BL21 (DE3) cells transformed with the pET30a-Hisx6-EcSTH-FLAG vector were grown at 37°C in six 2.8-L flasks, each containing 1 L of Terrific Broth (TB) medium supplemented with 50 μg/mL kanamycin. When absorbance at 600 nm reached 0.4–0.6, the temperature was decreased to 15°C, and cells were grown for an additional 2 hours before protein expression was induced with 0.1 mM isopropyl β-D-1-thiogalactopyranoside. For protein purification the cell pellet was resuspended in 350 mL of the lysis buffer (50 mM Na2HPO4, pH 8.0, 500 mM NaCl and 30 mM imidazole), and affinity chromatography was performed using a column with 35 mL of Ni Sepharose 6 Fast Flow (Cytiva). For the Source 15Q anion-exchanger step, protein was eluted with the gradient of 50–350 mM NaCl in 50 mM Na2HPO4, pH 7.5. The most active EcSTH fractions were pooled and subjected to size-exclusion chromatography on a HiLoad 16/600 Superdex 200 equilibrated with 50 mM HEPES-NaOH pH 7.5 and 150 mM NaCl (buffer A). Analytical size-exclusion chromatography was performed using a Superdex 200 Increase 10/300 GL column equilibrated in buffer A. All chromatographic steps were performed using an NGC Quest 10 Plus (Bio-Rad) chromatography system operated with Chromlab 6.0. A calibration curve was produced using thyroglobulin (669 kDa), ferritin (440 kDa), beta amylase from sweet potato (200 kDa), aldolase (158 kDa), conalbumin (75 kDa), bovine albumin (66 kDa) and ovalbumin (44 kDa). The molecular weight of EcSTH was determined to be 650 ± 30 kDa using size-exclusion chromatography, indicating that the protein is a dodecamer in solution.
UV-Visible Spectroscopy and Activity Assays of Recombinant EcSTH
UV-visible spectra were recorded on a Cary 3500 spectrophotometer (Agilent Technologies) using Carry UV workstation 1.3.4. EcSTH (10–20 μM FAD active sites) in buffer A was incubated at 24 °C, and 3 mM sodium dithionite was added under aerobic conditions. An extinction coefficient (ε450 =11.3 mM−1cm−1) was used to quantify FAD. Activity of EcSTH was monitored in the presence of thio-NAD+ or thio-NADH by following the absorbance at 398 nm (ε398 =11.3 mM−1cm−1). Michaelis–Menten analysis was performed by varying one substrate (5–1000 μM) while a second co-substrate was kept constant at 200 μM as indicated in (Supplementary Information Fig. 3d). A reaction mixture containing 0.2 mL of buffer A was incubated for 3 min at 37 °C before both substrates and enzyme (0.3–0.6 μg) were added. The multiwavelength option of Cary 3500 spectrophotometer allowed simultaneous monitoring of both 340 and 398 wavelengths.
RNA-Sequencing
Five hundred thousand cells were seeded in 10 cm dishes in 10 mL of DMEM+FBS. Twenty-four hours later, media was exchanged with 10 mL of DMEM+dFBS with 300 ng/mL Dox. Twenty-four hours after Dox addition, cells were harvested, and were snapfrozen. Samples were submitted to GENEWIZ for NGS RNA sequencing. The integrity of RNA was analyzed on Agilent Bioanalyzer, based on the integrity of the 18S and 28S ribosomal sequences. All groups passed with an RNA integrity number (RIN) value of 9 or above. All RNA Libraries from each group were sequenced on an Illumina HiSeq X instrument, generating 2× 150 bp paired end reads. Using Trimmomatic v.0.36, sequence reads were trimmed to remove possible adapter sequences and nucleotides with poor quality. Using the STAR aligner v.2.5.2b., the trimmed reads were mapped to the H. sapiens GRCh38 reference genome. Unique gene hit counts were calculated by using feature Counts from the Subread package v.1.5.2. The hit counts were summarized and reported using the gene_id feature in the annotation file. Only unique reads that fell within exon regions were counted. If a strand-specific library preparation was performed, the reads were strand-specifically counted. Counts were then processed in R using the DESeq2 package (58). Gene log2 fold changes were calculated based on log2(Group 2 mean normalized counts/Group 1 mean normalized counts) as implemented in DESeq2. P-values were derived from the Wald test and adjusted using the Benjamini and Hochberg method. Genes with an adjusted p-value < 0.05 and absolute log2 fold change >1 were recognized as differentially expressed genes.
Using ggplot2 packages in R, volcano plots were generated to display the global differentially expressed genes across the compared groups. Each data point in the scatter plot represents a gene. The log2 fold change of each gene is represented on the x-axis and the minus log10 of its adjusted p-value is represented on the y-axis. Genes with an adjusted p-value less than 0.05 and a log2 fold change greater than 1 are indicated by red dots, representing up-regulated genes. Genes with an adjusted p-value less than 0.05 and a log2 fold change less than −1 are indicated by blue dots, representing down-regulated genes. Genes without significant changes are indicated by gray dots. The most significantly changed genes are named in each volcano plot (Fig. 4a–d). Gene ontology clusters were formed using comparisons of significantly changed genes in EcSTH expressing cells to those in luciferase expressing cells, and the enrichment of gene ontology terms was tested using Fisher exact test (GeneSCF v1.1-p2). Significantly changed gene sets were defined by a Benjamini-Hochberg adjusted p-value <0.05, differentially expressed gene sets (up to 20 terms) are shown in a bar graph (Fig. 4e). The individual genes from the top 2 differentially expressed gene sets, the GO:0055114õxidation-reduction process and GO:0006695~cholesterol biosynthetic process, were highlighted in the volcano plot in different colors (Fig. 4f). The overlap of these two gene sets is presented in a Venn diagram (Extended Data Fig. 8a).
Determination of GDF15 Levels in Mice
All animal experiments were approved by the Massachusetts General Hospital Institutional Animal Care and Use Committee and followed all relevant ethical regulations. C57BL6/J male mice were purchased from Jackson Laboratories and were allowed to acclimate for one week in the animal facility before experimentation. All mice were fed with a standard chow diet (Prolab Isopro RMH3000 5P75), water ad libitum, and maintained in an environment with 12/12 h light/dark cycle, controlled humidity at 20–22 °C. Seven-week-old male mice were injected retro-orbitally with 2 × 10⁹ PFUs of adenoviruses containing GFP or EcSTH under CMV promoter (Vector Biolabs, PA, USA). Four days later, mice were sacrificed after 4 hours of fasting for tissue harvest. Total RNA was extracted from liver tissue using the RNeasy Mini kit (Qiagen, Hilden, Germany). Reverse transcription of RNA to synthesize complementary DNA was performed using the Verso cDNA synthesis kit (ThermoFisher Scientific, MA, USA). Quantitative PCR was performed using iTaq Universal SYBR Green Supermix (Bio-Rad, CA, USA) and corresponding gdf15 primers (see Supplementary Table 5). PCR initial heat activation was run for 2 min at 95 °C, then qPCR reactions were run for 40 cycles of 95 °C for 15 s and 60 °C for 60 s (combined annealing/extension) using QuantStudio™ 6 Pro instrument (Applied Biosystems, MA, USA). Gene expression was quantified using the 2−ΔΔCq method normalized to gapdh as a reference gene.
Statistical Analysis
For repeated measurements, a Welch ANOVA followed by unpaired t test or a One-Way ANOVA followed by uncorrected Fisher’s least significant difference test were performed using a built-in statistical package in GraphPad Prism 9.3.1. Each experiment presented was repeated independently at least three times with similar results. Exact p values are indicated. Each dot in a bar graph represents a biological replicate. All error bars displayed in the figures represent standard deviation (S.D.).
DATA AND CODE AVAILABILITY:
RNA-seq data presented in this work are available at the Gene Expression Omnibus database under accession number GEO: GSE232115. The H. sapiens GRCh38 reference genome was used for mapping RNA-seq reads. Source data for figures, extended data and supplementary figures are provided with this paper.
Extended Data
Extended Data Fig. 1.
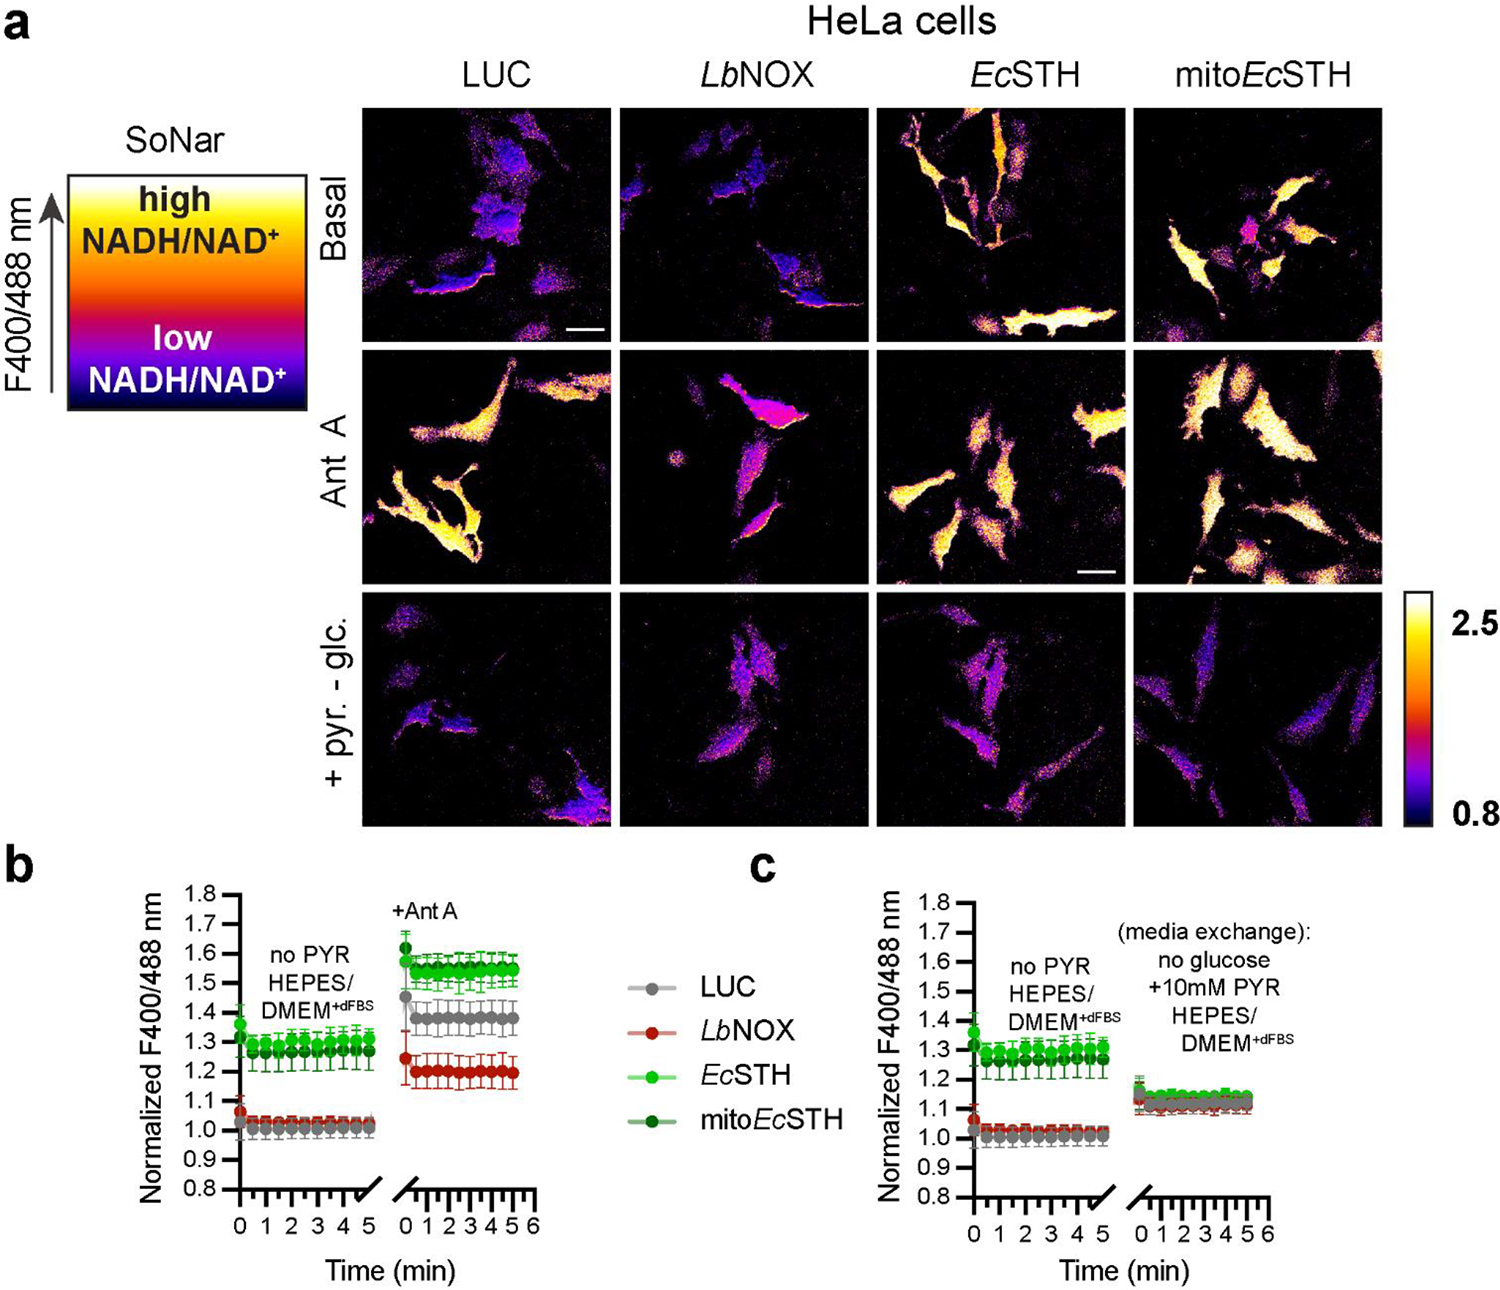
(a) Left panel is a schematic representation of live cell imaging using genetically encoded biosensor SoNar. The fluorescence intensity of the SoNar channel is represented in pseudocolor. The ratio of fluorescent intensities from excitation at 400 and 488 nm reflects cellular NADH/NAD+ ratio. High F400/488 ratio corresponds to high cellular NADH/NAD+ ratio and vice versa. To the right are widefield images of HeLa cells with lentivirus mediated LUC, LbNOX, EcSTH, mitoEcSTH expression under Dox control transiently expressing SoNar, in basal medium (DMEM without pyruvate, fluorescent vitamins and phenol red with 5 mM glucose, 25 mM HEPES, pH 7.4 and 1% dialyzed FBS), or after addition of 1 μM Ant A, or when cells were switched to the basal medium without glucose but with 10 mM pyruvate. Scale bars: 50 μm. (b-c) Quantification of the time course measurements of the fluorescence ratio (F400/488) for HeLa cells with lentivirus mediated LUC, LbNOX, EcSTH, mitoEcSTH expression under Dox control transiently expressing SoNar for conditions shown in (a). Values are mean ± s.d.; n = 8, 8, 10, 10 in (b), n = 7, 6, 6, 7 in (c) biologically independent samples.
Extended Data Fig. 2.
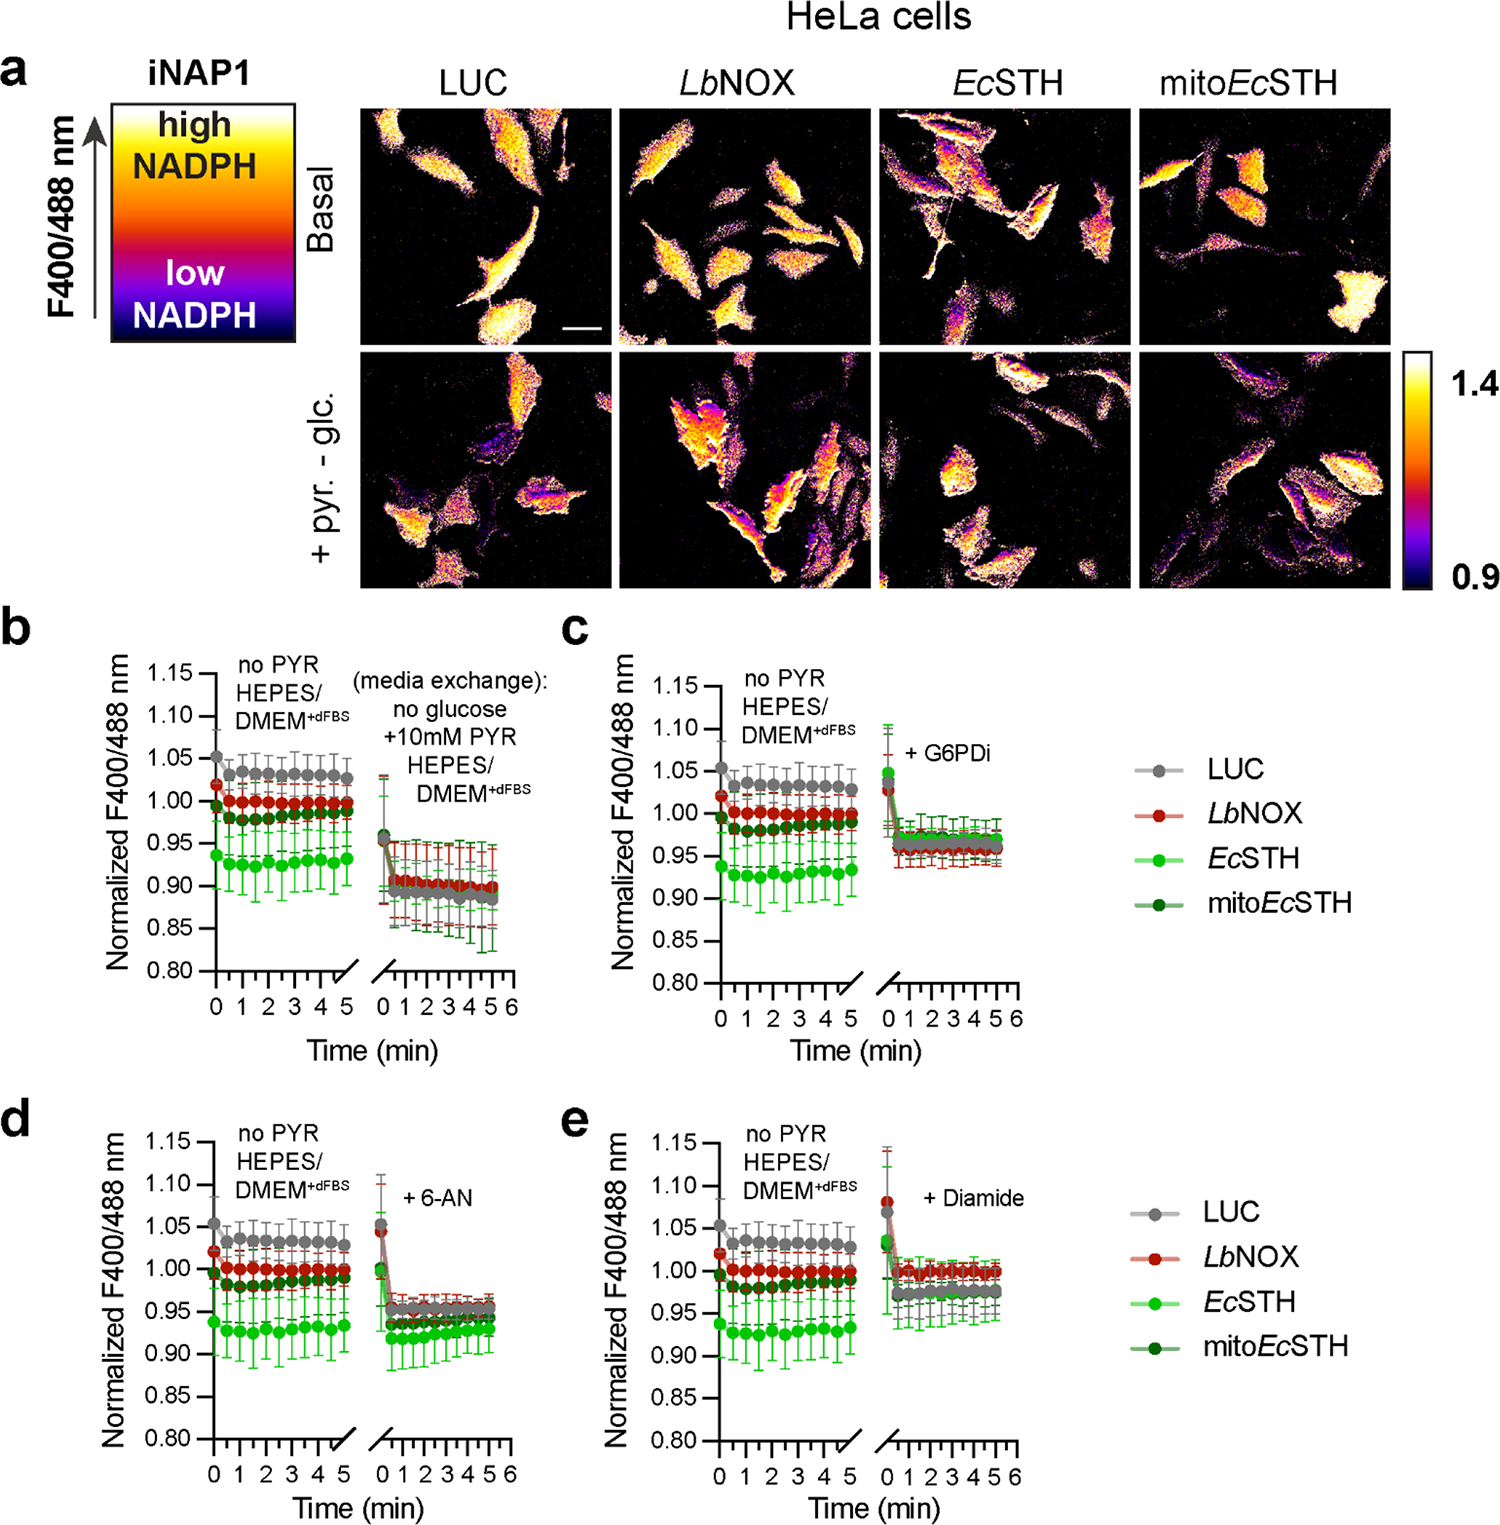
(a) Left panel is a schematic representation of principle of live cell imaging using genetically encoded biosensor iNAP1. The fluorescence intensity of the iNAP1 channel is represented in pseudocolor. The ratio of fluorescent intensities from excitations at 400 and 488 reflects cellular levels of NADPH. High F400/488 ratio corresponds to high NADPH and vice versa. To the right are widefield images of HeLa cells with lentivirus mediated LUC, LbNOX, EcSTH, mitoEcSTH expression under Dox control transiently expressing iNAP1, in basal medium (DMEM without pyruvate, fluorescent vitamins and phenol red with 5 mM glucose, 25 mM HEPES, pH 7.4 and 1% dialyzed FBS), or when cells were switched to the basal medium without glucose but with 10 mM pyruvate. Scale bars: 50 μm. Quantification of the time course measurements of the fluorescence ratio (F400/488) for HeLa cells with lentivirus mediated LUC, LbNOX, EcSTH, mitoEcSTH expression under Dox control transiently expressing iNAP1 in the basal medium followed by replacement with basal medium without glucose but with 10 mM pyruvate (b), after addition of G6PDi (c), after addition of 6-AN (d), or after addition of diamide (e). Values are mean ± s.d.; n = 9, 8, 8, 8 in (b), n = 8, 8, 8, 8 in (c), n = 8, 8, 8, 8 in (d), n = 8, 9, 7, 8 in (e) biologically independent samples.
Extended Data Fig. 3.

Oxygen consumption rate (OCR) (a) and extracellular acidification rate (ECAR) (b) of HeLa cells expressing EcSTH and mitoEcSTH before and after addition of 1 μM antimycin A (ANT) measured in pyruvate free HEPES/DMEM+dFBS media. Values are mean ± s.d.; n = 12, 12, 12, 10 for OCR traces in (a), n = 4 for bar graphs depicting OCR quantification in (a), n = 12, 12, 12, 10 for ECAR tracers in (b), n = 4 for bar graphs depicting ECAR quantification in (b) biologically independent samples. The statistical significance indicated for (a-b) represents a One-Way ANOVA followed by uncorrected Fisher’s least significant difference test.
Extended Data Fig. 4.
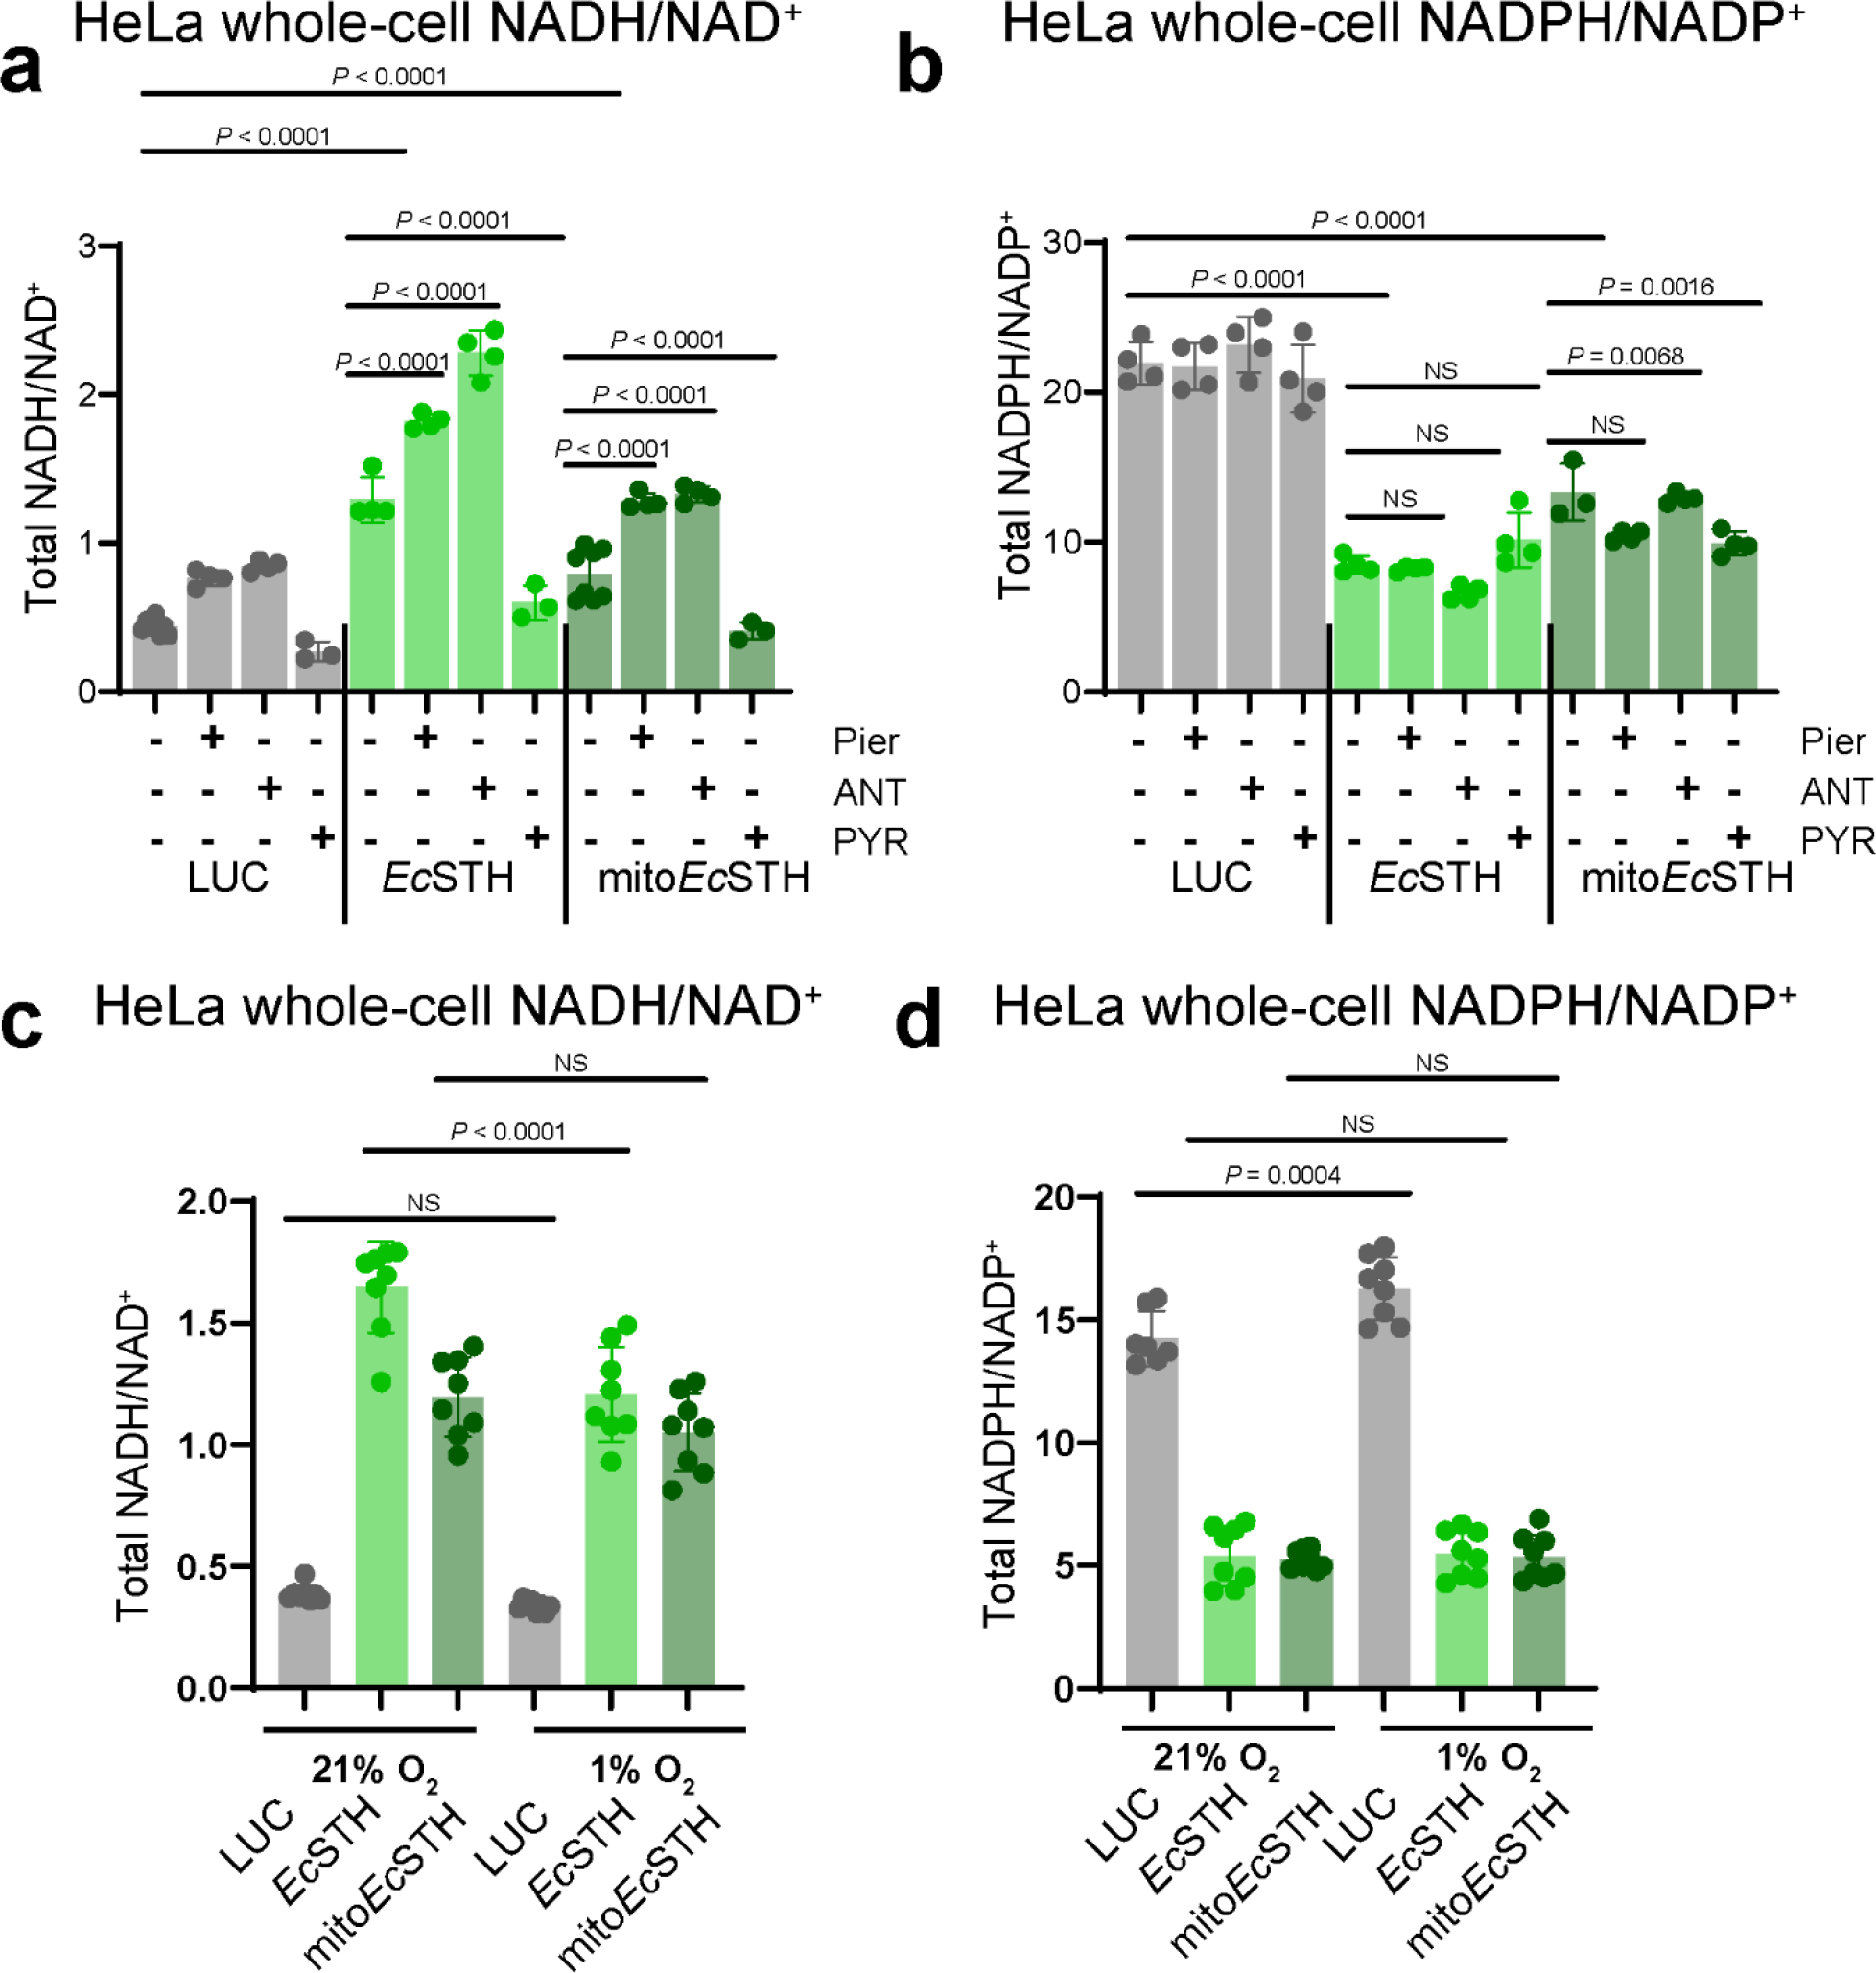
The total NADH/NAD+ (a) and NADPH/NADP+ (b) ratios measured in HeLa cells expressing EcSTH and mitoEcSTH three hours after changing to fresh pyruvate-free DMEM+dFBS with 1 μM antimycin A (ANT), 1 μM piericidin A (Pier), or 1 mM pyruvate (PYR). The total NADH/NAD+ (c) and NADPH/NADP+ (d) ratios measured in HeLa cells expressing EcSTH and mitoEcSTH incubated for 24 hours at 5%CO2/1%O2 hypoxia. Values are mean ± s.d.; n = 8, 4, 4, 3 4, 4, 4, 3, 8, 4, 4, 3 in (a), n = 4 in (b-d) biologically independent samples. The statistical significance indicated for (a-d) represents a One-Way ANOVA followed by uncorrected Fisher’s least significant difference test. NS, no significant difference.
Extended Data Fig. 5.
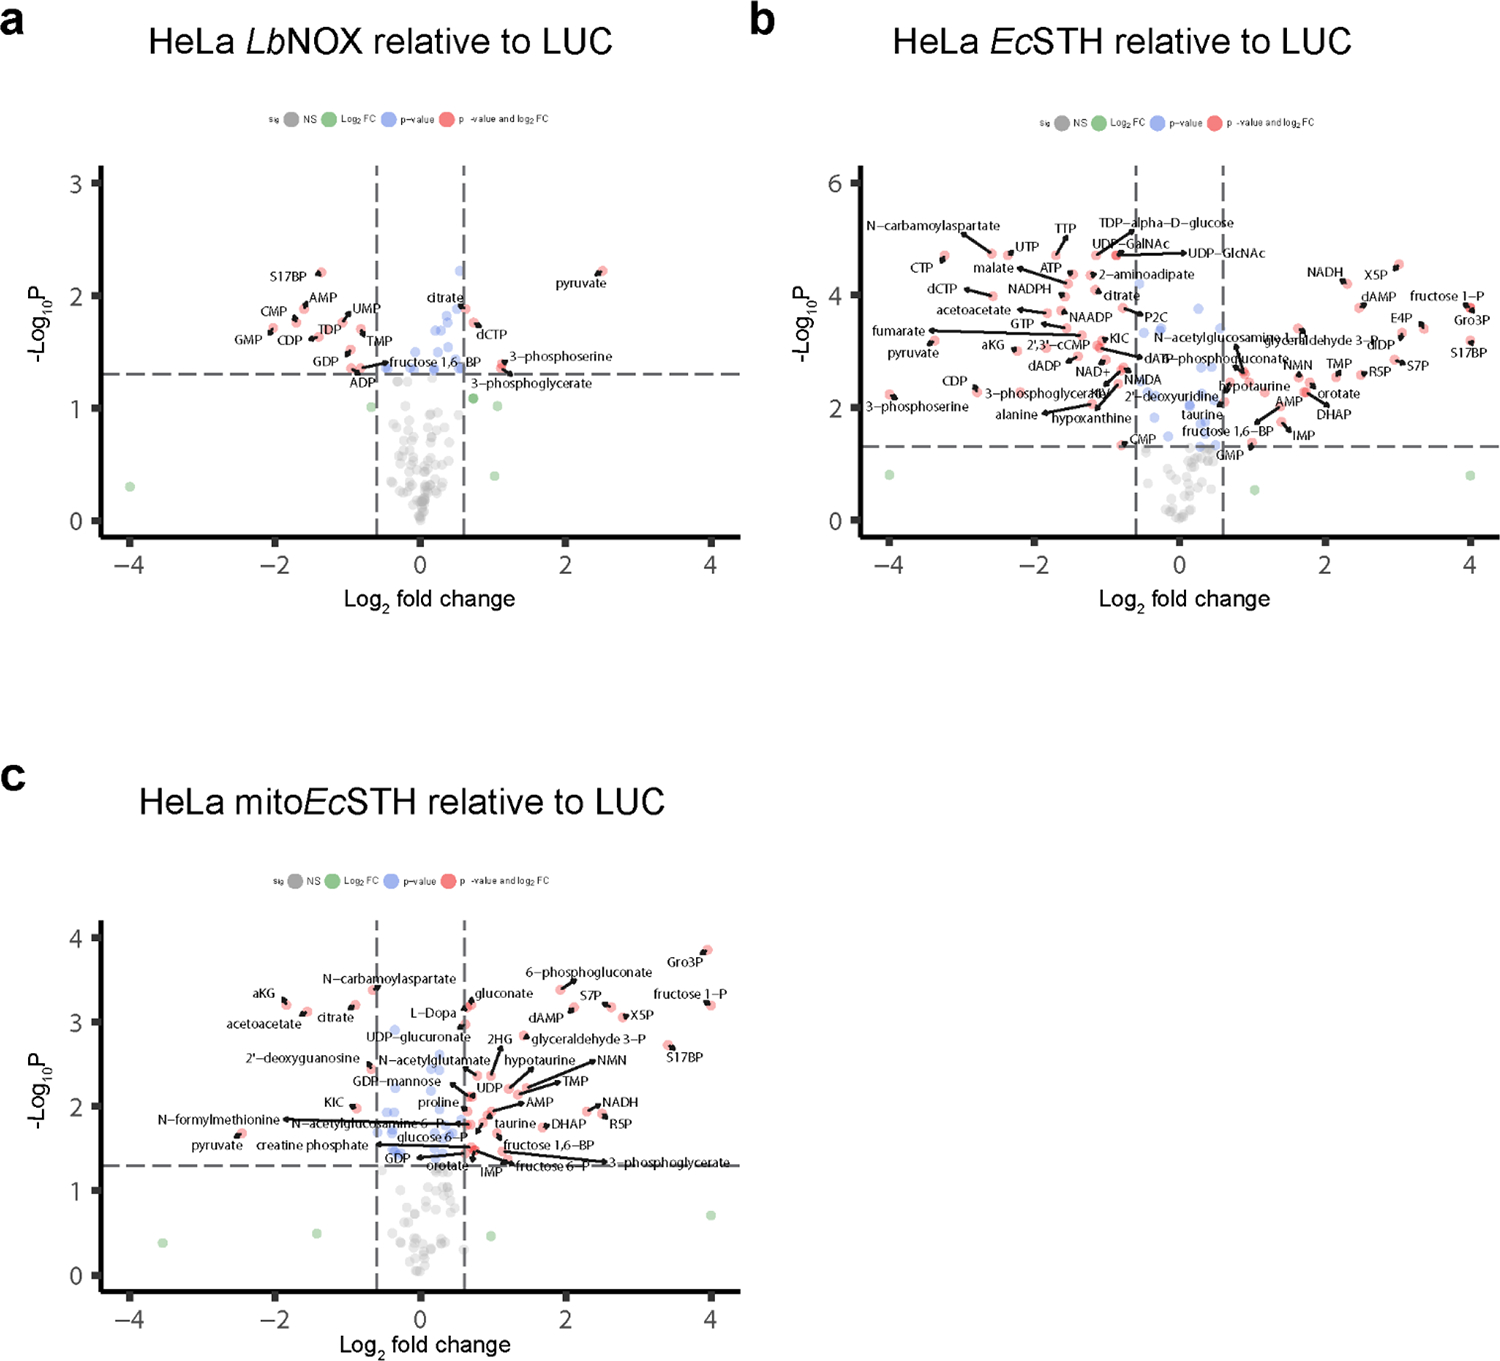
Targeted metabolomics in HeLa cells expressing LbNOX (a), EcSTH (b) and mitoEcSTH (c). LUC expressing HeLa cells were used as a control in (a-c). The statistical significance indicated for (a-c) represents p value cutoff = 0.05, fold change cutoff = 1.5 and Welch t test (FDR corrected).
Extended Data Fig. 6.
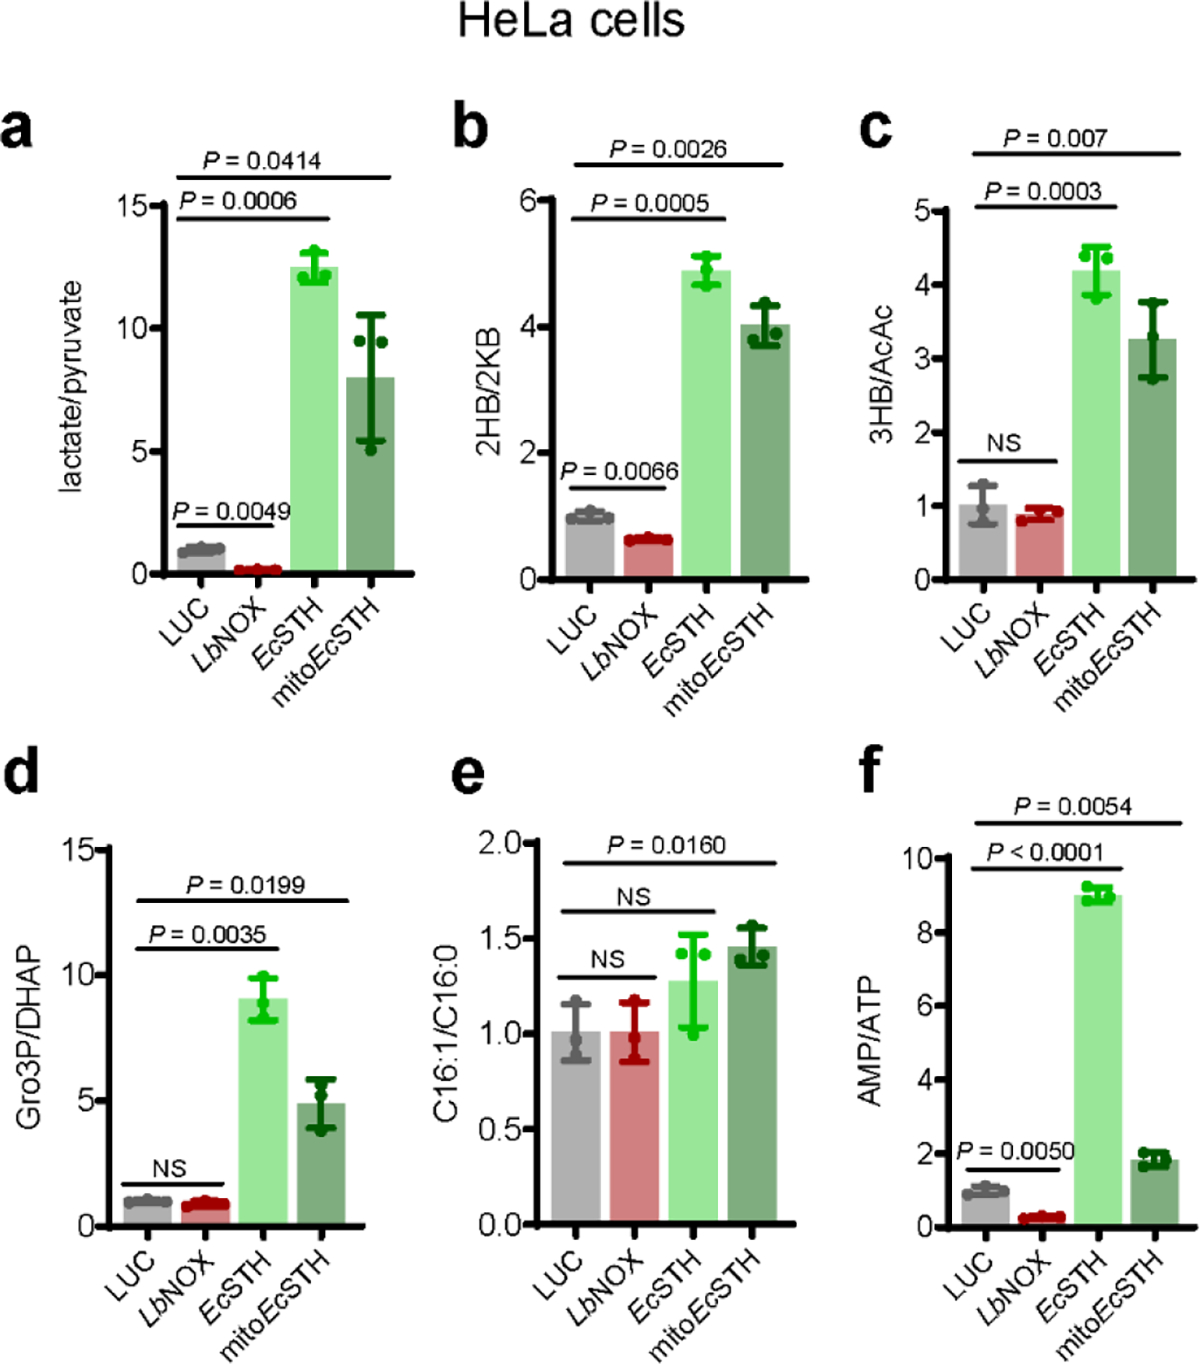
Intracellular lactate/pyruvate (a), 2-hydroxybutyrate/2-ketobutyrate (2HB/2KB) (b), 3-hydroxybutyrate/acetoacetate (3HB/AcAc) (c), glycerol 3-phosphate/dihydroxyacetone phosphate (Gro3P/DHAP) (d), C16:1/C16:0 (e) and AMP/ATP (f) ratios measured in HeLa cells expressing EcSTH and mitoEcSTH. In (a-f) values are mean ± s.d.; n = 3 biologically independent samples. Statistically significant differences were calculated by using a Welch ANOVA followed by unpaired t test. NS, no significant difference.
Extended Data Fig. 7.
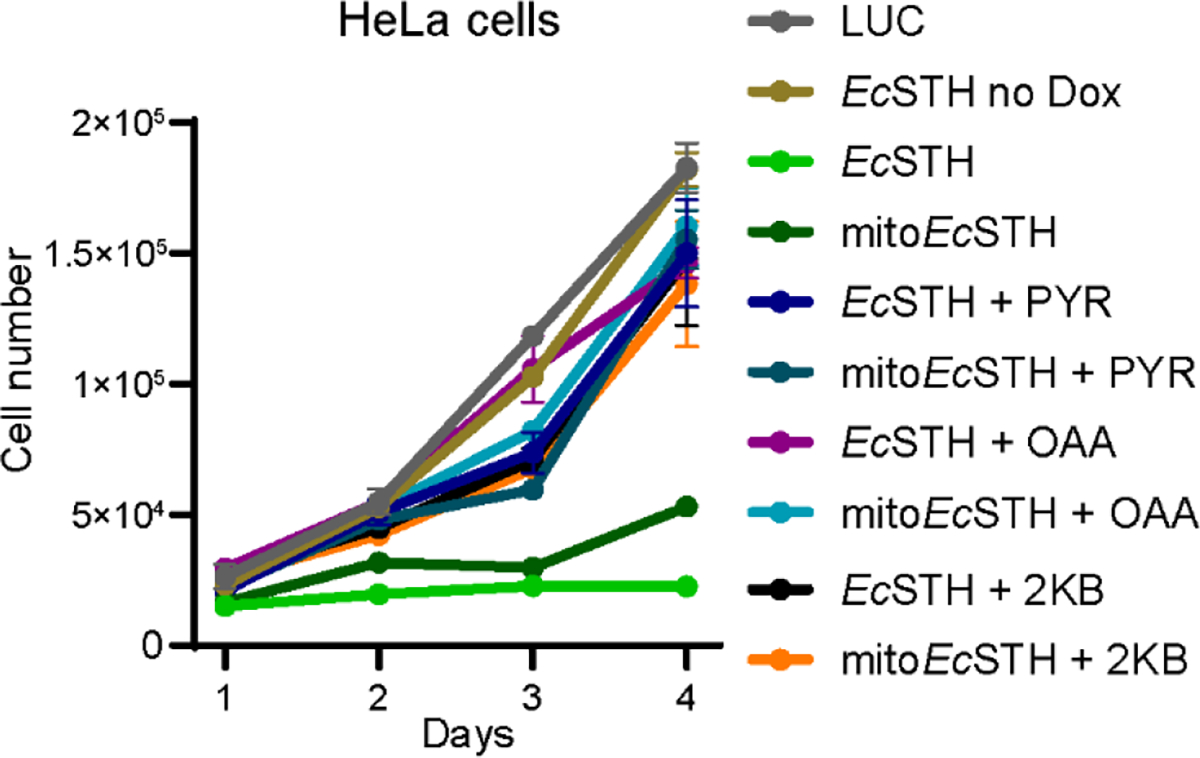
Proliferation of HeLa cells with EcSTH and mitoEcSTH expression in DMEM+dFBS when supplemented with exogenous electron acceptors (10 mM pyruvate (PYR), 10 mM oxaloacetate (OAA) or 10 mM α-ketobutyrate (2KB)). Values are mean ± s.d.; n = 3 biologically independent samples.
Extended Data Fig. 8.
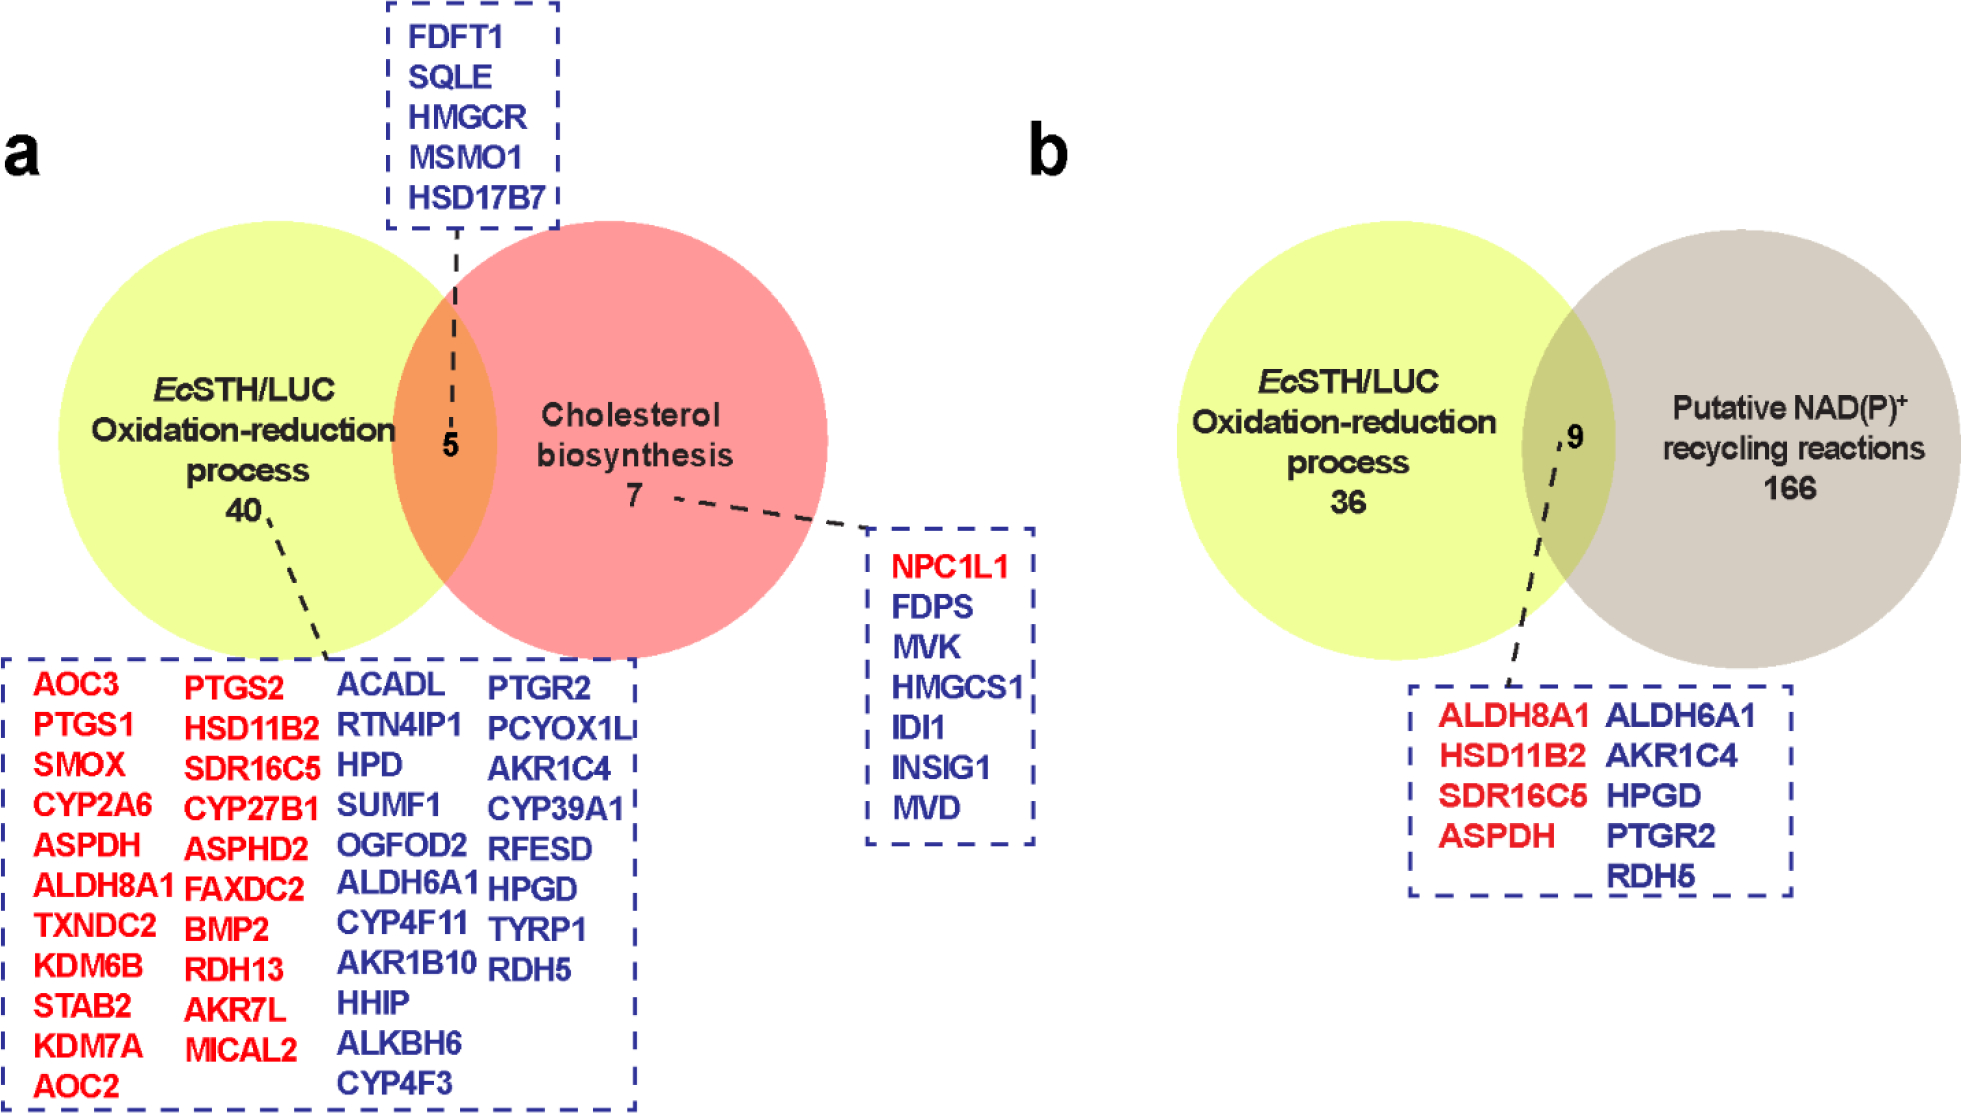
(a-b) Venn diagrams displaying the similarities and differences of genes from indicated gene sets. Yellow circles include all genes in the GO term “oxidation-reduction” pathways (see Fig. 4e). The salmon circle contains all genes in the GO term “cholesterol biosynthetic” pathways (see Fig. 4e). The light brown circle indicates the NAD(P)ome (genes in humans that encode NAD+ or NADP+ dependent enzymes as defined in (27)). The up-regulated genes are marked in red and down-regulated genes are marked in blue.
Extended Data Fig. 9.
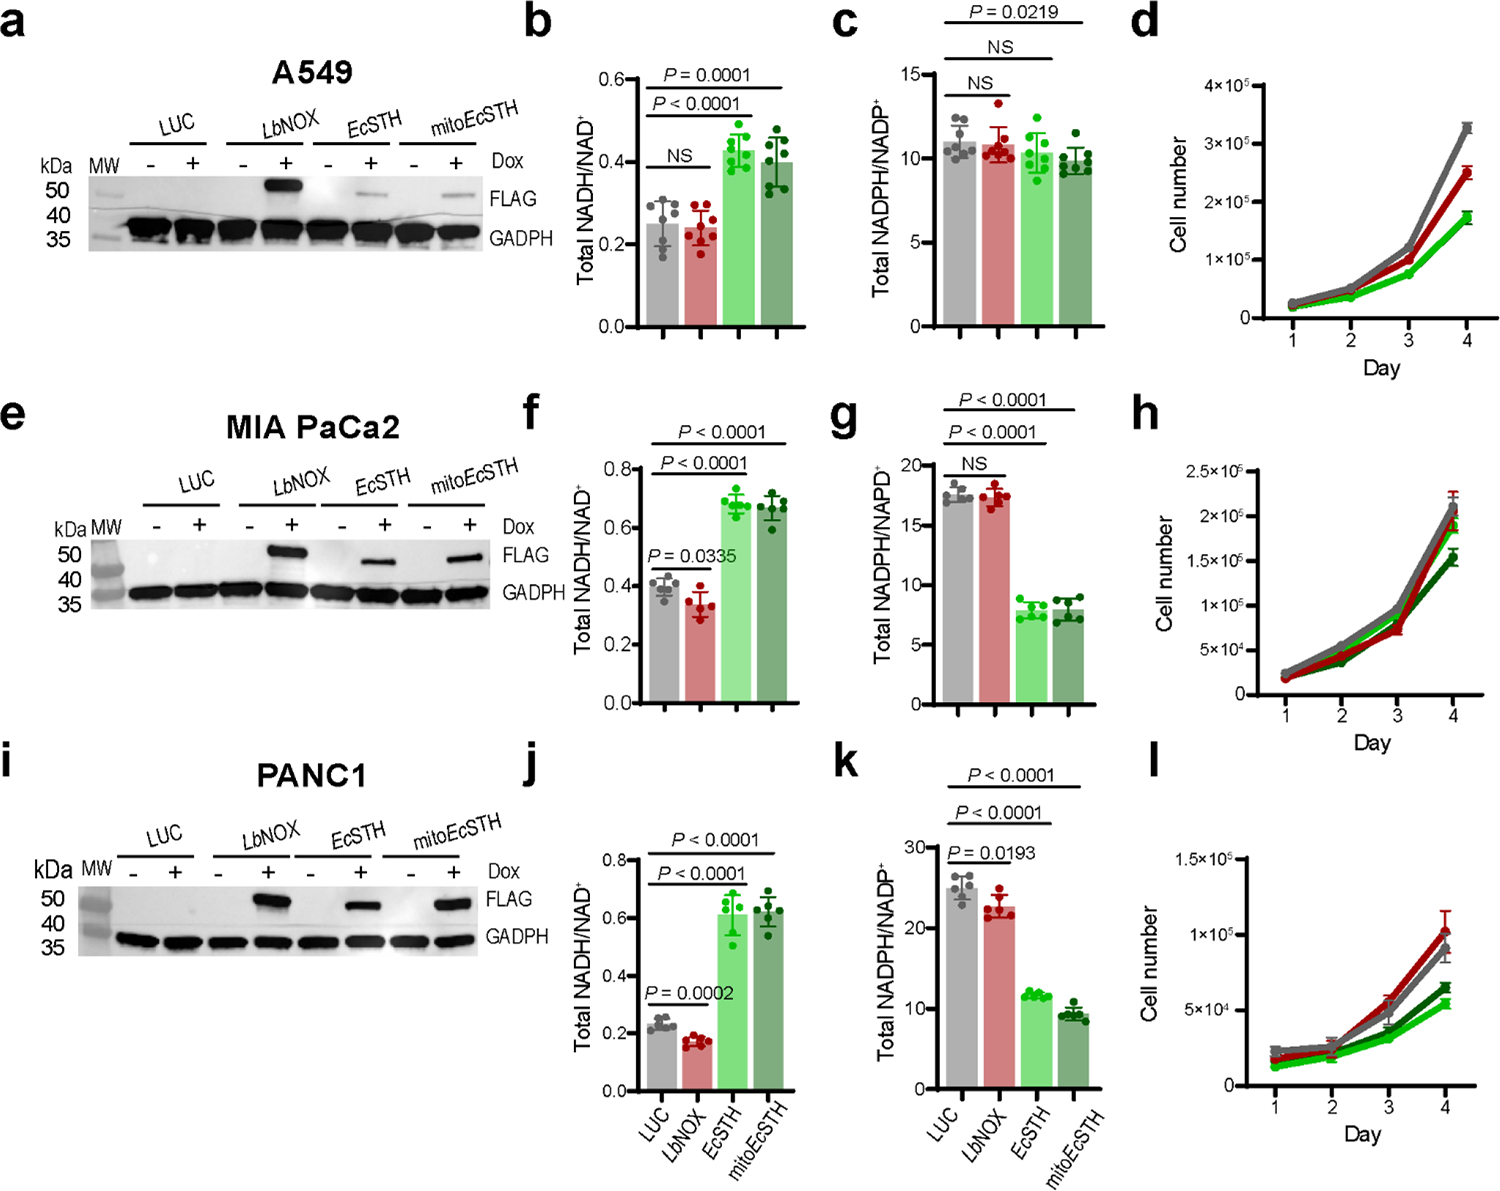
Western blot analysis of EcSTH and mitoEcSTH expression in A549 lung adenocarcinoma cells (a), MIA PaCa-2 epithelial tumor tissue of the pancreas (e) and PANC-1 pancreatic duct epithelioid carcinoma (i). (a, e, i) Representative blots are shown. The total NADH/NAD+ ratios in A549 (b), MIA PaCa-2 (f) and PANC-1 (j) cells expressing EcSTH and mitoEcSTH. The total NADPH/NADP+ ratios in A549 (c), MIA PaCa-2 (g) and PANC-1 (k) cells expressing EcSTH and mitoEcSTH. Proliferation of A549 (d), MIA PaCa-2 (h) and PANC-1 (l) cells expressing EcSTH and mitoEcSTH in pyruvate-free DMEM+dFBS. LUC and LbNOX expressing HeLa cells were used as controls in (a-l). Values are mean ± s.d.; n = 8 in (b-c), n = 6 in (f, g, j, k) biologically independent samples. The statistical significance indicated for (b, c, f, g, j, k) represents a Welch ANOVA followed by unpaired t test. NS, no significant difference. For growth curves (d, h, l) error bars represent mean ± s.d.; n = 3 biologically independent samples.
Extended Data Fig. 10.
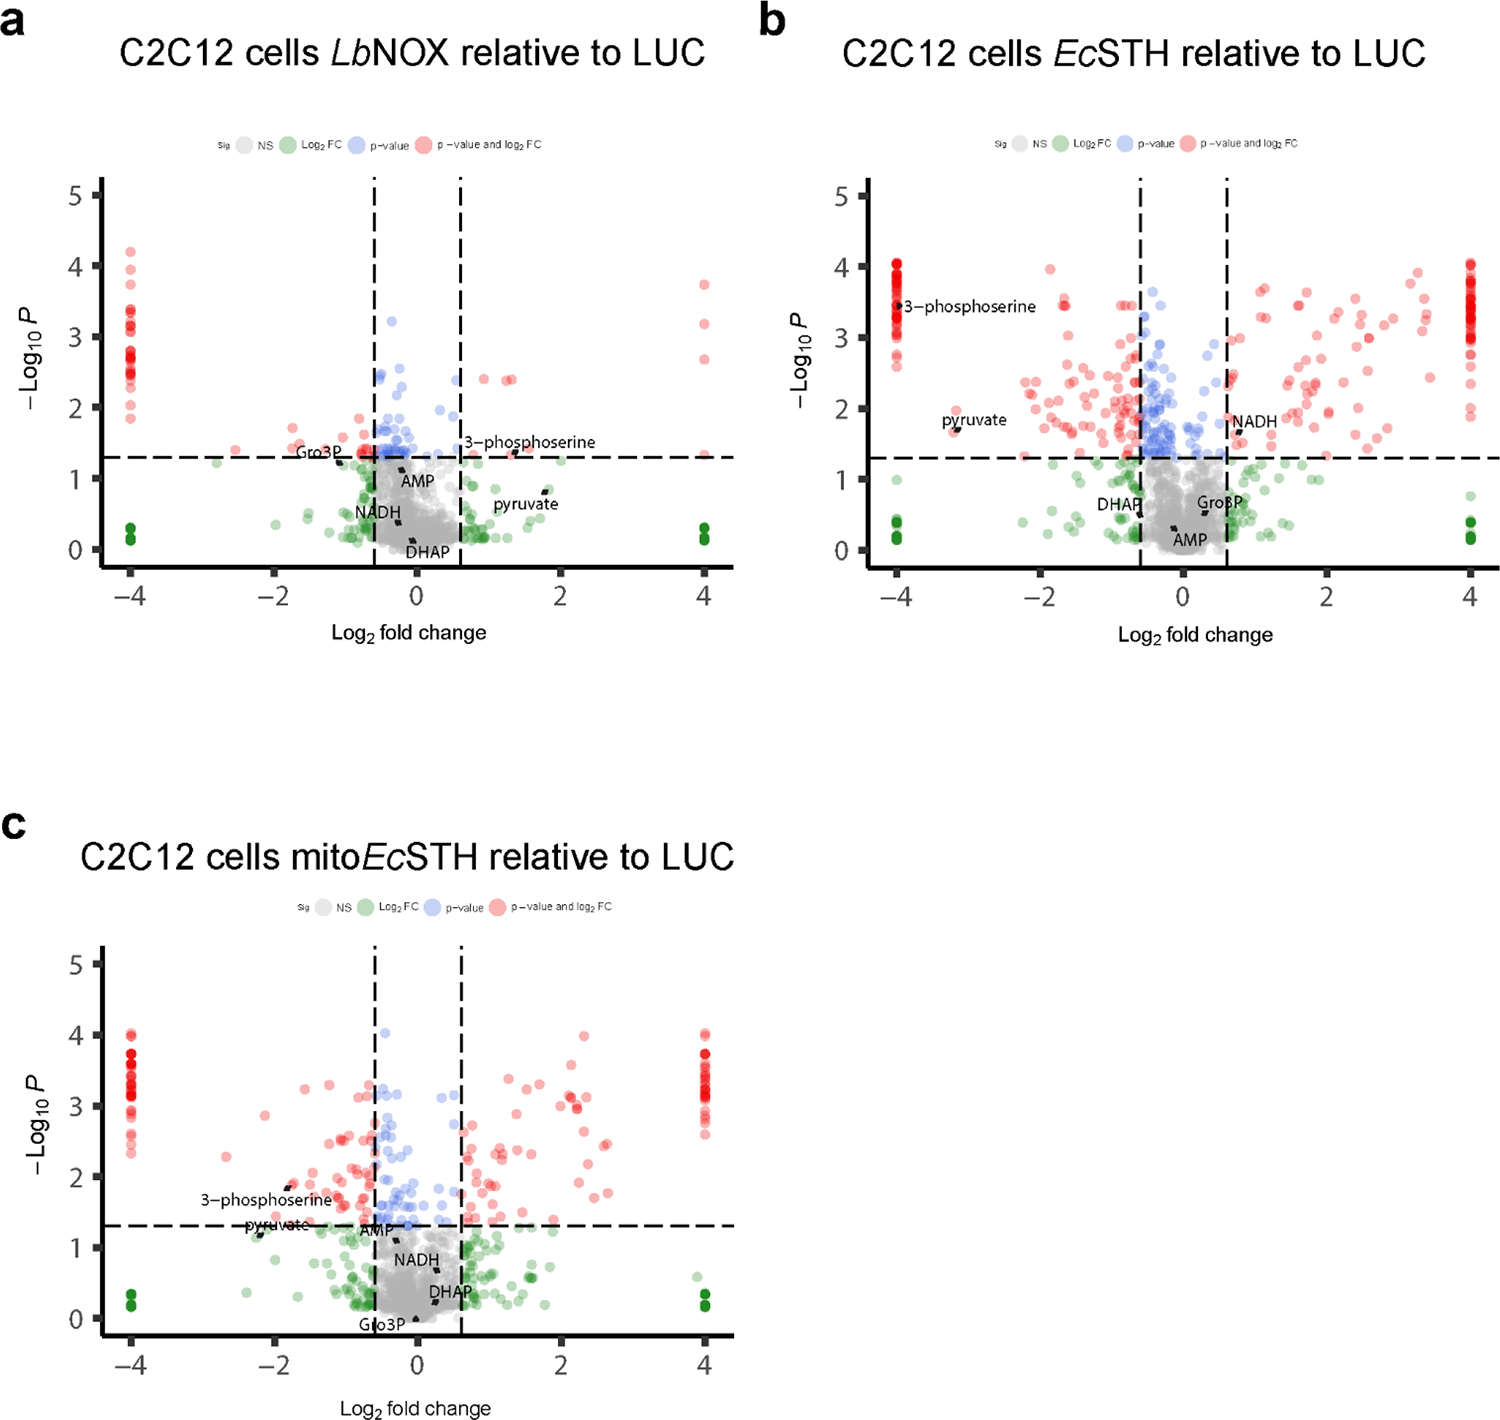
Untargeted metabolomics in C2C12 cells expressing LbNOX (a), EcSTH (b) and mitoEcSTH (c). LUC expressing C2C12 cells were used as a control in (a-c). The statistical significance indicated for (a-c) represents p value cutoff = 0.05, fold change cutoff = 1.5 and Welch t test (FDR corrected).
Supplementary Material
ACKNOWLEDGMENTS:
We thank members of the Thompson laboratory at MSKCC, Helmut Sies, Michelle Clasquin, Amy Caudy and Adam Rosebrock for discussion and feedback. We thank Anh T. Truong (Agilent Technologies), Bill Webb (Center for Metabolomics and Mass Spectrometry, Scripps Research) and David Scott (Sanford Burnham Prebys Discovery Cancer Metabolism Core) for technical support. This work was supported by grants from the National Institutes of Health (R00GM121856, R03AG067301, R35GM142495 and R35GM142495–02S1 to VC and R01DK134675 to RPG). The Seahorse XFe96 analyzer in the Saez laboratory (Scripps Research) was supported by 1S10OD16357. This is manuscript number 1072 from The Scintillon Institute.
Footnotes
COMPETING INTERESTS:
VC is listed as an inventor on a patent application on the therapeutic uses of LbNOX and TPNOX (US patent application US20190017034A1). The remaining authors declare no competing interests.
METHODS-ONLY REFERNCES:
- 57.Schindelin J, Arganda-Carreras I, Frise E, Kaynig V, Longair M, Pietzsch T et al. (2012) Fiji: an open-source platform for biological-image analysis Nat Methods 9, 676–682 10.1038/nmeth.2019 [DOI] [PMC free article] [PubMed] [Google Scholar]
- 58.Love MI, Huber W, andAnders S (2014) Moderated estimation of fold change and dispersion for RNA-seq data with DESeq2 Genome Biol 15, 550 10.1186/s13059-014-0550-8 [DOI] [PMC free article] [PubMed] [Google Scholar]
REFERENCES:
- 1.Veech RL, Todd King M, Pawlosky R, Kashiwaya Y, Bradshaw PC, andCurtis W (2019) The “great” controlling nucleotide coenzymes IUBMB Life 71, 565–579 10.1002/iub.1997 [DOI] [PMC free article] [PubMed] [Google Scholar]
- 2.Walsh CT, Tu BP, andTang Y (2018) Eight Kinetically Stable but Thermodynamically Activated Molecules that Power Cell Metabolism Chem Rev 118, 1460–1494 10.1021/acs.chemrev.7b00510 [DOI] [PMC free article] [PubMed] [Google Scholar]
- 3.Xiao W, Wang RS, Handy DE, andLoscalzo J (2018) NAD(H) and NADP(H) Redox Couples and Cellular Energy Metabolism Antioxid Redox Signal 28, 251–272 10.1089/ars.2017.7216 [DOI] [PMC free article] [PubMed] [Google Scholar]
- 4.Titov DV, Cracan V, Goodman RP, Peng J, Grabarek Z, andMootha VK (2016) Complementation of mitochondrial electron transport chain by manipulation of the NAD+/NADH ratio Science 352, 231–235 10.1126/science.aad4017 [DOI] [PMC free article] [PubMed] [Google Scholar]
- 5.Cracan V, Titov DV, Shen H, Grabarek Z, andMootha VK (2017) A genetically encoded tool for manipulation of NADP(+)/NADPH in living cells Nat Chem Biol 13, 1088–1095 10.1038/nchembio.2454 [DOI] [PMC free article] [PubMed] [Google Scholar]
- 6.Xiao W, andLoscalzo J (2020) Metabolic Responses to Reductive Stress Antioxid Redox Signal 32, 1330–1347 10.1089/ars.2019.7803 [DOI] [PMC free article] [PubMed] [Google Scholar]
- 7.McReynolds MR, Chellappa K, Chiles E, Jankowski C, Shen Y, Chen L et al. (2021) NAD(+) flux is maintained in aged mice despite lower tissue concentrations Cell Syst 12, 1160–1172 e1164 10.1016/j.cels.2021.09.001 [DOI] [PMC free article] [PubMed] [Google Scholar]
- 8.Svensson S, Some M, Lundsjo A, Helander A, Cronholm T, andHoog JO (1999) Activities of human alcohol dehydrogenases in the metabolic pathways of ethanol and serotonin Eur J Biochem 262, 324–329 10.1046/j.1432-1327.1999.00351.x [DOI] [PubMed] [Google Scholar]
- 9.Goodman RP, Calvo SE, andMootha VK (2018) Spatiotemporal compartmentalization of hepatic NADH and NADPH metabolism J Biol Chem 293, 7508–7516 10.1074/jbc.TM117.000258 [DOI] [PMC free article] [PubMed] [Google Scholar]
- 10.Gall WE, Beebe K, Lawton KA, Adam KP, Mitchell MW, Nakhle PJ et al. (2010) alpha-hydroxybutyrate is an early biomarker of insulin resistance and glucose intolerance in a nondiabetic population PLoS One 5, e10883 10.1371/journal.pone.0010883 [DOI] [PMC free article] [PubMed] [Google Scholar]
- 11.Thompson Legault J, Strittmatter L, Tardif J, Sharma R, Tremblay-Vaillancourt V, Aubut C et al. (2015) A Metabolic Signature of Mitochondrial Dysfunction Revealed through a Monogenic Form of Leigh Syndrome Cell Rep 13, 981–989 10.1016/j.celrep.2015.09.054 [DOI] [PMC free article] [PubMed] [Google Scholar]
- 12.Cobb J, Eckhart A, Motsinger-Reif A, Carr B, Groop L, andFerrannini E (2016) alpha-Hydroxybutyric Acid Is a Selective Metabolite Biomarker of Impaired Glucose Tolerance Diabetes Care 39, 988–995 10.2337/dc15-2752 [DOI] [PubMed] [Google Scholar]
- 13.Edenberg HJ (2007) The genetics of alcohol metabolism: role of alcohol dehydrogenase and aldehyde dehydrogenase variants Alcohol Res Health 30, 5–13, https://www.ncbi.nlm.nih.gov/pubmed/17718394 [PMC free article] [PubMed] [Google Scholar]
- 14.Partipilo M, Ewins EJ, Frallicciardi J, Robinson T, Poolman B, andSlotboom DJ (2021) Minimal Pathway for the Regeneration of Redox Cofactors JACS Au 1, 2280–2293 10.1021/jacsau.1c00406 [DOI] [PMC free article] [PubMed] [Google Scholar]
- 15.Sanchez AM, Andrews J, Hussein I, Bennett GN, andSan KY (2006) Effect of overexpression of a soluble pyridine nucleotide transhydrogenase (UdhA) on the production of poly(3-hydroxybutyrate) in Escherichia coli Biotechnol Prog 22, 420–425 10.1021/bp050375u [DOI] [PubMed] [Google Scholar]
- 16.Hou J, Lages NF, Oldiges M, andVemuri GN (2009) Metabolic impact of redox cofactor perturbations in Saccharomyces cerevisiae Metab Eng 11, 253–261 10.1016/j.ymben.2009.05.001 [DOI] [PubMed] [Google Scholar]
- 17.Yu T, Liu Q, Wang X, Liu X, Chen Y, andNielsen J (2022) Metabolic reconfiguration enables synthetic reductive metabolism in yeast Nat Metab 4, 1551–1559 10.1038/s42255-022-00654-1 [DOI] [PMC free article] [PubMed] [Google Scholar]
- 18.Sharma R, Reinstadler B, Engelstad K, Skinner OS, Stackowitz E, Haller RG et al. (2021) Circulating markers of NADH-reductive stress correlate with mitochondrial disease severity J Clin Invest 131, 10.1172/JCI136055 [DOI] [PMC free article] [PubMed] [Google Scholar]
- 19.Balsa E, Perry EA, Bennett CF, Jedrychowski M, Gygi SP, Doench JG et al. (2020) Defective NADPH production in mitochondrial disease complex I causes inflammation and cell death Nat Commun 11, 2714 10.1038/s41467-020-16423-1 [DOI] [PMC free article] [PubMed] [Google Scholar]
- 20.Hosios AM, andVander Heiden MG (2018) The redox requirements of proliferating mammalian cells J Biol Chem 293, 7490–7498 10.1074/jbc.TM117.000239 [DOI] [PMC free article] [PubMed] [Google Scholar]
- 21.Luengo A, Li Z, Gui DY, Sullivan LB, Zagorulya M, Do BT et al. (2021) Increased demand for NAD(+) relative to ATP drives aerobic glycolysis Mol Cell 81, 691–707 e696 10.1016/j.molcel.2020.12.012 [DOI] [PMC free article] [PubMed] [Google Scholar]
- 22.King MP, andAttardi G (1989) Human cells lacking mtDNA: repopulation with exogenous mitochondria by complementation Science 246, 500–503 10.1126/science.2814477 [DOI] [PubMed] [Google Scholar]
- 23.Zhao Y, Hu Q, Cheng F, Su N, Wang A, Zou Y et al. (2015) SoNar, a Highly Responsive NAD+/NADH Sensor, Allows High-Throughput Metabolic Screening of Anti-tumor Agents Cell Metab 21, 777–789 10.1016/j.cmet.2015.04.009 [DOI] [PMC free article] [PubMed] [Google Scholar]
- 24.Tao R, Zhao Y, Chu H, Wang A, Zhu J, Chen X et al. (2017) Genetically encoded fluorescent sensors reveal dynamic regulation of NADPH metabolism Nat Methods 14, 720–728 10.1038/nmeth.4306 [DOI] [PMC free article] [PubMed] [Google Scholar]
- 25.Niu X, Stancliffe E, Gelman SJ, Wang L, Schwaiger-Haber M, Rowles JL 3rd et al. (2023) Cytosolic and mitochondrial NADPH fluxes are independently regulated Nat Chem Biol 10.1038/s41589-023-01283-9 [DOI] [PubMed] [Google Scholar]
- 26.Schafer FQ, andBuettner GR (2001) Redox environment of the cell as viewed through the redox state of the glutathione disulfide/glutathione couple Free Radic Biol Med 30, 1191–1212 10.1016/s0891-5849(01)00480-4 [DOI] [PubMed] [Google Scholar]
- 27.Liu S, Fu S, Wang G, Cao Y, Li L, Li X et al. (2021) Glycerol-3-phosphate biosynthesis regenerates cytosolic NAD(+) to alleviate mitochondrial disease Cell Metab 33, 1974–1987 e1979 10.1016/j.cmet.2021.06.013 [DOI] [PubMed] [Google Scholar]
- 28.Huang L, Khusnutdinova A, Nocek B, Brown G, Xu X, Cui H et al. (2016) A family of metal-dependent phosphatases implicated in metabolite damage-control Nat Chem Biol 12, 621–627 10.1038/nchembio.2108 [DOI] [PMC free article] [PubMed] [Google Scholar]
- 29.Zhang Q, andBartels D (2017) Octulose: a forgotten metabolite? J Exp Bot 68, 5689–5694 10.1093/jxb/erx367 [DOI] [PMC free article] [PubMed] [Google Scholar]
- 30.Martinez-Reyes I, andChandel NS (2020) Mitochondrial TCA cycle metabolites control physiology and disease Nat Commun 11, 102 10.1038/s41467-019-13668-3 [DOI] [PMC free article] [PubMed] [Google Scholar]
- 31.Goodman RP, Markhard AL, Shah H, Sharma R, Skinner OS, Clish CB et al. (2020) Hepatic NADH reductive stress underlies common variation in metabolic traits Nature 583, 122–126 10.1038/s41586-020-2337-2 [DOI] [PMC free article] [PubMed] [Google Scholar]
- 32.Williamson DH, Lund P, andKrebs HA (1967) The redox state of free nicotinamide-adenine dinucleotide in the cytoplasm and mitochondria of rat liver Biochem J 103, 514–527 10.1042/bj1030514 [DOI] [PMC free article] [PubMed] [Google Scholar]
- 33.Kim W, Deik A, Gonzalez C, Gonzalez ME, Fu F, Ferrari M et al. (2019) Polyunsaturated Fatty Acid Desaturation Is a Mechanism for Glycolytic NAD(+) Recycling Cell Metab 29, 856–870 e857 10.1016/j.cmet.2018.12.023 [DOI] [PMC free article] [PubMed] [Google Scholar]
- 34.Sullivan LB, Gui DY, Hosios AM, Bush LN, Freinkman E, andVander Heiden MG (2015) Supporting Aspartate Biosynthesis Is an Essential Function of Respiration in Proliferating Cells Cell 162, 552–563 10.1016/j.cell.2015.07.017 [DOI] [PMC free article] [PubMed] [Google Scholar]
- 35.Yang L, Garcia Canaveras JC, Chen Z, Wang L, Liang L, Jang C et al. (2020) Serine Catabolism Feeds NADH when Respiration Is Impaired Cell Metab 31, 809–821 e806 10.1016/j.cmet.2020.02.017 [DOI] [PMC free article] [PubMed] [Google Scholar]
- 36.Unterlass JE, Wood RJ, Basle A, Tucker J, Cano C, Noble MME et al. (2017) Structural insights into the enzymatic activity and potential substrate promiscuity of human 3-phosphoglycerate dehydrogenase (PHGDH) Oncotarget 8, 104478–104491 10.18632/oncotarget.22327 [DOI] [PMC free article] [PubMed] [Google Scholar]
- 37.Reid MA, Allen AE, Liu S, Liberti MV, Liu P, Liu X et al. (2018) Serine synthesis through PHGDH coordinates nucleotide levels by maintaining central carbon metabolism Nat Commun 9, 5442 10.1038/s41467-018-07868-6 [DOI] [PMC free article] [PubMed] [Google Scholar]
- 38.Yang L, TeSlaa T, Ng S, Nofal M, Wang L, Lan T et al. (2022) Ketogenic diet and chemotherapy combine to disrupt pancreatic cancer metabolism and growth Med (N Y) 3, 119–136 10.1016/j.medj.2021.12.008 [DOI] [PMC free article] [PubMed] [Google Scholar]
- 39.Jackson B, Brocker C, Thompson DC, Black W, Vasiliou K, Nebert DW et al. (2011) Update on the aldehyde dehydrogenase gene (ALDH) superfamily Hum Genomics 5, 283–303 10.1186/1479-7364-5-4-283 [DOI] [PMC free article] [PubMed] [Google Scholar]
- 40.Vasiliou V, Pappa A, andEstey T (2004) Role of human aldehyde dehydrogenases in endobiotic and xenobiotic metabolism Drug Metab Rev 36, 279–299 10.1081/dmr-120034001 [DOI] [PubMed] [Google Scholar]
- 41.Davis I, Yang Y, Wherritt D, andLiu A (2018) Reassignment of the human aldehyde dehydrogenase ALDH8A1 (ALDH12) to the kynurenine pathway in tryptophan catabolism J Biol Chem 293, 9594–9603 10.1074/jbc.RA118.003320 [DOI] [PMC free article] [PubMed] [Google Scholar]
- 42.Wang X, Zhao Y, Luo J, Xu L, Li X, Jin Y et al. (2020) MicroRNA hsa-miR-1301–3p Regulates Human ADH6, ALDH5A1 and ALDH8A1 in the Ethanol-Acetaldehyde-Acetate Metabolic Pathway Mol Pharmacol 98, 120–129 10.1124/mol.120.119693 [DOI] [PubMed] [Google Scholar]
- 43.Yatsuga S, Fujita Y, Ishii A, Fukumoto Y, Arahata H, Kakuma T et al. (2015) Growth differentiation factor 15 as a useful biomarker for mitochondrial disorders Ann Neurol 78, 814–823 10.1002/ana.24506 [DOI] [PMC free article] [PubMed] [Google Scholar]
- 44.Fujita Y, Ito M, Kojima T, Yatsuga S, Koga Y, andTanaka M (2015) GDF15 is a novel biomarker to evaluate efficacy of pyruvate therapy for mitochondrial diseases Mitochondrion 20, 34–42 10.1016/j.mito.2014.10.006 [DOI] [PubMed] [Google Scholar]
- 45.Mick E, Titov DV, Skinner OS, Sharma R, Jourdain AA, andMootha VK (2020) Distinct mitochondrial defects trigger the integrated stress response depending on the metabolic state of the cell Elife 9, 10.7554/eLife.49178 [DOI] [PMC free article] [PubMed] [Google Scholar]
- 46.Kang SG, Choi MJ, Jung SB, Chung HK, Chang JY, Kim JT et al. (2021) Differential roles of GDF15 and FGF21 in systemic metabolic adaptation to the mitochondrial integrated stress response iScience 24, 102181 10.1016/j.isci.2021.102181 [DOI] [PMC free article] [PubMed] [Google Scholar]
- 47.Argyrou A, andBlanchard JS (2004) Flavoprotein disulfide reductases: advances in chemistry and function Prog Nucleic Acid Res Mol Biol 78, 89–142 10.1016/S0079-6603(04)78003-4 [DOI] [PubMed] [Google Scholar]
- 48.Ichinose H, Kamiya N, andGoto M (2005) Enzymatic redox cofactor regeneration in organic media: functionalization and application of glycerol dehydrogenase and soluble transhydrogenase in reverse micelles Biotechnol Prog 21, 1192–1197 10.1021/bp0500765 [DOI] [PubMed] [Google Scholar]
- 49.Mouri T, Shimizu T, Kamiya N, Goto M, andIchinose H (2009) Design of a cytochrome P450BM3 reaction system linked by two-step cofactor regeneration catalyzed by a soluble transhydrogenase and glycerol dehydrogenase Biotechnol Prog 25, 1372–1378 10.1002/btpr.231 [DOI] [PubMed] [Google Scholar]
- 50.Nissen TL, Anderlund M, Nielsen J, Villadsen J, andKielland-Brandt MC (2001) Expression of a cytoplasmic transhydrogenase in Saccharomyces cerevisiae results in formation of 2-oxoglutarate due to depletion of the NADPH pool Yeast 18, 19–32 [DOI] [PubMed] [Google Scholar]
- 51.Zhao H, Zhou F, Xing Q, Cao Z, Liu J, andZhu G (2018) The soluble transhydrogenase UdhA affecting the glutamate-dependent acid resistance system of Escherichia coli under acetate stress Biol Open 7, 10.1242/bio.031856 [DOI] [PMC free article] [PubMed] [Google Scholar]
- 52.Sauer U, Canonaco F, Heri S, Perrenoud A, andFischer E (2004) The soluble and membrane-bound transhydrogenases UdhA and PntAB have divergent functions in NADPH metabolism of Escherichia coli J Biol Chem 279, 6613–6619 10.1074/jbc.M311657200 [DOI] [PubMed] [Google Scholar]
- 53.Wu Z, Bezwada D, Harris RC, Pan C, Nguyen PT, Faubert B et al. (2023) Electron transport chain inhibition increases cellular dependence on purine transport and salvage bioRxiv 10.1101/2023.05.11.540429 [DOI] [PMC free article] [PubMed] [Google Scholar]
- 54.Yang R, Yang C, Ma L, Zhao Y, Guo Z, Niu J et al. (2022) Identification of purine biosynthesis as an NADH-sensing pathway to mediate energy stress Nat Commun 13, 7031 10.1038/s41467-022-34850-0 [DOI] [PMC free article] [PubMed] [Google Scholar]
- 55.Alonso-Lavin AJ, Bajic D, andPoyatos JF (2021) Tolerance to NADH/NAD(+) imbalance anticipates aging and anti-aging interventions iScience 24, 102697 10.1016/j.isci.2021.102697 [DOI] [PMC free article] [PubMed] [Google Scholar]
- 56.Boulanger EF, Sabag-Daigle A, Thirugnanasambantham P, Gopalan V, andAhmer BMM (2021) Sugar-Phosphate Toxicities Microbiol Mol Biol Rev 85, e0012321 10.1128/MMBR.00123-21 [DOI] [PMC free article] [PubMed] [Google Scholar]
- 57.Schindelin J, Arganda-Carreras I, Frise E, Kaynig V, Longair M, Pietzsch T et al. (2012) Fiji: an open-source platform for biological-image analysis Nat Methods 9, 676–682 10.1038/nmeth.2019 [DOI] [PMC free article] [PubMed] [Google Scholar]
- 58.Love MI, Huber W, andAnders S (2014) Moderated estimation of fold change and dispersion for RNA-seq data with DESeq2 Genome Biol 15, 550 10.1186/s13059-014-0550-8 [DOI] [PMC free article] [PubMed] [Google Scholar]
Associated Data
This section collects any data citations, data availability statements, or supplementary materials included in this article.
Supplementary Materials
Data Availability Statement
RNA-seq data presented in this work are available at the Gene Expression Omnibus database under accession number GEO: GSE232115. The H. sapiens GRCh38 reference genome was used for mapping RNA-seq reads. Source data for figures, extended data and supplementary figures are provided with this paper.


