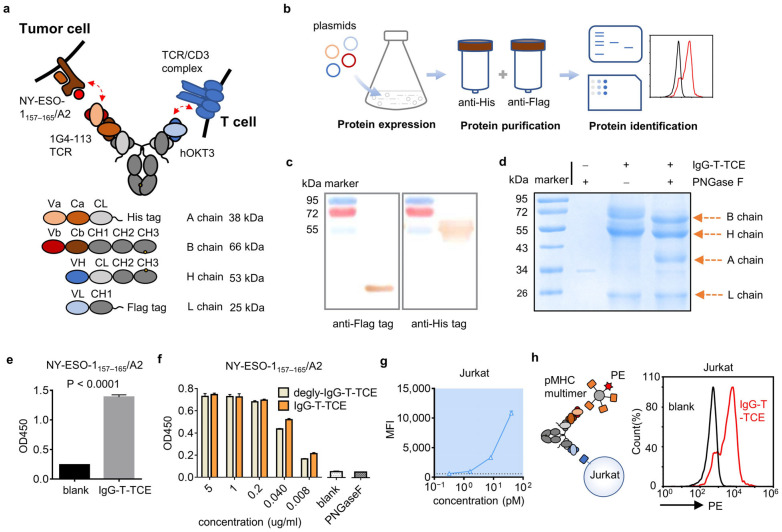
Figure 1.
Structure and characterization of IgG-T-TCE. (a) Schematic diagram of IgG-T-TCE-NY structure. Red arrows indicate the simultaneous binding of IgG-T-TCE-NY to NY-ESO-1157–165/HLA-A*02:01 on tumor cell and human CD3 on T cell. The MW of each chain was estimated using ExPASy. (b) Flow diagram of IgG-T-TCE preparation. (c) Western blot analysis of IgG-T-TCE-NY. (d) Reducing SDS-PAGE analysis of IgG-T-TCE-NY with/without deglycosylation operation. The position of each band matched the estimated size of each chain of IgG-T-TCE-NY after deglycosylation. (e) ELISA assay for testing the affinity of IgG-T-TCE-NY to NY-ESO-1157–165/HLA-A*02:01. The blank group was incubated with PBS instead of IgG-T-TCE-NY. The t-test of these two groups was performed using GraphPad. p value was lower than 0.0001. (f) ELISA assay for comparing the affinity of IgG-T-TCE-NY to NY-ESO-1157–165/HLA-A*02:01 with/without the deglycosylation operation. PNGase F alone and a blank group incubated with PBS instead of IgG-T-TCE-NY were set as controls. (g) Binding ability of IgG-T-TCE-NY to Jurkat cells measured with FACS. (h) The simultaneous binding of IgG-T-TCE-NY to NY-ESO-1157–165/HLA-A*02:01 and human CD3 was identified with FACS using the sandwich method. The pMHC multimer tagged with PE could bind IgG-T-TCE-NY caught by the hCD3 on Jurkat cells. The blank group was incubated with PBS instead of IgG-T-TCE-NY. Data are means ± SD, n = 3.

