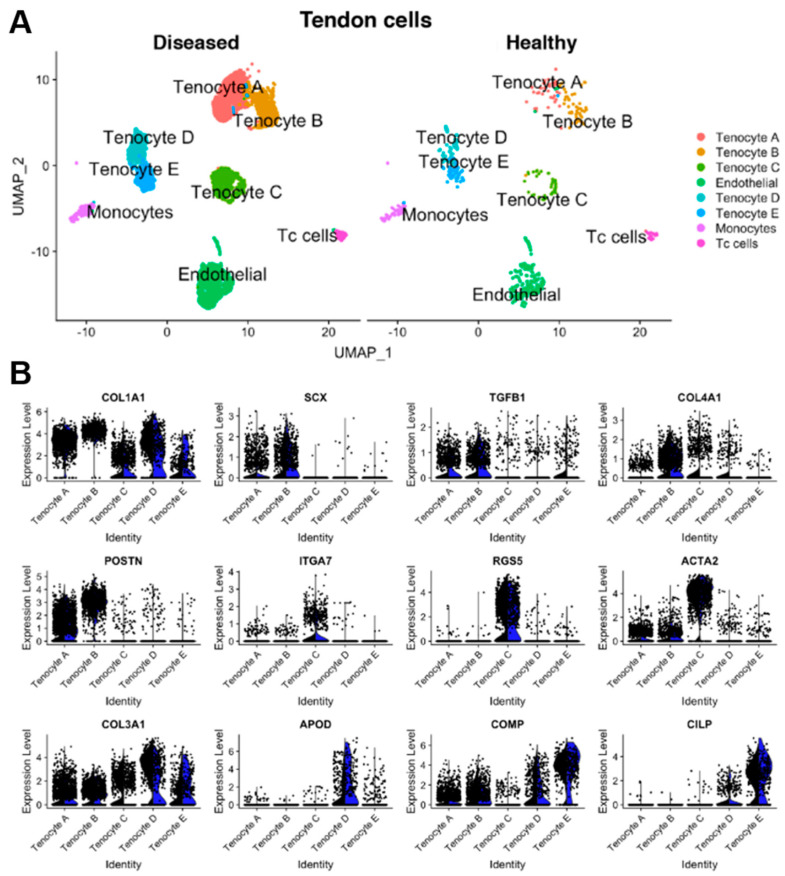
Figure 2.
Representative image of tenocyte subpopulations from Kendal et al. [49]. (A) Uniform Manifold Approximation and Projection (UMAP) showing diseased, or tendinopathy, and healthy patient samples. Eight overall cell populations and five tenocyte populations were identified. All cell populations were present in both diseased and healthy tendon tissue. Tenocytes were defined as cells expressing COL1A1 or COL1A2. (B) Split Violin plots displaying gene expression for diseased (black) versus healthy (blue) tenocytes in all five subpopulations. Every dot represents an individual cell’s gene expression level. Figure adapted from Kendal et al. [49], an open access publication.

