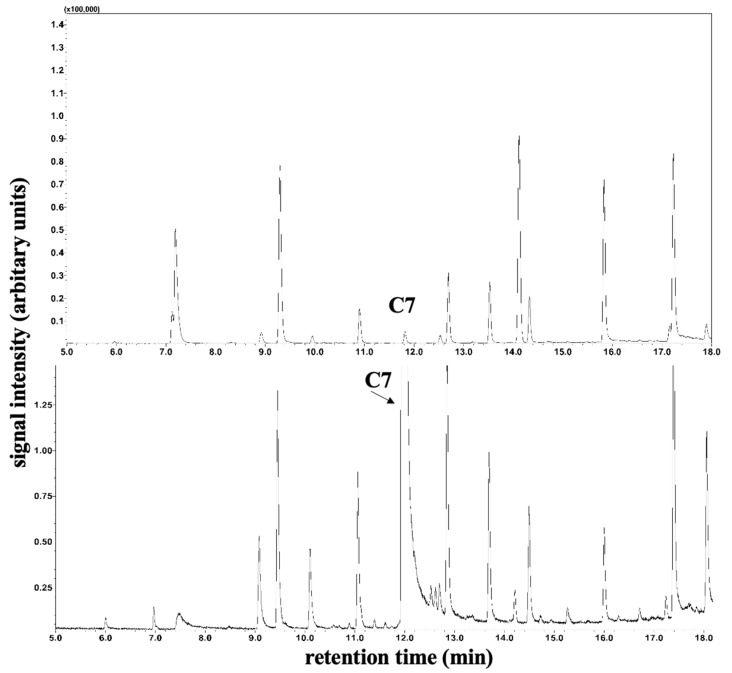
Figure 3.
Determination of plasma C7 fatty acids for patient 2. Section of peak intensity chromatogram of plasma medium-chain free fatty acids by gas chromatography–single quadrupole mass spectrometry. The top image shows plasma C7 fatty acids prior to therapy, and the bottom image shows measurements during therapy.

