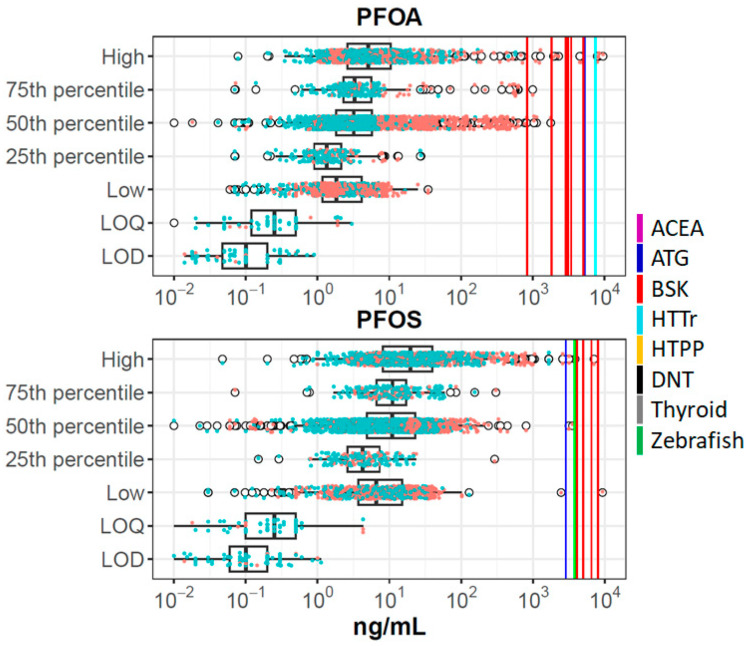
Figure 1.
Summary of in vitro and biomonitoring data for PFOA and PFOS. The boxplots show distributions of plasma concentrations from all studies for each chemical. The box-and-whiskers plot indicates the interquartile range (IQR) and 1.5 times the IQR. The open circles are points outside 1.5 times IQR. Overlaid on this are data points for each individual population and metric, colored orange (exposed populations) or blue (general populations). The vertical solid lines show PODset values as indicated in the legend (ACEA: violet; ATG: blue; BSK: red; HTTr: cyan; HTPP: orange; DNT: black; Thyroid: gray; Zebrafish: green). For these chemicals, some of the assay technologies (e.g., DNT) were inactive, so no corresponding line is shown. The metric groups on the y-axis are High (>75% percentile, including maximum); 75th percentile; 50th percentile (50th percentile, mean, median); 25th percentile; and Low (<25th percentile, including minimum). LOQ is limit of quantification and LOD is limit of detection.

