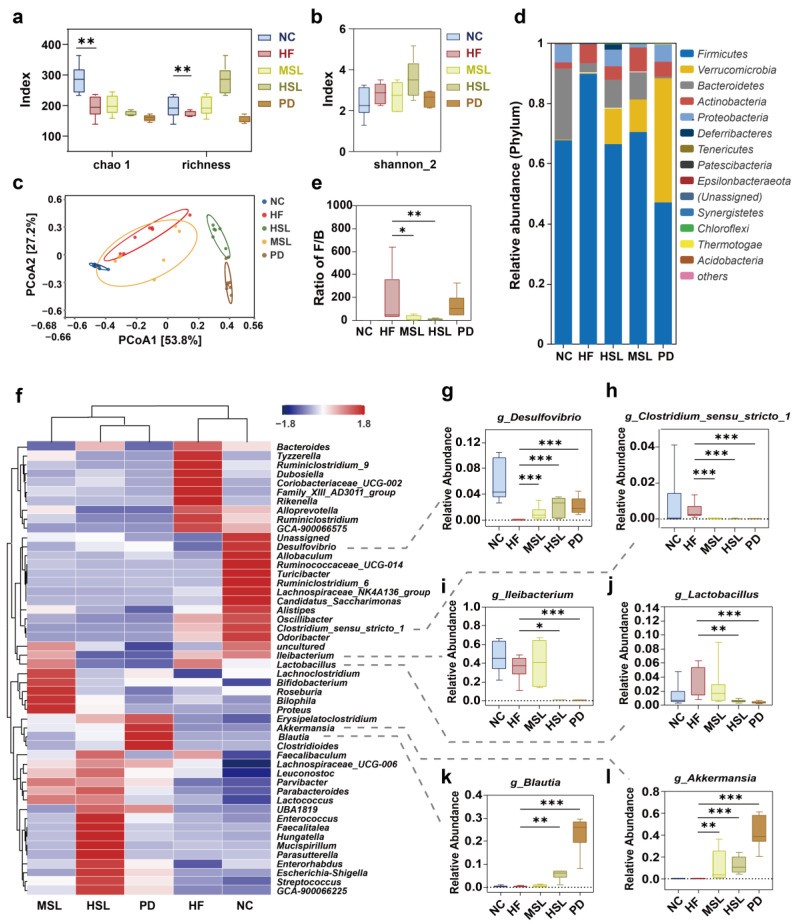
Figure 2.
Silymarin and polyherbal extract modulates the composition of gut microbiota. 16S rRNA gene sequencing analysis in fecal bacterial DNA from NC, HF, MSL, HSL, and PD mice was performed; n = 7 individuals/group. (a,b) Alpha diversity was assessed by chao 1, observed richness (a) and Shannon_2 diversity index (b), respectively. (c) Bray–Curtis beta diversity was visualized with the principal coordinate analysis (PCoA). (d,e) The stacking histogram showing the taxonomic summary of phyla composition in feces from all groups (d) and the boxplots showing the ratio of fecal Firmicutes to Bacteroidetes in relative abundance (e). (f) The heatmap shows the relative abundance clustering (average) of microbial communities at the genus level in all groups. (g–l) The boxplots show statistical differences of selected differentially abundant genus between groups. Two-sided Mann–Whitney nonparametric test were conducted for comparisons; * p < 0.05, ** p < 0.01, *** p < 0.001. The horizontal line in each box represents the median, the top and the bottom of the box the 25th and 75th percentiles, and the whiskers the min to max.

