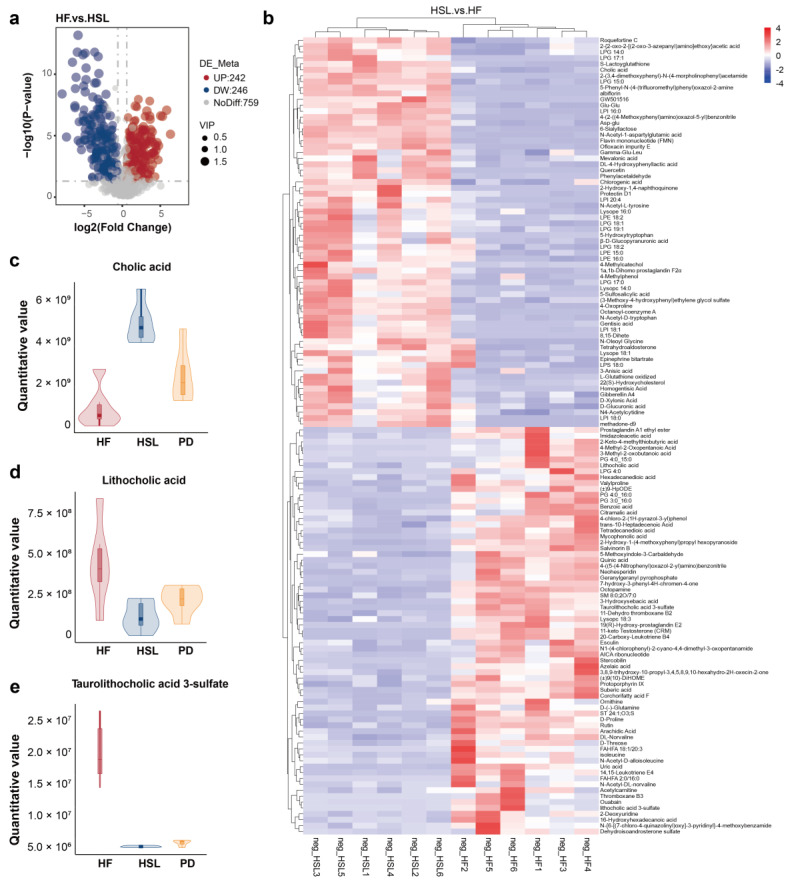
Figure 5.
Alterations of metabolites in the fecal of NAFLD mice upon silymarin intervention. (a) The number of significantly changed metabolites in the feces (determined by Log2 FC and −Log10 p value) of HF mice compared to HSL mice was shown in the Volcano plot. (b) Heatmap showing fecal metabolites differed significantly in abundance between HF group and HSL group, blocks in red and blue denote high and low FC values, respectively. (c–e) Violin plots shows the significantly differed quantitative value of CA (c), LCA (d), and TLCA-sulfate (e) in HF, HSL, and PD group; n = 6. Significantly different metabolites were screened out by PLS-DA model (VIP > 1 and p < 0.05). FC Fold Change, CA cholic acid, LCA lithocholic acid, TLCA-sulfate taurolithocholic acid-sulfate, PLS-DA partial least squares-discriminant analysis, VIP variable importance for the projection.

