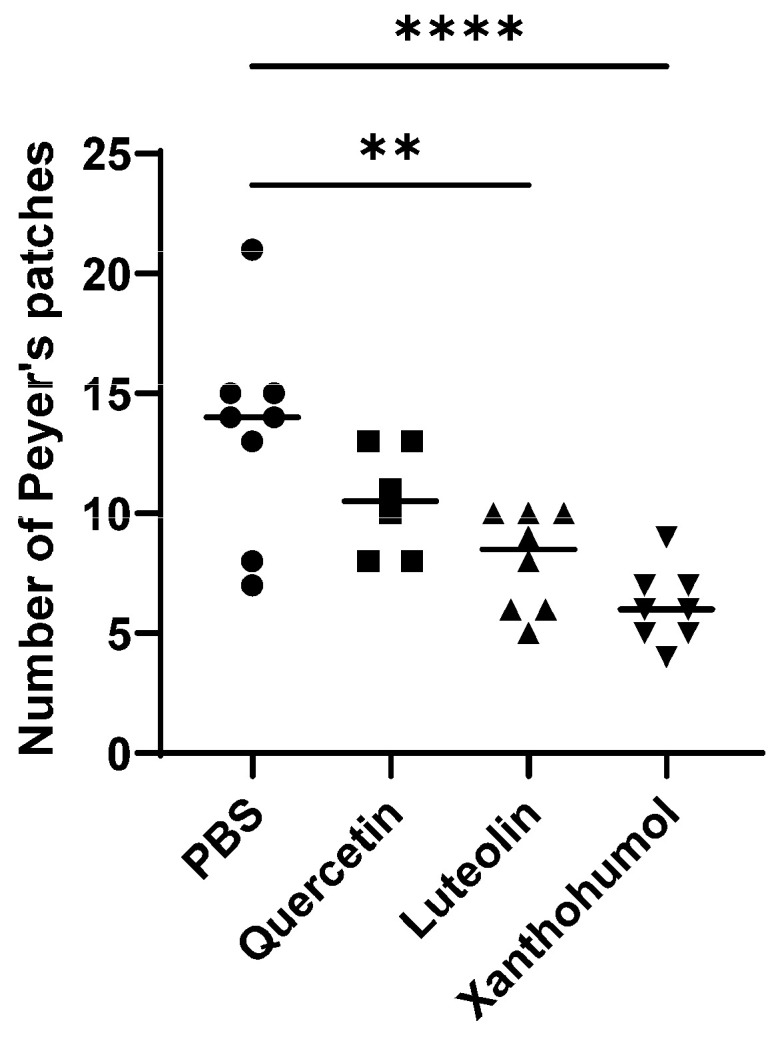
Figure 2.

Mean number of hyperplastic Peyer’s patches in the small intestine of animals with induced CRC from each cohort (rats 1 to 8 in the 4 groups). The median value of each cohort is represented as a horizontal line within the corresponding box plots. Asterisks indicate statistically significant differences (** p < 0.005; **** p < 0.0001) (ANOVA test).
