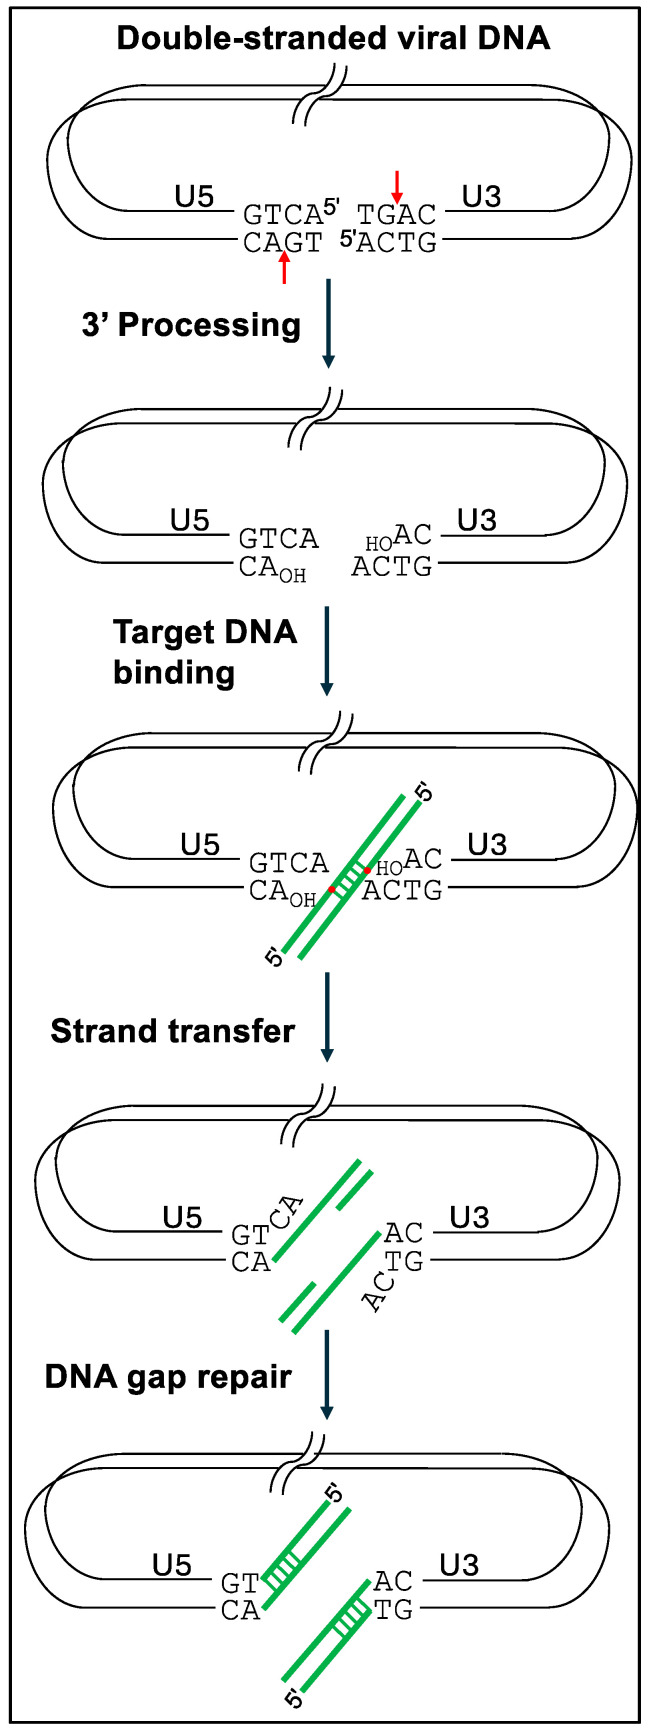
Figure 1.
DNA cutting and joining steps of retroviral integration. Depicted is linear HIV-1 DNA (thin black lines) and chromosomal target DNA (thick green lines). Scissile phosphodiester bonds are shown as red vertical arrows (for 3′ processing) and small red circles (for DNA strand transfer). For simplicity, the IN enzyme was omitted from the drawing. See main text for additional details.

