

Abstract
BACKGROUND:
Information regarding the use of donor sperm in assisted reproductive technology, as well as subsequent treatment and perinatal outcomes, remains limited. Outcome data would aid patient counseling and clinical decision making.
OBJECTIVES:
The objectives of the study were to report national trends in donor sperm utilization and live birth rates of donor sperm–assisted reproductive technology cycles in the United States and to compare assisted reproductive technology treatment and perinatal outcomes between cycles using donor and nondonor sperm. We hypothesize these outcomes to be comparable between donor and nondonor sperm cycles.
STUDYDESIGN:
This was a retrospective cohort study using data from all US fertility centers reporting to the Centers for Disease Control and Prevention’s National Assisted Reproductive Technology Surveillance System, accounting for ~98% of assisted reproductive technology cycles (definition excludes intrauterine insemination). The number and percentage of assisted reproductive technology cycles using donor sperm and rates of pregnancy, live birth, preterm birth (<37 weeks), and low birth-weight (<2500 g) were the primary outcomes measured. Treatments assessed include use of donor vs nondonor sperm. The trends analysis included all banking and fresh assisted reproductive technology cycles using donor and autologous oocytes performed between 1996 and 2014 (n = 1,710,034). The outcomes analysis was restricted to include only fresh autologous cycles performed between 2010 and 2014 (n = 437,569) to focus on cycles with a potential outcome and cycles reflective of current practice, thereby improving the clinical relevance. Cycles canceled prior to retrieval were excluded. Statistical analysis included linear regression to explore polynomial trends and log-binomial regression to estimate relative risk for outcomes among cycles using donor and nondonor sperm.
RESULTS:
Of all banking and fresh donor and autologous oocyte assisted reproductive technology cycles performed between 1996 and 2014, 74,892 (4.4%) used donor sperm. In 2014, 7351 assisted reproductive technology cycles using donor sperm were performed, as compared with 1763 in 1996 (6.2% vs 3.8% of all cycles). Among all autologous oocyte cycles performed between 2010 and 2014, the live birth rate was lower for donor sperm (27.9%) than nondonor sperm cycles (32.5%); however, after adjustment for maternal age, donor sperm use was associated with an increased likelihood of live birth (adjusted relative risk, 1.06, 95% confidence interval, 1.01–1.10). Per transfer, there was no significant difference in live birth rates for donor vs nondonor sperm (31.9% vs 36.8%; adjusted relative risk, 1.04, 95% confidence interval, 0.998–1.09). Per singleton live birth, there was no significant difference in preterm birth (11.5% vs 11.8%; adjusted relative risk, 0.98, 95% confidence interval, 0.90–1.06); however, low birthweight delivery was slightly lower in donor sperm cycles (8.8% vs 9.4%; adjusted relative risk, 0.91, 95% confidence interval, 0.83–0.99).
CONCLUSION:
Donor sperm use in assisted reproductive technology has increased in the United States, accounting for approximately 6% of all assisted reproductive technology cycles in 2014. Assisted reproductive technology treatment and perinatal outcomes were clinically similar in donor and nondonor sperm cycles.
Keywords: donor sperm, in vitro fertilization, perinatal outcomes, third party reproduction
Donor sperm use was first documented in the early 1880s but remained a virtually unknown practice in reproductive medicine until the early 1950s when methods for use of both fresh and frozen sperm were developed.1 In 1953, the first reported infant conceived with frozen donor sperm was born.2
Substantial technological and social progress has been made such that use of donor gametes has become a staple in the clinical practice of reproductive medicine. In particular, donor sperm provides a viable fertility option for patients with significant male factor infertility, female same-sex couples, and single women. According to the Society for Assisted Reproductive Technology, from 2004 to 2013, third-party in vitro fertilization (IVF), which includes IVF using donor sperm, donor oocytes, donor embryos, and/or a gestational carrier, accounted for 217,030 of all IVF cycles (16.1%) and 115,024 of all live born infants (20.9%) following IVF.3 Between 2004 and 2013, sperm donation was the second most common third-party in vitro technique after oocyte donation, accounting for 16.8% of all third-party IVF cycles.3,4
While substantial information has been published on IVF cycles using donor oocytes, information regarding use of donor sperm in IVF, as well as treatment and perinatal outcomes among donor sperm cycles, remains limited.4 Furthermore, although some national assisted reproductive technology (ART) registries, such as in the United Kingdom, include donor insemination treatment cycles, only live birth rates are reported.5,6
Few large population-based studies regarding donor sperm perinatal outcomes have been published,3,7–13 of which only 2 include the use of donor sperm with IVF3,9; the remainder are from intrauterine insemination data. Other retrospective cohort studies involving donor sperm use in IVF have been published; however, the sample sizes are often smaller or from a single center.14–19 Studies of donor sperm pregnancy and perinatal outcomes after intrauterine insemination have yielded inconsistent results.2,10,15,17–31
With the aim of improving patient counseling, we report national trends in donor sperm use and outcomes among ART cycles. We also describe treatment and perinatal outcomes of ART cycles using donor sperm and compare them with outcomes of ART cycles using nondonor sperm. We hypothesized these outcomes would be comparable between donor and nondonor sperm cycles.
Materials and Methods
Data were obtained from the Centers for Disease Control and Prevention’s National ART Surveillance System (NASS), a reporting system that captures data from approximately 98% of all ART cycles performed in the United States.32 Our analysis included all ART procedures: IVF (>99% of all ART procedures), gamete intrafallopian transfer, and zygote intrafallopian transfer.32
We reported trends in the absolute number and percentages of all donor and autologous oocyte, banking and fresh ART cycles using donor (n = 74,892) and nondonor (n = 1,635,142) sperm and trends in the number of live births, live birth rate (LBR), and average maternal age for fresh, autologous oocyte cycles using donor (n = 54,900) and nondonor sperm (n = 1,398,732) initiated between 1996 and 2014.
Banking cycles were defined as cycles started with the intent to cryopreserve (freeze) all resulting oocytes or embryos (ie, no intent to transfer). We defined fresh ART cycles as cycles started with the intent to retrieve and fertilize oocytes and then transfer resulting embryos all within the same cycle. We excluded frozen oocyte cycles, frozen embryo cycles, and cycles canceled prior to retrieval because a sperm source was not reported for these cycle types as well as gestational carrier cycles. Cycles in which the semen source was mixed (ie, nondonor and donor, n = 5224) or unknown (n = 19,166) were also excluded.
Patient demographics, infertility diagnoses, and ART cycle characteristics among all fresh autologous oocyte cycles (in which oocyte retrieval was performed) were compared between donor (n = 22,619) and nondonor sperm (n = 414,950) cycles from 2010 through 2014, using χ2 tests. This part of the analysis was restricted to the most recent 5 years of data available to reflect current practice and improve clinical relevance.
We compared ART treatment and perinatal outcomes of these same cycles, including rates of intrauterine pregnancy and live birth per cycle; intrauterine pregnancy and live birth per transfer; live birth and full-term live birth (≥37 weeks) per pregnancy; and preterm birth (<37 weeks) and low birthweight (<2500g) per singleton live birth.
Clinical intrauterine pregnancy was defined as ultrasound confirmation of at least 1 gestational sac within the uterus, with or without fetal cardiac activity or fetal pole, or in the absence of ultrasound data, a documented birth, spontaneous miscarriage, or induced abortion.4 A live birth was defined as the birth of at least 1 live-born infant at least 20 weeks’ gestational age.
Polynomial trends in donor sperm use and outcomes were explored using linear regression with linear, quadratic, and cubic terms. We included in the fitted regression model the highest order term for time that was statistically significant as well as all lower-order terms, in which time was calculated as x = year – 1996. We reported the fitted regression equation and R2 value (overlaid on figures). The outcomes were analyzed using log binomial regression with generalized estimating equations to adjust for clustering by clinic.
For each outcome, we reported numbers, percentages, unadjusted and adjusted relative risks (RR), and 95% confidence intervals (CIs). The covariates included for statistical adjustment are listed in Table 1. We considered interactions between use of donor sperm and maternal age and male factor infertility, but neither was statistically significant. In the event of a shift in the direction of a statistically significant effect before and after statistical adjustment (eg, RR <1 and adjusted RR >1), we explored the source of confounding by removing each covariate from the adjusted model one at a time and assessing the change in adjusted RR.
TABLE 1.
Outcomes of fresh autologous cycles with oocyte retrieval using donor and nondonor sperm, 2010–2014
| Outcome measure | Donor sperm cycles, n, % | Nondonor sperm cycles, n, % | RR (95% CI) | aRRa (95% CI) |
|---|---|---|---|---|
| Per cycle with retrieval | ||||
| Intrauterine Pregnancy | 8071 (35.7) | 164,881 (39.8) | 0.90 (0.86–0.94) | 1.05 (1.01–1.10) |
| Live birthb | 6318 (27.9) | 134,592 (32.5) | 0.86 (0.82–0.90) | 1.06 (1.01–1.10) |
| Per transfer | ||||
| Intrauterine Pregnancy | 8071 (40.8) | 164,881 (45.1) | 0.90 (0.86–0.95) | 1.04 (0.997–1.09) |
| Live birthb | 6318 (31.9) | 134,592 (36.8) | 0.87 (0.83–0.91) | 1.04 (0.998–1.09) |
| Per pregnancy | ||||
| Live birthb | 6318 (78.4) | 134,592 (81.7) | 0.96 (0.95–0.97) | 1.00 (0.99–1.01) |
| Full-term live birthc | 4819 (59.8) | 100,824 (61.3) | 0.98 (0.96–0.99) | 1.01 (0.99–1.03) |
| Per singleton live birth | ||||
| Pretermc | 531 (11.5) | 11,474 (11.8) | 0.98 (0.90–1.06) | 0.98 (0.90–1.06) |
| Low birthweightd | 401 (8.8) | 9058 (9.4) | 0.94 (0.86–1.02) | 0.91 (0.83–0.99) |
aRR, adjusted relative risk; CI, confidence interval; PGD, preimplantation genetic diagnosis; PGS, preimplantation genetic screening; RR, relative risk.
Adjusted for maternal age, gravidity, parity, number of prior assisted reproductive technology cycles, diagnosis (male factor, endometriosis, diminished ovarian reserve, ovulatory dysfunction, tubal factor, uterine factor, unexplained, other), stimulation type, hyperstimulation, number of oocytes retrieved, and PGD/PGS;
Live births are all births of at least 1 live-born infant with a gestational age of at least 20 weeks;
Full-term live births have a gestational age of ≥37 weeks; preterm live births have a gestational age <37 weeks;
Low birthweight live births are live births of infants weighing less than 2500 g.
Maternal race, ethnicity, and body mass index (BMI) were not included in the multivariable models because of a large percentage of missing values (>35% and >17%, respectively); however, a subanalysis was performed controlling for these variables.
Statistical significance was assessed using α = 0.05. Statistical analysis was conducted using SAS version 9.3 (SAS Institute, Cary, NC). This study was approved by the Institutional Review Board of the Centers for Disease Control and Prevention.
Results
In total, 74,892 fresh cycles (with oocyte retrieval) using donor sperm were performed between 1996 and 2014; 54,900 of these cycles used autologous oocytes and 13,542 used donor oocytes. The number of fresh cycles using donor sperm with autologous oocytes increased over time, peaking in 2011 with 5161 cycles (Figure 1A). The number of fresh cycles using donor oocytes followed a similar pattern except for a decline in recent years, peaking in 2012 with 1195 cycles. Although there was a slight initial decline from 3.8% to 2.6% between 1996 and 1999, the percentage of the banking and fresh cycles using donor sperm has since continued to increase over time, accounting for 4.9–6.2% of all ART cycles between 2010 and 2014 (n = 7351) (Figure 1B).
FIGURE 1. Number of fresh cycles using donor sperm.
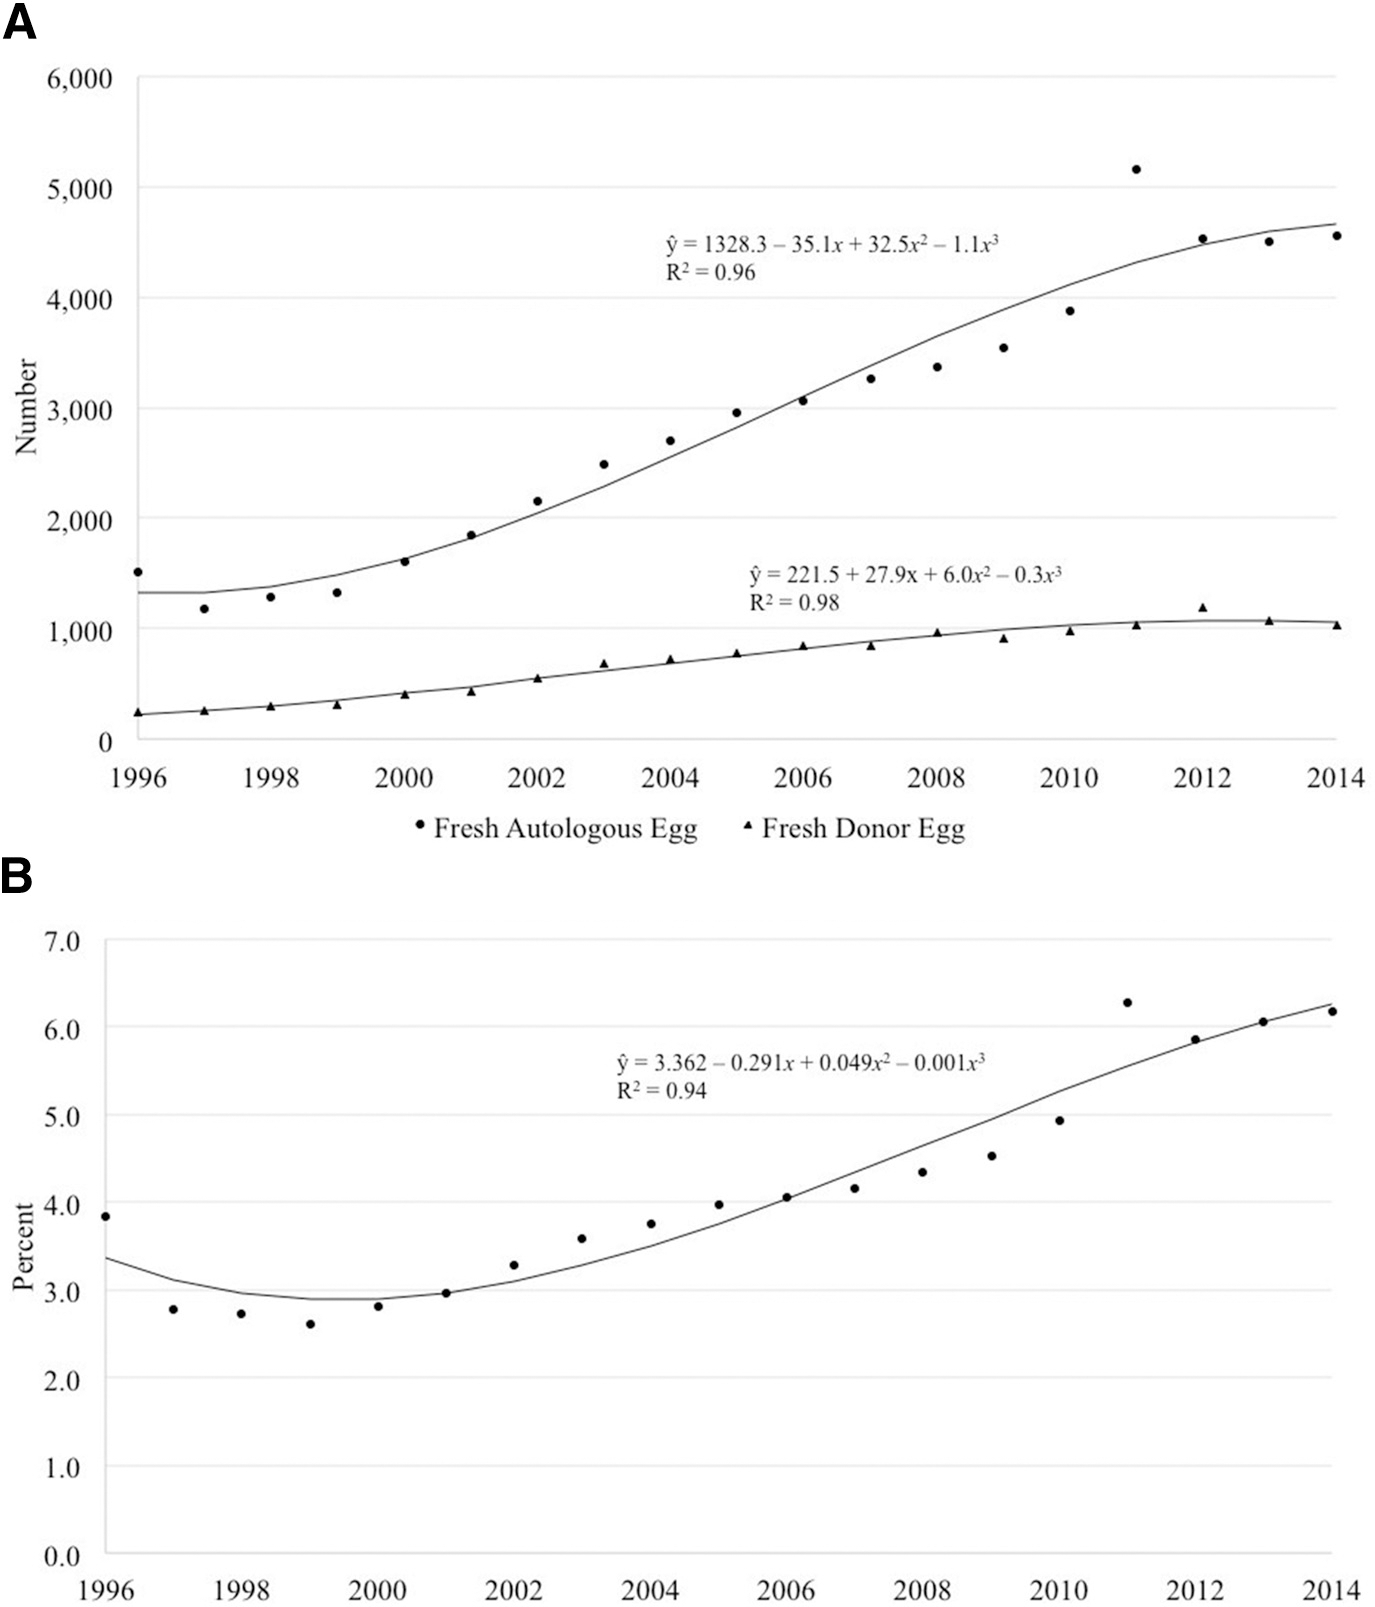
A, Number of fresh autologous and donor oocyte ART cyclesa using donor sperm, United States, 1996–2014. The number of fresh cycles using donor sperm with autologous oocytes has increased over time. The number of fresh cycles using donor oocytes followed a similar pattern except for a decline in recent years peaking in 2012. B, Percentage of all banking and fresh ART cyclesa using donor sperm, United States, 1996–2014. Although there was a slight initial decline between 1996 and 1999, the percentage of cycles using donor sperm has since continued to increase over time, accounting for 4.9–6.2% of all ART cycles between 2010 and 2014.
ART, assisted reproductive technology.
a Cycles in which oocyte retrieval was performed.
Gerkowicz et al. ART with donor sperm: national trends and perinatal outcomes. Am J Obstet Gynecol 2018.
The total LBR across all years was 28.5% and 31.9% in fresh autologous cycles using donor and nondonor sperm, respectively, with a range of 24.5–30.6% for donor sperm and 26.2–34.0% for nondonor sperm cycles (Figure 2A). For both groups, the LBR increased and then decreased over time.
FIGURE 2. Cycles resulting in live birth by donor and nondonor sperm.
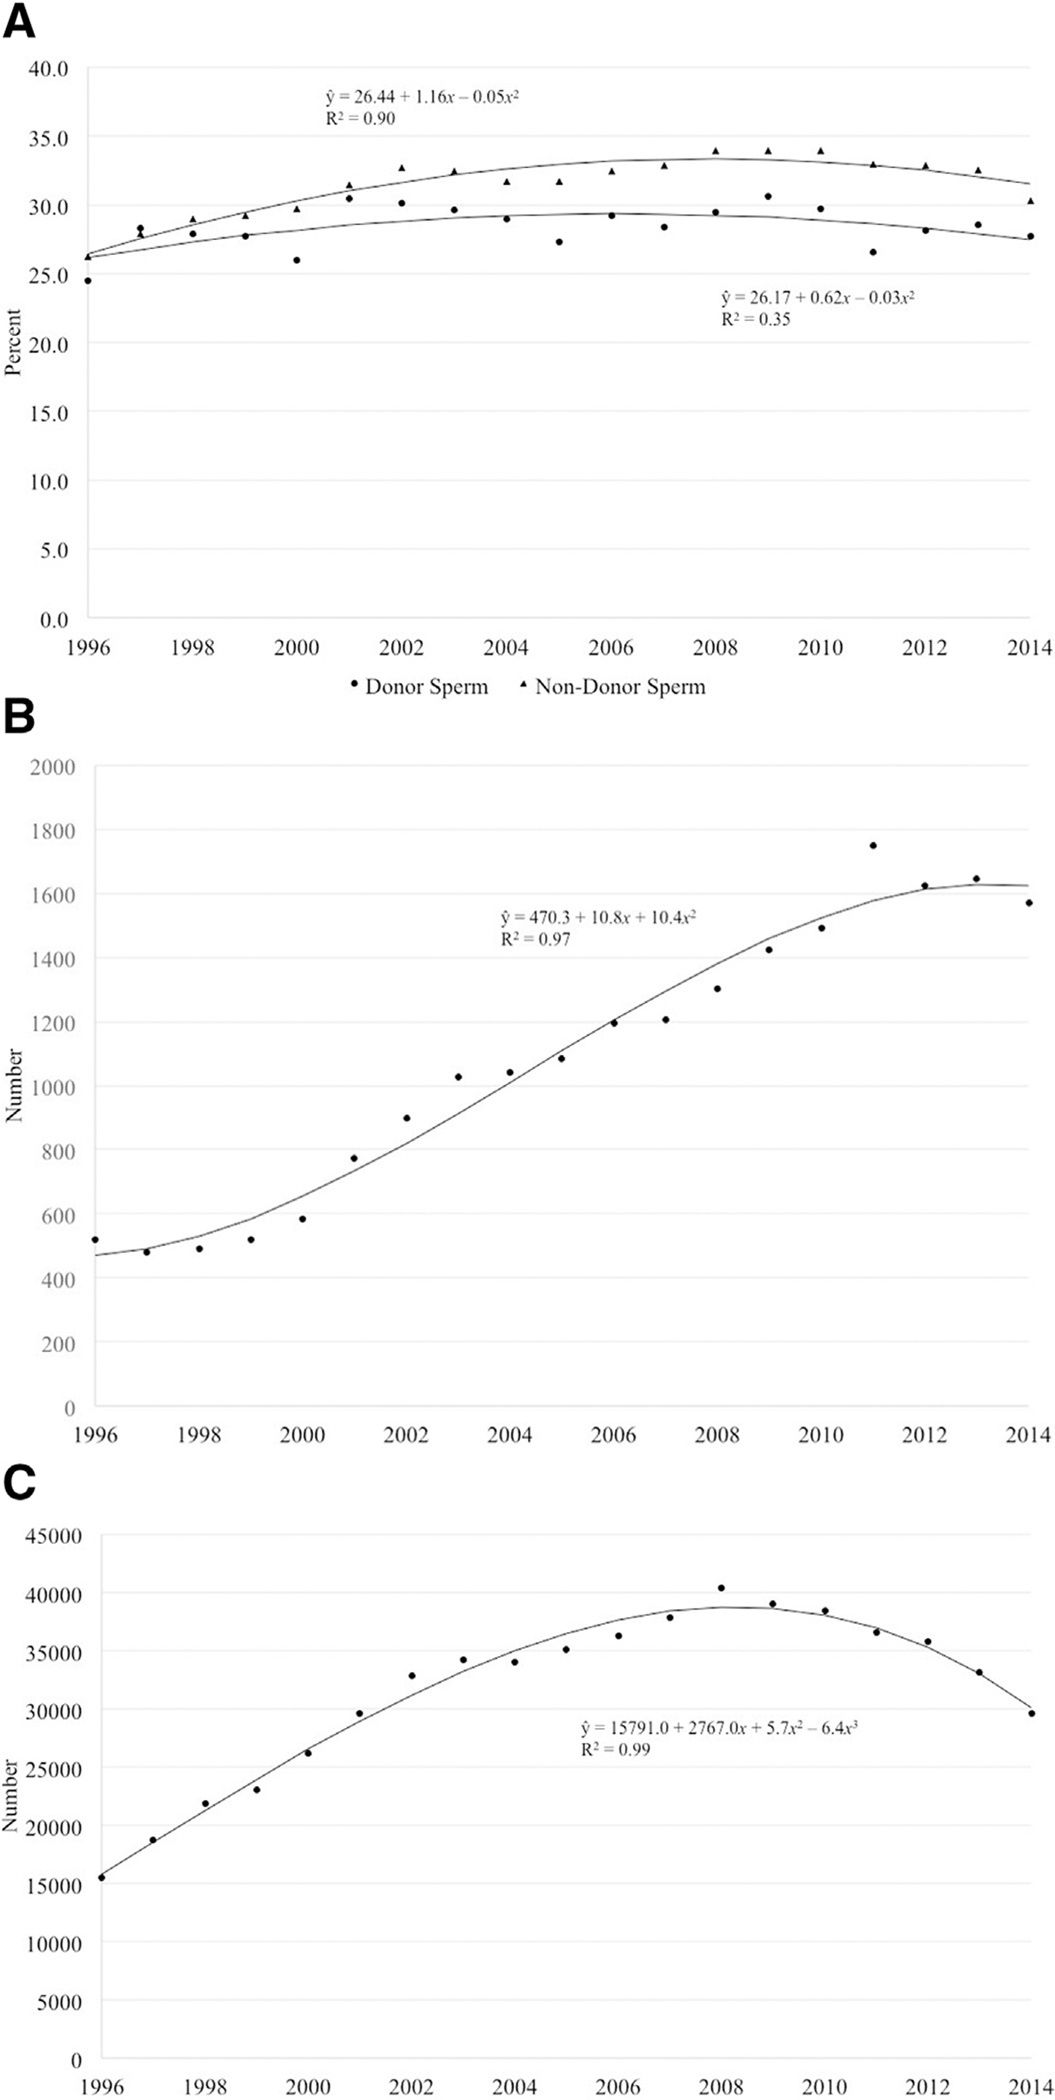
A, Percentage of fresh autologous cyclesa that resulted in a live birth by use of donor and nondonor sperm, United States, 1996–2014. The total live birth rate across all years was 28.5% and 31.9% in fresh autologous cycles using donor and nondonor sperm, respectively. For both groups, the live birth rate has increased and then decreased over time. B, Number of live-born infants from fresh autologous cycles using donor sperm,a United States, 1996–2014. The number of infants born from fresh autologous cycles using donor sperm has increased over time. C, Number of live-born infants from fresh autologous cycles using nondonor sperm,a United States, 1996–2014. The number of infants born from fresh autologous cycles using nondonor sperm increased from 15,452 in 1996 to a peak of 40,386 in 2008 before falling to 29,615 in 2014.
a Cycles in which oocyte retrieval was performed.
Gerkowicz et al. ART with donor sperm: national trends and perinatal outcomes. Am J Obstet Gynecol 2018.
The number of infants born from fresh autologous cycles using donor sperm increased over time before falling to 1570 in 2014, while the number of infants born from fresh autologous cycles using nondonor sperm increased from 15,452 in 1996 to a peak of 40,386 in 2008 before falling to 29,615 in 2014, possibly reflecting a trend toward transfer of fewer embryos (Figure 2, B and C). The average female age of patients undergoing fresh autologous cycles using donor and nondonor sperm both increased over time with a decrease in recent years but with cycles using donor sperm exhibiting a higher average female age overall (Figure 3).
FIGURE 3. Average maternal age for cycles by donor or nondonor sperm.
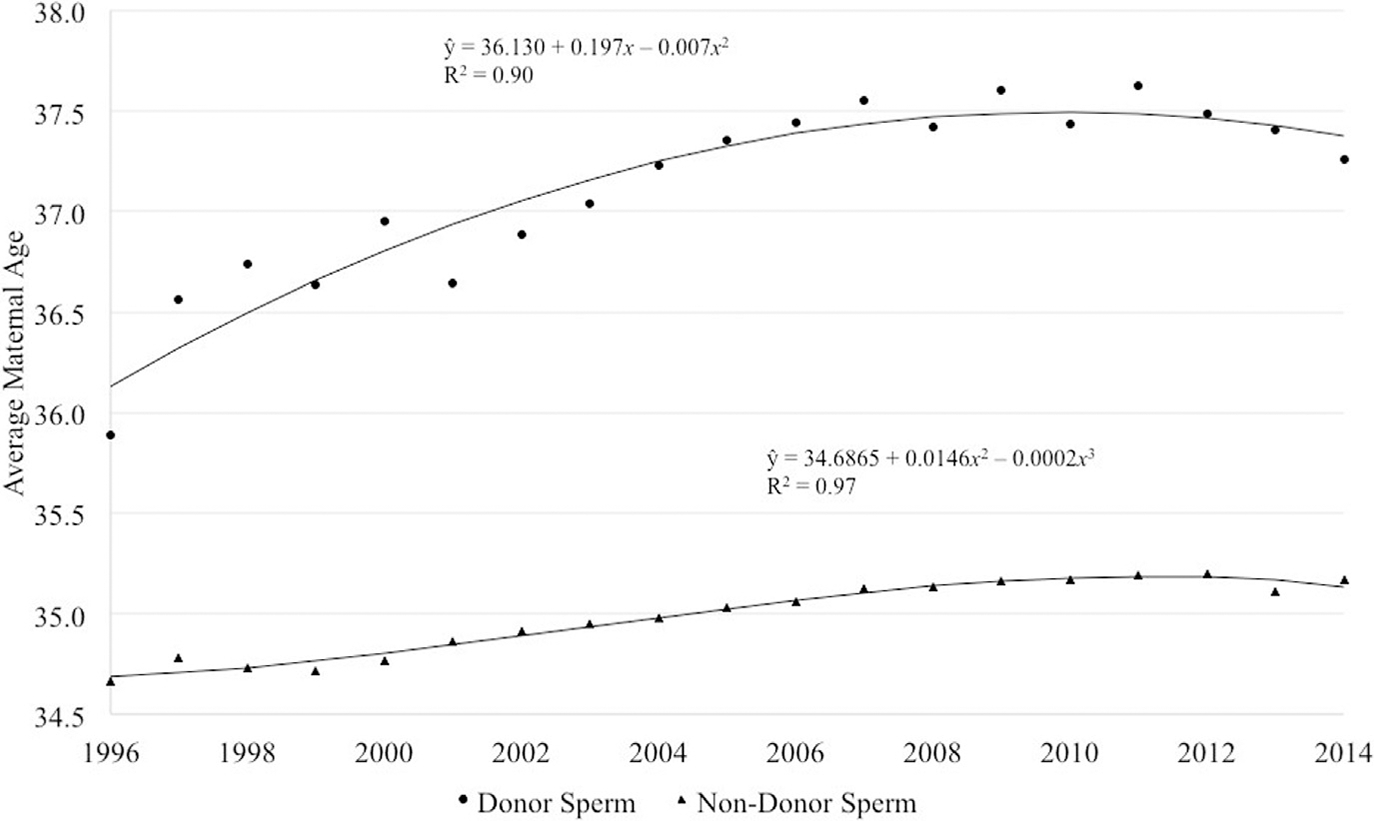
Average maternal age for fresh autologous cyclesa by use of donor or nondonor sperm, United States, 1996–2014. The average female age of patients has increased over time with a slight decrease in recent years. Cycles using donor sperm, however, consistently have a higher average female age
a Cycles in which oocyte retrieval was performed.
Gerkowicz et al. ART with donor sperm: national trends and perinatal outcomes. Am J Obstet Gynecol 2018.
The female age distribution at cycle start differed by sperm source, with a higher percentage of females 38–40 years (24.6% vs 19.3%) and ≥41 years old (30.0% vs 14.6%) among donor sperm cycles compared with nondonor sperm cycles (Table 2). The distribution of female BMI among donor sperm cycles showed a higher percentage of women with BMI ≥25 kg.m2 (22.3%) and BMI ≥30 kg.m2 (20.4%), compared with nondonor sperm cycles (19.3% and 15.1%).
TABLE 2.
Characteristics of fresh autologous cycles with oocyte retrieval using donor and nondonor sperm, 2010–2014
| Characteristics | Donor sperm cycles, n, % | Nondonor sperm cycles, n, % | P value |
|---|---|---|---|
| Cycles, na | 22,619 | 414,950 | |
| Female age, y | |||
| <35 | 6008 (26.6) | 186,004 (44.8) | < .001 |
| 35–37 | 4257 (18.8) | 88,345 (21.3) | |
| 38–40 | 5562 (24.6) | 79,882 (19.3) | |
| ≥41 | 6792 (30.0) | 60,719 (14.6) | |
| Female race/ethnicity | |||
| Non-Hispanic white | 9889 (43.7) | 183,906 (44.3) | < .001 |
| Non-Hispanic black | 1356 (6.0) | 19,131 (4.6) | |
| Asian/Pacific Islander | 1005 (4.4) | 39,196 (9.5) | |
| Hispanic | 1169 (5.2) | 24,692 (6.0) | |
| Other | 18 (0.1) | 753 (0.2) | |
| Unknown/missing | 9182 (40.6) | 147,272 (35.5) | |
| Female BMI, kg/m2 | |||
| <18.5 | 320 (1.4) | 10,022 (2.4) | < .001 |
| 18.5–24.9 | 8622 (38.1) | 189,073 (45.6) | |
| 25.0–29.9 | 5033 (22.3) | 80,183 (19.3) | |
| ≥30 | 4610 (20.4) | 62,756 (15.1) | |
| Unknown/missing | 4034 (17.8) | 72,916 (17.6) | |
| Prior pregnancies, n | |||
| 0 | 12,106 (53.7) | 187,255 (45.3) | < .001 |
| 1 | 5867 (26.0) | 107,490 (26.0) | |
| ‡2 | 4593 (20.4) | 119,061 (28.8) | |
| Prior spontaneous abortions, n | |||
| 0 | 16,810 (74.7) | 288,653 (69.9) | < .001 |
| 1 | 3930 (17.5) | 79,722 (19.3) | |
| ≥2 | 1778 (7.9) | 44,380 (10.8) | |
| Prior births, n | |||
| 0 | 18,344 (81.4) | 294,050 (71.2) | < .001 |
| 1 | 3510 (15.6) | 87,923 (21.3) | |
| ≥2 | 689 (3.1) | 31,231 (7.6) | |
| Prior ART cycles, n | |||
| 0 | 11,858 (52.5) | 239,068 (57.7) | < .001 |
| 1 | 4508 (19.9) | 80,281 (19.4) | |
| ≥2 | 6240 (27.6) | 95,262 (23.0) | |
| Reason for ART | |||
| Male factor | 7620 (33.7) | 152,733 (36.8) | < .001 |
| History of endometriosis | 1401 (6.2) | 42,251 (10.2) | < .001 |
| Diminished ovarian reserve | 7227 (32.0) | 103,132 (24.9) | < .001 |
| Ovulatory dysfunction | 1837 (8.1) | 60,498 (14.6) | < .001 |
| Tubal factor | 1852 (8.2) | 63,567 (15.3) | < .001 |
| Uterine factor | 1071 (4.7) | 21,430 (5.2) | .004 |
| Unexplained | 2662 (11.8) | 60,717 (14.6) | < .001 |
| Other | 6151 (27.2) | 50,761 (12.2) | < .001 |
| Cycle canceled between retrieval and transfer | |||
| Yes | 2800 (12.4) | 49,081 (11.8) | .013 |
| No | 19,819 (87.6) | 365,869 (88.2) | |
| Stimulation type | |||
| None (natural cycle) | 560 (2.5) | 8949 (2.2) | < .001 |
| Oral meds only | 117 (0.5) | 1549 (0.4) | |
| Oral medications plus gonadotropins | 512 (2.3) | 6362 (1.6) | |
| Gonadotropins only (antagonist) | 11,812 (52.9) | 198,661 (48.4) | |
| Gonadotropins only (no suppression) | 666 (3.0) | 11,619 (2.8) | |
| Gonadotropins only (flare) | 2893 (13.0) | 47,674 (11.6) | |
| Gonadotropins only (agonist) | 5675 (25.4) | 133,968 (32.7) | |
| Other | 114 (0.5) | 1536 (0.4) | |
| Ovarian hyperstimulation | |||
| No | 22,452 (99.3) | 410,112 (98.8) | < .001 |
| Yes | 167 (0.7) | 4838 (1.2) | |
| Oocytes retrieved, n | |||
| 0–4 | 4331 (19.2) | 61,307 (14.8) | < .001 |
| 4–9 | 6796 (30.1) | 117,254 (28.3) | |
| >10 | 11,492 (50.8) | 236,389 (57.0) | |
| Used ICSI | |||
| No | 6295 (28.7) | 97,660 (23.7) | < .001 |
| Yes | 15,676 (71.4) | 313,683 (76.3) | |
| Used PGS/PGD | |||
| No | 21,533 (96.6) | 385,344 (94.3) | < .001 |
| Yes | 756 (3.4) | 23,311 (5.7) | |
| Use of PGD for aneuploidy screening | 460 (60.9) | 10,097 (43.3) | |
| Use of PGD for other reasons | 136 (18.0) | 7005 (30.1) | |
| Use of PGD unknown/missing | 160 (21.2) | 6209 (26.6) | |
| Supernumerary embryos cryopreserved, n | |||
| 0 | 13,905 (62.2) | 237,733 (58.0) | < .001 |
| 1–2 | 3469 (15.5) | 70,362 (17.1) | |
| 3–4 | 2289 (10.2) | 46,502 (11.3) | |
| ≥5 | 2685 (12.0) | 55,341 (13.5) | |
| Total transfers, n | 19,816 | 365,780 | |
| Used assisted hatching | |||
| No | 10,824 (54.6) | 217,307 (59.4) | < .001 |
| Yes | 8992 (45.4) | 148,473 (40.6) | |
| Embryos transferred, n | |||
| eSETb | 1621 (8.2) | 35,833 (9.8) | < .001 |
| 1 | 2200 (11.1) | 39,111 (10.7) | |
| 2 | 9460 (47.7) | 199,937 (54.7) | |
| 3 | 4070 (20.5) | 63,366 (17.3) | |
| ≥4 | 2464 (12.4) | 27,510 (7.5) | |
| Embryo stage at transfer | |||
| Days 2/3 | 10,638 (53.8) | 180,789 (49.5) | < .001 |
| Days 5/6 | 8724 (44.1) | 176,531 (48.3) | |
| Other | 429 (2.2) | 8021 (2.2) | |
P value was computed for nonmissing values only; missing categories were not included. Caution must be used to interpret for maternal race and BMI because of the high percentage of missing values.
BMI, body mass index; eSET, elective single-embryo transfer; ICSI, intracytoplasmic sperm injection; PGD, preimplantation genetic diagnosis; PGS, preimplantation genetic screening.
Cycles in which oocyte retrieval was performed;
eSET is selective transfer of 1 embryo when supernumerary embryos are available for cryopreservation.
The distributions of prior pregnancies, spontaneous abortions, and births showed these outcomes to occur in lower percentages of cycles using donor vs nondonor sperm. Approximately 27.6% of donor sperm cycles were conducted among patients having undergone ≥2 prior ART cycles compared with 23.0% among nondonor sperm cycles.
The most common infertility diagnosis for both groups was male factor infertility, accounting for 33.7% and 36.8% of donor and nondonor sperm cycles, respectively. The second most common diagnosis was diminished ovarian reserve. A diagnosis of other accounted for 27.2% and 12.2% of donor and nondonor sperm cycles, respectively. Gonadotropin-releasing hormone antagonist stimulation protocols were most common in both donor and nondonor sperm cycles. Differences in the number of oocytes retrieved were noted, with greater than 10 oocytes retrieved in 50.8% and 57.0% of donor and nondonor sperm cycles, respectively.
Regarding mode of fertilization, intracytoplasmic sperm injection (ICSI) was performed in 71.4% and 76.3% of cycles in donor and nondonor sperm groups. Cycles using donor sperm were more likely to result in fewer embryos cryopreserved. Transfers using donor sperm were more likely to involve 3 or more embryos and occur on day 2 or 3 compared with nondonor sperm cycles. All associations in Table 2 were statistically significant (P < .001).
The percentage of noncancelled cycles resulting in a live birth was higher for nondonor sperm cycles compared with donor sperm cycles (32.5% vs 27.9%, P < .0001) (Table 1), as was the percentage of noncancelled cycles resulting in a singleton live birth (23.5% vs 20.5%, P < .0001) or a multiple live birth (9.0% vs 7.5%, P < .0001). However, among those cycles resulting in a live birth, the percentage of multiple live births was not significantly different for nondonor sperm cycles compared with donor sperm cycles (27.6% vs 26.8%, P = .2049; results not shown).
Intrauterine pregnancy rates per cycle were 35.7% with donor sperm and 39.8% with nondonor sperm, with an adjusted RR of 1.05 (95% CI, 1.01–1.10). LBRs per cycle were 27.9% and 32.5% with donor and nondonor sperm (aRR, 1.06, 95% CI, 1.01–1.10); adjustment for maternal age explained most of the difference between the unadjusted and adjusted RRs for this association. The percentage of transfers resulting in intrauterine pregnancy and live birth were similarly lower for donor sperm cycles but not significantly different after adjustment.
Per pregnancy, LBRs were 78.4% and 81.7% (aRR, 1.00, 95% CI, 0.99–1.01) and full-term LBRs were 59.8% and 61.3% (aRR, 1.01, 95% CI, 0.99–1.03) in donor and nondonor sperm cycles. Per singleton live birth, preterm LBRs were 11.5% and 11.8% (aRR, 0.98, 95% CI, 0.90–1.06) with low birthweight LBRs of 8.8% and 9.4% (aRR, 0.91, 95% CI, 0.83–0.99) in donor and nondonor sperm cycles. Results from a subanalysis controlling for maternal race/ethnicity and BMI were similar (results not shown).
Comment
ART donor sperm use has increased since 1996 and accounted for 6.2% of all banking and fresh ART cycles in 2014. Average maternal age was higher in cycles using donor vs nondonor sperm. Use of donor sperm was associated with an increased rate of pregnancy and live birth compared with nondonor sperm cycles when calculated per retrieval, but no significant differences were noted when calculated per transfer.
There were no significant differences in rates of preterm births when comparing donor and nondonor sperm among singleton births. Among singletons, a decrease in low birthweight risk was noted in donor sperm cycles; however, these statistical findings are likely of limited clinical significance.
Studies have shown a general trend in the United States toward increased maternal age at time of first birth.29 From 2000 to 2014, the proportion of first births to women aged 30–34 years rose 28% and first births to women aged 35 years and older rose 23%33 In the present study, we found that between 2010 and 2014, 73.4% of ART cycles using donor sperm were conducted among women 35 years old and older as compared with 55.2% of cycles using nondonor sperm. Similarly, increased use of third-party ART (including donor sperm) with advancing maternal age has been reported.3 With increased social acceptance of the use of donor gametes, single women may be more inclined to use donor sperm.34
The primary indications for use of donor sperm are male factor infertilityor lack of a male partner. In NASS, male factor infertility is defined as infertility caused by abnormal semen parameters or abnormal sperm function.35 Because cycles among patients with no male partner do not satisfy a defined reason for using ART in NASS, we would expect these to be classified as other. Data from the United Kingdom demonstrates a significantly increasing trend in female couples pursuing treatment with donor sperm (4% to 11.5% from 2000 to 2010) and a similar rise in single women (2% to 8%).31
The Human Fertilisation and Embryology Authority reports that almost two thirds of patients accessing fertility treatments registered with a male partner, 15% registered with no partner, and 21% registered with a female partner.5 In their 2014 report, they note a 20% increase in both donor inseminations and donor sperm IVF in female couples.6 Other studies note similar trends.36,37 As a result, we anticipated a higher percentage of cycles with a male factor diagnosis as well as a higher percentage of cycles classified as other reason for ART among cycles using donor sperm than among nondonor sperm cycles.
While we did see a higher percentage of other reason for donor sperm cycles, the percentage of cycles using donor sperm that received a male factor diagnosis was lower (33.7%) than those using nondonor sperm (36.8%). The unexpected findings for cycles with male factor infertility may be due to limitations in the definition; severity of male factor is not quantified and the reasoning behind use of donor sperm for male factor is often unknown.
Among cycles with male factor, only 4.7% used donor sperm, whereas 5.4% of cycles without male factor used donor sperm. This may reflect a lack of clarity in diagnosis categorization once donor sperm is used; one possibility is that clinics may perceive the cycle to no longer be characterized by a male-related factor because the donor sperm source does not have infertility. Because donor sperm use in ART cycles increases, national reporting can be improved by clarifying the male factor infertility diagnosis, especially in relation to use of donor sperm, to ensure proper cycle and outcome monitoring.
Following male factor, diminished ovarian reserve was the next most common diagnosis. Decreasing prevalence of male factor infertility with increased maternal age, particularly in women older than age 40 years, who were more likely to have the diagnosis of diminished ovarian reserve than male factor when undergoing IVF cycles with donor sperm has been reported.3
We found that ICSI use between 2010 and 2014 was higher than expected for donor sperm cycles at 71.4%, only slightly lower than ICSI use in nondonor sperm cycles (76.3%).32,38 This may reflect the application of ICSI for reasons other than male factor infertility (eg, unexplained infertility, poor-quality oocytes, low oocyte yield, or prior failed conventional fertilization), which may reflect a decision made based on semen parameters on the day of fertilization.39
Whereas some studies have found when postprocessing donor spermatozoa motility is low, fertilization by ICSI is associated with significantly higher pregnancy rates compared with those of conventional fertilization.16 The increase in donor sperm ART may be partially explained by increased ART use among single women and female couples as well as increased social acceptance of donor gametes; however, the reason is likely multifactorial.
After adjustment, use of donor sperm was associated with an increased rate of intrauterine pregnancy and live birth per retrieval but not per transfer; although statistically significant, many estimates and confidence intervals were close to 1.00 and are likely of limited clinical significance. Maternal age was the confounding variable driving this shift in association. Other studies have found no difference in clinical pregnancy or LBRs when comparing IVF with autologous oocytes and donor vs nondonor sperm.3,40
Similar LBRs per pregnancy (76.2% as compared with 78.4% in our study) were found in a French cohort study of 3381 pregnancies following IVF with donor spermbetween1989and1994.9 Inastudy of patients with male factor infertility, higher LBRs were found in IVF/ICSI donor sperm cycles compared with nondonor sperm cycles; however, the differences were not statistically significant.41
Pregnancy and obstetric outcome data in our study were also reassuring, with no difference in preterm birth or miscarriage rates seen when comparing outcomes for donor vs nondonor sperm. Findings from other studies suggest no difference in outcomes such as spontaneous abortion and stillborn infants3 as well as low birthweight, preterm delivery, or birth defects following IVF cycles and intrauterine inseminations using donor sperm vs nondonor sperm.9,42 In the present study, a subanalysis controlling for maternal race/ethnicity and BMI revealed similar pregnancy outcomes between women using donor and nondonor sperm.
To our knowledge, our study is the largest of recent trends in donor sperm use among US ART cycles and resulting treatment and perinatal outcomes. The study is strengthened by the large sample size and the 98% compliance of fertility clinics reporting ART data. Furthermore, because the majority of previously published donor sperm outcome data has come from insemination studies, a strength of our study is that we specifically describe ART outcomes, namely pregnancy rates, LBRs, and perinatal outcomes including preterm and low birthweight deliveries.
Our study was limited by the accuracy of input from individual clinics, the amount of missing data for some covariates, and the absence of certain variables such as the fertilization rate or state of the sperm (fresh or frozen) from NASS. While all anonymous donor sperm was likely frozen in accordance with current practice patterns, this field was added to NASS and will be available starting with reporting year 2016.
Additionally, because data collection is cycle based, women who underwent more than 1 ART cycle with oocyte retrieval were included more than once in the outcome data. While generally a strength, the large sample size can also serve as a limitation in that it powers a study to detect small, statistically significant but potentially clinically unimportant differences. Furthermore, the indication for use of donor sperm was not available for analysis. This highlights an area for potential improvement in ART reporting strategies; particularly, if the use of donor gametes continues to rise. These results must be interpreted with caution because they involve only ART cycles and exclude those women who conceived with donor sperm insemination and may have a better prognosis.
In conclusion, use of donor sperm in ART cycles and the number of resultant births has increased over time. Reassuringly, we found that perinatal outcomes were clinically similar between ART cycles that use donor and nondonor sperm.
Footnotes
The authors report no conflict of interest.
The findings and conclusions in this report are those of the authors and do not necessarily represent the official position of the Centers for Disease Control and Prevention.
IRB: Protocol #2238 expires on 12/19/2018
Presented as an oral presentation at the 73rd Scientific Congress of the American Society for Reproductive Medicine, San Antonio, TX, Oct. 28 through Nov. 1, 2017.
Contributor Information
Sabrina A. Gerkowicz, Division of Reproductive Endocrinology and Infertility, Department of Gynecology and Obstetrics, Emory University, Atlanta, GA.; Division of Reproductive Health, National Center for Chronic Disease Prevention and Health Promotion, Centers for Disease Control and Prevention, Atlanta, GA.
Sara B. Crawford, Division of Reproductive Health, National Center for Chronic Disease Prevention and Health Promotion, Centers for Disease Control and Prevention, Atlanta, GA..
Heather S. Hipp, Division of Reproductive Endocrinology and Infertility, Department of Gynecology and Obstetrics, Emory University, Atlanta, GA..
Sheree L. Boulet, Division of Reproductive Health, National Center for Chronic Disease Prevention and Health Promotion, Centers for Disease Control and Prevention, Atlanta, GA..
Dmitry M. Kissin, Division of Reproductive Health, National Center for Chronic Disease Prevention and Health Promotion, Centers for Disease Control and Prevention, Atlanta, GA..
Jennifer F. Kawwass, Division of Reproductive Endocrinology and Infertility, Department of Gynecology and Obstetrics, Emory University, Atlanta, GA.; Division of Reproductive Health, National Center for Chronic Disease Prevention and Health Promotion, Centers for Disease Control and Prevention, Atlanta, GA.
References
- 1.Gregoire AT, Mayer RC. The impregnators. (William Pancoast) (Addison Davis Hard). Fertil Steril 1965;16:130–4. [PubMed] [Google Scholar]
- 2.Steinberger E, Smith KD. Artificial insemination with fresh or frozen semen. A comparative study. JAMA 1973;223:778–83. [PubMed] [Google Scholar]
- 3.Kushnir VA, Darmon SK, Shapiro AJ, Albertini DF, Barad DH, Gleicher N. Utilization of third-party in vitro fertilization in the United States. Am J Obstet Gynecol 2017;216:266. e1–10. [DOI] [PubMed] [Google Scholar]
- 4.Kawwass JF, Monsour M, Crawford S, et al. Trends and outcomes for donor oocyte cycles in the United States, 2000e2010. JAMA 2013;310:2426–34. [DOI] [PMC free article] [PubMed] [Google Scholar]
- 5.HFaE. Egg and sperm donation in the UK. 2012–2013. Available at: https://ifqlive.blob.core.windows.net/umbraco-website/2026/egg-and-sperm-donation-in-the-uk-2012-2013.pdf. Accessed Nov. 16, 2017. [Google Scholar]
- 6.HFaE. Fertility treatment 2014 trends and figures. 2016. Available at: http://ifqtesting.blob.core.windows.net/umbraco-website/1783/fertility-treatment-2014-trends-and-figures.pdf. Accessed Nov. 16, 2017. [Google Scholar]
- 7.Lansac J, Royere D. Follow-up studies of children born after frozen sperm donation. Hum Reprod Update 2001;7:33–7. [DOI] [PubMed] [Google Scholar]
- 8.Lansac J, Le Lannou D, Imbault M, Motreff M, Lecomte C, Prot C. [Pregnancy and delivery following insemination with frozen donor sperm]. Rev Fr Gynecol Obstet 1984;79:565–9. [PubMed] [Google Scholar]
- 9.Lansac J, Thepot F, Mayaux MJ, et al. Pregnancy outcome after artificial insemination or IVF with frozen semen donor: a collaborative study of the French CECOS Federation on 21,597 pregnancies. Eur J Obstet Gynecol Reprod Biol 1997;74:223–8. [DOI] [PubMed] [Google Scholar]
- 10.Mattei JF, Le Marec B. Genetic aspects of artificial insemination by donor (AID). Indications, surveillance and results. Clin Genet 1983;23:132–8. [DOI] [PubMed] [Google Scholar]
- 11.Thepot F, Mayaux MJ, Czyglick F, Wack T, Selva J, Jalbert P. Incidence of birth defects after artificial insemination with frozen donor spermatozoa: a collaborative study of the French CECOS Federation on 11,535 pregnancies. Hum Reprod 1996;11:2319–23. [DOI] [PubMed] [Google Scholar]
- 12.Hoy J, Venn A, Halliday J, Kovacs G, Waalwyk K. Perinatal and obstetric outcomes of donor insemination using cryopreserved semen in Victoria, Australia. Hum Reprod 1999;14: 1760–4. [DOI] [PubMed] [Google Scholar]
- 13.Malchau SS, Loft A, Henningsen AK, Nyboe Andersen A, Pinborg A. Perinatal outcomes in 6,338 singletons born after intrauterine insemination in Denmark, 2007 to 2012: the influence of ovarian stimulation. Fertil Steril 2014;102:1110–6. [DOI] [PubMed] [Google Scholar]
- 14.Viloria T, Garrido N, Minaya F, Remohi J, Munoz M, Meseguer M. Report of results obtained in 2,934 women using donor sperm: donor insemination versus in vitro fertilization according to indication. Fertil Steril 2011;96:1134–7. [DOI] [PubMed] [Google Scholar]
- 15.Clarke GN, Bourne H, Hill P, et al. Artificial insemination and in-vitro fertilization using donor spermatozoa: a report on 15 years of experience. Hum Reprod 1997;12:722–6. [DOI] [PubMed] [Google Scholar]
- 16.Wang JG, Douglas NC, Prosser R, Kort D, Choi JM, Sauer MV. Optimization of IVF pregnancy outcomes with donor spermatozoa. J Assist Reprod Genet 2009;26:83–91. [DOI] [PMC free article] [PubMed] [Google Scholar]
- 17.Cohen J, Edwards RG, Fehilly CB, et al. In vitro fertilization using cryopreserved donor semen in cases where both partners are infertile. Fertil Steril 1985;43:570–4. [DOI] [PubMed] [Google Scholar]
- 18.Robinson JN, Lockwood GM, Dokras A, Egan DM, Ross C, Barlow DH. A controlled study to assess the use of in vitro fertilization with donor semen after failed therapeutic donor insemination. Fertil Steril 1993;59:353–8. [DOI] [PubMed] [Google Scholar]
- 19.Azem F, Botchan A, Yaron Y, et al. Outcome of donor versus husband insemination in couples with unexplained infertility treated by in vitro fertilization and embryo transfer. Fertil Steril 1994;61:1088–91. [DOI] [PubMed] [Google Scholar]
- 20.Gorrill MJ, Burry KA, Patton PE. Pregnancy outcomes using donor sperm insemination after failed in vitro fertilization with intracytoplasmic sperm injection cycles in couples with complex infertility disorders. Fertil Steril 2003;80:936–8. [DOI] [PubMed] [Google Scholar]
- 21.Botchan A, Hauser R, Gamzu R, Yogev L, Paz G, Yavetz H. Results of 6139 artificial insemination cycles with donor spermatozoa. Hum Reprod 2001;16:2298–304. [DOI] [PubMed] [Google Scholar]
- 22.Williams RS, Alderman J. Predictors of success with the use of donor sperm. Am J Obstet Gynecol 2001;185:332–7. [DOI] [PubMed] [Google Scholar]
- 23.Zuzuarregui JL, Meseguer M, Garrido N, Simon C, Pellicer A, Remohi J. Parameters affecting the results in a program of artificial insemination with donor sperm. A 12-year retrospective review of more than 1800 cycles. J Assist Reprod Genet 2004;21:109–18. [DOI] [PMC free article] [PubMed] [Google Scholar]
- 24.Ferrara I, Balet R, Grudzinskas JG. Intrauterine insemination with frozen donor sperm. Pregnancy outcome in relation to age and ovarian stimulation regime. Hum Reprod 2002;17:2320–4. [DOI] [PubMed] [Google Scholar]
- 25.Wolf DP, Patton PE, Burry KA, Kaplan PF. Intrauterine insemination-ready versus conventional semen cryopreservation for donor insemination: a comparison of retrospective results and a prospective, randomized trial. Fertil Steril 2001;76:181–5. [DOI] [PubMed] [Google Scholar]
- 26.Zarek SM, Hill MJ, Richter KS, et al. Singledonor and double-donor sperm intrauterine insemination cycles: does double intrauterine insemination increase clinical pregnancy rates? Fertil Steril 2014;102:739–43. [DOI] [PMC free article] [PubMed] [Google Scholar]
- 27.Mahadevan MM, Trounson AO, Leeton JF. Successful use of human semen cryobanking for in vitro fertilization. Fertil Steril 1983;40:340–3. [DOI] [PubMed] [Google Scholar]
- 28.Englert Y, Delvigne A, Vekemans M, et al. Is fresh or frozen semen to be used in in vitro fertilization with donor sperm? Fertil Steril 1989;51:661–4. [DOI] [PubMed] [Google Scholar]
- 29.Gaudoin M, Dobbie R, Finlayson A, Chalmers J, Cameron IT, Fleming R. Ovulation induction/intrauterine insemination in infertile couples is associated with low-birth-weight infants. Am J Obstet Gynecol 2003;188:611–6. [DOI] [PubMed] [Google Scholar]
- 30.Adams D, Fernandez R, Moore V, et al. Sperm donation perinatal outcomes in an Australian population cohort. J Obstet Gynecol Res 2017;43:1830–9. [DOI] [PubMed] [Google Scholar]
- 31.Gudipati M, Pearce K, Prakash A, et al. The sperm donor programme over 11 years at Newcastle Fertility Centre. Hum Fertil 2013;16:258–65. [DOI] [PubMed] [Google Scholar]
- 32.Centers for Disease Control and Prevention. American Society for Reproductive Medicine, Society for Assisted Reproductive Technology. 2014 Assisted reproductive technology fertility clinic success rates report. Atlanta (GA): US Department of Health and Human Services, Public Health Service; 2016. [Google Scholar]
- 33.Mathews TJ HB. Mean age of mothers is on the rise: United States, 2000e2014. NCHS data brief, no 232. Atlanta (GA): National Center for Health Statistics; 2016. [PubMed] [Google Scholar]
- 34.Hudson N, Culley L, Rapport F, Johnson M, Bharadwaj A. “Public” perceptions of gamete donation: a research review. Pub Underst Sci 2009;18:61–77. [DOI] [PubMed] [Google Scholar]
- 35.Centers for Disease Control and Prevention. Department of Health and Human Services. Reporting of pregnancy success rates from assisted reproductive technology (ART) programs. Fed Regist 2015:51811–9. [Google Scholar]
- 36.Tarin JJ, Garcia-Perez MA, Cano A. Deficiencies in reporting results of lesbians and gays after donor intrauterine insemination and assisted reproductive technology treatments: a review of the first emerging studies. Reprod Biol Endocrinol 2015;13:52. [DOI] [PMC free article] [PubMed] [Google Scholar]
- 37.Hamilton M Sperm donation in the United Kingdom in 2010. Hum Fertil 2010;13:257–62. [DOI] [PubMed] [Google Scholar]
- 38.Centers for Disease Control and Prevention. American Society for Reproductive Medicine, Society for Assisted Reproductive Technology. 2014 Assisted Reproductive Technology National Summary Report. Atlanta (GA): US Department of Health and Human Services; 2016. [Google Scholar]
- 39.Practice Committees of the American Society for Reproductive Medicine and Society for Assisted Reproductive Technology. Intracytoplasmic sperm injection (ICSI) for non-male factor infertility: a committee opinion. Fertil Steril 2012;98:1395–9. [DOI] [PubMed] [Google Scholar]
- 40.Shapiro AJ, Darmon SK, Barad DH, Albertini DF, Gleicher N, Kushnir VA. Effect of race and ethnicity on utilization and outcomes of assisted reproductive technology in the USA. Reprod Biol Endocinol 2017;15:44. [DOI] [PMC free article] [PubMed] [Google Scholar]
- 41.Smith AD, Tilling K, Nelson SM, Lawlor DA. Live-birth rate associated with repeat in vitro fertilization treatment cycles. JAMA 2015;314:2654–62. [DOI] [PMC free article] [PubMed] [Google Scholar]
- 42.Adams DH, Clark RA, Davies MJ, de Lacey S. A meta-analysis of sperm donation offspring health outcomes. J Dev Orig Health Dis 2016:1–12. [DOI] [PubMed] [Google Scholar]