Abstract
Objective:
The compound muscle action potential (CMAP) scan is a useful technique for examination of neuromuscular disorders. The objective of the study is to develop a novel analysis of CMAP scans from the perspective of information theory.
Methods:
A novel index parameter called CMAP distribution index (CDIX) was developed to characterize CMAP scan based on calculation of the information entropy. The performance of CDIX was evaluated using CMAP scan data from healthy control and spinal cord injury (SCI) subjects, and compared with D50 and MScanFit motor unit number estimation (MUNE).
Results:
CDIX was significantly lower for the SCI subjects compared with the healthy control subjects (p < 0.001). A significant correlation (R2 = 0.58, p < 0.001) was found between CDIX and MScanFit MUNE. Among all tested parameters (maximum CMAP, D50, MScanFit MUNE and CDIX), CDIX achieved the smallest relative width of the overlapping zone (WOZ%) between SCI and healthy control subjects.
Conclusion:
CDIX can be inferred as a useful index reflecting motor unit loss and muscle fiber reinnervation changes.
Keywords: Compound muscle action potential (CMAP), CMAP Scan, CMAP distribution index (CDIX), Information entropy, Spinal cord injury (SCI)
I. Introduction
Significant efforts have been made in developing motor unit number estimation (MUNE) methods for diagnosis and follow-up of neuromuscular disease since the first report in 1971 [1]. MUNE methods routinely rely on calculating the ratio of the compound muscle action potential (CMAP) amplitude (or area) to the mean surface recorded motor unit potential (SMUP) amplitude (or area). The mean SMUP is usually estimated from a small sample of motor units. In fact, different strategies used to obtain the sampled motor units characterize or lead to various MUNE methods [2][3], such as incremental stimulation MUNE, multipoint stimulation MUNE, spike triggered averaging MUNE, F wave MUNE, high density surface electromyography (EMG) MUNE, etc. However, a key issue in these MUNE methods is how well the sampled motor units can represent the whole motor unit pool, especially given the distribution characteristics of small and large motor units [4]. The uncertainty of this representativeness has contributed to considerable variance in reported MUNE outcomes.
In contrast to most MUNE methods that rely on a small sample of motor units, the CMAP scan can be more representative of the motor unit population through generating a detailed stimulus-response curve involving hundreds of stimuli to the motor nerve [5][6]. These stimuli are from subthreshold to supramaximal intensity in fine current steps, so an examination of low to high threshold motor units can be performed. CMAP scan has promoted MUNE development, leading to the Bayesian MUNE [7] and the MScanFit MUNE [8][9]. The former requires very complex computation and substantial time, limiting its wide application. The latter is based on a simplified model, quick and convenient to implement, more applicable in clinical settings [10].
In addition to estimated motor unit number, a variety of parameters, such as “D50”, “step number”, “step percentage %”, “number of returners”, etc. [11–15], can be used to quantify the CMAP scan data. Although these parameters do not provide a direct measure of absolute motor unit number, they can be a useful indicator of motor unit loss and muscle fiber reinnervation. Very recently, Nandedkar et al. reported a novel index parameter derived from CMAP scan called step index (STEPIX) to reflect the number of motor units [16]. The tested amyotrophic lateral sclerosis (ALS) patient data demonstrated the expected disease pattern.
In fact, the difference between typical CMAP scans of normal muscles and diseased muscles can be obvious upon visual inspection. In normal muscles, the CMAP scan usually shows a relatively continuous or smooth sigmoid pattern. The CMAP scan shows large steps with motor unit loss and muscle fiber reinnervation. From a signal processing point of view, various features can be potentially useful to quantify or discriminate different CMAP scan patterns. In this study, we proposed a novel strategy to process CMAP scan data in the nonlinear dynamic domain. A novel index parameter called CMAP distribution index (CDIX) was developed to characterize CMAP scan based on calculation of the information entropy. The novel index was evaluated using CMAP scan data from healthy subjects and individuals with spinal cord injury (SCI). The performance of CDIX was also compared with D50 [14] and MScanFit MUNE [8][9]. The findings indicate that CDIX provides a useful analysis of CMAP scans for examination of neuromuscular injures with motor unit loss and muscle fiber reinnervation.
II. Methods
A. CMAP Distribution Index
As demonstrated in Fig. 1, calculation of CMAP distribution index (CDIX) includes three procedures. Raw CMAP scan data is segmented by removing pre- and post-scan data and then discretized using an adaptive grid size. Both information entropy and CDIX are calculate based on the discrete CMAP scan data.
Fig. 1.
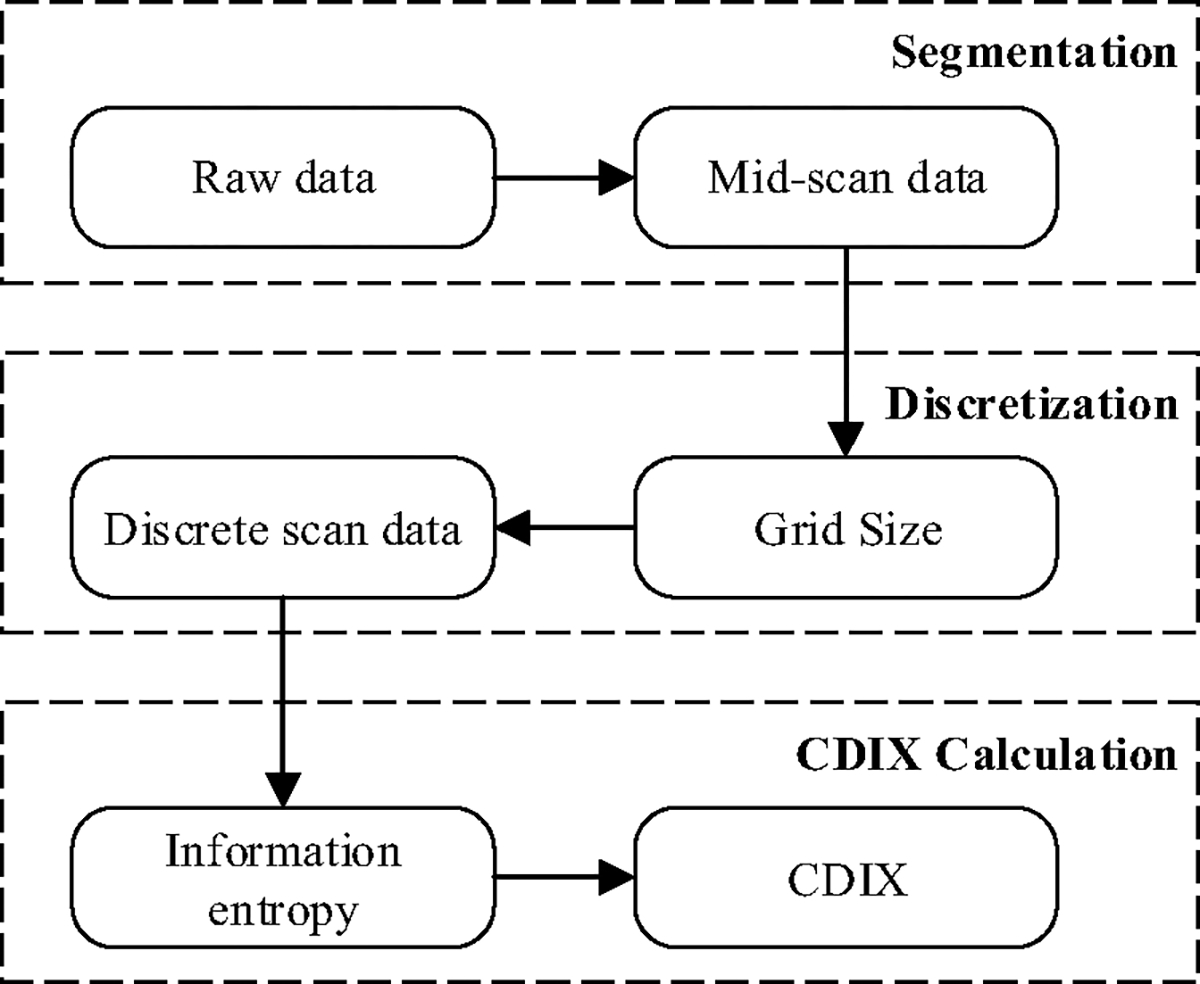
Cascade of CDIX calculation algorithm
A1. Segmentation
Pre-scan refers to the data segment in which the CMAP scan amplitudes are smaller than a preset percentage (named pre-scan threshold or ) of the maximum CMAP amplitude. Post-scan refers to the data segment in which the CMAP scan amplitudes are larger than another preset percentage (named post-scan threshold or ) of the maximum CMAP amplitude. The calculation of information entropy is performed on the data segment between pre-scan and post-scan (named mid-scan). In order to determine the boundaries (denoted as and ) of mid-scan segment while minimizing its sensitivity to alternation and noise, segmentation is performed on smoothed CMAP scan data , which are obtained by filtering the amplitudes of raw CMAP scan data using a 3rd-order Butterworth low-pass filter with cutoff frequency rad per sample, where is the number of stimuli, is the CMAP amplitude evoked by the maximum current stimulus, and is the amplitude evoked by the minimum current stimulus. The mid-scan data are therefore , where the boundary equals to the largest that satisfies (1), and the boundary equals to the smallest that satisfies (2). Fig. 2a illustrates the segmentation result of a healthy control subject.
| (1) |
| (2) |
Fig. 2.
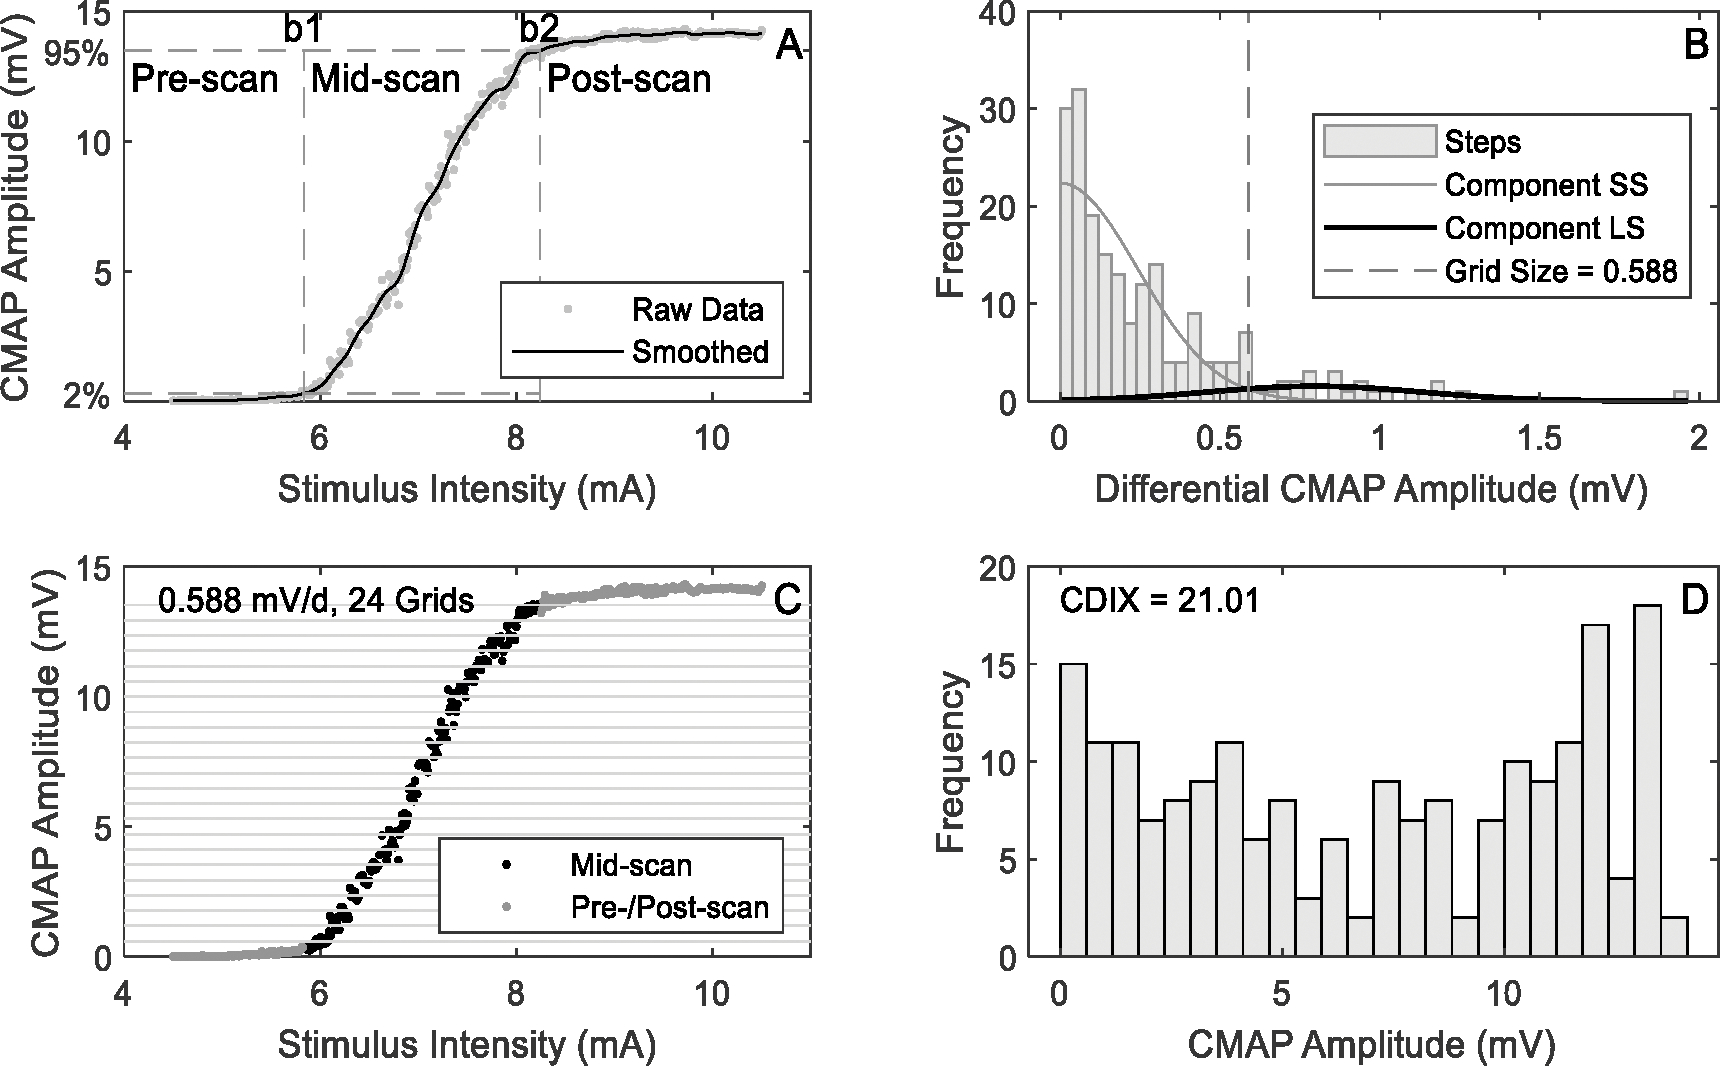
Demonstration of CDIX calculation procedures (using a typical CMAP scan of a healthy control subject)
A2. Discretization
The mid-scan data are discretized so that information entropy can be calculated. The grid size used by discretization is adjusted automatically based on the data. More specifically, there are three steps to determine the value of grid size. First, the absolute values of amplitude differences (named “steps” and denoted as ) are calculated based on mid-scan data using (3).
| (3) |
Fig. 2b show the histogram of obtained from a healthy control subject. There is no restriction on the magnitude of amplitude difference when defining steps, while in previous CMAP scan studies steps usually refer to large amplitude changes [14].
Next, the steps are analyzed using Gaussian mixture model (GMM) with two components. The “small-step” component (SS) is used to model small amplitude differences, which are usually noise or observed when two or more motor units cancel each other out. And the “large-step” component (LS) is used to model the rest of data, i.e. large steps. The peak of probability density of the small-step component is supposed to be around 0 according to experimental data (Fig. 2b). Therefore, the mean and variance of the small-step component are estimated using a vector concatenating and , while those of the large-step component are estimated based on 𝐒 itself. A mirrored LS with the opposite mean and the same variance as LS is also introduced in order to model the mirrored large steps in . The algorithm iterates until the change of LS’s mean falls below 1%. Each step in is then assigned to either SS or LS according to the posterior probability. The minimum step that is assigned to LS is taken as the grid size (denoted as ). Fig. 2b shows an example of the model output as well as the grid size.
Finally, mid-scan data are discretized by using the grid size as in (4), where refers to the discrete scan data with its length , and refers to the nearest integer less than or equal to . Fig. 2c illustrates the grids and the discretization.
| (4) |
Grid count is defined as the minimum number of grids that are required in the discretization, and can be calculated using (5).
| (5) |
A3. Information Entropy and CDIX Calculation
Information entropy (denoted as ) of is calculated using (6), where is the number of instances of in .
| (6) |
In order to facilitate the readability of values, we define CDIX as:
| (7) |
An example of the histogram of and the corresponding CDIX value are shown in Fig. 2d. The bins in Fig. 2d correspond to the grids in Fig. 2c.
B. Experimental Data
The CMAP scan data sets used for testing the proposed analysis were reported in a previous study [17]. A brief description of subjects and experiment procedures is provided below, while the details can refer to [17].
B1. Subjects
Thirteen individuals with SCI tetraplegia (10 males and 3 females) and 13 healthy control subjects (8 males and 5 females) participated in the study. For the SCI group, one subject was left-handed and the other 12 subjects were right-handed, the neurological level ranged from C1 to C7, American Spinal Injury Association (ASIA) Impairment Scale ranged from A to D [18], post injury time ranged from 1 to 24 years. The Graded Redefined Assessment of Strength, Sensibility and Prehension (GRASSP) [19] test was performed, which is an upper limb clinical impairment measure after tetraplegia, including three domains for describing hand function. The full range of GRASSP is from 0 to 116, with lower values indicating more severe impairment. In this study, GRASSP of the SCI subjects ranged from 0 to 108, covering mild, moderate and severe deficits. The pinch force of each subject was measured. Six SCI subjects did not show a measurable pinch force, while the rest 7 SCI subjects had a pinch force ranged from 1.4 to 11.3 kg. For the control group, one subject was left-handed and the other subjects were right-handed. Ulnar nerve conduction studies were performed for all the control subjects and confirmed that their latency, amplitude and conduction velocity were in a normal range. The detailed individual subject information can be found in [17].
For the SCI group, the right hand was tested. For the control group, the test was performed on the individual’s dominant hand. The experimental protocols were approved by the Committee for Protection of Human Subjects (CPHS) at University of Texas Health Science Center at Houston (UTHealth) and TIRR Memorial Hermann Hospital (Houston, TX). All these subjects gave written informed consent in accordance with the Declaration of Helsinki.
B2. Experimental Protocols
The subject was seated comfortably in a chair or wheelchair with shoulder and elbow flexed 90°. The forearm was in semi-prone position on a height-adjustable table. The first dorsal interosseous (FDI) muscle was tested. After cleansing the skin with alcohol pads, the active electrode was placed on the motor point of the FDI muscle, the reference electrode was placed on the distal phalanx of thumb, and the ground electrode was placed on the dorsal side of the hand (Ag-AgCl disposable electrodes, 10 mm in diameter). The stimulating electrode was placed 1–2 cm proximal to the wrist that delivered electrical stimuli to the ulnar nerve. It has two contact surfaces 20 mm apart, 9 mm in diameter each, and the cathode electrode was positioned distally. The stimulating electrode was firmly attached to the skin with surgical tapes and coban self-adherent wraps. The examined hand was restrained in supination during recording to minimize movement artifacts.
All the CMAP scan data were collected under the CMAP scan program of the UltraPro S100 EMG system (Natus Neurology Incorporated, Middleton, WI, USA). An automatic search procedure was performed first to determine S0 and S100, defined as stimulation intensities required to elicit the lowest threshold motor unit and the highest threshold motor unit respectively. Accordingly, stimulation intensities were adjusted to cover the entire range. Then the CMAP scan started using a protocol of a 0.1 ms stimulus pulse duration, 500 steps (stimulus number) and 2 Hz stimulus frequency. The stimulation started from the highest intensity and declined linearly to the lowest intensity. Each CMAP scan took less than 5 minutes to complete.
C. Performance Evaluation
C1. Evaluation Parameters
CDIX of each CMAP scan recording was calculated using a customized Matlab (MathWorks Inc., Natick, MA) program. CDIX values of individuals in the control group are expected to be larger than those in the SCI group. Therefore, the relative width of the overlapping zone (WOZ%) of CDIX between the two groups are defined as (8). and refer to the CDIX values of all the subjects in the control and SCI group, respectively.
| (8) |
The WOZ% falls into the range of [−1,1]. A positive value indicates the relative size of the overlapping area, and a negative value indicates the relative size of the gap between the two groups. In addition to WOZ%, we define a parameter called percentage of subjects in the overlapping zone (POZ%). If WOZ% is positive, POZ% is calculated as the percentage of subjects whose CDIX falls into the overlapping area. Otherwise, POZ% is set to 0.
In addition to CDIX, WOZ% and POZ% of other parameters (D50, MScanFit MUNE, maximal CMAP), defined similarly, were also calculated. D50 is the number of largest consecutive differences that are needed to build-up 50% of the maximum CMAP [14], which proved to be a useful parameter for quantifying CMAP scan discontinuities. MScanFit is a program that estimates motor unit number based on a muscle’s CMAP scan [8][9]. The program implements a mathematical model to simulate the recorded CMAP scan and adjusts sequentially to minimize its discrepancy (percentage error < 7%) from the experimental CMAP scan. Default parameter assignment was used for MScanFit MUNE calculation.
C2. Statistical Analysis
Two-sample t-test with unequal variances was applied to analyze normally distributed data such as the grid size. Otherwise, Wilcoxon rank sum test was applied. Both tests, as well as correlation analysis, were performed using Matlab. Statistical significance was set as p < 0.05.
III. Results
CDIX, D50 and MScanFit MUNE values were calculated from each CMAP scan and the results are presented in this section. Fig. 3 shows the CDIX calculation procedures of a representative SCI subject. Compared with a typical healthy subject (Fig. 2), the SCI subject had similar grid size, but smaller grid count and CDIX.
Fig. 3.
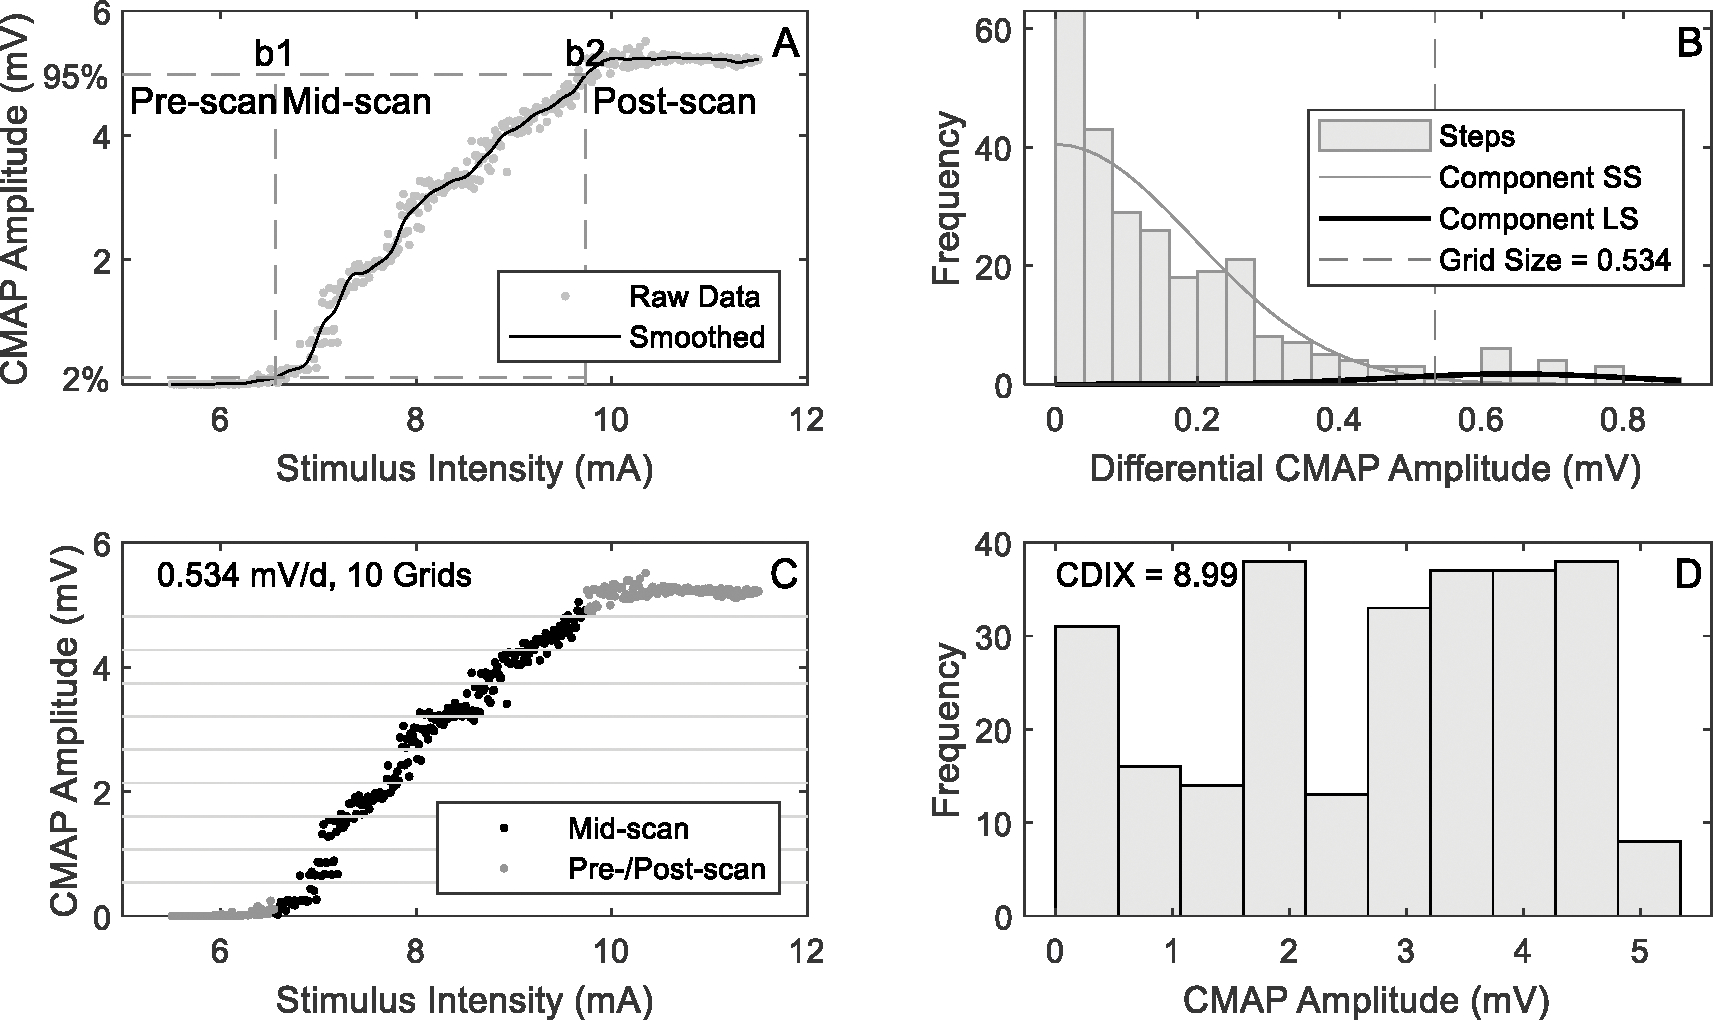
An example of CDIX calculation from CMAP scan of an SCI subject
Across SCI and control subjects, all of the 7596 steps obtained from the CMAP scan data sets were below 3 mV with only one exception (3.11 mV). The initial mean values of the two components used in GMM were therefore set to 0 and 3 mV, respectively. And the initial values of standard deviation were 0.2 mV and 1 mV, respectively. On average, 6.7 ± 5.0 iterations were performed before GMM converged, and no significant difference in the number of iterations was observed between the SCI and healthy control groups (p = 0.698). Fig. 4 shows a comparison of the grid parameters between the two groups, calculated based on GMM. There was no significant difference in grid size between SCI and healthy control groups (p = 0.397), but larger individual difference was observed in the SCI group. Grid count was significantly smaller in the SCI group compared with the healthy control group (p < 0.001).
Fig. 4.
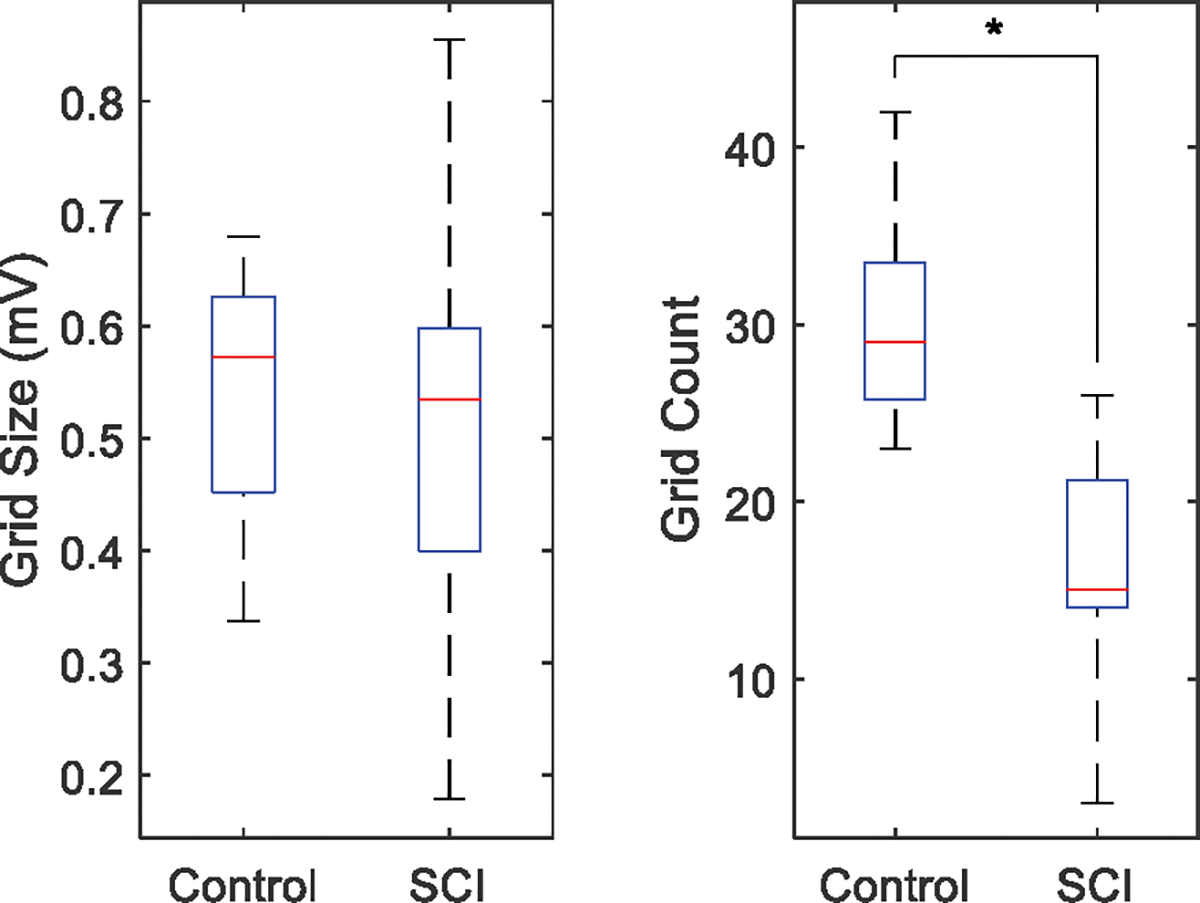
Comparison of grid size and grid count between the SCI and healthy control groups
Fig. 5 shows the CDIX and MScanFit MUNE of each of the individual SCI and healthy control subjects derived from the CMAP scans. Both CDIX and MUNE were significantly lower for the SCI subjects compared with the healthy control subjects. CDIX was found to be significantly correlated with MScanFit MUNE , and maximum CMAP amplitude . From the figure it can be observed that there was an overlapping in MUNE between the SCI and healthy control subjects, while there is no overlapping in CDIX between the two groups.
Fig. 5.
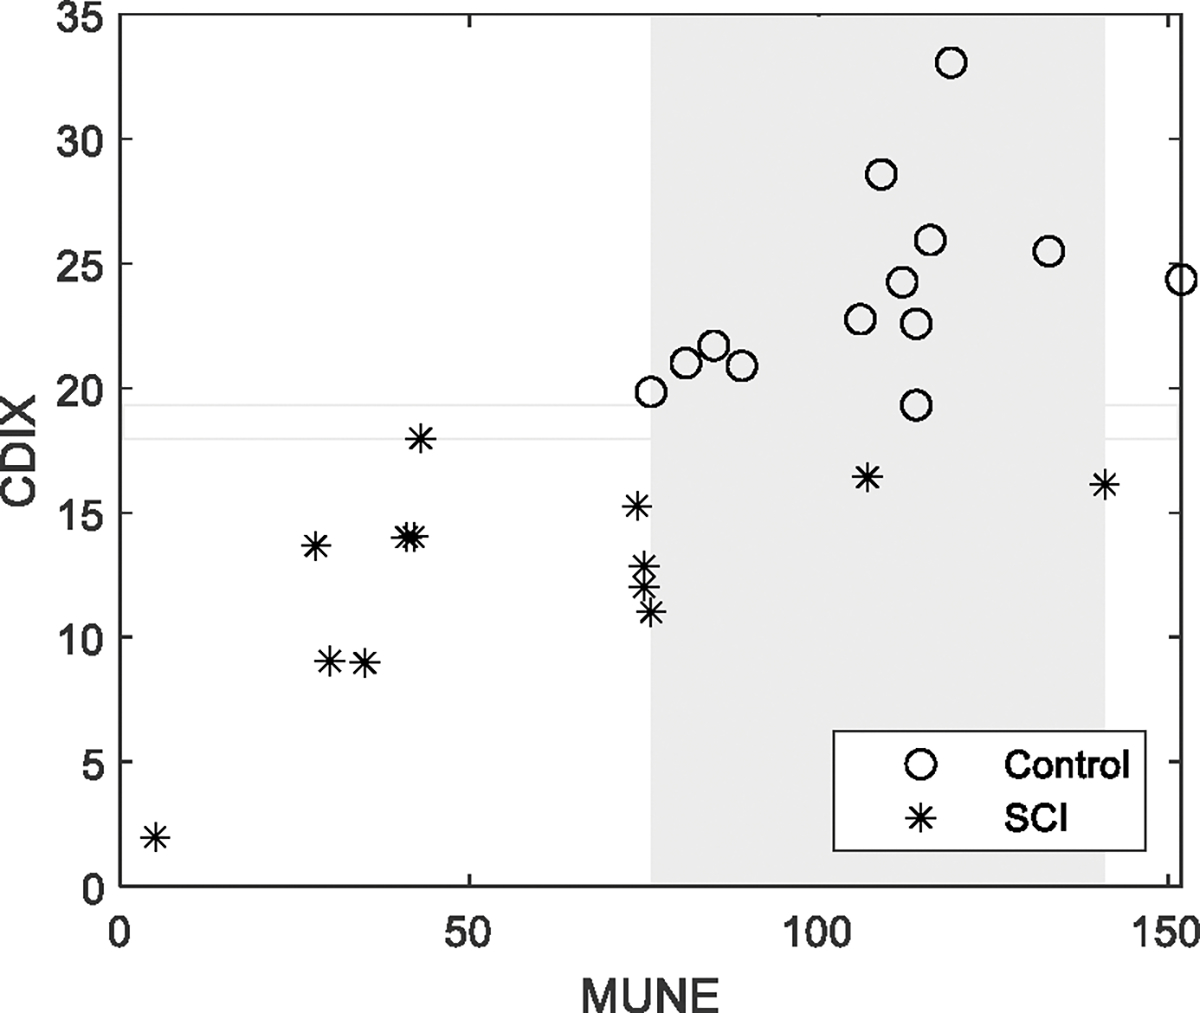
CDIX and MScanFit MUNE of all the subjects. Each marker represents CDIX or MUNE of one subject. Rectangles refer to overlapping areas (grey) or gaps (no fill color) between the control and SCI groups.
Similarly, Fig. 6 shows the D50 and maximum CMAP of each of the subjects. The maximum CMAP amplitude was significantly lower for the SCI subjects compared with the healthy control subjects. But there was no significant difference in D50 between the two groups. An overlapping was observed in both maximum CMAP amplitude and D50 between the SCI and healthy control subjects.
Fig. 6.
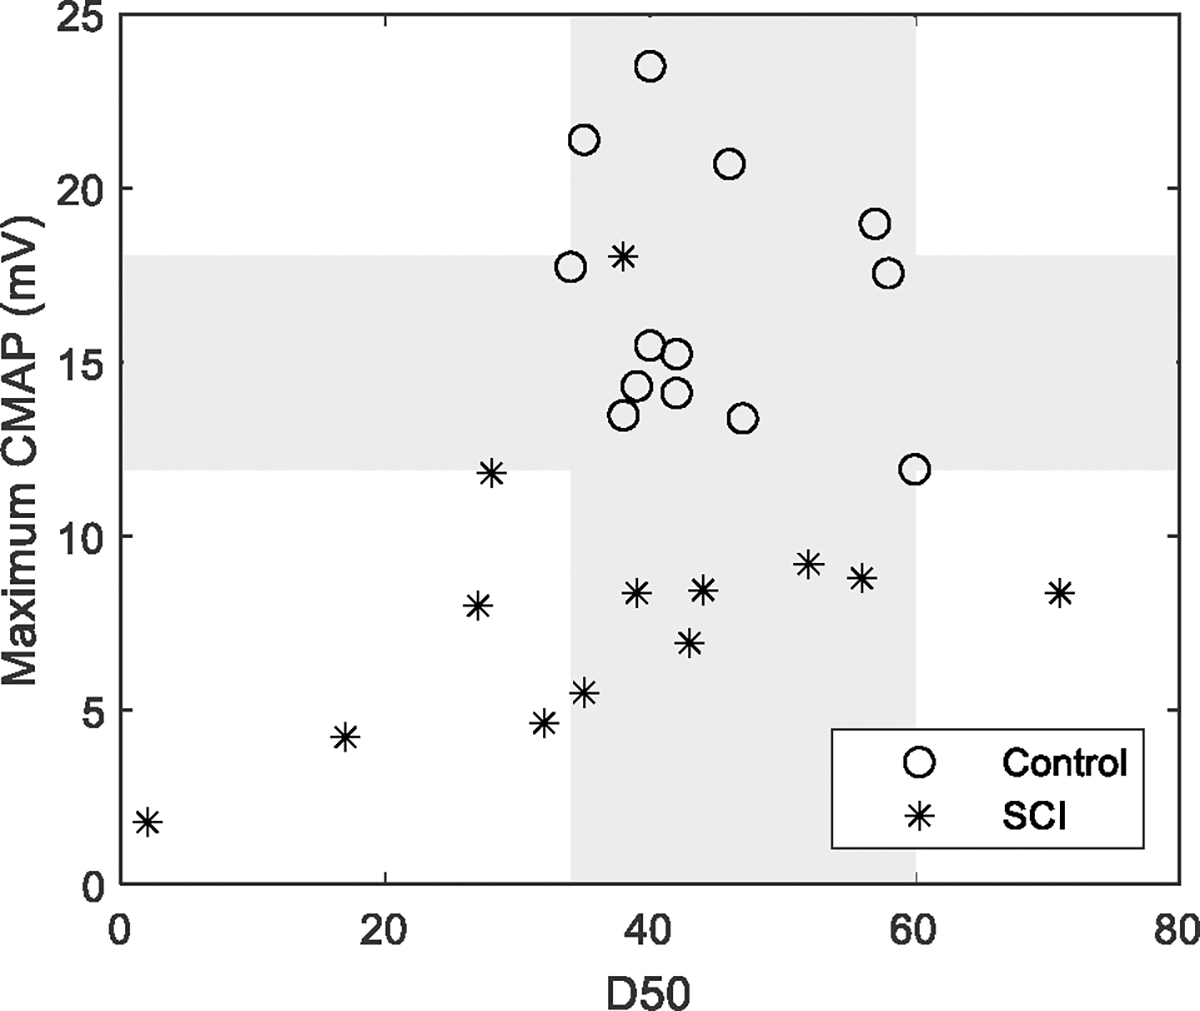
Maximum CMAP and D50 of all the subjects. Each marker represents maximum CMAP amplitude or D50 of one subject. Rectangles refer to overlapping areas (grey) between the control and SCI groups.
Table 1 summarizes the performance of different CMAP scan parameters for examination of SCI and control subjects, including group difference, WOZ% and POZ% of D50, maximum CMAP amplitude, MScanFit MUNE, grid count and CDIX. Among these parameters, CDIX achieved the smallest WOZ% and POZ%.
Table 1.
Performance of CMAP scan parameters for examination of SCI and control subjects
| Group Difference | WOZ% | POZ% | |
|---|---|---|---|
| D50 | p = 0.158 | 37.7% | 76.9% |
| MUNE | p = 6.4 × 10⁻⁴ | 44.2% | 57.7% |
| Maximum CMAP | p = 1.2 × 10⁻⁴ | 28.2% | 38.5% |
| Grid Count | p = 5.0 × 10⁻⁵ | 7.7% | 23.1% |
| CDIX | p = 1.6 × 10⁻⁵ | −4.3% | 0% |
In terms of computation efficiency, the average latency of CDIX calculation was (5.6 ± 3.3) ms using Matlab running on Windows 10 (Intel i5–11320, 16GB memory). No significant difference in latency was observed between the SCI and healthy control groups (p = 0.698).
IV. Discussion
This study presents a novel analysis of CMAP scans from perspective of information theory, and further demonstrates its application in examination of muscles paralyzed by SCI. Compared with a small motor unit sample in previous MUNE methods, CMAP scan has advantages of providing information about a full recruitment range of motor units. In general, there are two categories of MUNE efforts [20]: toward direct estimation of absolute motor unit number or toward development of an indirect index measurement associated with motor unit number changes. Typical developments include most traditional MUNE methods for the former and motor unit number index (MUNIX) [21][22] for the latter. Both categories of efforts have been made in CMAP scan processing including Bayesian MUNE, MScanFit MUNE, D50 and STEPIX, etc.
The novel CDIX parameter represents an effort toward development of an indirect index measurement from CMAP scans. Each point of the CMAP scan curve can be viewed as a combination of recruited motor units. A muscle that has a large number of motor units is able to generate sufficient combinations of recruited motor units to output a continuous or smooth CMAP scan curve (and muscle force as well). For a diseased muscle with motor unit loss and muscle fiber reinnervation, the number of combinations of recruited motor units can decrease dramatically, resulting in discontinuity of the CMAP scan curve (and deterioration in muscle function). Therefore, CMAP scan properties can be characterized by the number of combinations of recruited motor units, which is appropriate to be examined from the perspective of information theory.
In the design of CDIX, each CMAP amplitude of the CMAP scan curve can be interpreted as a symbol that contains information of the examined muscle. The amount of information is quantified by calculating information entropy of the CMAP scan. A larger value of information entropy indicates higher complexity of motor unit recruitment, usually associated with larger number of motor units or their combinations. The complexity of muscle information can decrease with motor unit loss, which is reflected by reduced information entropy (as demonstrated in the SCI subjects compared with heathy control subjects). For the datasets used in this study, most values of information entropy fell within the range of 3 to 5. The purpose of defining CDIX using an exponential function (2 as base, information entropy as exponent) was to facilitate a better comparison between the two groups.
The CDIX or information entropy calculation was based on the mid-CMAP scan data instead of the whole scan for two considerations. On one hand, both pre- and post-scan data carry little information since they tend to be a constant (0 for pre-scan and maximum CMAP amplitude for post-scan). Given this, the information entropy is expected to decrease if its calculation is based on the whole CMAP scan data. On the other hand, in practical applications the range of the CMAP scan is usually determined by the operator, thus the lengths of pre- and post-scans are sensitive to human factors, which may affect CDIX. Therefore, in the design only the mid-scan data are used for CDIX calculation to facilitate its objectivity and robustness.
In order to calculate information entropy of a CMAP scan, discretization of the scan is a required step, where grid sizes can be constant or determined by a variety of algorithms. In this study, an appropriate grid size is expected to be smaller than the action potential amplitude generated by typical motor units but larger than noise, so that the calculated information entropy or CDIX can achieve a high resolution in reflecting motor unit number changes and meanwhile maintain a reasonable noise tolerance. GMM was employed toward this purpose, where both motor unit action potential and noise distributions were modeled to help determine the appropriate grid size. The grid size depends on many factors including the CMAP amplitude and the shape of the CMAP scan. Abnormal large grid sizes (e.g. > 0.7 mV) are usually associated with CMAP scans demonstrating large steps. Abnormal small grid sizes (e.g. < 0.3 mV) are usually associated with CMAP scans having a continuous pattern but with small CMAP amplitudes. As a result, the range of grid size obtained from the SCI group was wider than that of the healthy control group. The information entropy or CDIX derived from this grid size was able to discriminate healthy control and SCI subjects.
Pathological alterations in motor unit properties after SCI have been reported in different electrophysiological studies [23], including varying degrees of motor unit loss [24–27]. The current study provides further evidence of paralyzed muscle changes after SCI. Of particularly note, WOZ% and POZ% of CDIX were the smallest among all the examined CMAP scan parameters. CDIX was the only index that had no overlapping between the healthy control and SCI groups, while there was more or less an overlapping zone in other CMAP scan parameters. This implies its sensitivity in detecting paralyzed muscle changes after SCI.
CMAP scan protocol is noninvasive, and can be performed automatically and quickly. The data processing of CDIX usually takes less than 10 ms, and can be implemented without user interaction or tuning. For example, mid-scan data can be extracted automatically by smoothing the raw data and then performing the segmentation using preset thresholds. CDIX is insensitive to the number of stimuli because information entropy, by definition, does not rely on the length of observations. These advantages make it a clinically applicable method for examining or tracking neuromuscular disorders.
Finally, although the current cross-sectional study demonstrates that CDIX provides a valued measurement to examine paralyzed muscle changes after SCI, we acknowledge it remains to be determined whether CDIX offers a significant benefit in studying disease progression in patients with ALS or other neuromuscular disorders. Therefore, there is a need for further work to assess the potential of CDIX, including quantification of reliability and sensitivity in tracking motor unit number and size changes, detailed comparisons with other often used methods (such as MScanFit MUNE, STEPIX, MUNIX), and application to different muscles and a larger number of patients with different neuromuscular disorders.
Acknowledgments
This study was supported by National Natural Science Foundation of China under grant number 82102179, and Shandong Provincial Natural Science Foundation under grant numbers ZR2021QH267, ZR2021QH053, and ZR2020KF012. XL was supported by the National Institutes of Health under grant number 7 R21 NS113716–02 and the National Institute on Disability and Rehabilitation Research under grant number 90REMM0001–01–00.
Contributor Information
Zhiyuan Lu, School of Rehabilitation Science and Engineering, University of Health and Rehabilitation Sciences, Qingdao, Shandong, 266024, China.
Maoqi Chen, School of Rehabilitation Science and Engineering, University of Health and Rehabilitation Sciences, Qingdao, Shandong, 266024, China.
Ya Zong, Department of Rehabilitation Medicine, Ruijin Hospital, Shanghai Jiao Tong University School of Medicine, Shanghai, 200025, China.
Xiaoyan Li, Department of Neurology, Medical College of Wisconsin, Milwaukee, WI, USA, and also with Fischell Department of Bioengineering, University of Maryland at College Park, College Park, MD, USA.
Ping Zhou, School of Rehabilitation Science and Engineering, University of Health and Rehabilitation Sciences, Qingdao, Shandong, 266024, China.
References
- [1].McComas AJ, Fawcett PR, Campbell MJ, Sica RE. Electrophysiological estimation of the number of motor units within a human muscle. J Neurol Neurosurg Psychiatry. 1971. Apr;34(2):121–31. [DOI] [PMC free article] [PubMed] [Google Scholar]
- [2].Gooch CL, Doherty TJ, Chan KM, Bromberg MB, Lewis RA, Stashuk DW, Berger MJ, Andary MT, Daube JR. Motor unit number estimation: a technology and literature review. Muscle Nerve. 2014. Dec;50(6):884–93 [DOI] [PubMed] [Google Scholar]
- [3].de Carvalho M, Barkhaus PE, Nandedkar SD, Swash M. Motor unit number estimation (MUNE): Where are we now? Clin Neurophysiol. 2018. Aug; 129(8):1507–16. [DOI] [PubMed] [Google Scholar]
- [4].Fuglevand AJ, Winter DA, Patla AE. Models of recruitment and rate coding organization in motor-unit pools. J Neurophysiol. 1993. Dec;70(6):2470–88. [DOI] [PubMed] [Google Scholar]
- [5].Blok JH, Ruitenberg A, Maathuis EM, Visser GH. The electrophysiological muscle scan. Muscle Nerve. 2007. Oct;36(4):436–46. [DOI] [PubMed] [Google Scholar]
- [6].Visser GH, Blok JH. The CMAP scan. Suppl Clin Neurophysiol. 2009; 60:65–77. [DOI] [PubMed] [Google Scholar]
- [7].Ridall PG, Pettitt AN, Henderson RD, McCombe PA. Motor unit number estimation--a Bayesian approach. Biometrics. 2006. Dec;62(4):1235–50. [DOI] [PubMed] [Google Scholar]
- [8].Bostock H Estimating motor unit numbers from a CMAP scan. Muscle Nerve. 2016. Jun;53(6):889–96. [DOI] [PubMed] [Google Scholar]
- [9].Jacobsen AB, Bostock H, Tankisi H. CMAP Scan MUNE (MScan) - A novel motor unit number estimation (MUNE) method. J Vis Exp. 2018. Jun; 136: 56805. [DOI] [PMC free article] [PubMed] [Google Scholar]
- [10].Tankisi H. MScanFit Motor Unit Number Estimation: A Novel Method for Clinics and Research. Neurol Sci Neurophysiol 2021;38:1–5. [Google Scholar]
- [11].Maathuis E, Drenthen J, Visser G, Blok J: Reproducibility of the CMAP scan. Journal of Electromyography and Kinesiology 2011; 21:433–43 [DOI] [PubMed] [Google Scholar]
- [12].Maathuis EM, Henderson RD, Drenthen J, Hutchinson NM, Daube JR, Block JH, Visser GH: Optimal stimulation settings for CMAP scan Registrations. J Brachial Plex Peripher Nerve Injury, 2012, 7:4. [DOI] [PMC free article] [PubMed] [Google Scholar]
- [13].Maathuis EM, Drenthen J, Van Doorn PA, Visser GH, Block JH: The CMAP scan as a tool to monitor disease progression in ALS and PMA. ALS Frontotemporal Degeneration, 2013; 14: 217–223 [DOI] [PubMed] [Google Scholar]
- [14].Sleutjes BT, Montfoort I, Maathuis EM, Drenthen J, van Doorn PA, Visser GH, Blok JH. CMAP scan discontinuities: Automated detection and relation to motor unit loss. Clinical Neurophysiology, 2014. 125(2): 388–95. [DOI] [PubMed] [Google Scholar]
- [15].Sirin NG, Oguz Akarsu E, Kocasoy Orhan E, Erbas B, Artug T, Dede HO, Baslo MB, Idrisoglu HA, Oge AE. Parameters derived from compound muscle action potential scan for discriminating amyotrophic lateral sclerosis-related denervation. Muscle Nerve. 2019. Oct;60(4):400–8. [DOI] [PubMed] [Google Scholar]
- [16].Nandedkar SD, Nandedkar DS, Stalberg EV. Analysis of the compound muscle action potential scan: Step Index (STEPIX) and Amplitude Index (AMPIX). Clin Neurophysiol. 2022. Jul;139:119–127. [DOI] [PubMed] [Google Scholar]
- [17].Zong Y, Lu Z, Chen M, Li X, Stampas A, Deng L, Zhou P. CMAP scan examination of the first dorsal interosseous muscle after spinal cord injury. IEEE Trans Neural Syst Rehabil Eng. 2021;29:1199–1205. [DOI] [PMC free article] [PubMed] [Google Scholar]
- [18].Burns S, Biering-Sørensen F, Donovan W, Graves D, Jha A, Johansen M, Jones L, Krassioukov A, Kirshblum, Mulcahey MJ, Schmidt Read M, Waring W. International Standards for Neurological Classification of Spinal Cord Injury, Revised 2011. Top Spinal Cord Inj Rehabil 2012;18(1):85–99. [DOI] [PMC free article] [PubMed] [Google Scholar]
- [19].Kalsi-Ryan S, Beaton D, Curt A, et al. The Graded Redefined Assessment of Strength Sensibility and Prehension (GRASSP) Reliability and Validity. J Neurotrauma 2012; 29(5):905–914. [DOI] [PubMed] [Google Scholar]
- [20].Zhou P Appropriate index parameters may serve a useful purpose in motor unit number estimation. Clin Neurophysiol. 2022. Jul;139:117–118. [DOI] [PubMed] [Google Scholar]
- [21].Nandedkar SD, Nandedkar DS, Barkhaus PE, Stalberg EV. Motor unit number index (MUNIX). IEEE Trans Biomed Eng. 2004. Dec;51(12):2209–11. [DOI] [PubMed] [Google Scholar]
- [22].Fatehi F, Grapperon AM, Fathi D, Delmont E, Attarian S. The utility of motor unit number index: A systematic review. Neurophysiol Clin. 2018. Oct;48(5):251–9. [DOI] [PubMed] [Google Scholar]
- [23].Korupolu R, Stampas A, Singh M, Zhou P, Francisco G. Electrophysiological Outcome Measures in Spinal Cord Injury Clinical Trials: A Systematic Review. Top Spinal Cord Inj Rehabil. 2019. Fall;25(4):340–354. [DOI] [PMC free article] [PubMed] [Google Scholar]
- [24].Yang JF, Stein RB, Jhamandas J, Gordon T. Motor unit numbers and contractile properties after spinal cord injury. Ann Neurol. 1990; 28: 496–502. [DOI] [PubMed] [Google Scholar]
- [25].Xiong GX, Zhang JW, Hong Y, Guan Y, Guan H. Motor unit number estimation of the tibialis anterior muscle in spinal cord injury. Spinal Cord 2008;46: 696–702. [DOI] [PubMed] [Google Scholar]
- [26].Li X, Jahanmiri-Nezhad F, Rymer WZ, Zhou P. An examination of the motor unit number index (MUNIX) in muscles paralyzed by spinal cord injury. IEEE Trans Inf Technol Biomed. 2012;16(6):1143–1149. [DOI] [PMC free article] [PubMed] [Google Scholar]
- [27].Li L, Li X, Liu J, Zhou P. Alterations in multidimensional motor unit number index of hand muscles after incomplete cervical spinal cord injury. Front Hum Neurosci. 2015;9:238. [DOI] [PMC free article] [PubMed] [Google Scholar]


