Abstract
Aims/hypothesis
Beta cells within the pancreatic islet represent a heterogenous population wherein individual sub-groups of cells make distinct contributions to the overall control of insulin secretion. These include a subpopulation of highly connected ‘hub’ cells, important for the propagation of intercellular Ca2+ waves. Functional subpopulations have also been demonstrated in human beta cells, with an altered subtype distribution apparent in type 2 diabetes. At present, the molecular mechanisms through which beta cell hierarchy is established are poorly understood. Changes at the level of the epigenome provide one such possibility, which we explore here by focusing on the imprinted gene Nnat (encoding neuronatin [NNAT]), which is required for normal insulin synthesis and secretion.
Methods
Single-cell RNA-seq datasets were examined using Seurat 4.0 and ClusterProfiler running under R. Transgenic mice expressing enhanced GFP under the control of the Nnat enhancer/promoter regions were generated for FACS of beta cells and downstream analysis of CpG methylation by bisulphite sequencing and RNA-seq, respectively. Animals deleted for the de novo methyltransferase DNA methyltransferase 3 alpha (DNMT3A) from the pancreatic progenitor stage were used to explore control of promoter methylation. Proteomics was performed using affinity purification mass spectrometry and Ca2+ dynamics explored by rapid confocal imaging of Cal-520 AM and Cal-590 AM. Insulin secretion was measured using homogeneous time-resolved fluorescence imaging.
Results
Nnat mRNA was differentially expressed in a discrete beta cell population in a developmental stage- and DNA methylation (DNMT3A)-dependent manner. Thus, pseudo-time analysis of embryonic datasets demonstrated the early establishment of Nnat-positive and -negative subpopulations during embryogenesis. NNAT expression is also restricted to a subset of beta cells across the human islet that is maintained throughout adult life. NNAT+ beta cells also displayed a discrete transcriptome at adult stages, representing a subpopulation specialised for insulin production, and were diminished in db/db mice. ‘Hub’ cells were less abundant in the NNAT+ population, consistent with epigenetic control of this functional specialisation.
Conclusions/interpretation
These findings demonstrate that differential DNA methylation at Nnat represents a novel means through which beta cell heterogeneity is established during development. We therefore hypothesise that changes in methylation at this locus may contribute to a loss of beta cell hierarchy and connectivity, potentially contributing to defective insulin secretion in some forms of diabetes.
Data availability
The mass spectrometry proteomics data have been deposited to the ProteomeXchange Consortium via the PRIDE partner repository with the dataset identifier PXD048465.
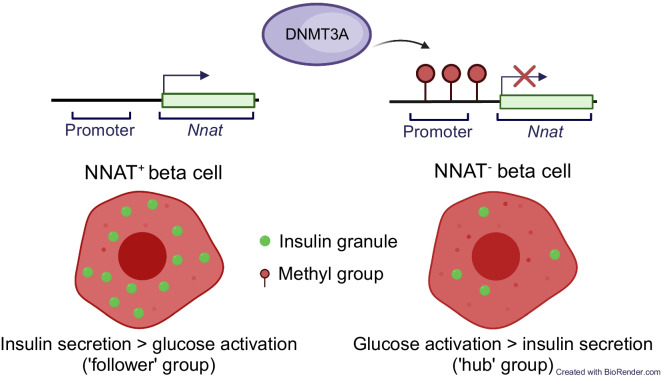
Graphical Abstract
Supplementary Information
The online version contains peer-reviewed but unedited supplementary material available at 10.1007/s00125-024-06123-6.
Keywords: Beta cell development, Ca2+, Connectivity, CpG methylation, Heterogeneity, Identity, Imprinted genes, Insulin, Islet, Neuronatin, Type 2 diabetes
Introduction
Insulin-producing beta cells are central to the modulation of glucose homeostasis, and their impaired function, loss of identity or lowered numbers result in type 2 diabetes [1]. Previous studies have provided an understanding of the transcriptional machinery that orchestrates beta cell development from early pancreatic and endocrine precursors [2]. To bolster these transcriptional programmes in vivo, chronic regulation via the epigenome appears to step in to maintain beta cell identity in the long term [3–7].
Early reports [8, 9], and more recent studies based on single-cell transcriptomic profiling [10–12], electrophysiology [13] and functional imaging [14–17], have demonstrated functional heterogeneity amongst individual beta cells (reviewed in [18]). Identified subpopulations have been associated with known markers or maturation states (Flattop/Cfap126 [16], polysialyated-neural cell adhesion molecule [PSA-NCAM] [19], CD81 [20], CD24 [7, 21], tyrosine hydroxylase [TH] [6], neuropeptide Y (NPY) [22], CD63 [23]), are ‘virgin’ beta cells [24] or are defined by their roles in coordinating islet-wide Ca2+ dynamics (e.g. ‘hubs’ [14], ‘leaders’ [15, 25] and ‘first responders’ [26]). Furthermore, loss of beta cell heterogeneity or intercellular connectivity may contribute to the development of type 2 diabetes [14, 15, 27]. Importantly, functional subpopulations have also been demonstrated in human beta cells [11, 12, 28], and the distribution of antigenically defined sub-groups (based on CD9 and ST8 α-N-acetylneuraminide α-2,8-sialyltransferase [ST8SIA1] positivity) is altered in type 2 diabetes [10]. The features underlying beta cell heterogeneity include pathways governing glucose sensing and metabolism [14–16], insulin content and secretory competence [5, 13, 24, 29, 30], and cilia activity and localisation within the islet [25]. Recently, two discrete populations of ‘CD63hi’ and ‘CD63lo’ cells have been described [23], with ‘CD63hi’ cells enriched for CD63 and for insulin content and glucose-stimulated insulin secretion (GSIS). Epigenomically defined (by histone methylation, H3K27me3) CD24-positive ‘βHI’ beta cells with enhanced insulin content and GSIS [7] may partly overlap the ‘CD63hi’ population [23].
Imprinted genes are expressed from a single allele in a parent-of-origin-specific manner and their expression is also controlled via epigenetic modifications, notably DNA methylation. Imprinted genes often play key physiological roles, particularly in early (fetal and postnatal) growth and development, controlling a wide range of cellular processes. Thus, human imprinting disorders involving altered expression from specific imprinted loci are associated with severe childhood developmental and metabolic complications (reviewed in [31]).
Imprinted genes play key functional roles in pancreatic beta cells by modulating insulin secretory machinery or beta cell mass [32]. Correspondingly, imprinted gene expression is dysregulated both in beta cells with diminished GSIS and in pancreatic islets from individuals with type 2 diabetes, and single nucleotide polymorphisms (SNPs) at imprinted loci are associated with type 2 diabetes risk [18]. Monoallelic expression of imprinted genes is maintained trans-generationally by differential methylation between parental alleles at imprinted loci in the germline [33], with additional ‘somatic’ or ‘secondary’ differentially methylated regions (DMRs) also established post fertilisation [34].
We have previously shown [35] that the paternally expressed, imprinted gene Nnat (encoding neuronatin [NNAT]) is nutrient-regulated in pancreatic beta cells, and controls insulin content and GSIS by modulating early insulin precursor processing at the signal peptidase complex (SPC) [35]. At extra-pancreatic sites, changes in Nnat expression also modulate appetite and metabolism [36–38]. Here, we explore the possibility that differential methylation of the Nnat gene contributes to the functional heterogeneity of embryonic and adult pancreatic beta cells.
Methods
For details, please refer to electronic supplementary material (ESM) Methods.
Bioinformatic clustering analysis
Single-cell RNA-seq (scRNA-seq) embryonic and adult islet datasets [5, 39–42] were assessed for hypervariability of gene expression and unbiased clustering using the scran v1.28.2 (https://bioconductor.org/packages/release/bioc/html/scran.html) and RaceID v0.3.0 (https://cran.r-project.org/web/packages/RaceID/index.html) packages, respectively, as described in the ESM Methods.
Pseudo-time analysis
scRNA-seq datasets [39] were processed with Seurat v4.3 and clustered and processed for pseudo-time analysis, followed by integration with a dataset from adult mouse islets [41, 42], according to the ESM Methods.
Study approval
All animal procedures were in accordance with the UK Animals (Scientific Procedures) Act 1986 and approved by the UK Home Office (Project licence (PPL) number: PP4712156). All animal studies have been approved by the Imperial College Animal Welfare and Ethical Review Body.
Animal models
Transgenic mouse lines expressing Cre recombinase under the control of the rat insulin promoter (RIP) [43] and with a tdTomato reporter downstream of a stop codon flanked by loxP sites [44] have been described previously. Mice with Nnat-driven enhanced GFP (eGFP) expression were purchased from the Mutant Mouse Resource and Research Centre (MMRRC, USA) repository [Tg(Nnat-EGFP)EA106Gsat/Mmucd, stock no. 010611-UCD]. Mice with global deletion of Nnat [35] and conditional Dnmt3a null mice generated by crossing to Pdx1-Cre are described in the ESM Methods. db/db and control C57BLKS/J mice on the BKS background were obtained from The Jackson Laboratory, USA (JAX 000642 and JAX 000662, respectively).
Primary islet isolation and FACS
To isolate primary islets, the pancreas was inflated with Liberase TM (Roche, UK), digested at 37°C and purified using a Histopaque 1119/1083/1077 gradient (Sigma-Aldrich, UK), and islets were hand-picked. For FACS-based experiments, cells from purified islets were isolated using Accutase (Sigma-Aldrich) and sorted using a FACSAria III flow cytometer (BD Biosciences, UK), as detailed in the ESM Methods. Total insulin content was assessed using ultra-sensitive insulin homogeneous time-resolved fluorescence (HTRF) assay kits (Cisbio, France).
Intracellular calcium imaging
Pancreatic islets from reporter mice expressing Nnat-eGFP were isolated as above, with Ca2+ imaging of whole islets performed after loading the cytosol with 2 μmol/l Cal-590 AM (Stratech, UK). Images were captured on an Axiovert microscope (Zeiss, Germany) equipped with a ×10, 0.3–0.5 numerical aperture (NA) objective and a ImagEM camera (Hamamatsu, Japan) coupled to a Nipkow spinning-disk head (CSU-10, Yokogawa, Japan) and illuminated at 490 nm or 530 nm.
For experiments involving global Nnat null mice [35], islets were incubated with 4.5 μmol/l Cal-520 AM (Stratech), and imaging was performed on a Nikon (Japan) Eclipse Ti microscope equipped with a ×40/1.2 NA oil objective and an ibidi heating system. Cal-520 AM was excited with a 491 nm laser line and emitted light filtered at 525/50 nm. Images were acquired with an ORCA-Flash 4.0 camera (Hamamatsu) and Metamorph software (Molecular Devices). Pearson-based connectivity and correlation analyses in an imaged islet were performed with Ca2+ signals smoothed, binarised and analysed as described in the ESM Methods.
Histological techniques and immunofluorescence
Dissected tissues were fixed, cryoprotected and embedded in optimal cutting temperature (OCT) and stored at −80°C. Sections (10 μm) were cut using a CM1950 Cryostat (Leica, Germany) and immunostained using primary and secondary antibodies (listed in the ESM Methods), and imaged using a TCS SP5 confocal microscope (Leica). Immunostaining of paraffin-embedded pancreas from mice with beta cell-selective deletion of Dnmt3a was performed according to references [6, 22] as described in the ESM Methods. Human pancreases were processed, immunostained and imaged as described in the ESM Methods with the approval of the Ethics Committee of the University of Pisa, upon written consent of donors’ next-of-kin.
Cell culture, RNA silencing and GSIS
Human EndoC-βH1 and rat INS1E beta cells were cultured as previously described [35] and incubated with lentiviruses expressing an NNAT-targeting short hairpin RNA (shRNA; Sigma-Aldrich) or Silencer Select siRNAs (Ambion, USA), respectively, as described in the ESM Methods. GSIS assays were performed using ultra-sensitive insulin HTRF assay kits (Cisbio) for insulin quantification.
Immunoprecipitation and mass spectrometry
Cells were processed for immunoprecipitation and incubated with antibodies against NNAT (ab27266, Abcam, UK, 1:500) prior to mass spectrometry analysis [35] as described in the ESM Methods.
Western immunoblotting, RT-PCR, RNA-seq
For western blotting, EndoC-βH1 cells were processed as previously described [35] using primary antibodies against NNAT (ab27266, Abcam, 1:2000) and β-tubulin (clone 9F3, stock no. 2128, Cell Signaling, USA, 1:5000). For RT-PCR, mRNA was purified using Allprep or RNeasy kits (both Qiagen, Germany) and reverse transcribed, and cDNA was assessed by quantitative RT-PCR using Taqman reagents (all Life Technologies, USA) on a QuantStudio 7 Real Time PCR cycler.
For RNA-seq, RNA from FACS-purified cells was quantified and assessed for integrity using a Bioanalyzer 2100 and an RNA 6000 Pico assay (Agilent Technologies). RNA was processed using a NEBNext Ultra II Directional RNA Library Prep Kit for Illumina paired with a Poly(A) mRNA magnetic isolation module and AMPure XP SPRIselect beads (Beckman Coulter, UK). Libraries were sequenced using a NextSeq 500 High Output sequencer (Illumina, USA), with 2×75 bp length at 50 million reads per sample. Further details can be found in the ESM Methods.
Bisulphite sequencing
Genomic DNA was extracted from FACS-purified cells using Allprep DNA/RNA/protein mini kits from Qiagen. Bisulphite sequencing experiments were performed using an EZ DNA Methylation-Gold kit from Zymo Research, USA, an EpiTaq hot start kit (TaKaRa Bio, Japan) and a CloneJET PCR cloning kit (Life Technologies), with DNA purified using a Wizard SV 96 plasmid system (Promega, USA) before Sanger sequencing (Genewiz, now Azenta Life Sciences, UK), and then analysed using bisulphite sequencing DNA methylation analysis (BISMA) software.
Statistical analysis
Data are shown as mean±SEM in all figure panels. Data were assessed using GraphPad Prism 9.0, with <5% error probability considered significant (i.e. p<0.05). Further statistical information, such as n numbers and p values, are provided in the figure legends.
Results
NNAT expression is heterogeneous across the islet and represents a highly differentiated beta cell subtype
We have previously shown that Nnat is crucial for insulin storage and GSIS in the mouse [35]. NNAT expression is diminished in rodent models of obesity and diabetes including the Zucker diabetic fatty (ZDF) rat model (85% decrease, p=0.0023, n=5 [45]) and obese ob/ob mice (ESM Fig. 1a). Pancreatic sections of db/db mice displayed a loss of NNAT immunoreactivity across islets, and a significant reduction of NNAT+ beta cells (ESM Fig. 1b,c).
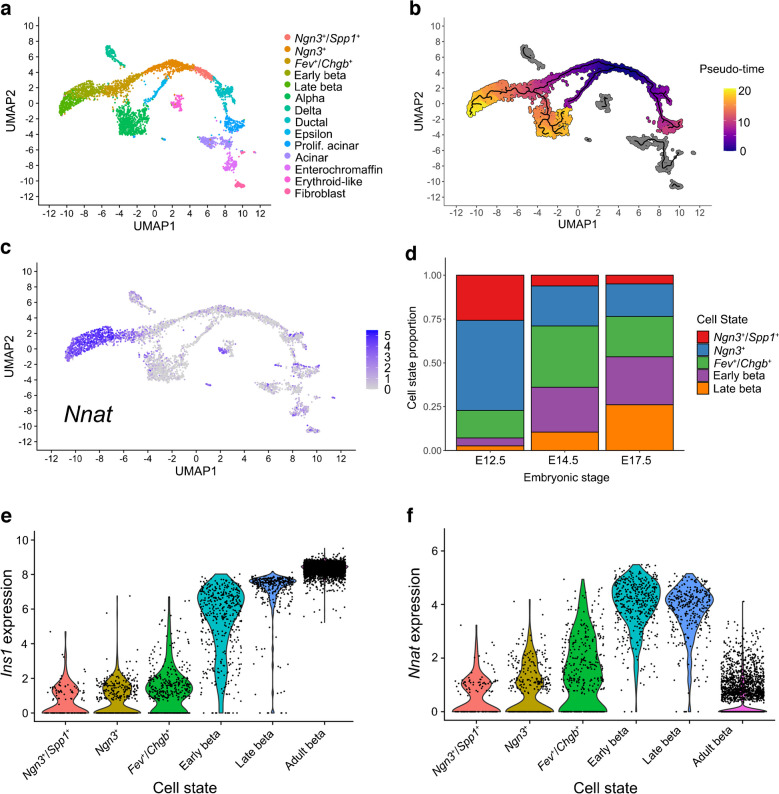
Reanalysis of published scRNA-seq datasets from primary mouse beta cells at embryonic (embryonic day 17.5 [E17.5]) [39, 40] and adult [5, 41, 42] stages identified Nnat as amongst the most highly variable genes between individual cells (ESM Table 1). Pseudo-time analysis of embryonic (E12.5 to E17.5) mouse beta cells [39] clearly demarcated the differentiation of beta cells through embryonic cell states, with late embryonic (E17.5) beta cells overlapping with high levels of Nnat expression (Fig. 1a–c, ESM Figs 2a–f, 3a–k). Analysis of the proportions of different beta cell progenitors revealed that Nnat+ cells become more prominent at later stages of development (Fig. 1d). Integrating cells from the embryonic beta cell trajectory with adult beta cells [41, 42] allowed us to evaluate the progressive change in beta cell markers and Nnat expression from development to maturity (Fig. 1e,f, ESM Fig. 4a–i), and revealed large increases in Ins1 expression alongside Nnat downregulation in most beta cells. Nevertheless, a considerable number of adult beta cells (with high expression of Ins1/Ins2) also expressed Nnat (Fig. 1f). Thus, Nnat appears to mark late-stage beta cell differentiation, peaking in expression around E17.5 and then gradually being downregulated across most beta cells in adulthood.
Fig. 1.
Nnat expression is a marker for late-stage beta cell differentiation during islet development. (a–c) UMAP projection of scRNA-seq data from embryonic mouse islets (E12.5–E17.5), with cells labelled by their cellular state (a), pseudo-time (scale bar represents abstract unit of time) (b) and corresponding Nnat expression (log-normalised expression level) (c). (d) Changes in the distribution of beta cell precursors from E12.5 to E17.5. (e, f) Violin plots showing the fluctuations in Ins1 (e) and Nnat (f) expression (both log-normalised expression level) from E12.5 to adulthood in the beta cell development trajectory. Prolif., proliferating; UMAP, uniform manifold approximation and projection
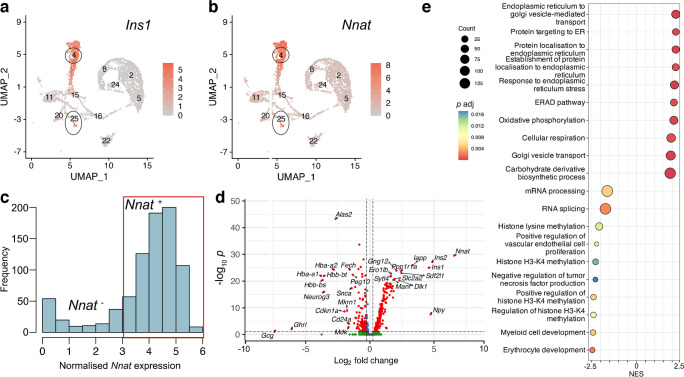
In light of the abundance of Nnat+ beta cells during late embryogenesis, we further evaluated the E17.5 dataset [39] and again identified two beta cell populations with distinct levels of Nnat expression (Fig. 2a–c, ESM Fig. 5a–f). Embryonic Nnat+ beta cells were enriched for Ins1, Ins2, Nkx6.1, Pdx1, Ucn3, Slc2a2, Iapp, Ero1b, G6pc2, Dlk1 and Npy expression compared with Nnat− beta cells which had higher Neurog3, Pax4, Gcg, Arx and Ghrl expression, indicating that the Nnat+ beta cells were more fully differentiated (Fig. 2d, ESM Table 2). Nnat+ beta cells were also de-enriched for Cd24a (Fig. 2d, ESM Table 2). Gene set enrichment analysis (GSEA) revealed upregulation of processes related to protein synthesis, transport from endoplasmic reticulum (ER), ER stress, as well as oxidative phosphorylation and carbohydrate metabolism, with downregulated processes including mRNA processing, splicing and histone methylation (Fig. 2e). Indeed, a separate cell clustering analysis [46] identified Nnat as a highly differentially expressed gene between two beta cell clusters at both the late embryonic [39, 40] and adult [5] stages (ESM Figs 6a–h, 7a–g, ESM Table 3).
Fig. 2.
Transcriptomic analyses of islet cells at E17.5 reveal Nnat+ cells to be a more differentiated beta cell subcluster. (a, b) Islet cells plotted in the UMAP space and coloured by Ins1 (a) and Nnat (b) expression, respectively. Individual cellular clusters are labelled. Beta cell clusters are highlighted with black circles. (c) Distribution of Nnat expression among beta cell clusters, along with the expression range used in defining Nnat+ beta cells (highlighted by the red rectangle). (d) Volcano plot showing the log2 fold change in gene expression between Nnat+ and Nnat− beta cells against FDR-corrected p values. Genes with FDR<0.1 are coloured red. Top ten upregulated and downregulated genes are labelled by gene name. (e) GSEA of differentially expressed genes between Nnat+ and Nnat− beta cells (using gene ontology-biological process [GO-BP] terms), showing the top ten upregulated and downregulated processes. The normalised enrichment score (NES) is plotted along the x-axis. Circle diameters are proportional to the number of genes in each process, with the colours defining statistical significance. UMAP, uniform manifold approximation and projection
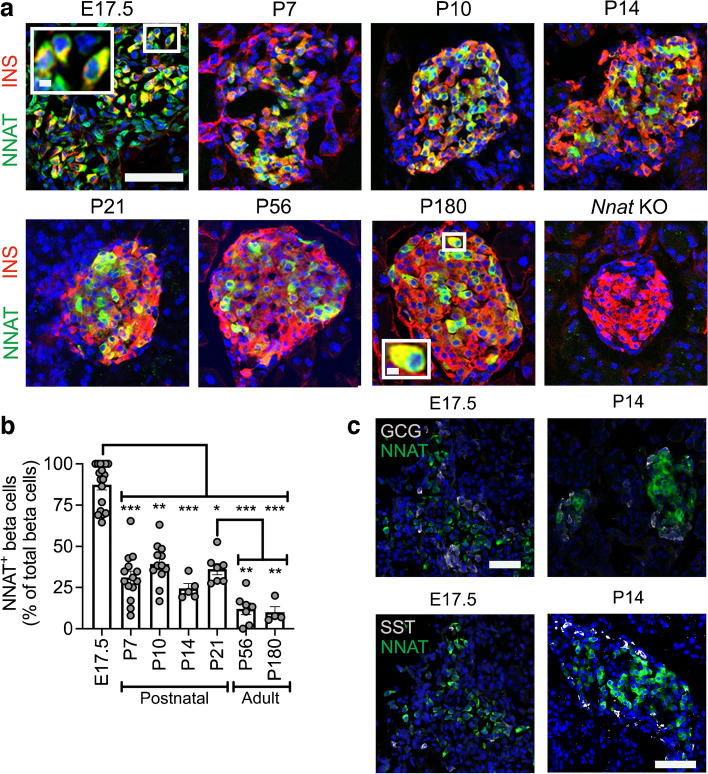
We confirmed some of these findings at the protein level using immunofluorescence in postnatal and adult mice (Fig. 3a,b). We noted that NNAT protein expression is highly dynamic in beta cells across the mouse islet throughout the postnatal stage, transitioning from expression throughout the majority (90.4±3.2%, n=15 mice) of beta cells at late embryogenesis to a subset (24.4±3.0%, n=5 mice) of beta cells by postnatal day 14 (P14) (Fig. 3a,b). NNAT+ beta cells persisted throughout the islet into adulthood (Fig. 3a,b). NNAT expression was not apparent in other mouse islet cell types, including alpha and delta cells, at P14. However, NNAT expression was detectable in a small number of alpha and delta cells at E17.5 (Fig. 3c).
Fig. 3.
A subpopulation of NNAT+ beta cells develops during the early postnatal period in mice. (a) Representative confocal microscopy of pancreatic cryosections from wild-type mice on a C57BL/6J background of developmental stages from E17.5 through the postnatal period into adulthood. Sections were immunostained with antibodies against endogenous NNAT (green) and insulin (INS, red). Nuclei are visualised with DAPI and sections from P56 mice with constituent deletion of Nnat were used as an immunostaining control. Scale bar, 100 μm (inset, 10 μm). (b) Quantification of NNAT+ beta cells from images shown in (a), expressed as NNAT/INS co-positive cells as a percentage of total INS-positive cells (n=4–15 mice per timepoint, Kruskal–Wallis test with Dunn’s multiple comparisons). (c) Representative confocal microscopy of pancreatic cryosections as in (a) from E17.5 and P14 mice (n=18 and n=5 mice, respectively) immunostained with antibodies against endogenous NNAT (green) and GCG or SST (both grey). Scale bar, 100 μm. Representative images from three independent experiments and breeding pairs. *p<0.05, **p<0.01, ***p<0.001. GCG, glucagon; KO, knockout; SST, somatostatin
NNAT immunoreactivity is detected in a subset of beta cells in human islets and NNAT deficiency in human beta cells blunts GSIS
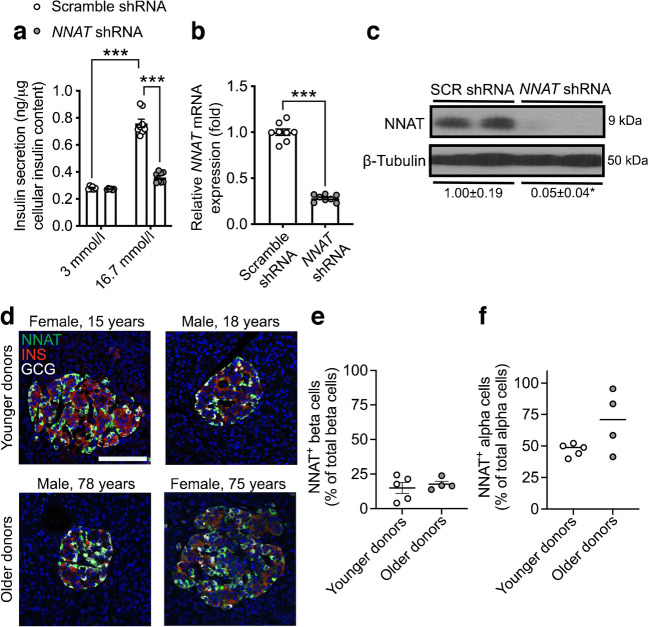
While the role of NNAT has previously been examined in mouse beta cells [35], no data currently exist for human beta cells. We therefore next compared the functionality of human NNAT+ and NNAT− beta cells. Transient silencing of NNAT in human EndoC-βH1 beta cells completely abrogated glucose-stimulated insulin release (Fig. 4a–c). As in mouse beta cells [35], NNAT interacted in cellulo with subunits of the SPC, SEC11A, SPCS1, SPCS2 and SPCS3 (ESM Fig. 8a), likely via SPCS1 (ESM Fig. 8b).
Fig. 4.
NNAT is expressed in a subset of human beta cells and NNAT deficiency in human beta cells reduces insulin secretion. (a) GSIS analysis at low (3 mmol/l) and high (16.7 mmol/l) glucose in human EndoC-βH1 beta cells following 72 h of lentiviral-mediated shRNA knockdown of NNAT with data expressed as insulin secreted into culture media as a percentage of total cellular insulin content (n=8 independent cultures per group, two-way ANOVA with Sidak’s multiple corrections test). (b, c) RT-PCR (n=8, unpaired Student’s t test) and western blot (n=4, Mann–Whitney U test) analysis of NNAT expression in EndoC-βH1 beta cells after transient NNAT silencing as in (a). (c) Western blotting analysis of NNAT protein levels shown via a representative blot of two independent experiments. β-Tubulin was used as a loading control. Mean values for band intensities in multiple experiments quantified by densitometry are shown below the panel, expressed relative to scramble (SCR) shRNA controls. (d) Representative confocal microscopy of human pancreatic cryosections from younger (15.6±0.9 years, n=5) and older (71.0±3.9 years, n=4) donors. Sections were immunostained with antibodies against endogenous NNAT (green), insulin (INS, red) and glucagon (GCG, grey). Donor sex and age are indicated in the text. Nuclei are visualised with DAPI. Scale bar, 100 μm. (e, f) Quantification of NNAT+ beta (e) and alpha (f) cells from images shown in (d), expressed as NNAT/INS or NNAT/GCG co-positive cells as a percentage of total INS-positive or GCG-positive cells. *p<0.05, ***p<0.001
Heterogeneous expression of NNAT in human islet cells was also observed in whole pancreatic sections from multiple donors. Thus, NNAT was expressed in a subset of beta cells in both younger (15.6±0.9 years, 15.0±4.0%, n=5) and older (71.0±3.9 years, 17.7±2.1%, n= 4) donors (Fig. 4d,e, ESM Fig. 9a, ESM Table 4, ESM Human Islet Checklist). Interestingly, NNAT was also expressed in a large fraction of human alpha cells (but not in delta cells, Fig. 4d,f, ESM Fig. 9b) in both younger (47.0±2.2%) and older donors (69.6±12.2%).
Heterogeneous NNAT expression in beta cells during postnatal development is associated with altered CpG methylation
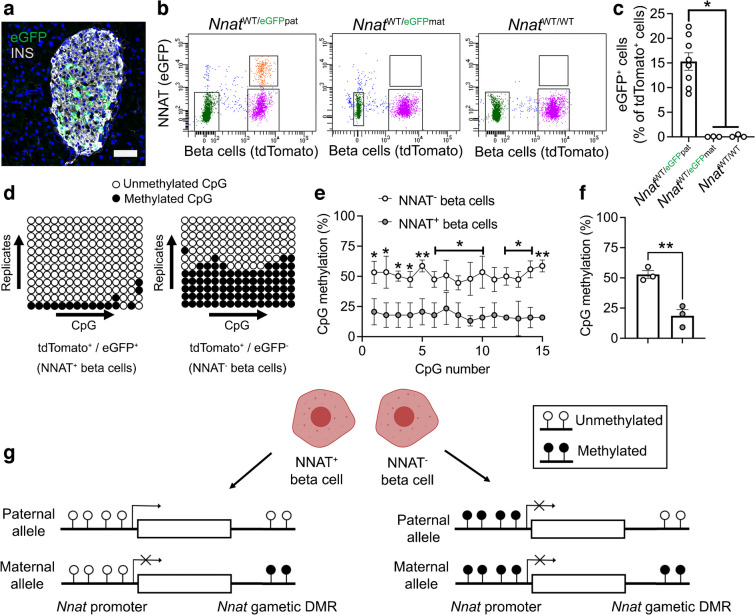
To extend the findings above using an orthogonal approach, and to facilitate subsequent functional studies, we utilised a Bacterial Artificial Chromosome (BAC) reporter mouse line expressing eGFP under the control of the Nnat promoter and upstream enhancers (ESM Results, ESM Fig. 10a–e). Aligning with studies of the endogenous gene (Figs 1, 2, 3 and 4), adult reporter mice expressed eGFP in a subpopulation (~15% of total) of beta cells (Fig. 5a).
Fig. 5.
Beta cell heterogeneity of NNAT expression is associated with changes in CpG methylation at the Nnat promoter. (a) Representative confocal microscopy of pancreatic cryosections from P56 mice with Nnat-driven eGFP expression from the paternal allele (NnatWT/eGFPpat) (n=7 mice). Sections were immunostained with antibodies against eGFP (green) and insulin (INS, grey). Nuclei are visualised with DAPI. Scale bar, 50 μm. (b) FACS separation of dispersed primary islet cells from reporter mice with insulin-driven expression of tdTomato (to label beta cells) and Nnat-driven eGFP expression from the paternal (NnatWT/eGFPpat) or maternal (NnatWT/eGFPmat) allele or wild-type (NnatWT/WT) at this locus (representative FACS plot of the dispersed islet preparation from a single mouse shown) (n=8, 3 and 3 mice per genotype, respectively, Kruskal–Wallis test with Dunn’s multiple comparisons). (c) Quantification of data in (b) expressed as percentage of eGFP/tdTomato co-positive primary islet cells. (d) Representative bisulphite analysis of CpG methylation at the Nnat promoter in FACS-purified islet cell populations from (b) (n=3 NnatWT/eGFPpat mice with paternally expressed Nnat-driven eGFP, n≥12 clones each). Closed circles, methylated CpG; open circles, unmethylated CpG. (e, f) Quantification of data in (d) expressed as percentage CpG methylation across the Nnat promoter at individual CpGs (e) and across the entire Nnat promoter (f) (both paired Student’s t test). (g) Schematic summarising level of CpG methylation at the Nnat promoter and gametic DMR in NNAT+ vs NNAT− beta cells (created with BioRender.com). Representative image in (a) and bisulphite analyses in (d) used experimental mice from three independent experiments and breeding pairs. *p<0.05, **p<0.01
To isolate and purify beta cells based on NNAT levels, we crossed Nnat-eGFP reporter mice to animals expressing Cre recombinase under the RIP [43] and to transgenic mice expressing a tdTomato reporter downstream of a loxP-flanked stop codon [44]. Dispersion of primary adult islets into single cells, and subsequent FACS analysis, verified the presence of NNAT+ and NNAT− beta cells, with the NNAT+ fraction composing 15.3±1.8% (n=8 mice) of the total beta cell compartment (Fig. 5b,c, ESM Figs 11a,b, 12a–f). Collection of FACS-purified NNAT+ and NNAT− beta cells and subsequent bisulphite sequencing analysis revealed that CpG methylation at the gametic DMR (known to control monoallelic Nnat expression; Introduction) was unchanged (ESM Fig. 11c–e). Nevertheless, CpG methylation at the Nnat promoter was significantly altered across this genomic region, with minimal CpG methylation observed in NNAT+ beta cells (Fig. 5d–f).
Recent whole-genome methylation analysis in mouse germ cells has revealed that the Nnat promoter region is unmethylated in sperm, and this was confirmed by targeted bisulphite sequencing analysis (ESM Fig. 11f–h), whereas it is fully methylated in oocytes [47]. Thus, the ‘classical’ imprinting of Nnat is unaltered between beta cell subtypes with near binary (‘on/off’) expression of NNAT. However, and overlaying this control, a second DMR at the Nnat promoter within the non-imprinted allele dictates beta cell subtype specificity of expression (Fig. 5g).
The de novo DNA methyltransferase DNMT3A establishes NNAT beta cell subtype specificity
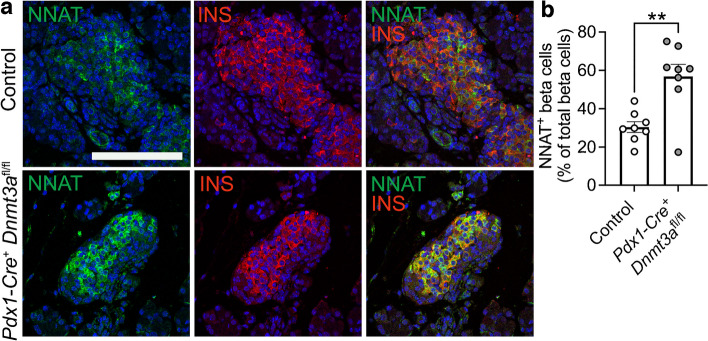
To ask whether this apparent transition in Nnat expression in the early postnatal period is driven by de novo CpG methylation, we assessed endogenous NNAT beta cell immunoreactivity in postnatal mice conditionally deleted for the methyltransferase DNA methyltransferase 3 alpha (DNMT3A) at the pancreatic progenitor stage (using Pdx1-Cre) [6]. NNAT staining in control mice at P6 demonstrated expression in a subpopulation of beta cells, whereas deletion of DNMT3A resulted in a loss of this heterogenous expression across the islet (Fig. 6a,b, ESM Fig. 13a). These findings demonstrate that de novo methylation is likely to drive NNAT restriction across the beta cell complement in the first few days of postnatal life.
Fig. 6.
Postnatal restriction of NNAT in a subset of beta cells is at least partially driven by the de novo methyltransferase DNMT3A. (a) Representative confocal microscopy of pancreatic cryosections from mice with conditional deletion of DNMT3A under the control of the Pdx1 promoter (Pdx1-Cre+ Dnmt3afl/fl) vs control (Pdx1-Cre− Dnmt3afl/fl) mice at P6. Sections were immunostained with antibodies against endogenous NNAT (green) and insulin (INS, red). (b) Quantification of NNAT+ beta cells from images shown in (a), expressed as NNAT/INS co-positive cells as a percentage of total INS-positive cells. Scale bar, 50 μm (n=8 mice per genotype, unpaired Student’s t test, **p<0.01). Nuclei are visualised with DAPI
NNAT+ and NNAT− beta cells have distinct transcriptional signatures
In contrast to the embryonic populations described above, RNA-seq revealed that FACS-sorted adult (8 weeks) NNAT+ and NNAT− beta cells displayed high transcriptional overlap and were similar to each other when compared with non-beta endocrine cells (Fig. 7a). Major beta cell identity markers such as Ins1, Ins2, Mafa, Slc2a2 (Glut2) and Nkx6.1 were not differentially expressed (ESM Table 5).
Fig. 7.
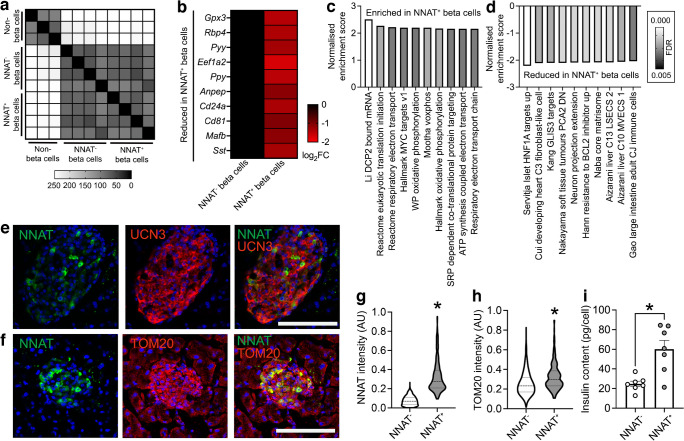
NNAT+ adult beta cells are transcriptionally distinct and have significantly higher insulin content. (a) Correlation matrix of differentially expressed genes between NNAT+ and NNAT− beta cells as assessed by RNA-seq analysis (n=4 FACS-purified populations from individual mouse islet preparations). Scale bar (0–255) gives an integer provided to the R function where the darker colour corresponds to higher sample correlation. (b) Heatmap of the top ten most differentially expressed genes reduced in NNAT+ beta cells compared with NNAT− beta cells. (c, d) GSEA showing categories significantly enriched (c) and reduced (d) in NNAT+ (vs NNAT−) beta cells. (e, f) Representative confocal microscopy of pancreatic cryosections from P56 (8-week-old) wild-type mice on a C57BL/6J background immunostained with antibodies against endogenous NNAT (green) and UCN3 (red, e) or TOM20 (red, f). Scale bar, 100 μm. Nuclei are visualised with DAPI. Representative images from three independent experiments and breeding pairs (g, h). Quantification of NNAT (g) and TOM20 (h) staining in NNAT− and NNAT+ beta cells (INS+) from images shown in (f), expressed as mean intensity of the NNAT or TOM20 channel (*p<0.05, paired Student’s t test, 1329 NNAT− and 295 NNAT+ beta cells from 15 islets, n=3 mice). (i) Insulin content assessed in NNAT+ and NNAT− beta cells (*p<0.05, n=7 FACS-purified populations from individual mouse islet preparations, Wilcoxon matched-pairs signed rank test). AU, arbitrary units; FC, fold change
Nevertheless, we identified 241 (1.8%) and 79 (0.6%) genes that were significantly down- and upregulated in NNAT+ vs NNAT− beta cells, respectively (>2-fold, false discovery rate [FDR]<0.01). Differentially expressed genes included several markers of non-beta cell islet lineages (Pyy, Ppy, Mafb, Sst) that were lower in the NNAT+ beta cell fraction, genes linked with beta cell heterogeneity and plasticity (Gpx3, Rbp4), the beta cell immaturity marker Cd81 [20] and the Cd24a antigen [21] (Fig. 7b). Interestingly, Npy was enriched in NNAT+ beta cells (ESM Table 5), consistent with our observations at late embryogenesis (E17.5, Fig. 2d). We did not observe any clear differences between NNAT+ and NNAT− beta cells in the expression of other imprinted genes known to be functional in the beta cell (Plagl1/ZAC, Dlk1, Rasgrf1, Cdkn1c, Grb10 and Gtl2/MEG3), nor changes in ‘disallowed’ genes whose expression is known to be restricted in mature functional beta cells (Hk1, Mct1 [Slc16a1] and Ldha) [48] (ESM Table 5). Likewise, no differences were apparent in the levels of transcripts encoding proteins previously demonstrated by others to mark specific beta cell subpopulations, such as Flattop/Cfap126 [16], CD9 and ST8SIA1 [10], Cd63 [23], ‘virgin’ beta cells (via Ucn3) [24] or those differentially expressed in beta cells implicated in the control of Ca2+ dynamics (‘hubs’ [14], and ‘leaders’ [15, 26]).
GSEA did, however, reveal enrichment of pathways in NNAT+ beta cells including translation initiation, the electron transport chain (ETC), oxidative phosphorylation and signal recognition particle (SRP)-dependent co-translational protein targeting (Fig. 7c). Pathways involving genes associated with hepatocyte nuclear factor 1 alpha (HNF1A) and GLI-similar family zinc finger 3 (GLIS3) targets were reduced in the NNAT+ beta cell fraction (Fig. 7d). NNAT+ beta cells displayed higher levels of the late maturation marker urocortin 3 (UCN3) (Fig. 7e, 0.357±0.009 in NNAT+ vs 0.264±0.004 arbitrary units in NNAT−, **p<0.01, 290 NNAT+/1876 NNAT− beta cells from 13 islets/n=3 mice) and a small but significant increase in translocase of outer mitochondrial membrane 20 (TOM20) immunostaining, consistent with a higher mitochondrial volume or number (Fig. 7f–h). Furthermore, FACS-sorted primary NNAT+ beta cells had a significantly higher insulin content than NNAT− cells (Fig. 7i).
The NNAT+ beta cell population shows impaired glucose-stimulated Ca2+ dynamics and is de-enriched for highly connected ‘hub’ cells
To determine whether NNAT may influence beta cell connectivity and membership of the ‘hub’ cell subgroup [14], we studied glucose-induced Ca2+ dynamics in Nnat-deficient (Nnat+/−p) islets [35]. Ca2+ increases in response to high (11 mmol/l) glucose were significantly higher in Nnat+/−p than control islets, and while the mean Pearson’s coefficient of correlation and proportion of highly connected ‘hub’ cells were not significantly different between Nnat-deficient and control islets (ESM Results, ESM Fig. 14a–d), wild-type ‘hub’ cells were significantly more connected than Nnat-deficient ‘hub’ cells (ESM Fig. 14e,f). Thus, NNAT is a marker of less well-connected cells.
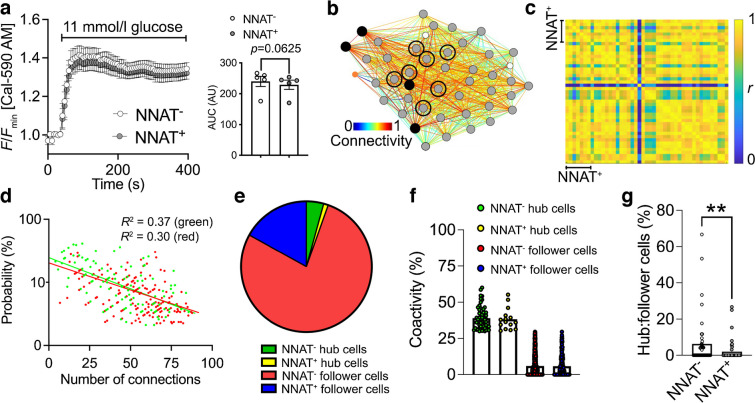
We further explored this question using islets from Nnat-eGFP reporter mice, using the red-shifted calcium probe Cal-590 AM [49]. Nnat-GFP+ and Nnat-GFP− cells responded similarly to challenge with high (11 mmol/l) glucose (Fig. 8a). Beta cell–beta cell connectivity (Fig. 8b) was not different between NNAT+ and NNAT− populations and, considered across the whole population, the mean Pearson’s coefficient of correlation was 0.87±0.01 (Fig. 8c).
Fig. 8.
NNAT+ beta cells show altered glucose-induced Ca2+ dynamics and are de-enriched for highly connected ‘hub’ cells within individual islets. (a) Ca2+-bound Cal-590 AM fluorescence in response to high glucose (11 mmol/l) in NNAT− and NNAT+ cells from primary islets from NnatWT/eGFPpat reporter mice expressed as normalised intensity over time (F/Fmin) (n=61 islets total from five mice per genotype; quantification of AUC on the right, p=0.063, Wilcoxon matched-pairs signed rank test). (b) Representative Cartesian map of beta cells with colour-coded lines connecting cells according to the strength of coactivation (colour-coded R values from 0 to 1, blue to red). Beta cells are represented by differently coloured nodes depending on their coactivity with the other beta cells, where black nodes indicate coactivity with ≥80% of the remaining beta cells, while grey, white and orange nodes represent coactivity with ≥60%, ≥40% and <40%, respectively. Nodes circled with a solid black line indicate NNAT+ cells. (c) Representative heatmaps depicting connectivity strength (r) of all cell pairs (colour-coded r values from 0 to 1, blue to yellow). (d) Log–log graphs of beta cell–beta cell connectivity distribution. NNAT+ cells are represented by green circles while NNAT− cells are represented by red circles (45 islets total using primary islet preparations, each from an individual NnatWT/eGFPpat reporter mouse). (e) Categorisation of beta cells based on data from (d). (f) Percentage coactivity of beta cells between all cells in identified ‘hub’ and ‘follower’ cells. (g) The proportion of cells designated as ‘hub’ vs ‘follower’ cells in both the NNAT− and NNAT+ populations assessed in each of 45 islets (**p<0.01, Wilcoxon matched-pairs signed rank test). Analyses in panels (a–g) obtained from three independent experiments and three different breeding pairs of experimental mice. AU, arbitrary units
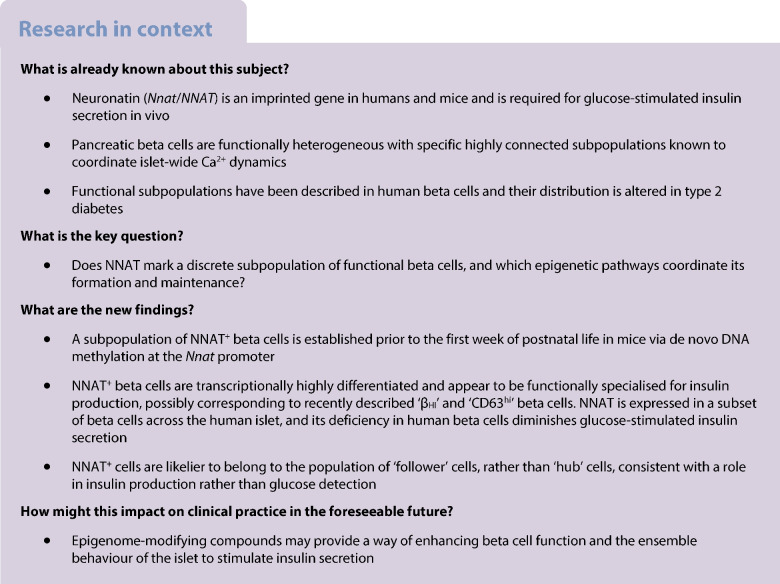
Of all cells examined, 4.27% were NNAT− ‘hub’ cells (Ca2+ responses with at least 30% of all cells, Fig. 8d) connected to an mean of 39.0% of all beta cells (Fig. 8e,f). The fraction of these (1.15%, Fig. 8e) identified as NNAT+ ‘hub’ cells had an mean of 38.3% coactivity with other cells (Fig. 8f). However, when considered within each individual islet, a significantly lower ratio of ‘hubs’ to ‘followers’ was observed in NNAT+ vs NNAT− cells (Fig. 8g). Overlap with ‘leader’ cells [15, 25] was not explored in the absence of readily identifiable Ca2+ waves.
Discussion
We describe here a novel subgroup of beta cells characterised by transient methylation of a second DMR (but not the gametic DMR) in the Nnat locus. This is consistent with previous findings that methylation at gametic DMRs is thought to be relatively stable [50], whereas ‘secondary’ imprinting regions have been shown to be more sensitive to nutrient- or physiology-based changes [6, 51]. We have previously described the importance of Nnat for beta cell insulin content and secretion [35] and therefore hypothesise that NNAT+ and NNAT− cells display differences in secretory function. Correspondingly, transcriptomic analysis of purified adult NNAT+ and NNAT− beta cells demonstrated that the NNAT+ fraction is enriched for functional pathways including translation initiation, ETC/oxidative phosphorylation pathways and co-translational protein ER membrane targeting.
Extending these studies to humans, NNAT deficiency in human EndoC-βH1 beta cells severely blunted GSIS, likely via inhibition of signal peptidase-mediated processing [35]. We show here that E17.5 Nnat+ beta cells are enriched for expression of the SPC and translocon apparatus (Spcs1, Spcs2, Sec11a, Sec11c, Sec61) and that the SPC/NNAT interaction is via SPCS1, and likely the means through which NNAT influences cellular insulin content. Importantly, we demonstrate that heterogeneous expression of NNAT is also a feature of the adult human pancreatic islet. Finally, NNAT+ cells were de-enriched for highly connected ‘hubs’ and, thus, are likelier to belong to the ‘follower’ population [14]. Interestingly, Ca2+ responses to 11 mmol/l glucose were significantly higher in Nnat-deficient vs wild-type mouse islets, in contrast to previous findings where differences were not observed in response to 16.7 mmol/l glucose [35]. A similar strong tendency was also seen when comparing NNAT+ vs NNAT− cells in the same islet in Nnat-eGFP reporter mice, and suggests that NNAT+ cells are less responsive to metabolic stimulation by glucose, in line with their enrichment in a ‘follower’ subset of cells, and consistent with a role in insulin production rather than glucose detection [14, 15]. The molecular underpinnings of the weaker Ca2+ responses are unclear, but do not appear to involve differences in the levels of transcripts encoding Slc2a2 (Glut2) or Gck. Moreover, the transcriptome of NNAT+ cells does not show enrichment for genes enriched in ‘hub’ [15] or ‘leader’ cells [25].
Interestingly, bimodal expression of Nnat was already clearly evident at embryonic stages, with Nnat+ beta cells enriched for markers of late-stage beta cell differentiation, as well as Ins1 and Ins2 mRNAs. These differences were, however, less marked in the adult islet, though CD24a [7] was more weakly expressed in the NNAT+ population. De-enrichment of markers of other islet cell types (and the immaturity marker Cd81) was also a common feature of both embryonic and adult NNAT+ beta cells. Interestingly, both embryonic and adult NNAT+ beta cells were enriched for Npy, suggesting that these cells were not fully matured. NNAT+ beta cells, however, had significantly higher insulin content, suggesting a possible, at least partial, overlap with the recently described ‘CD63hi’ population [23], and the ‘βHI’ population described in reference [7].
Our work also provides evidence that the epigenome controls the fate of specific beta cell subpopulations. CpG methylation plays a crucial role in early beta cell developmental maturation, including the silencing of ‘disallowed’ genes such as Hk1, Mct1 (Slc16a1) and Ldha via DNMT3A [4, 48]. Here we show that islets transition from a state wherein the majority of beta cells are NNAT+ in late embryogenesis to comprising a restricted subpopulation of NNAT+ beta cells by P7. Whether this represents changes at the level of individual beta cells, or the turnover of the NNAT+ population and replacement with a largely NNAT− population, was not determined, and would require investigation using other approaches, including fate mapping (lineage tracing).
Adult NNAT+ beta cells are virtually unmethylated at the Nnat promoter whereas robust promoter methylation was apparent in NNAT− cells. These findings, and the fact that the Nnat promoter is differentially methylated between sperm and oocytes (see the Results), indicate that promoter methylation during this transition is likely to be acquired on the paternal allele (from which Nnat is selectively expressed via genomic imprinting). Our studies also show that specific deletion of the de novo methyltransferase DNMT3A at the pancreatic progenitor stage resulted in partial loss of NNAT-based beta cell heterogeneity. Thus, DNA methylation modulates restricted NNAT expression in specific beta cells during early maturation.
Might these findings be relevant for the pathogenesis of type 2 diabetes? Whether demethylation of the second DMR at the Nnat locus may occur in this disease is an interesting possibility which remains to be explored. In rodents, even mild hyperglycaemia deregulates Nnat expression alongside that of several other critical beta cell identity genes [52], and we describe here a significant reduction of NNAT+ beta cells in db/db mice. Moreover, altered CpG methylation is a common observation in islets from individuals with diabetes at imprinted and non-imprinted loci (reviewed in [18, 32]).
In conclusion, the present work demonstrates how an effector gene in pancreatic beta cells, NNAT/Nnat, is controlled at the level of the epigenome (DNA methylome), contributing to a functional hierarchy between cells. Chemical modification of the epigenome may in future provide an attractive therapeutic angle not only for beta cell replacement or regeneration [53] but also to modulate beta cell function and cell–cell connectivity in type 2 diabetes.
Supplementary Information
Below is the link to the electronic supplementary material.
Abbreviations
- DMR
Differentially methylated region
- DNMT3A
DNA methyltransferase 3 alpha
- E
Embryonic day
- eGFP
Enhanced GFP
- ER
Endoplasmic reticulum
- ETC
Electron transport chain
- FDR
False discovery rate
- GSEA
Gene set enrichment analysis
- GSIS
Glucose-stimulated insulin secretion
- HTRF
Homogeneous time-resolved fluorescence
- NA
Numerical aperture
- NNAT
Neuronatin
- P
Postnatal day
- RIP
Rat insulin promoter
- scRNA-seq
Single-cell RNA-seq
- shRNA
Short hairpin RNA
- SPC
Signal peptidase complex
- TOM20
Translocase of outer mitochondrial membrane 20
- UCN3
Urocortin 3
Acknowledgements
We thank the LMS/NIHR Imperial Biomedical Research Centre Flow Cytometry Facility and the MRC LMS Genomics Facility for the support. Some of the data were presented as an abstract at the Society for Endocrinology BES meeting and the 59th EASD Annual Meeting, both in 2023. The graphical abstract and Fig. 5g were created with BioRender.com.
Data availability
RNA-seq data are available from the GEO under accession number GSE249659. The mass spectrometry proteomics data have been deposited to the ProteomeXchange Consortium via the PRIDE partner repository with the dataset identifier PXD048465. ImageJ scripts and CellProfiler pipelines can be made available upon reasonable request. Pseudo-time analysis scripts are available via GitHub using the link https://github.com/aosakwe/Pseudotime_Analysis_MouseIslets. Transcriptomic data for ob/ob mice can be obtained from a publicly available source from the Alan Attie laboratory (http://diabetes.wisc.edu/search).
Funding
AMa received a Summer Studentship in the SJM laboratory from the Society for Endocrinology. AO is supported by training scholarships from the Canadian Institutes of Health Research (CIHR) and the Fonds de recherche du Québec – Santé (FRQS). SSV is a CIRM postdoctoral scholar supported by the California Institute for Regenerative Medicine (EDU4-12772). YA is supported by the Singapore Ministry of Education Academic Research Fund Tier 2 (MOE-T2EP30221-0003). PM and MS have been supported by the European Union, Next Generation EU, through the Italian Ministry of University and Research under PNRR - M4C2-1.3, Project PE_00000019 HEAL ITALIA. SD is supported by the National Institutes of Health (NIH) (R01DK120523), by the Wanek Family Foundation to Cure Type 1 Diabetes and by start-up funds from the City of Hope. This work was also supported by a Wellcome Trust Project Grant (093082/Z/10/Z) to DJW and by funding from the Medical Research Council (MRC) to DJW (MC-A654-5QB40). GAR was supported by a Wellcome Trust Investigator award (212625/Z/18/Z), a UKRI-MRC Programme grant (MR/R022259/1), an NIH-NIDDK project grant (R01DK135268), a CIHR-JDRF Team grant (CIHR-IRSC TDP-186358 and JDRF 4-SRA-2023-1182-S-N), CRCHUM start-up funds and an Innovation Canada John R. Evans Leader Award (CFI 42649). GAR and PM received funding from the European Union’s Horizon 2020 research and innovation programme via the Innovative Medicines Initiative 2 Joint Undertaking under grant agreement no. 115881 (RHAPSODY). Work in the SJM laboratory was supported by a Wellcome Trust ISSF Fellowship (204834/Z/16/Z, award no. RSRO_67869) and by a Society for Endocrinology Early Career Grant (WREC_P93206) and Small Equipment Grant (WREC_NCP239).
Authors’ relationships and activities
PM is a member of the Editorial Board of Diabetologia. GAR has received grant funding from and is a consultant for Sun Pharmaceuticals Inc. The authors declare that there are no other relationships or activities that might bias, or be perceived to bias, their work.
Contribution statement
SJM and GAR designed the research. VY, FY, AMa, SK, AO, SB, SSV, PC, SMT, KC, EG, NP, MS, ZS, LM, CDL, MT, GO, LD-S, XW, YH, AMo, JE, BP, ND, CW, PH, PS, HK, YA, PM, RS, SD, DJW and SJM performed and interpretated experiments and analyses. PH, PM, RS, SD and DJW contributed new reagents/analytical tools. SJM and GAR drafted and/or wrote the manuscript. SJM, SD, DJW and GAR provided funding. SJM and GAR supervised the work. SJM serves as the guarantor of this work. All authors critically reviewed and approved the manuscript according to the ICMJE criteria.
Footnotes
Guy A. Rutter and Steven J. Millership are joint senior authors.
Dr H. Kramer, who performed and interpreted experiments and analyses for this research, died on 23 August 2022 before publication of this work.
Publisher's Note
Springer Nature remains neutral with regard to jurisdictional claims in published maps and institutional affiliations.
Vanessa Yu, Fiona Yong and Angellica Marta contributed equally to this study.
Contributor Information
Guy A. Rutter, Email: g.rutter@imperial.ac.uk, Email: guy.rutter@umontreal.ca
Steven J. Millership, Email: s.millership@imperial.ac.uk
References
- 1.Rutter GA, Pullen TJ, Hodson DJ, Martinez-Sanchez A. Pancreatic β-cell identity, glucose sensing and the control of insulin secretion. Biochem J. 2015;466(2):203–218. doi: 10.1042/BJ20141384. [DOI] [PubMed] [Google Scholar]
- 2.Salinno C, Cota P, Bastidas-Ponce A, Tarquis-Medina M, Lickert H, Bakhti M. β-cell maturation and identity in health and disease. Int J Mol Sci. 2019;20(21):5417. doi: 10.3390/ijms20215417. [DOI] [PMC free article] [PubMed] [Google Scholar]
- 3.Hoffman BG, Robertson G, Zavaglia B, et al. Locus co-occupancy, nucleosome positioning, and H3K4me1 regulate the functionality of FOXA2-, HNF4A-, and PDX1-bound loci in islets and liver. Genome Res. 2010;20(8):1037–1051. doi: 10.1101/gr.104356.109. [DOI] [PMC free article] [PubMed] [Google Scholar]
- 4.Dhawan S, Tschen SI, Zeng C, et al. DNA methylation directs functional maturation of pancreatic β cells. J Clin Invest. 2015;125(7):2851–2860. doi: 10.1172/JCI79956. [DOI] [PMC free article] [PubMed] [Google Scholar]
- 5.Lu TT, Heyne S, Dror E, et al. The polycomb-dependent epigenome controls β cell dysfunction, dedifferentiation, and diabetes. Cell Metab. 2018;27(6):1294–1308 e1297. doi: 10.1016/j.cmet.2018.04.013. [DOI] [PMC free article] [PubMed] [Google Scholar]
- 6.Parveen N, Wang JK, Bhattacharya S, et al. DNA methylation dependent restriction of tyrosine hydroxylase contributes to pancreatic β-cell heterogeneity. Diabetes. 2023;72(5):575–589. doi: 10.2337/db22-0506. [DOI] [PMC free article] [PubMed] [Google Scholar]
- 7.Dror E, Fagnocchi L, Wegert V, et al. Epigenetic dosage identifies two major and functionally distinct β cell subtypes. Cell Metab. 2023;35(5):821–836 e827. doi: 10.1016/j.cmet.2023.03.008. [DOI] [PMC free article] [PubMed] [Google Scholar]
- 8.Salomon D, Meda P. Heterogeneity and contact-dependent regulation of hormone secretion by individual B cells. Exp Cell Res. 1986;162(2):507–520. doi: 10.1016/0014-4827(86)90354-x. [DOI] [PubMed] [Google Scholar]
- 9.Bosco D, Meda P. Actively synthesizing β-cells secrete preferentially after glucose stimulation. Endocrinology. 1991;129(6):3157–3166. doi: 10.1210/endo-129-6-3157. [DOI] [PubMed] [Google Scholar]
- 10.Dorrell C, Schug J, Canaday PS, et al. Human islets contain four distinct subtypes of β cells. Nat Commun. 2016;7:11756. doi: 10.1038/ncomms11756. [DOI] [PMC free article] [PubMed] [Google Scholar]
- 11.Wang YJ, Schug J, Won KJ, et al. Single-cell transcriptomics of the human endocrine pancreas. Diabetes. 2016;65(10):3028–3038. doi: 10.2337/db16-0405. [DOI] [PMC free article] [PubMed] [Google Scholar]
- 12.Segerstolpe A, Palasantza A, Eliasson P, et al. Single-cell transcriptome profiling of human pancreatic islets in health and type 2 diabetes. Cell Metab. 2016;24(4):593–607. doi: 10.1016/j.cmet.2016.08.020. [DOI] [PMC free article] [PubMed] [Google Scholar]
- 13.Camunas-Soler J, Dai XQ, Hang Y, et al. Patch-seq links single-cell transcriptomes to human islet dysfunction in diabetes. Cell Metab. 2020;31(5):1017–1031 e1014. doi: 10.1016/j.cmet.2020.04.005. [DOI] [PMC free article] [PubMed] [Google Scholar]
- 14.Johnston NR, Mitchell RK, Haythorne E, et al. Beta cell hubs dictate pancreatic islet responses to glucose. Cell Metab. 2016;24(3):389–401. doi: 10.1016/j.cmet.2016.06.020. [DOI] [PMC free article] [PubMed] [Google Scholar]
- 15.Salem V, Silva LD, Suba K, et al. Leader β-cells coordinate Ca2+ dynamics across pancreatic islets in vivo. Nat Metab. 2019;1(6):615–629. doi: 10.1038/s42255-019-0075-2. [DOI] [PMC free article] [PubMed] [Google Scholar]
- 16.Bader E, Migliorini A, Gegg M, et al. Identification of proliferative and mature β-cells in the islets of Langerhans. Nature. 2016;535(7612):430–434. doi: 10.1038/nature18624. [DOI] [PubMed] [Google Scholar]
- 17.Westacott MJ, Ludin NWF, Benninger RKP. Spatially organized β-cell subpopulations control electrical dynamics across islets of Langerhans. Biophys J. 2017;113(5):1093–1108. doi: 10.1016/j.bpj.2017.07.021. [DOI] [PMC free article] [PubMed] [Google Scholar]
- 18.Chabosseau P, Rutter GA, Millership SJ. Importance of both imprinted genes and functional heterogeneity in pancreatic beta cells: is there a link? Int J Mol Sci. 2021;22(3):1000. doi: 10.3390/ijms22031000. [DOI] [PMC free article] [PubMed] [Google Scholar]
- 19.Karaca M, Castel J, Tourrel-Cuzin C, et al. Exploring functional β-cell heterogeneity in vivo using PSA-NCAM as a specific marker. PLoS One. 2009;4(5):e5555. doi: 10.1371/journal.pone.0005555. [DOI] [PMC free article] [PubMed] [Google Scholar]
- 20.Salinno C, Buttner M, Cota P, et al. CD81 marks immature and dedifferentiated pancreatic β-cells. Mol Metab. 2021;49:101188. doi: 10.1016/j.molmet.2021.101188. [DOI] [PMC free article] [PubMed] [Google Scholar]
- 21.Muraro MJ, Dharmadhikari G, Grun D, et al. A single-cell transcriptome atlas of the human pancreas. Cell Syst. 2016;3(4):385–394 e383. doi: 10.1016/j.cels.2016.09.002. [DOI] [PMC free article] [PubMed] [Google Scholar]
- 22.Rodnoi P, Rajkumar M, Moin ASM, Georgia SK, Butler AE, Dhawan S. Neuropeptide Y expression marks partially differentiated β cells in mice and humans. JCI Insight. 2017;2(12):e94005. doi: 10.1172/jci.insight.94005. [DOI] [PMC free article] [PubMed] [Google Scholar]
- 23.Rubio-Navarro A, Gomez-Banoy N, Stoll L, et al. A beta cell subset with enhanced insulin secretion and glucose metabolism is reduced in type 2 diabetes. Nat Cell Biol. 2023;25(4):565–578. doi: 10.1038/s41556-023-01103-1. [DOI] [PMC free article] [PubMed] [Google Scholar]
- 24.van der Meulen T, Mawla AM, DiGruccio MR, et al. Virgin beta cells persist throughout life at a neogenic niche within pancreatic islets. Cell Metab. 2017;25(4):911–926 e916. doi: 10.1016/j.cmet.2017.03.017. [DOI] [PMC free article] [PubMed] [Google Scholar]
- 25.Chabosseau P, Yong F, Delgadillo-Silva LF, et al. Molecular phenotyping of single pancreatic islet leader beta cells by "Flash-Seq". Life Sci. 2023;316:121436. doi: 10.1016/j.lfs.2023.121436. [DOI] [PubMed] [Google Scholar]
- 26.Kravets V, Dwulet JM, Schleicher WE, et al. Functional architecture of pancreatic islets identifies a population of first responder cells that drive the first-phase calcium response. PLoS Biol. 2022;20(9):e3001761. doi: 10.1371/journal.pbio.3001761. [DOI] [PMC free article] [PubMed] [Google Scholar]
- 27.Nasteska D, Fine NHF, Ashford FB, et al. PDX1LOW MAFALOW β-cells contribute to islet function and insulin release. Nat Commun. 2021;12(1):674. doi: 10.1038/s41467-020-20632-z. [DOI] [PMC free article] [PubMed] [Google Scholar]
- 28.Wang G, Chiou J, Zeng C, et al. Integrating genetics with single-cell multiomic measurements across disease states identifies mechanisms of beta cell dysfunction in type 2 diabetes. Nat Genet. 2023;55(6):984–994. doi: 10.1038/s41588-023-01397-9. [DOI] [PMC free article] [PubMed] [Google Scholar]
- 29.Katsuta H, Aguayo-Mazzucato C, Katsuta R, et al. Subpopulations of GFP-marked mouse pancreatic β-cells differ in size, granularity, and insulin secretion. Endocrinology. 2012;153(11):5180–5187. doi: 10.1210/en.2012-1257. [DOI] [PMC free article] [PubMed] [Google Scholar]
- 30.Xin Y, Dominguez Gutierrez G, Okamoto H, et al. Pseudotime ordering of single human β-cells reveals states of insulin production and unfolded protein response. Diabetes. 2018;67(9):1783–1794. doi: 10.2337/db18-0365. [DOI] [PubMed] [Google Scholar]
- 31.Millership SJ, Van de Pette M, Withers DJ. Genomic imprinting and its effects on postnatal growth and adult metabolism. Cell Mol Life Sci. 2019;76(20):4009–4021. doi: 10.1007/s00018-019-03197-z. [DOI] [PMC free article] [PubMed] [Google Scholar]
- 32.Villanueva-Hayes C, Millership SJ. Imprinted genes impact upon beta cell function in the current (and potentially next) generation. Front Endocrinol (Lausanne) 2021;12:660532. doi: 10.3389/fendo.2021.660532. [DOI] [PMC free article] [PubMed] [Google Scholar]
- 33.Ferguson-Smith AC. Genomic imprinting: the emergence of an epigenetic paradigm. Nat Rev Genet. 2011;12(8):565–575. doi: 10.1038/nrg3032. [DOI] [PubMed] [Google Scholar]
- 34.John RM, Lefebvre L. Developmental regulation of somatic imprints. Differentiation. 2011;81(5):270–280. doi: 10.1016/j.diff.2011.01.007. [DOI] [PubMed] [Google Scholar]
- 35.Millership SJ, Da Silva Xavier G, Choudhury AI, et al. Neuronatin regulates pancreatic beta cell insulin content and secretion. J Clin Invest. 2018;128(8):3369–3381. doi: 10.1172/JCI120115. [DOI] [PMC free article] [PubMed] [Google Scholar]
- 36.Vrang N, Meyre D, Froguel P, et al. The imprinted gene neuronatin is regulated by metabolic status and associated with obesity. Obesity (Silver Spring) 2010;18(7):1289–1296. doi: 10.1038/oby.2009.361. [DOI] [PMC free article] [PubMed] [Google Scholar]
- 37.Dalgaard K, Landgraf K, Heyne S, et al. Trim28 haploinsufficiency triggers bi-stable epigenetic obesity. Cell. 2016;164(3):353–364. doi: 10.1016/j.cell.2015.12.025. [DOI] [PMC free article] [PubMed] [Google Scholar]
- 38.Millership SJ, Tunster SJ, Van de Pette M, et al. Neuronatin deletion causes postnatal growth restriction and adult obesity in 129S2/Sv mice. Mol Metab. 2018;18:97–106. doi: 10.1016/j.molmet.2018.09.001. [DOI] [PMC free article] [PubMed] [Google Scholar]
- 39.Byrnes LE, Wong DM, Subramaniam M, et al. Lineage dynamics of murine pancreatic development at single-cell resolution. Nat Commun. 2018;9(1):3922. doi: 10.1038/s41467-018-06176-3. [DOI] [PMC free article] [PubMed] [Google Scholar]
- 40.Sasaki S, Lee MYY, Wakabayashi Y, et al. Spatial and transcriptional heterogeneity of pancreatic beta cell neogenesis revealed by a time-resolved reporter system. Diabetologia. 2022;65(5):811–828. doi: 10.1007/s00125-022-05662-0. [DOI] [PubMed] [Google Scholar]
- 41.Sachs S, Bastidas-Ponce A, Tritschler S, et al. Targeted pharmacological therapy restores β-cell function for diabetes remission. Nat Metab. 2020;2(2):192–209. doi: 10.1038/s42255-020-0171-3. [DOI] [PubMed] [Google Scholar]
- 42.Tritschler S, Thomas M, Bottcher A, et al. A transcriptional cross species map of pancreatic islet cells. Mol Metab. 2022;66:101595. doi: 10.1016/j.molmet.2022.101595. [DOI] [PMC free article] [PubMed] [Google Scholar]
- 43.Herrera PL. Adult insulin- and glucagon-producing cells differentiate from two independent cell lineages. Development. 2000;127(11):2317–2322. doi: 10.1242/dev.127.11.2317. [DOI] [PubMed] [Google Scholar]
- 44.Luche H, Weber O, Nageswara Rao T, Blum C, Fehling HJ. Faithful activation of an extra-bright red fluorescent protein in "knock-in" Cre-reporter mice ideally suited for lineage tracing studies. Eur J Immunol. 2007;37(1):43–53. doi: 10.1002/eji.200636745. [DOI] [PubMed] [Google Scholar]
- 45.Parton LE, McMillen PJ, Shen Y, et al. Limited role for SREBP-1c in defective glucose-induced insulin secretion from Zucker diabetic fatty rat islets: a functional and gene profiling analysis. Am J Physiol Endocrinol Metab. 2006;291(5):E982–994. doi: 10.1152/ajpendo.00067.2006. [DOI] [PubMed] [Google Scholar]
- 46.Herman JS, Sagar, Grun D. FateID infers cell fate bias in multipotent progenitors from single-cell RNA-seq data. Nat Methods. 2018;15(5):379–386. doi: 10.1038/nmeth.4662. [DOI] [PubMed] [Google Scholar]
- 47.Jima DD, Skaar DA, Planchart A, et al. Genomic map of candidate human imprint control regions: the imprintome. Epigenetics. 2022;17(13):1920–1943. doi: 10.1080/15592294.2022.2091815. [DOI] [PMC free article] [PubMed] [Google Scholar]
- 48.Pullen TJ, Huising MO, Rutter GA. Analysis of purified pancreatic islet beta and alpha cell transcriptomes reveals 11β-hydroxysteroid dehydrogenase (Hsd11b1) as a novel disallowed gene. Front Genet. 2017;8:41. doi: 10.3389/fgene.2017.00041. [DOI] [PMC free article] [PubMed] [Google Scholar]
- 49.Georgiadou E, Muralidharan C, Martinez M, et al. Mitofusins Mfn1 and Mfn2 are required to preserve glucose- but not incretin-stimulated β-cell connectivity and insulin secretion. Diabetes. 2022;71(7):1472–1489. doi: 10.2337/db21-0800. [DOI] [PMC free article] [PubMed] [Google Scholar]
- 50.Ivanova E, Chen JH, Segonds-Pichon A, Ozanne SE, Kelsey G. DNA methylation at differentially methylated regions of imprinted genes is resistant to developmental programming by maternal nutrition. Epigenetics. 2012;7(10):1200–1210. doi: 10.4161/epi.22141. [DOI] [PMC free article] [PubMed] [Google Scholar]
- 51.Van de Pette M, Abbas A, Feytout A, et al. Visualizing changes in Cdkn1c expression links early-life adversity to imprint mis-regulation in adults. Cell Rep. 2017;18(5):1090–1099. doi: 10.1016/j.celrep.2017.01.010. [DOI] [PMC free article] [PubMed] [Google Scholar]
- 52.Ebrahimi AG, Hollister-Lock J, Sullivan BA, Tsuchida R, Bonner-Weir S, Weir GC. Beta cell identity changes with mild hyperglycemia: implications for function, growth, and vulnerability. Mol Metab. 2020;35:100959. doi: 10.1016/j.molmet.2020.02.002. [DOI] [PMC free article] [PubMed] [Google Scholar]
- 53.Ou K, Yu M, Moss NG, et al. Targeted demethylation at the CDKN1C/p57 locus induces human β cell replication. J Clin Invest. 2019;129(1):209–214. doi: 10.1172/JCI99170. [DOI] [PMC free article] [PubMed] [Google Scholar]
Associated Data
This section collects any data citations, data availability statements, or supplementary materials included in this article.
Supplementary Materials
Data Availability Statement
The mass spectrometry proteomics data have been deposited to the ProteomeXchange Consortium via the PRIDE partner repository with the dataset identifier PXD048465.
RNA-seq data are available from the GEO under accession number GSE249659. The mass spectrometry proteomics data have been deposited to the ProteomeXchange Consortium via the PRIDE partner repository with the dataset identifier PXD048465. ImageJ scripts and CellProfiler pipelines can be made available upon reasonable request. Pseudo-time analysis scripts are available via GitHub using the link https://github.com/aosakwe/Pseudotime_Analysis_MouseIslets. Transcriptomic data for ob/ob mice can be obtained from a publicly available source from the Alan Attie laboratory (http://diabetes.wisc.edu/search).


