Abstract
Regulatory T cells (Treg cells) are instrumental in establishing immunological tolerance. However, the precise effector mechanisms by which Treg cells control a specific type of immune response in a given tissue remains unresolved. By simultaneously studying Treg cells from different tissue origins under systemic autoimmunity, in the present study we show that interleukin (IL)-27 is specifically produced by intestinal Treg cells to regulate helper T17 cell (TH17 cell) immunity. Selectively increased intestinal TH17 cell responses in mice with Treg cell-specific IL-27 ablation led to exacerbated intestinal inflammation and colitis-associated cancer, but also helped protect against enteric bacterial infection. Furthermore, single-cell transcriptomic analysis has identified a CD83+CD62Llo Treg cell subset that is distinct from previously characterized intestinal Treg cell populations as the main IL-27 producers. Collectively, our study uncovers a new Treg cell suppression mechanism crucial for controlling a specific type of immune response in a particular tissue and provides further mechanistic insights into tissue-specific Treg cell-mediated immune regulation.
Treg cells control diverse types of immune responses and maintain immunological tolerance and tissue homeostasis1. Although the expression of Foxp3 as a master molecular regulator in Treg cells distinguishes them from other T cell lineages, it is well recognized that, similar to conventional T (Tconv) cells that they regulate, Treg cells also come in different phenotypic and functional ‘flavors’2. The acquisition of helper T cell lineage-specific transcription factors in Treg cells endows them with the capacities to control the corresponding immune responses in different inflammatory settings. Nevertheless, as transcription factors regulate the expression of a large number of genes, the precise effector mechanisms by which different helper T cell-specific Treg cell subset control their respective type of T cell immunity have yet to be determined.
Besides the Treg cell subsets that regulate different types of T cell immune responses, the presence of distinct Treg cell populations in nonlymphoid tissues has also now been well appreciated3. Beyond exerting their immunoregulatory function to control local inflammation in a given anatomical site, these so-called tissue Treg cells were also shown to exhibit specific functional features to maintain corresponding organismal homeostasis. For example, during lung and muscle damages or ischemic stroke-induced brain injuries, Treg cells in those respective tissues are able to secret amphiregulin, a ligand of the epidermal growth factor receptor, to facilitate tissue repair4–6. Moreover, in the adipose tissue, adenosine generated by CD73+ Treg cells was recently reported to promote adaptive thermogenesis by activating beige fat biogenesis7. These studies have provided experimental evidence demonstrating the effector mechanisms underlying the nonimmunological role of Treg cells in maintaining tissue homeostasis. However, like the aforementioned helper T cell-specific Treg cells, how each tissue Treg cell population controls its corresponding local immune responses remains poorly characterized.
To date, only a handful of suppressor molecules have been implicated in tissue Treg cell-mediated immune regulation3, the most well characterized of which is IL-10. Yet mice with IL-10 deleted specifically in Treg cells exhibited inflammation at multiple mucosal sites, indicating that IL-10, albeit not a universal Treg cell suppressor molecule, was still commonly utilized by different tissue Treg cell subsets8. In addition, Treg cell-derived IL-10 also does not seem to regulate a specific type of immune response because mice harboring Treg cells incapable of producing IL-10 exhibited exacerbated TH1, TH2 and TH17 cell-driven tissue pathology8,9. By employing an experimental system that permits simultaneous examination of multiple tissue Treg cell subsets during systemic autoimmunity, in the present study we identified distinct transcriptomic signatures in two different tissue Treg cell populations that could account for their respective control of local inflammation. In particular, we found that IL-27, a pluripotent cytokine recognized for its regulatory properties10, is specifically induced in gut Treg cells under inflammatory conditions. Moreover, IL-27 derived from Treg cells, but not from other known intestinal IL-27-producing cell populations, is selectively needed for controlling TH17 rcell esponses in the gut-associated tissue. Loss of IL-27 expression by Treg cells led to exacerbated TH17 cell-driven intestinal inflammation and colitis-associated cancer. Conversely, enhanced TH17 cell responses in mice with Treg cell-specific IL-27 ablation could also help protect against enteric bacterial infection. Finally, single-cell transcriptomic analysis of intestinal Treg cells revealed a distinct CD83+CD62Llo Treg cell subset that does not express IL-10 but is responsible for IL-27 production, particularly during intestinal inflammation. Together, our study uncovers a previously uncharacterized Treg cell suppression mechanism that is pivotal to controlling a specific type of immune response in a particular tissue and provides further mechanistic insights into tissue-specific, Treg cell-mediated immune regulation.
Results
Unique signatures in tissue Treg cells under inflammation
It has become evident that, like Tconv cells, Treg cells differentiate into effector Treg cells on activation and that both T cell receptor activation and cytokine stimulation play critical roles in inducing Treg cell suppressor activity11,12. To capture the dynamic gene expression profiles in tissue Treg cells involved in restricting ongoing inflammation in vivo, we employed an experimental system allowing us to simultaneously assess multiple tissue Treg cells when they are actively controlling ongoing autoimmunity. In brief, multiorgan autoimmune inflammation was induced by Treg cell ablation on diphtheria toxin (DT) administration in mice containing Treg cells expressing the DT receptor (DTR) (Foxp3DTR)13 (Extended Data Fig. 1a). The fatal consequence of DT-mediated Treg cell ablation was then rescued via the transfer of congenically marked Treg cells (Extended Data Fig. 1b,c). In this way, synchronized, in vivo, activated Treg cells could be obtained without the contamination of recent thymic Treg cell emigrants that have not been properly stimulated. Next, Treg cells and Tconv cells from spleen as well as lung and small intestinal lamina propria (SI LP) were isolated from DT-treated Foxp3DTR mice or control phosphate-buffered saline (PBS)-treated mice 10 d after Treg cell transfer for RNA-sequencing (RNA-seq) and comparative bio-informatics analysis. Although the DT-treated Foxp3DTR mice would eventually recover owing to the presence of transferred Treg cells, at this time point, Tconv cells remained highly activated and expressed genes characteristic of TH1, TH2 and TH17 cell subsets of effector T (Teff) cells (Extended Data Fig. 1d).
Consistent with previous studies3, we found genes that are known to be upregulated in Treg cells from the nonlymphoid tissues, including transcription factors (for example, Irf4, Nfil3, Id2, Rorc and Fosl2), cytokine receptors (for example, Il1rl1), effector molecules (for example, Il10, Klrg1, Areg, Gzmb, Fgl2, Metrnl and Lrb4r1) and co-inhibitory molecules (for example, Pdcd1 and Lag3), which were expressed at higher levels in Treg cells from lung and gut compared with those from spleen. Similarly, we also detected genes that are known to be expressed at the lower level in tissue Treg cells, such as Id3, Tcf7, Bach2 and Nrp1, which were downregulated in Treg cells from lung and gut compared with those from spleen (Extended Data Fig. 1e). Nevertheless, despite a clear difference in gene expression observed in different tissue Treg cells subsets from either DT-treated Foxp3DTR mice or PBS-treated mice, as shown in the heatmap analysis (Extended Data Fig. 1f), the impact of inflammation on the transcriptional profiles in Treg cells (and Tconv cells) was apparent. Consistently, principal component analysis (PCA) of RNA-seq results revealed a high degree of resemblance in Treg cells and Tconv cells isolated from mice with DT treatment compared with the PBS-treated controls regardless of tissue origins (Extended Data Fig. 1g, top). On the other hand, both Treg cells and Tconv cells in the same tissue also shared a considerable level of similarity in gene expression regardless of the presence or absence of inflammation (Extended Data Fig. 1g, bottom).
Next, we used scatter plots to compare genes that were differentially expressed in Treg cells versus Tconv cells isolated from a particular tissue in mice with or without DT treatment (Fig. 1a–c). Only genes that are upregulated (red) or downregulated (blue) in Treg cells, when compared with Tconv cells under the DT-treated condition, by more than 1.5-fold and at least 1.5-fold higher or lower than those under the PBS-treated condition, respectively, were considered to be potentially involved in Treg cell-mediated control of inflammation. Moreover, through Venn diagrams, we further identified genes that are commonly regulated in all or several Treg cell populations versus ones that are uniquely up- or downregulated in a given Treg cell subset over their Tconv cell counterpart from a particular anatomical location during autoimmunity (Fig. 1d,e). Finally, gene ontology (GO) term enrichment analysis of differentially expressed genes (DEGs) in Treg cells from different tissues under DT-treated conditions revealed biological pathways that could be potentially critical for tissue Treg cell-mediated control of inflammation in a given tissue microenvironment (Fig. 1f,g). To this end, genes related to leukocyte proliferation could be observed in all Treg cell populations whereas genes related to regulation of T cell activation were specifically enriched in gut Treg cells (Fig. 1f). These results suggested that, although transferred Treg cells were all undergoing rapid expansion to control inflammation, regulation of T cell activation in the intestine required a specialized suppressor program employed by gut Treg cells.
Fig. 1 |. Transcriptomic analysis of tissue Treg cells during active suppression of local inflammatory responses.
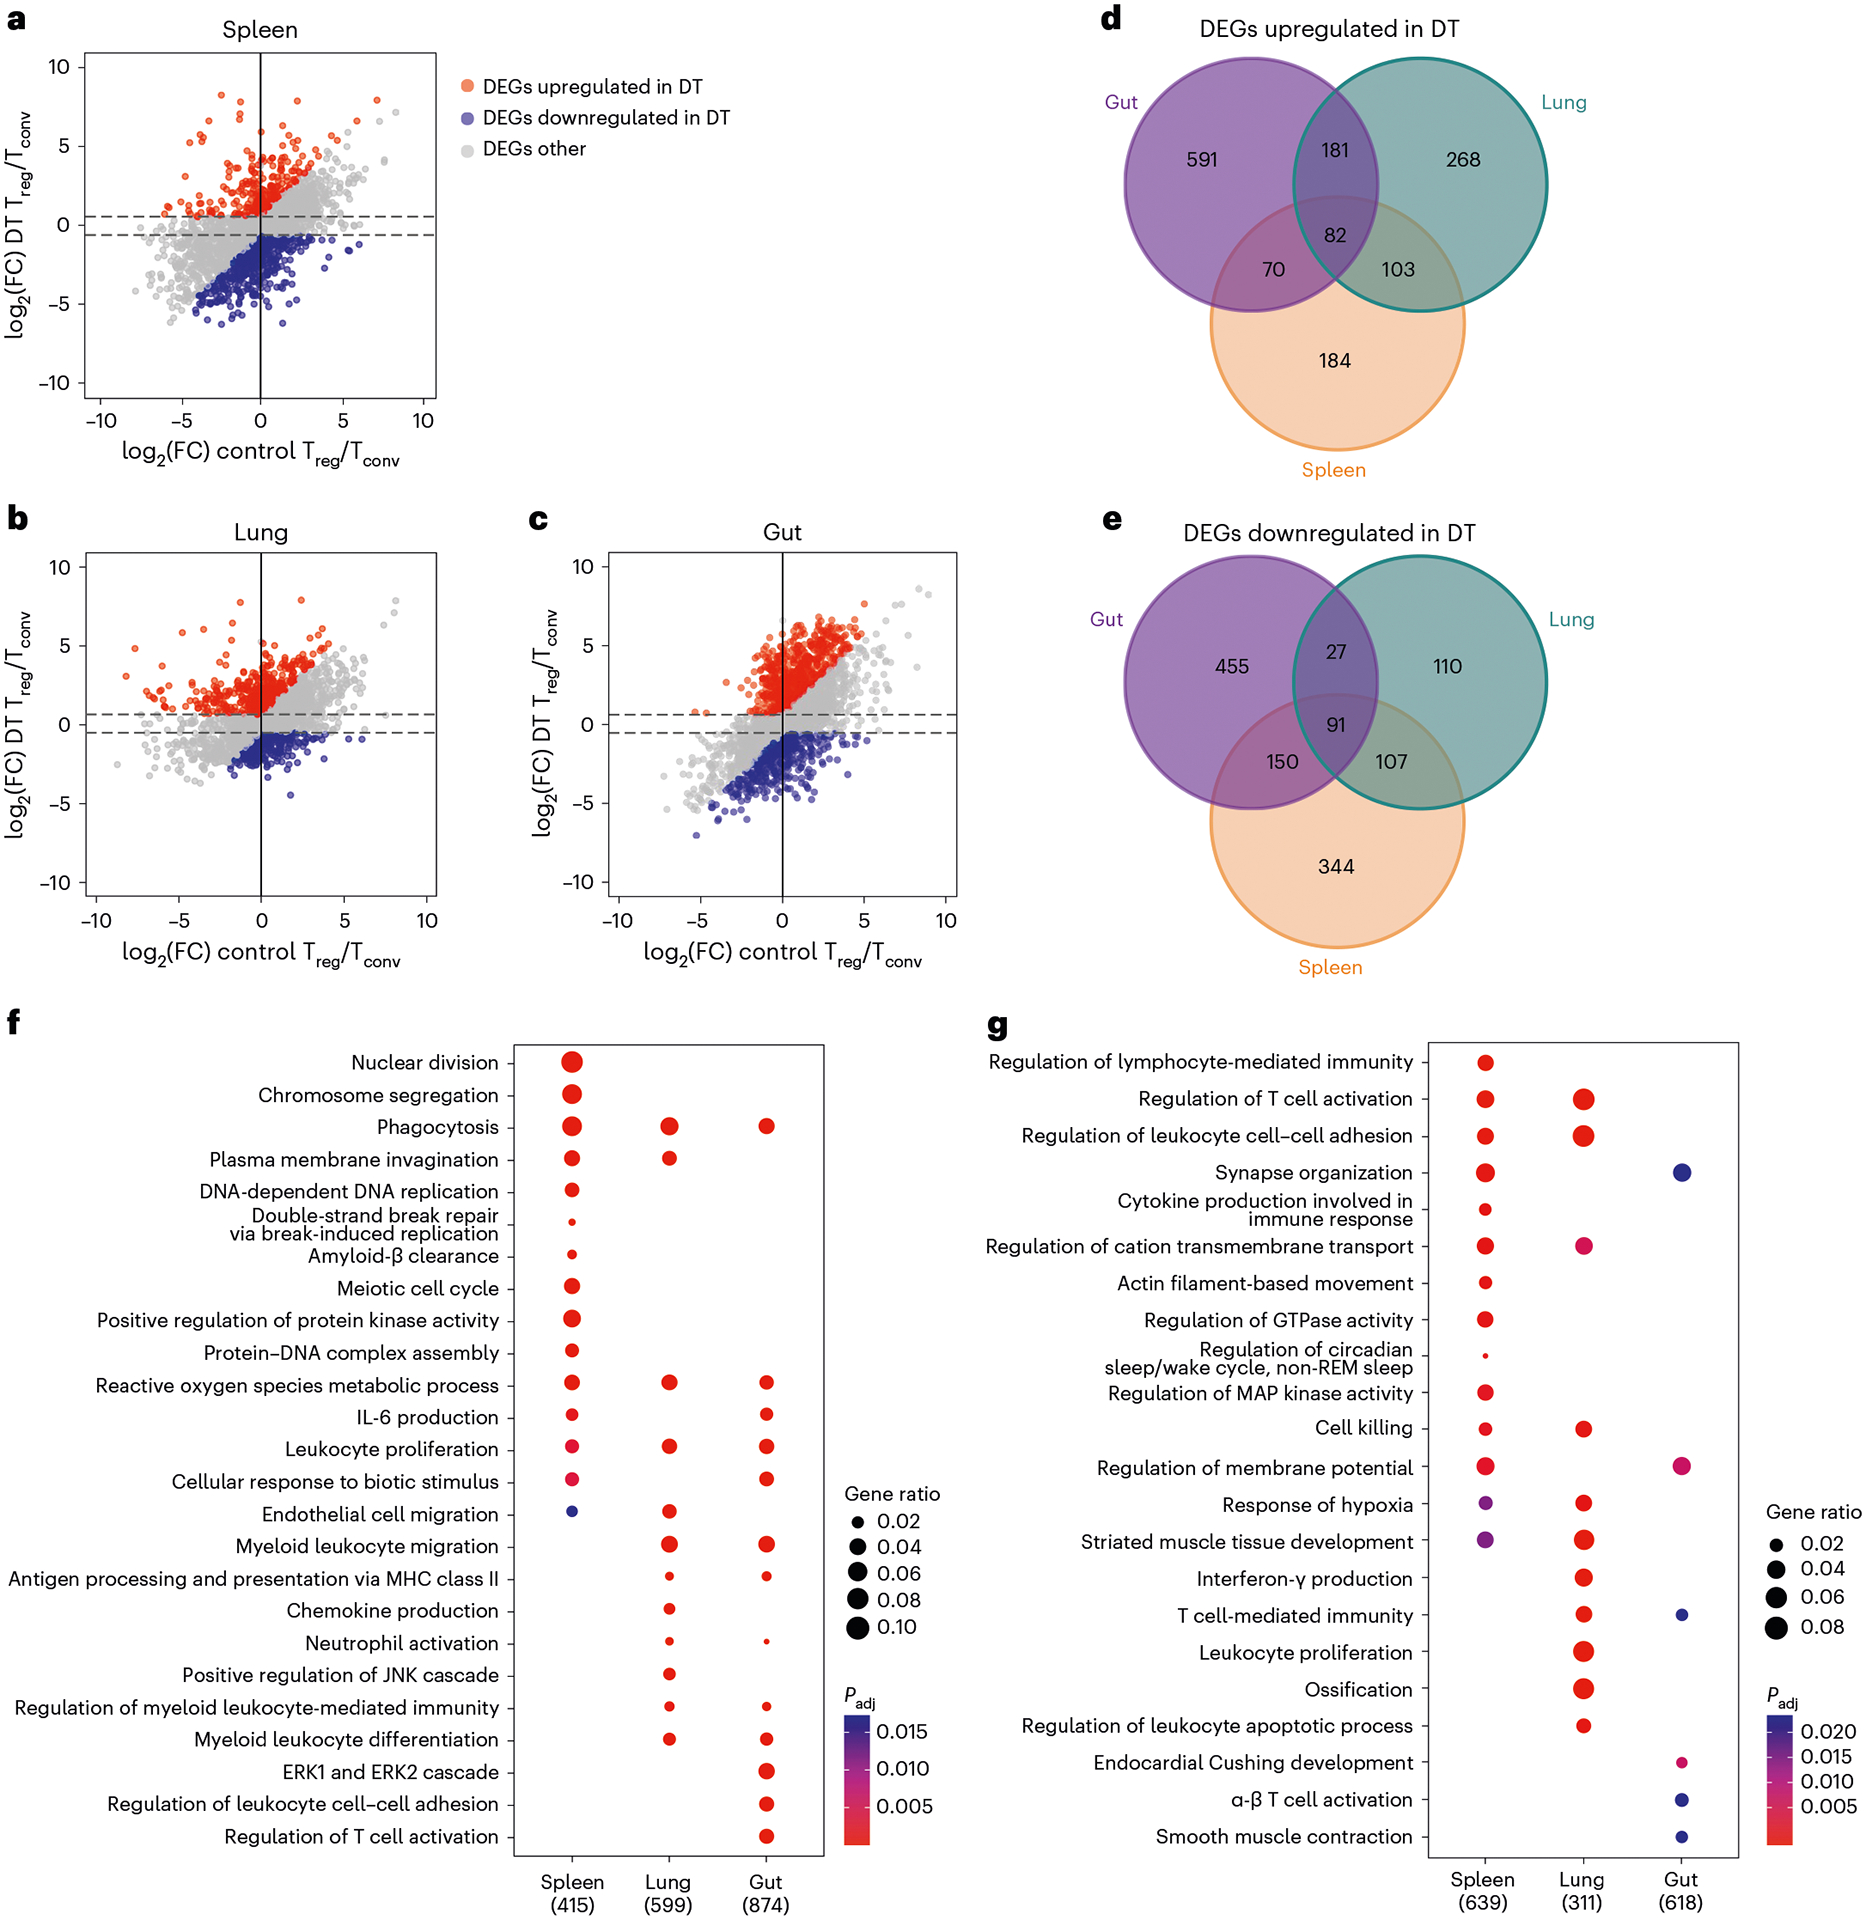
a–c, Scatter plots depicting log2(fold-change) (log2(FC)) of gene expression in spleen (a), lung (b) and gut (SI LP) (c) of Treg cells over Tconv cells in DT-treated mice versus those in PBS-treated controls. Genes that are upregulated under DT-treated condition (false discovery rate (FDR) <5% and the value of log2(FC) > 0.585 (1.5-fold) and at least 0.585 higher than the value of log2(FC) under the PBS-treated control condition). Genes are downregulated under the DT-treated condition (FDR < 5% and the value of log2(FC) < −0.585 and at least 0.585 lower than the value of log2(FC) under the PBS-treated control condition). d,g, Venn diagrams demonstrating genes upregulated (d) or downregulated (e) in different tissue-specific Treg cells from DT-treated mice. Numbers represent gene numbers. f,g, Dot plot of GO term enrichment analysis of DEGs upregulated (f) or downregulated (g) in tissue Treg cell subsets. MHC, Major histocompatibility complex; REM, rapid eye movement. Colors indicate the P values from Fisher’s exact test and dot size is proportional to the number of DEGs in a given biological process.
Specific IL-27 induction in gut Treg cells under inflammation
To gain further insight into the precise mechanisms by which tissue Treg cells control their corresponding local immune responses, we explored the identified tissue Treg cell-specific genes with a focus on the ones that have been previously associated with a role in immune regulation. Among the genes selectively upregulated in gut Treg cells from mice with ongoing inflammation (Fig. 1d, top), Il27, which encodes a subunit (IL-27p28) of a heterodimeric cytokine, IL-27, is of particular interest (Fig. 2a). IL-27, composed of EBI3 and IL-27p28, is a member of the IL-6/IL-12 superfamily. Previously, it was reported that IL-27 can directly inhibit the development of TH17 cells14,15. Moreover, IL-27 has also been shown to exert its suppressive effects indirectly through inducing IL-10 production by many T cell subsets or via promoting a specific T-bet+Foxp3+ Treg cell population specialized to limit TH1 cell immunity16,17. However, even though Treg cells are known to express high levels of EBI3 (ref. 18), a finding that is also supported by our RNA-seq studies (Fig. 2b), it was IL-35, another heterodimeric cytokine composed of EBI3 and IL-12α rather than IL-27p28, that has been previously shown to serve as a Treg cell suppressor molecule18. Nevertheless, in our RNA-seq studies and quantitative (q)PCR analysis, unlike Il27 and Ebi3, the level of Il12a expression in Treg cells remained low irrespective of tissue origins or inflammatory conditions (Fig. 2c–f). Finally, we have also selectively detected a significantly increased amount of IL-27 protein but not IL-35 protein produced by intestinal Treg cells from mice treated with DT (Fig. 2g,h).
Fig. 2 |. Identification of IL-27 not IL-35 as a potential suppressor molecule specifically produced by intestinal Treg cells under autoimmune inflammation.
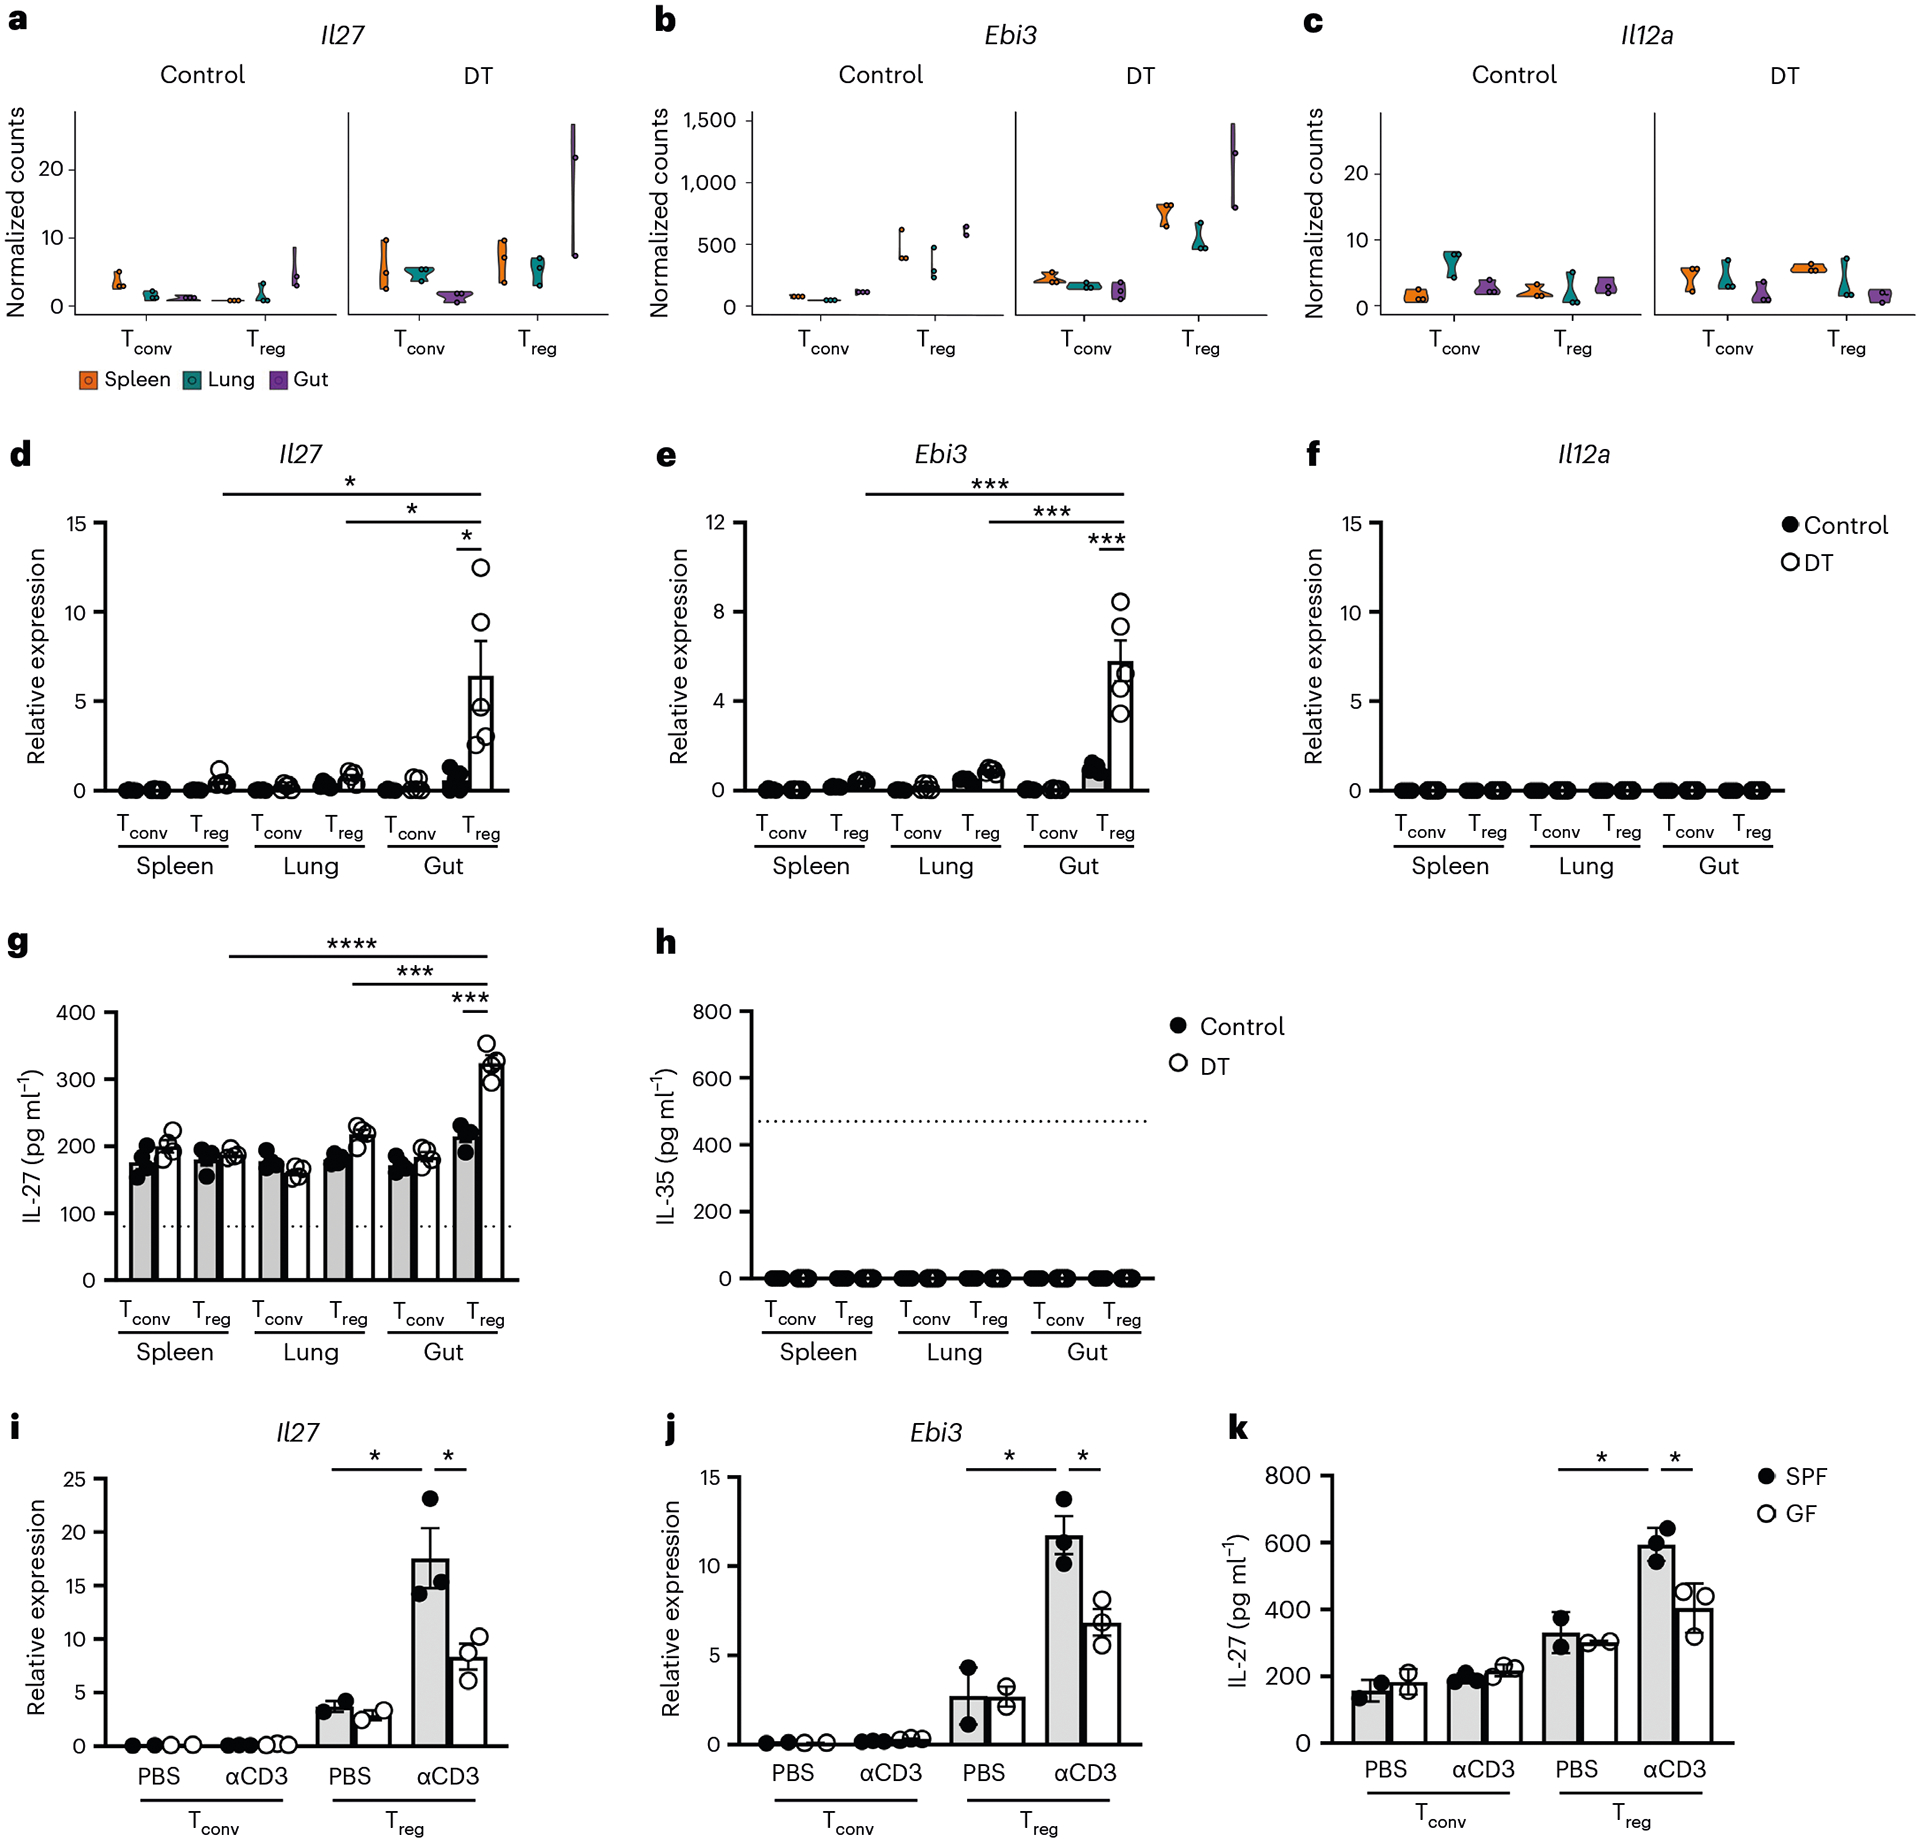
a–c, Violin plots of Il27 (a), Ebi3 (b) and Il12a (c) in Tconv and Treg cells in different tissues from control PBS- or DT-treated Foxp3DTR mice by RNA-seq analysis. d–f, The qPCR analyses for the expression of Il27 (d), Ebi3 (e) and Il12a (f) in Tconv and Treg cells in different tissues from control PBS- or DT-treated mice. Each symbol represents an individual mouse (n = 5). g,h, ELISA of the production of IL-27 (g) or IL-35 (h) by Tconv and Treg cells in different tissues from control PBS- or DT-treated mice. i,j, The qPCR analyses for the expressions of Il27 (i) and Ebi3 (j) in Tconv and Treg cells in SI from control PBS- or aCD3−-treated SPF or GF mice. Each symbol represents a FACS-isolated cell sample pooled from two to three mice (n = 4). k, ELISA analyses of the production of IL-27 by Tconv and Treg cells in SI LP from control PBS- or aCD3 monoclonal antibody-treated SPF and GF mice. Each symbol represents a FACS-isolated cell sample pooled from two to three mice (n = 2 for SPF and 3 for GF). The dotted line represents the minimum detection limit of the indicated cytokine. The data are presented as mean values ± s.d. In d, *P = 0.0164 (up), 0.0187 (middle) and 0.0173 (bottom). In e, ***P = 0.0004 (up), 0.0007 (middle) and 0.0008 (bottom). In g, ****P < 0.0001 (top), 0.0003 (middle) and 0.0003 (bottom). In i, *P = 0.0351 (left) and 0.0394 (right). In j, *P = 0.0467 (left) and 0.0193 (right). In k, *P = 0.0413 (left) and 0.0207 (right). Statistical significance was determined using a two-tailed, unpaired Student’s t-test.
Notably, transferred Treg cells in DT-treated Foxp3DTR mice not only experienced autoimmune inflammation but were also under the pressure of filling up the niche in the absence of endogenous Treg cells. Therefore, we sought to determine whether elevated expression of IL-27 in intestinal Treg cells could also be observed in a different inflammatory setting. To this end, we employed an anti-CD3 monoclonal antibody-induced intestinal disease model in which treatment of anti-CD3 monoclonal antibody has been shown to lead to acute inflammation and intestinal pathology19. As shown in Fig. 2i–k, significantly increased expressions of both the transcript and protein of IL-27 were detected in gut Treg cells in mice receiving anti-CD3 monoclonal antibody treatment. These results suggested that elevated secretion of IL-27 by gut Treg cells is probably a common phenotype that could be detected in various inflammatory settings. It is interesting that such increases in IL-27 expression were greatly diminished in germ-free (GF) mice when compared with specific pathogen-free (SPF) counterparts, implying that, other than inflammation, commensal bacteria also play an important role in inducing IL-27 in gut Treg cells (Fig. 2i–k). It is noteworthy that elevated production of IL-10 by gut Treg cells was also detected (Extended Data Fig. 2). However, unlike IL-27, high levels of IL-10 expression in gut Treg cells could already be observed at steady state but with no clear further upregulation in the presence of inflammation. Collectively, our results suggested that, although Treg cell-derived IL-10 has been long recognized for its role in maintaining gut homeostasis8, IL-27 produced by Treg cells might play a more active role in controlling ongoing intestinal inflammation.
Treg cell-derived IL-27 controls gut TH17 cell responses
To examine the function of IL-27 in Treg cell-mediated immune regulation, particularly in the intestine, we generated mice with Treg cell-specific deletion of IL-27p28 (Foxp3CreIl27fl/fl). Foxp3CreIl27fl/fl mice did not develop any obvious immune phenotype or autoimmune pathology (Fig. 3 and Extended Data Fig. 3). The frequencies and numbers of Treg cells in both lymphoid and nonlymphoid tissues were comparable between Foxp3CreIl27fl/fl mice and their control littermates (Fig. 3a and Extended Data Fig. 3a,b). The suppression capacity of Treg cells isolated from the intestinal tissue was also not impeded by the absence of IL-27 production (Fig. 3b,c). Consequently, Tconv cells remained under control because no difference in their proliferation and activation in Foxp3CreIl27fl/fl mice could be observed (Fig. 3d,e and Extended Data Fig. 3a,b). It is interesting that, despite exhibiting no detectable inflammatory responses, loss of IL-27 in Treg cells already resulted in a selective increase in the production of IL-17 by gut Teff cells without any immunological challenges (Fig. 3f,g and Extended Data Fig. 3b). Moreover, dysregulated IL-17 responses in Foxp3CreIl27fl/fl mice were observed only in the gut because no alteration in TH17 cells was found elsewhere (Extended Data Fig. 3a). Finally, consistent with increased IL-17+ Tconv cells, Foxp3CreIl27fl/fl mice also exhibited elevated frequencies of RORγt+ Tconv cells selectively in the intestine (Extended Data Fig. 3c,d). Notably, the percentage of IL-17+ cells within the RORγt+ Tconv population was comparable in mice with or without Treg cell-specific IL-27 ablation (Extended Data Fig. 3e), a finding agreeing with the reported role of IL-27 in inhibiting TH17 cell differentiation rather than suppressing IL-17 expression15,
Fig. 3 |. A selective defect in regulating intestinal TH17 cell responses in mice harboring Treg cells incapable of producing IL-27.
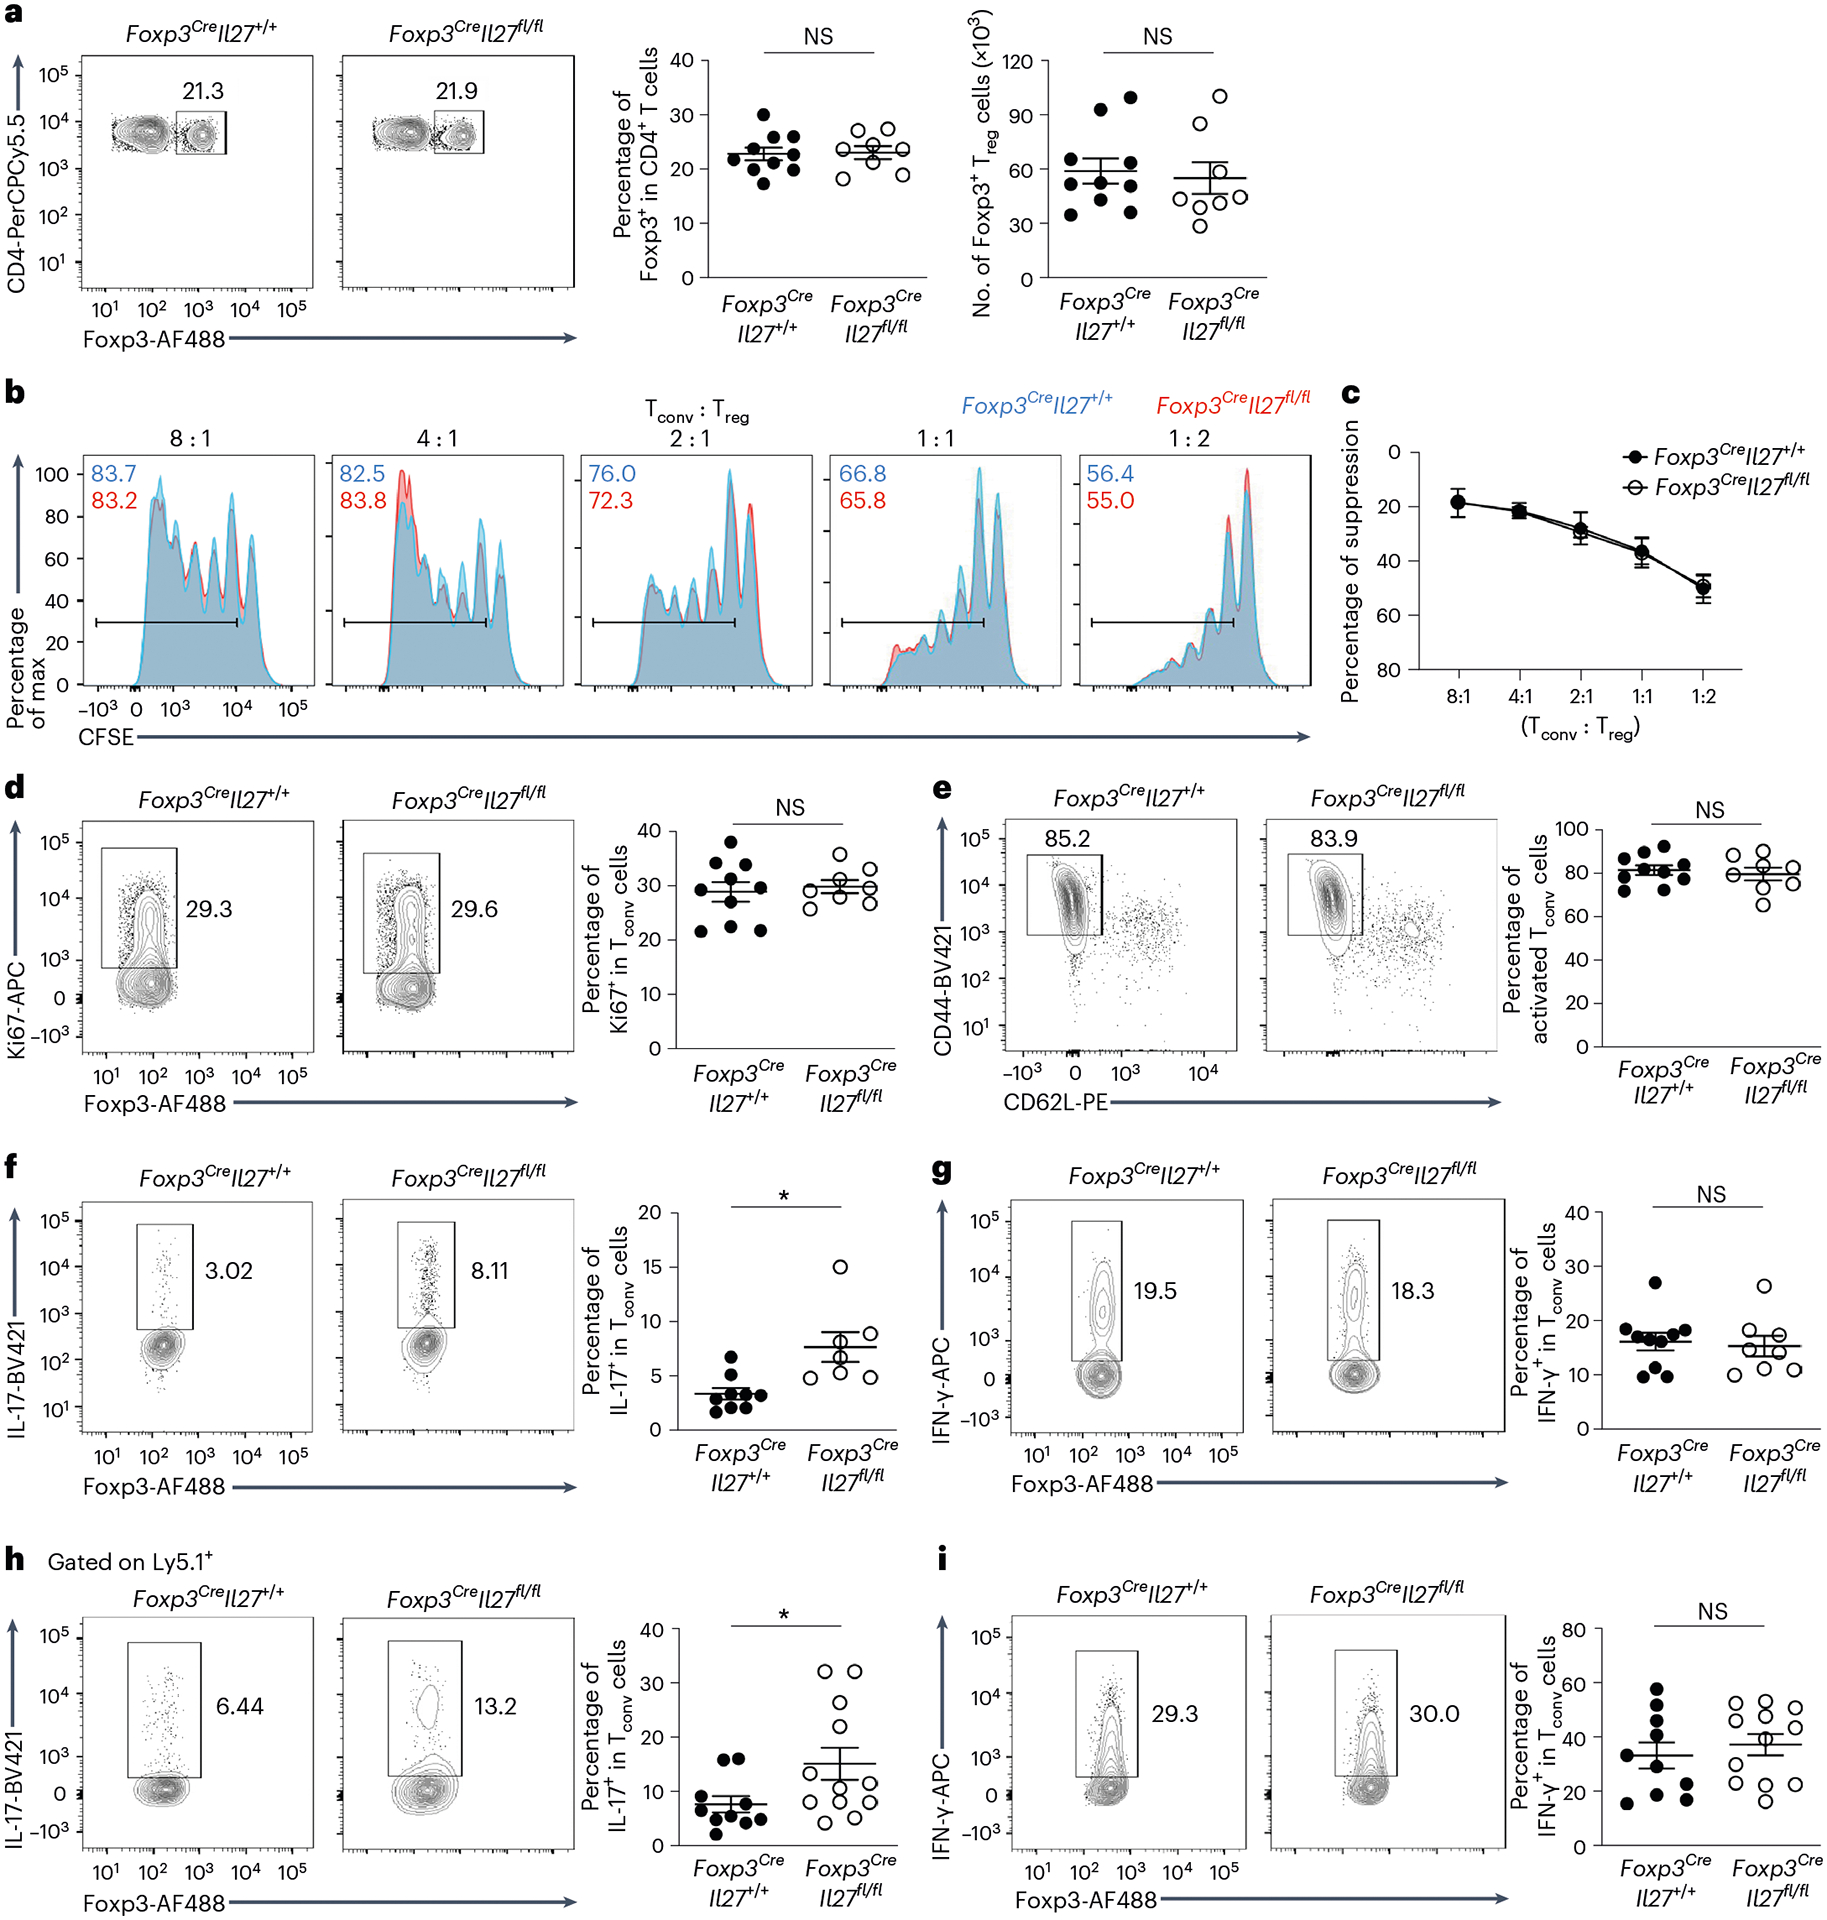
a, FACS analysis, frequencies and numbers of Foxp3+ Treg cells gated on the live CD4+ population in SI LP of Foxp3CreIl27fl/fl mice and WT littermates (age ~8–12 weeks). Each symbol represents an individual mouse (n = 10 for Foxp3CreIl27+/+ and 8 for Foxp3CreIl27fll/fl). b,c, FACS analysis (b) and percentage of suppression of proliferation (c) of WT Tconv cells by SI LP Treg cells isolated from either WT or Foxp3CreIl27fl/fl mice in an in vitro suppression assay. Data represent three independent experiments (n = 2). d–g, FACS analysis and frequencies of Ki67+ (d), CD44hiCD62Llo (e), IL-17+ (f) and IFN-γ+ Tconv (g) cells gated on the live CD4+Foxp3− population in SI LP of Foxp3CreIl27fl/fl mice and WT littermates (age ~8–12 weeks). Each symbol represents an individual mouse (n = 10 for Foxp3CreIl27+/+ and 8 for Foxp3CreIl27fll/fl). h,i, FACS analysis and frequencies of IL-17+ (h) and IFN-γ+Ly5.1+ (i) Teff cells (isolated from Ly5.1+Foxp3KO mice) gated on the live CD4+ population in SI LP of RAG-deficient mice 3 weeks after being co-transferred with Treg cells isolated from either Foxp3CreIl27fl/fl mice or WT littermates. Each symbol represents an individual mouse (n = 10 for Foxp3CreIl27+/+ and 12 for Foxp3CreIl27fll/fl). Data are presented as mean values ± s.d. In a, NS (not significant) = 0.8805 (left) and 0.7346 (right). In d, NS = 0.6613. In e, NS = 0.6285. In f, *P = 0.0196. In g, NS = 0.7544. In h, *P = 0.0391. In I, NS = 0.5283. Statistical significance was determined using a two-tailed, unpaired Student’s t-test.
Previously, IL-27 was shown to directly act on T cells to suppress TH17 cell differentiation in a STAT1-dependent manner15. Consistently, we were also able to confirm a direct inhibitory effect of IL-27 on TH17 cells whereas interferon (IFN)-γ expression by TH1 cells was not impacted (Extended Data Fig. 4a,b). Moreover, it is also unlikely that Treg cell-derived IL-27 controls TH17 cell differentiation through impacting dendritic cell (DC) function because comparable expressions of cytokines known to drive TH17 cell differentiation were found in DCs from the gut of mice with or without Treg cell-specific IL-27 ablation (Extended Data Fig. 4c–h). Finally, mice with T cell-specific IL-27 receptor deletion (CD4CreIl27rafl/fl) exhibited elevated TH17 cell responses similar to those observed in Foxp3CreIl27fl/fl mice (Extended Data Fig. 5). Together, these results strongly suggest that Treg cell-derived IL-27 regulates TH17 cell immunity primarily through directly targeting T cells.
It should also be noted, however, that DCs and other myeloid cells, as well as intestinal epithelial cells (IECs), have all been recently shown to regulate intestinal homeostasis through the production of IL-27 (ref. 20). To exclude the possibility that IL-27 secreted by different gut-resident cells could also contribute to the regulation of intestinal TH17 cell immunity, mice with DC- (CD11cCreIl27fl/fl), myeloid cell-(LysMCreIl27fl/fl) and IEC (Vil1CreIl27fl/fl)-specific deletion of IL-27p28 were examined. As shown in Extended Data Fig. 5b–e, unlike Foxp3CreIl27fl/fl and CD4CreIl27rafl/fl mice, we did not observe any alteration in TH17 cell frequencies in the aforementioned mouse lines compared with their corresponding littermate controls. Finally, to further confirm that the observed TH17 cell phenotype in Foxp3CreIl27fl/fl mice is indeed due to the specific loss of Treg cell-derived IL-27, we performed the adoptive transfer study in which IL-27-deficient Treg cells were co-transferred with congenically marked Foxp3−CD4+ T cells from Foxp3KO mice into RAG-deficient mice. Consistent with what we found in Foxp3CreIl27fl/fl mice, IL-27-deficient Treg cells also selectively failed to restrain TH17 cells in the gut under this setting (Fig. 3h,i and Extended Data Fig. 3f), further supporting a nonredundant role of Treg cell-derived IL-27 in fine-tuning intestinal TH17 cell responses.
Loss of Treg cell-derived IL-27 led to exacerbated gut diseases
As Il27 is specifically upregulated in gut Treg cells under inflammation, we hypothesized that deletion of IL-27 in Treg cells would lead to an even stronger IL-17 response and cause more severe intestinal immunopathology in disease settings. To this end, we employed the aforementioned anti-CD3 monoclonal antibody-driven intestinal disease model in which proinflammatory TH17 cells are predominantly responsible for the development of intestinal pathology21. Consistent with the aforementioned results from qPCR analysis, we could also detect significantly increased IL-27, but not IL-35, protein secretion by gut Treg cells from anti-CD3 monoclonal antibody-treated mice and the production of IL-27 was completely abolished in Foxp3CreIl27fl/fl mice (Extended Data Fig. 6a,b). Moreover, as shown in Fig. 4a–c, we found that Foxp3CreIl27fl/fl mice exhibited more pronounced weight loss along with more severe gut pathology compared with wild-type (WT) controls. The exacerbated disease phenotype was not due to insufficient Treg cell numbers because Treg cells from both Foxp3CreIl27fl/fl mice and control littermates expanded to a similar degree in the attempt to control gut inflammation (Fig. 4d). Nevertheless, consistent with what we observed during homeostasis, only markedly increased IL-17 but not IFN-γ responses were detected in Foxp3CreIl27fl/fl mice (Fig. 4e,f). Similar results were also obtained from mice harboring T cells unresponsive to IL-27 whereas comparable TH17 cell responses were observed across mice with DC-, myeloid cell- and IEC-specific deletion of IL-27 and their corresponding WT controls on anti-CD3 monoclonal antibody administration (Extended Data Fig. 5f–j).
Fig. 4 |. Loss of Treg cell-derived IL-27 led to exacerbated intestinal inflammation and colitis-associated cancer.
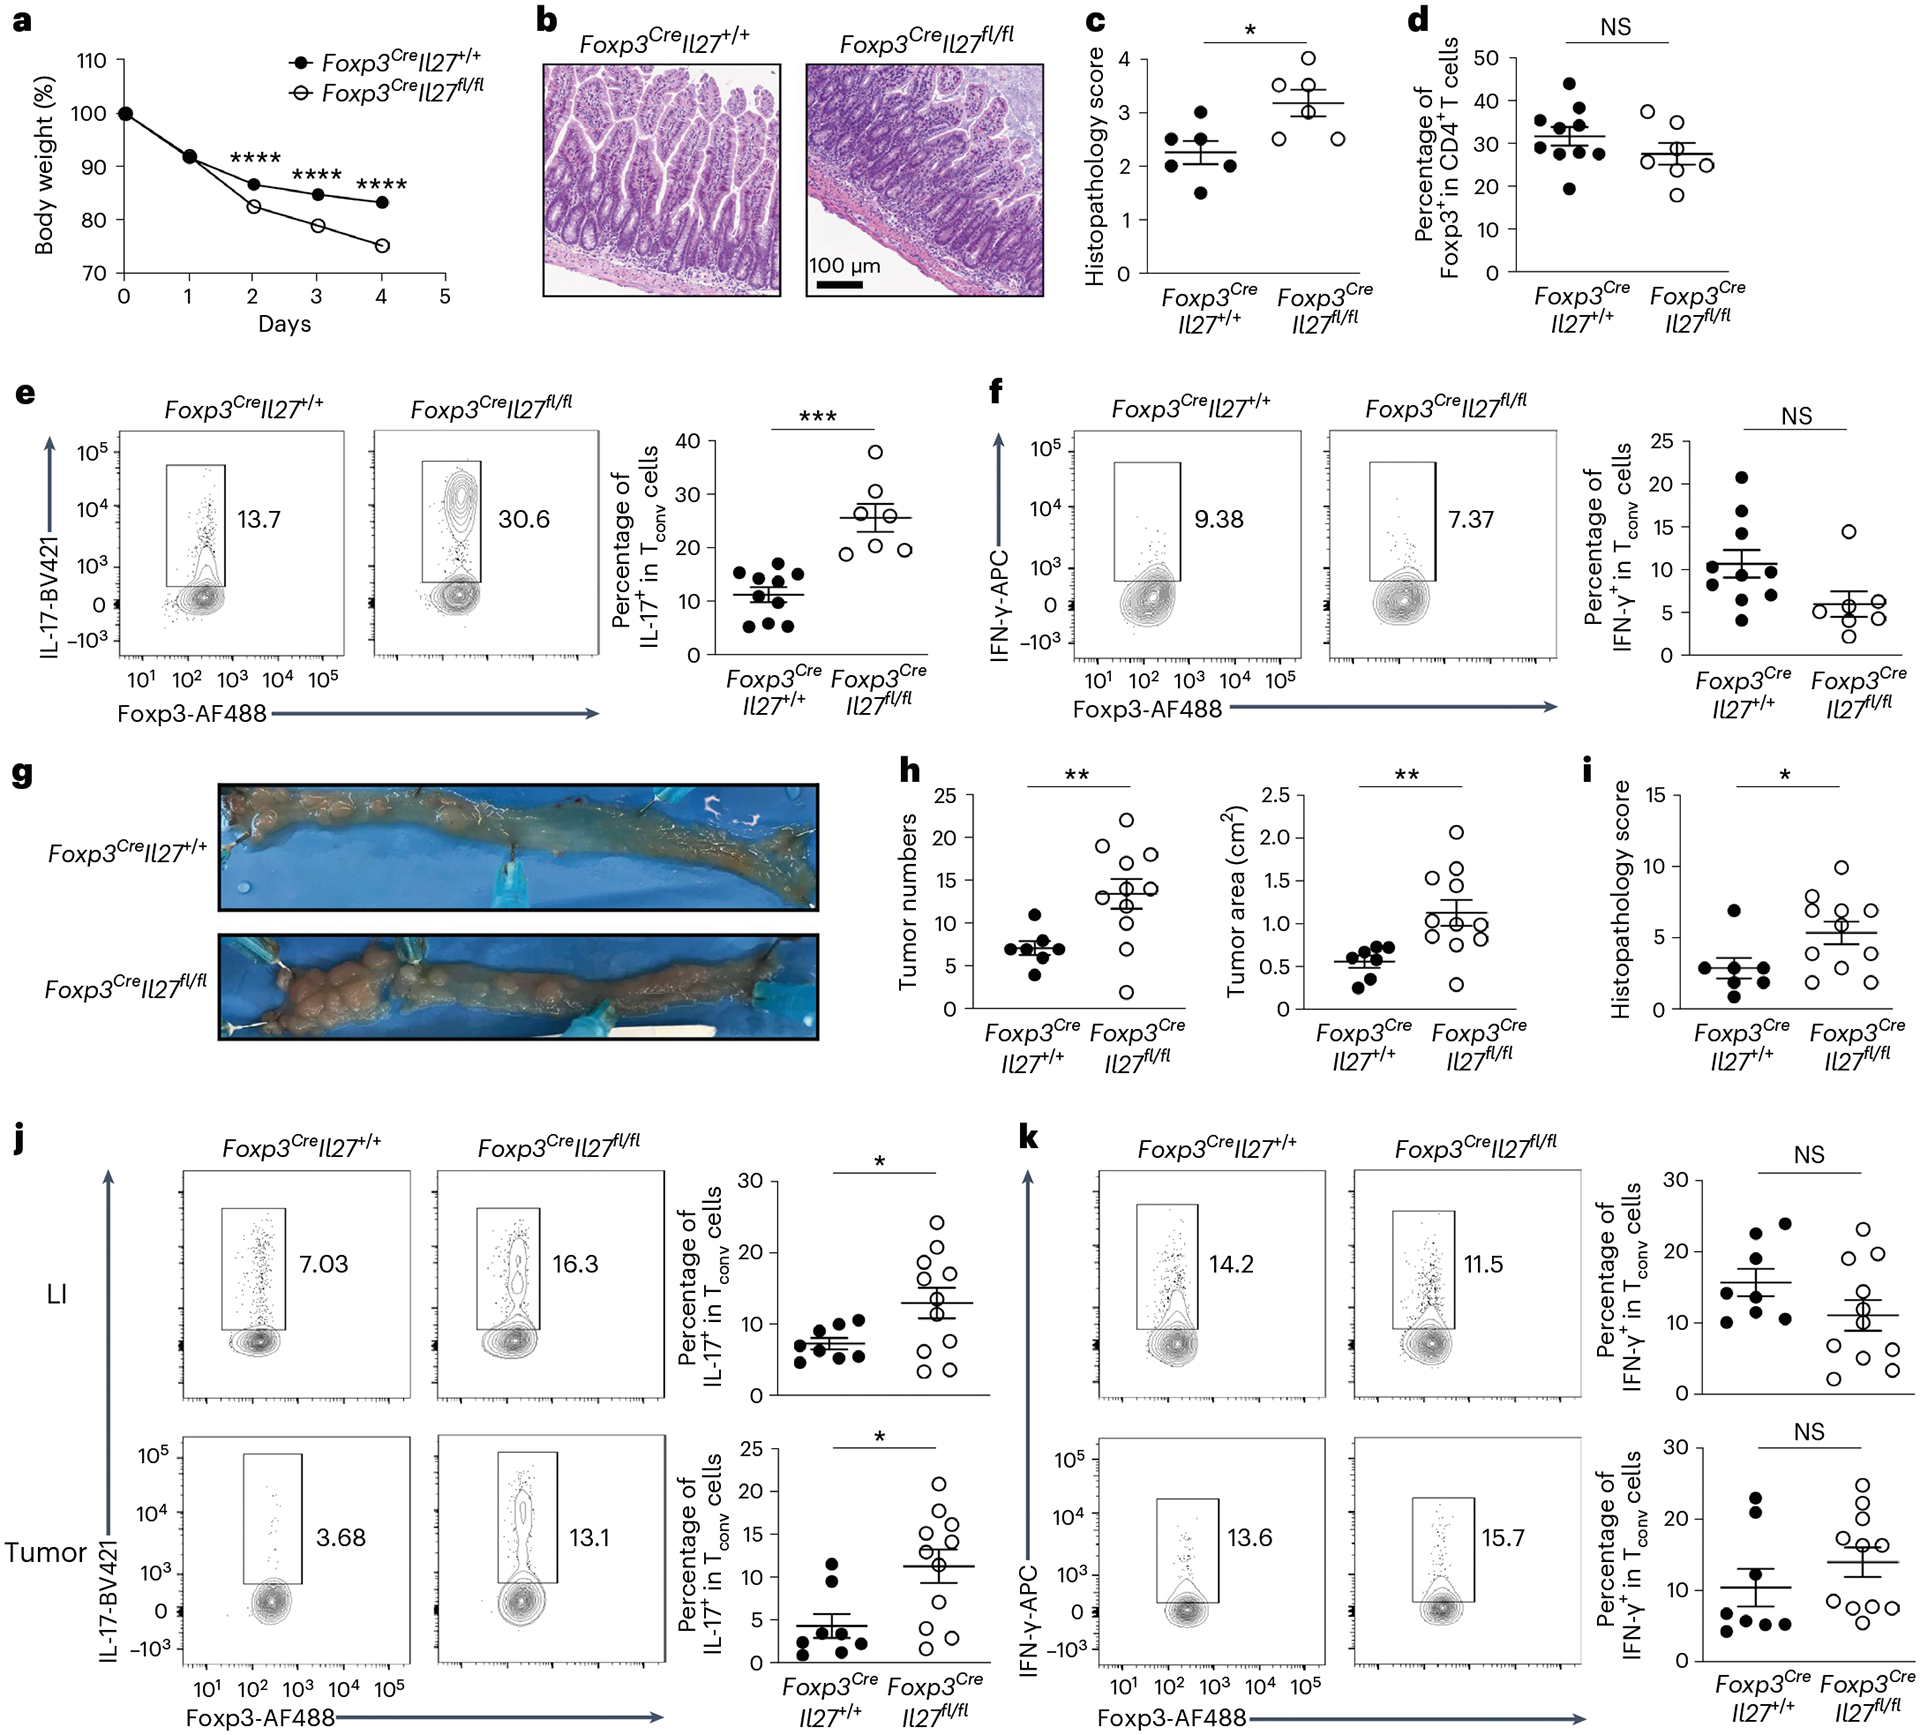
a, Percentage of body weight change of Foxp3CreIl27fl/fl mice and WT littermates after aCD3 monoclonal antibody administration. Each symbol represents the average of mice from four independent experiments (n = 16 for Foxp3CreIl27+/+ and 18 for Foxp3CreIl27fll/fl). b, Four days after initial aCD3 monoclonal antibody injection, small intestine sections from the mice were stained with H&E for microscopic imaging. Scale bar, 100 μm. Data represent four independent experiments. c, Semiquantitative scoring of histopathology. Each symbol represents an individual mouse (n = 6). d–f, FACS analysis and frequencies of Foxp3+ Treg cells (d), IL-17+ Tconv cells (e) and IFN-γ+ Tconv cells (f) gated on the live CD4+Foxp3− population in SI LP of aCD3 monoclonal antibody-treated Foxp3CreIl27fl/fl mice and WT littermates. Each symbol represents an individual mouse (n = 10 for Foxp3CreIl27+/+ and 7 for Foxp3CreIl27fll/fl). g, Representative colonic photos from Foxp3CreIl27fl/fl mice and WT littermates 12 weeks after AOM/DSS treatment. Data represent three independent experiments. h, Numbers and area of colorectal tumors in Foxp3CreIl27fl/fl mice and WT littermates. i, Semiquantitative scoring of histopathology. Each symbol represents an individual mouse (n = 7 for Foxp3CreIl27+/+ and 11 for Foxp3CreIl27fll/fl). j,k, FACS analysis and frequencies of IL-17+ (j) and IFN-γ+ (k) Tconv cells gated on the live CD4+Foxp3− population in LI LP or colorectal tumors of Foxp3CreIl27fl/fl mice and WT littermates 12 weeks after AOM/DSS treatment. Each symbol represents an individual mouse (n = 8 for Foxp3CreIl27+/+ and 11 for Foxp3CreIl27fll/fl). Data are presented as mean values ± s.d. In a, ****P < 0.0001. In c, *P = 0.0187. In d, NS = 0.2424. In e, ***P = 0.0008. In f, NS = 0.05. In h, **P = 0.0051 (left) and 0.004 (right). In i, *P = 0.0363. In j, *P = 0.0278 (up) and 0.0101 (bottom). In k, NS = 0.1307 (up) and 0.3073 (bottom). Statistical significance was determined using a two-tailed, unpaired Student’s t-test.
Previously, elevated TH17 cell responses were also shown to promote tumorigenesis in an azoxymethane (AOM)/dextran sulfate sodium (DSS) model of carcinogen-induced colitis-associated cancer (CAC)22. It is interesting that, during CAC tumorigenesis, it has been suggested that Treg cells could exhibit either anti- or protumor function depending on the timing during tumor development23. To this end, transient deletion of Treg cells during the early phase of CAC was shown to exacerbate intestinal inflammation that could promote tumorigenesis. It is thus plausible that loss of Treg cell-derived, IL-27-mediated regulation of gut TH17 cell responses could create a microenvironment favorable for tumor growth. Indeed, increased colon tumor burdens accompanied by significantly higher scores for inflammation ulceration and crypt distortion by histopathological analysis were observed in Foxp3CreIl27fl/fl mice after the AOM and DSS treatment (Fig. 4g–i). Finally, selective increases in the frequencies of TH17 cells but not IFN-γ-producing TH1 cells could be found in both large intestine (LI) and tumors in mice harboring Treg cells incapable of producing IL-27 (Fig. 4j,k). Together, by using both acute and chronic TH17 cell-driven intestinal inflammatory disease models, our results demonstrate a critical role of Treg cell-derived IL-27 in limiting gut pathology.
Treg cell-derived IL-27 is dispensable to control EAE
Although Treg cell-derived IL-27 does not seem to play a noticeable role in tissues other than gut at steady state, it remains probable that IL-27 produced by Treg cells might still be required to control TH17 cell responses outside of the intestinal tissues when TH17 cell-driven inflammatory responses are triggered. To test this possibility, a central nervous system (CNS) autoimmune disorder, experimental autoimmune encephalomyelitis (EAE), in which autoreactive TH17 cells serve as central mediators in promoting disease pathogenesis, was employed24. Previously, IL-27 has been reported to limit neuroinflammation during EAE through directly suppressing the development of TH17 cells14. Consistently, mice with T cells incapable of responding to IL-27 harbored elevated frequencies of IL-17+ but not IFN-γ+ Teff cells in the CNS and exhibited a significant worsening of EAE (Fig. 5a–c). In contrast, no alteration in the frequencies of TH17 cells could be found in Foxp3CreIl27fl/fl mice on EAE induction (Fig. 5d,e). Consequently, both Foxp3CreIl27fl/fl mice and control littermates exhibited similar disease phenotypes (Fig. 5f). Altogether, although we confirmed a T cell-intrinsic role of IL-27 signaling in restricting TH17 cell responses in the CNS, unlike what was observed in the intestine, Treg cell-derived IL-27 is dispensable for controlling TH17 cell-driven neuroinflammation.
Fig. 5 |. Treg cell-derived IL-27 is dispensable for controlling TH17 cell-driven EAE.
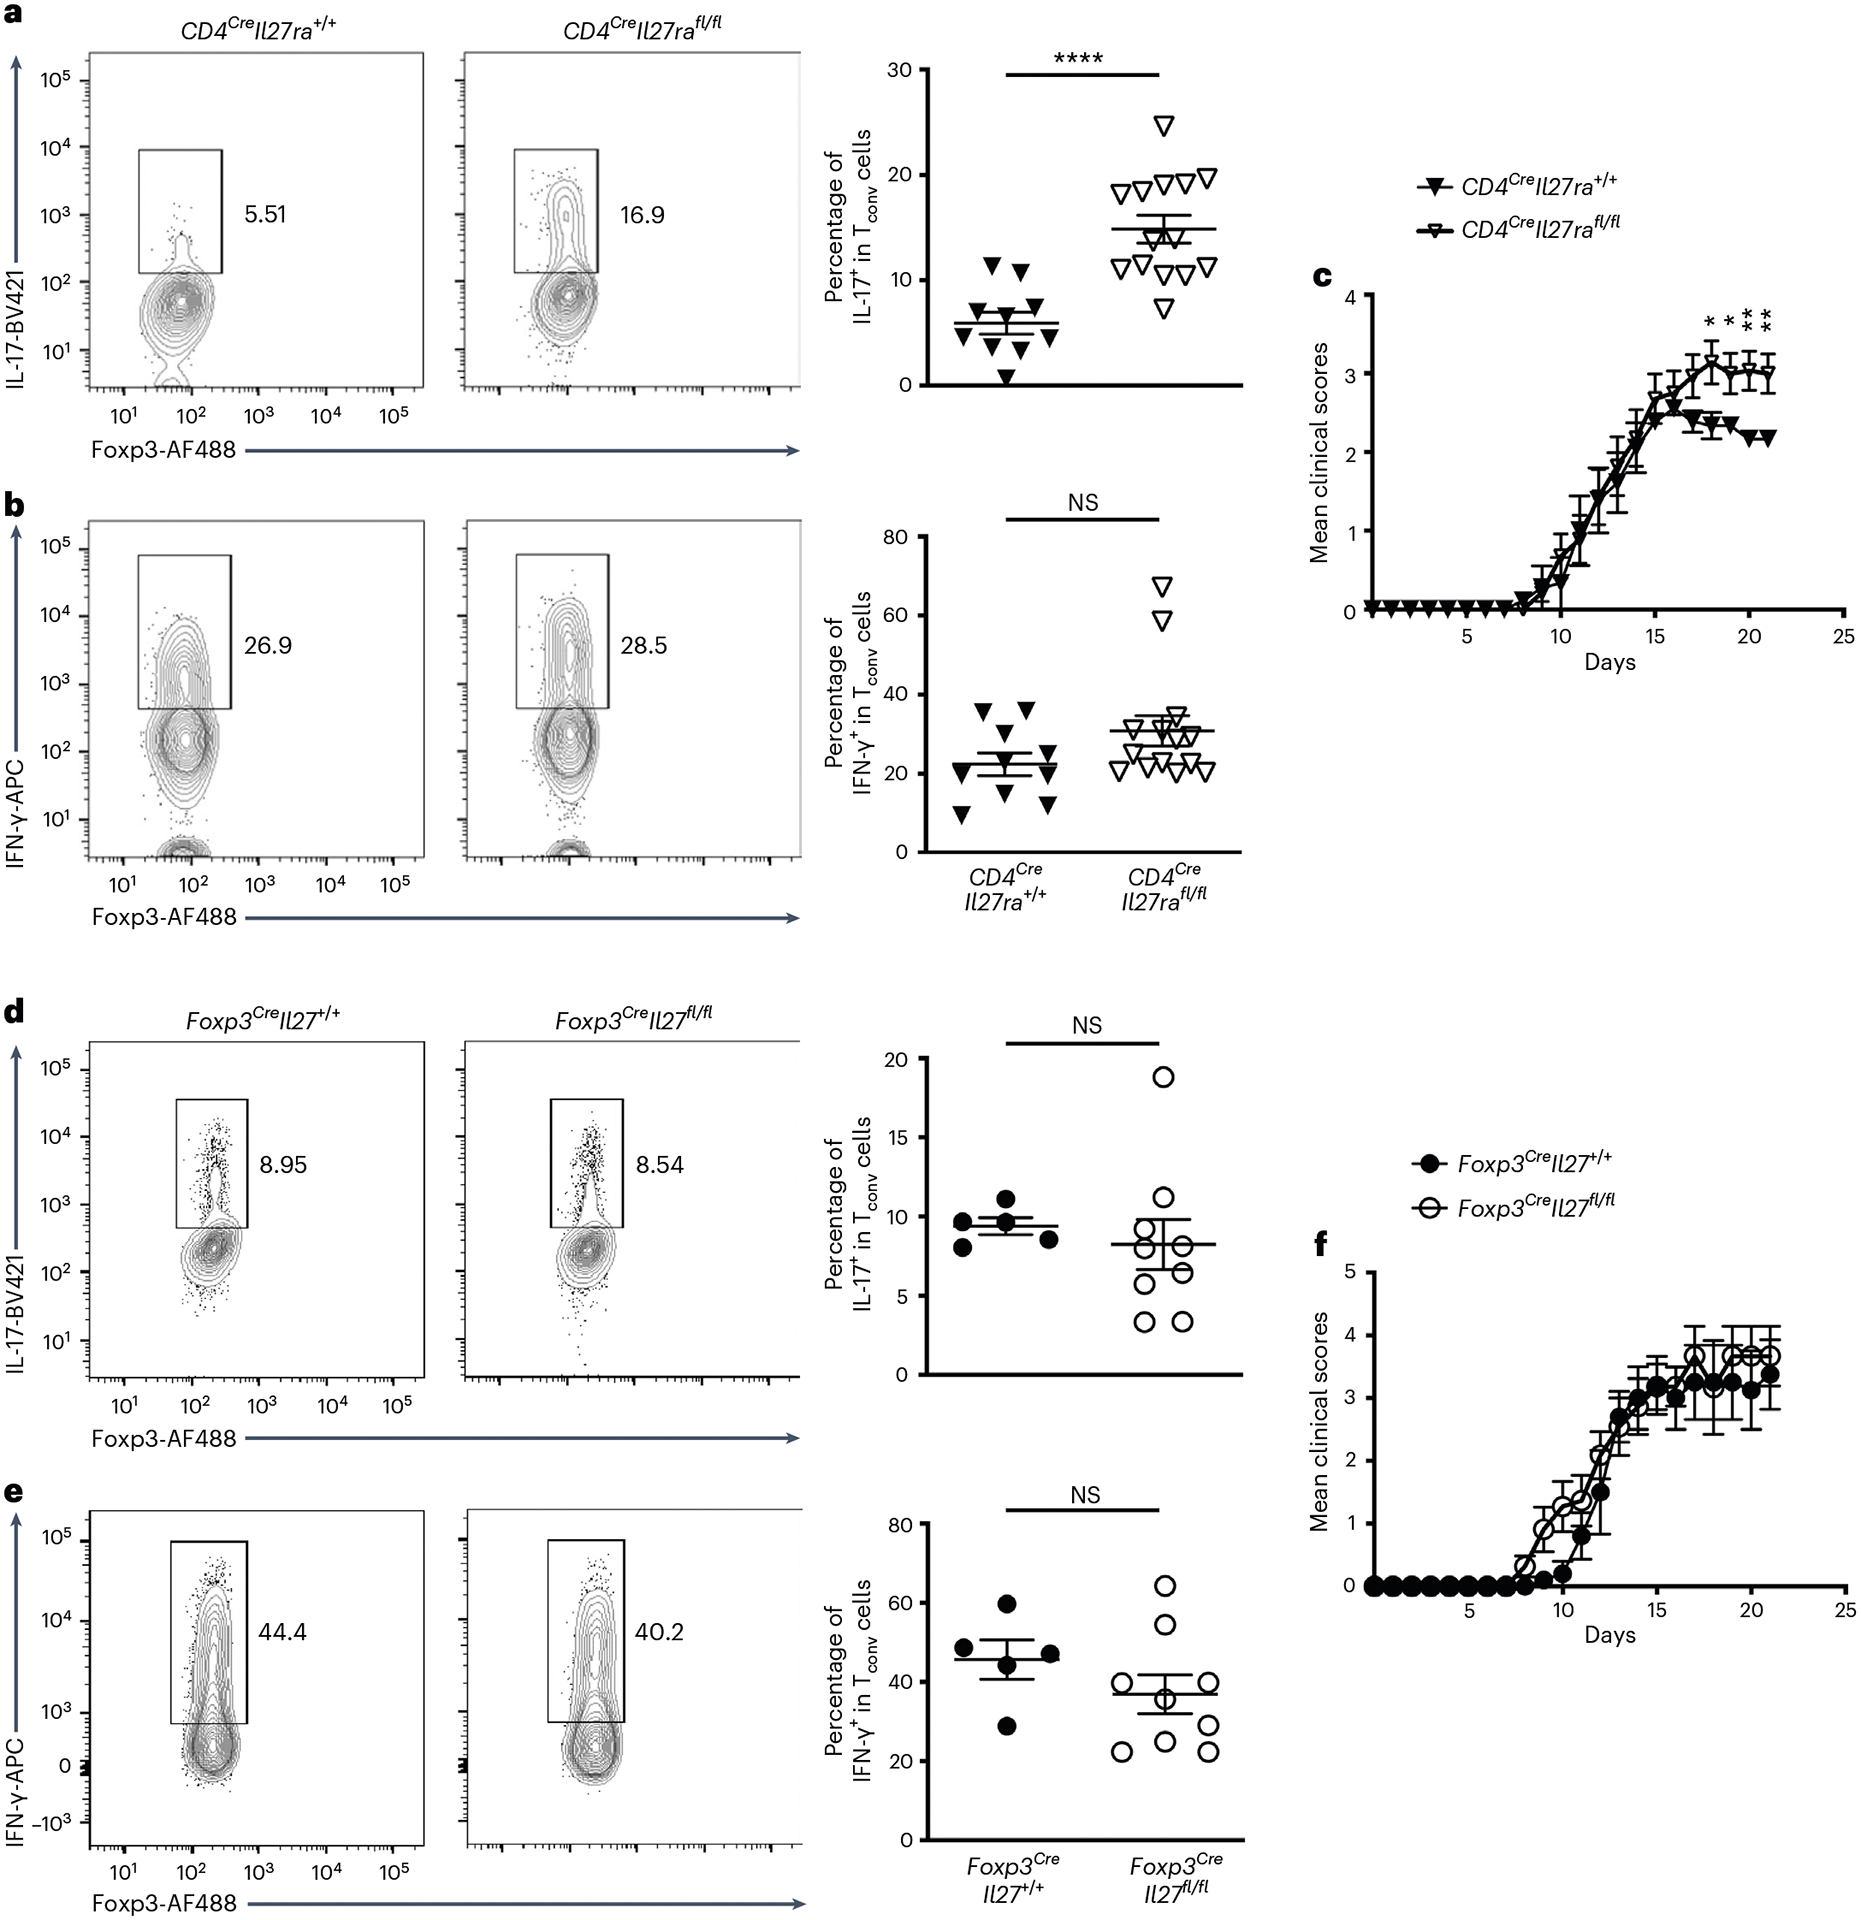
a,b, FACS analysis and frequencies of IL-17+ (a) and IFN-γ+ (b) Tconv cells gated on the live CD4+Foxp3− population in the brain of CD4CreIl27rafl/fl mice and WT littermates 21 d after EAE induction. Each symbol represents an individual mouse (n = 10 for CD4CreIl27ra+/+ and 14 for CD4CreIl27rafll/fl). c, The disease severity scored regularly based on clinical symptoms. Each symbol represents the average of mice from three independent experiments (n = 9 for CD4CreIl27ra+/+ and 14 for CD4CreIl27rafll/fl). d,e, FACS analysis and frequencies of IL-17+ (d) and IFN-γ+ (e) Tconv cells gated on the live CD4+Foxp3− population in the brain of Foxp3CreIl27fl/fl mice and WT littermates 21 d after EAE induction. Each symbol represents an individual mouse (n = 5 for Foxp3CreIl27+/+ and 9 for Foxp3CreIl27fll/fl). f, The disease severity scored regularly based on clinical symptoms. Each symbol represents the average of mice from two independent experiments (n = 5 for Foxp3CreIl27+/+ and 11 for Foxp3CreIl27fll/fl). Data are presented as mean values ± s.d. In a, ****P < 0.0001. In b, NS = 0.0944. In c, *P = 0.0203 (day 18), 0.0220 (day 19), 0.0044 (day 20) and 0.0077 (day 21). In d, NS = 0.5026. In e, NS = 0.2346. Statistical significance was determined using a two-tailed, unpaired Student’s t-test.
Foxp3CreIl27fl/fl mice exhibited enhanced TH17 cell immunity
Although uncontrolled TH17 cell responses have been frequently associated with intestinal immunopathology, they are also crucial for providing protection against many different pathogens at the mucosal surface25. Previously, it was shown that Citrobacter rodentium, a mouse pathogen that preferentially impacts the colon, can induce a strong local TH17 cell response that is necessary for protection26. Similar to the aforementioned autoimmune-driven inflammation models, we could also detect a substantial amount of IL-27 but not IL-35 secreted by Treg cells from the colon of C. rodentium-infected mice, whereas only minimal IL-27 production by Treg cells from the spleen could be observed (Extended Data Fig. 6c,d). It should be noted that, in agreement with a previous report27, during infection Tconv cells were also capable of producing IL-27 (Extended Data Fig. 6c,d). Nevertheless, the amount of IL-27 secreted by gut Treg cells was still much higher compared with that by Tconv cells (Extended Data Fig. 6d).
Next, we sought to determine the effect of Treg cell-specific IL-27 ablation on host defense against this enteric pathogen. As shown in Fig. 6a,b, we also found that C. rodentium-infected Foxp3CreIl27fl/fl mice harbored elevated frequencies of IL-17+ but not IFN-γ+ Teff cells in the colon. Consequently, significantly reduced bacterial burden in Foxp3CreIl27fl/fl mice over littermate controls was observed (Fig. 6c), supporting our hypothesis that Treg cell-derived IL-27 regulates intestinal TH17 cell immunity. Nevertheless, it remains uncertain whether IL-27 produced by Treg cells would have a similar impact on the host defense against other enteric pathogens when a different type of immune response is triggered. To address this issue, we employed a Toxoplasma gondii infection model in which a strong IFN-γ-mediated TH1 cell response is induced in the gut necessary for the clearance of this pathogen28. To this end, although increased frequencies of TH17 cells could still be observed in Foxp3CreIl27fl/fl mice during T. gondii infection, comparable TH1 cell responses were elicited (Fig. 6d,e). Moreover, both Foxp3CreIl27fl/fl mice and control littermates were able to control this parasitic pathogen efficiently (Fig. 6f). Collectively, our results from two different enteric pathogen models further demonstrate a selective regulatory effect of Treg cell-derived IL-27 on TH17 cell, but not TH1 cell, immunity, during intestinal infection.
Fig. 6 |. Enhanced IL-17 responses in mice with Treg cell-specific IL-27 ablation selectively helped protect against enteric bacterial infection.
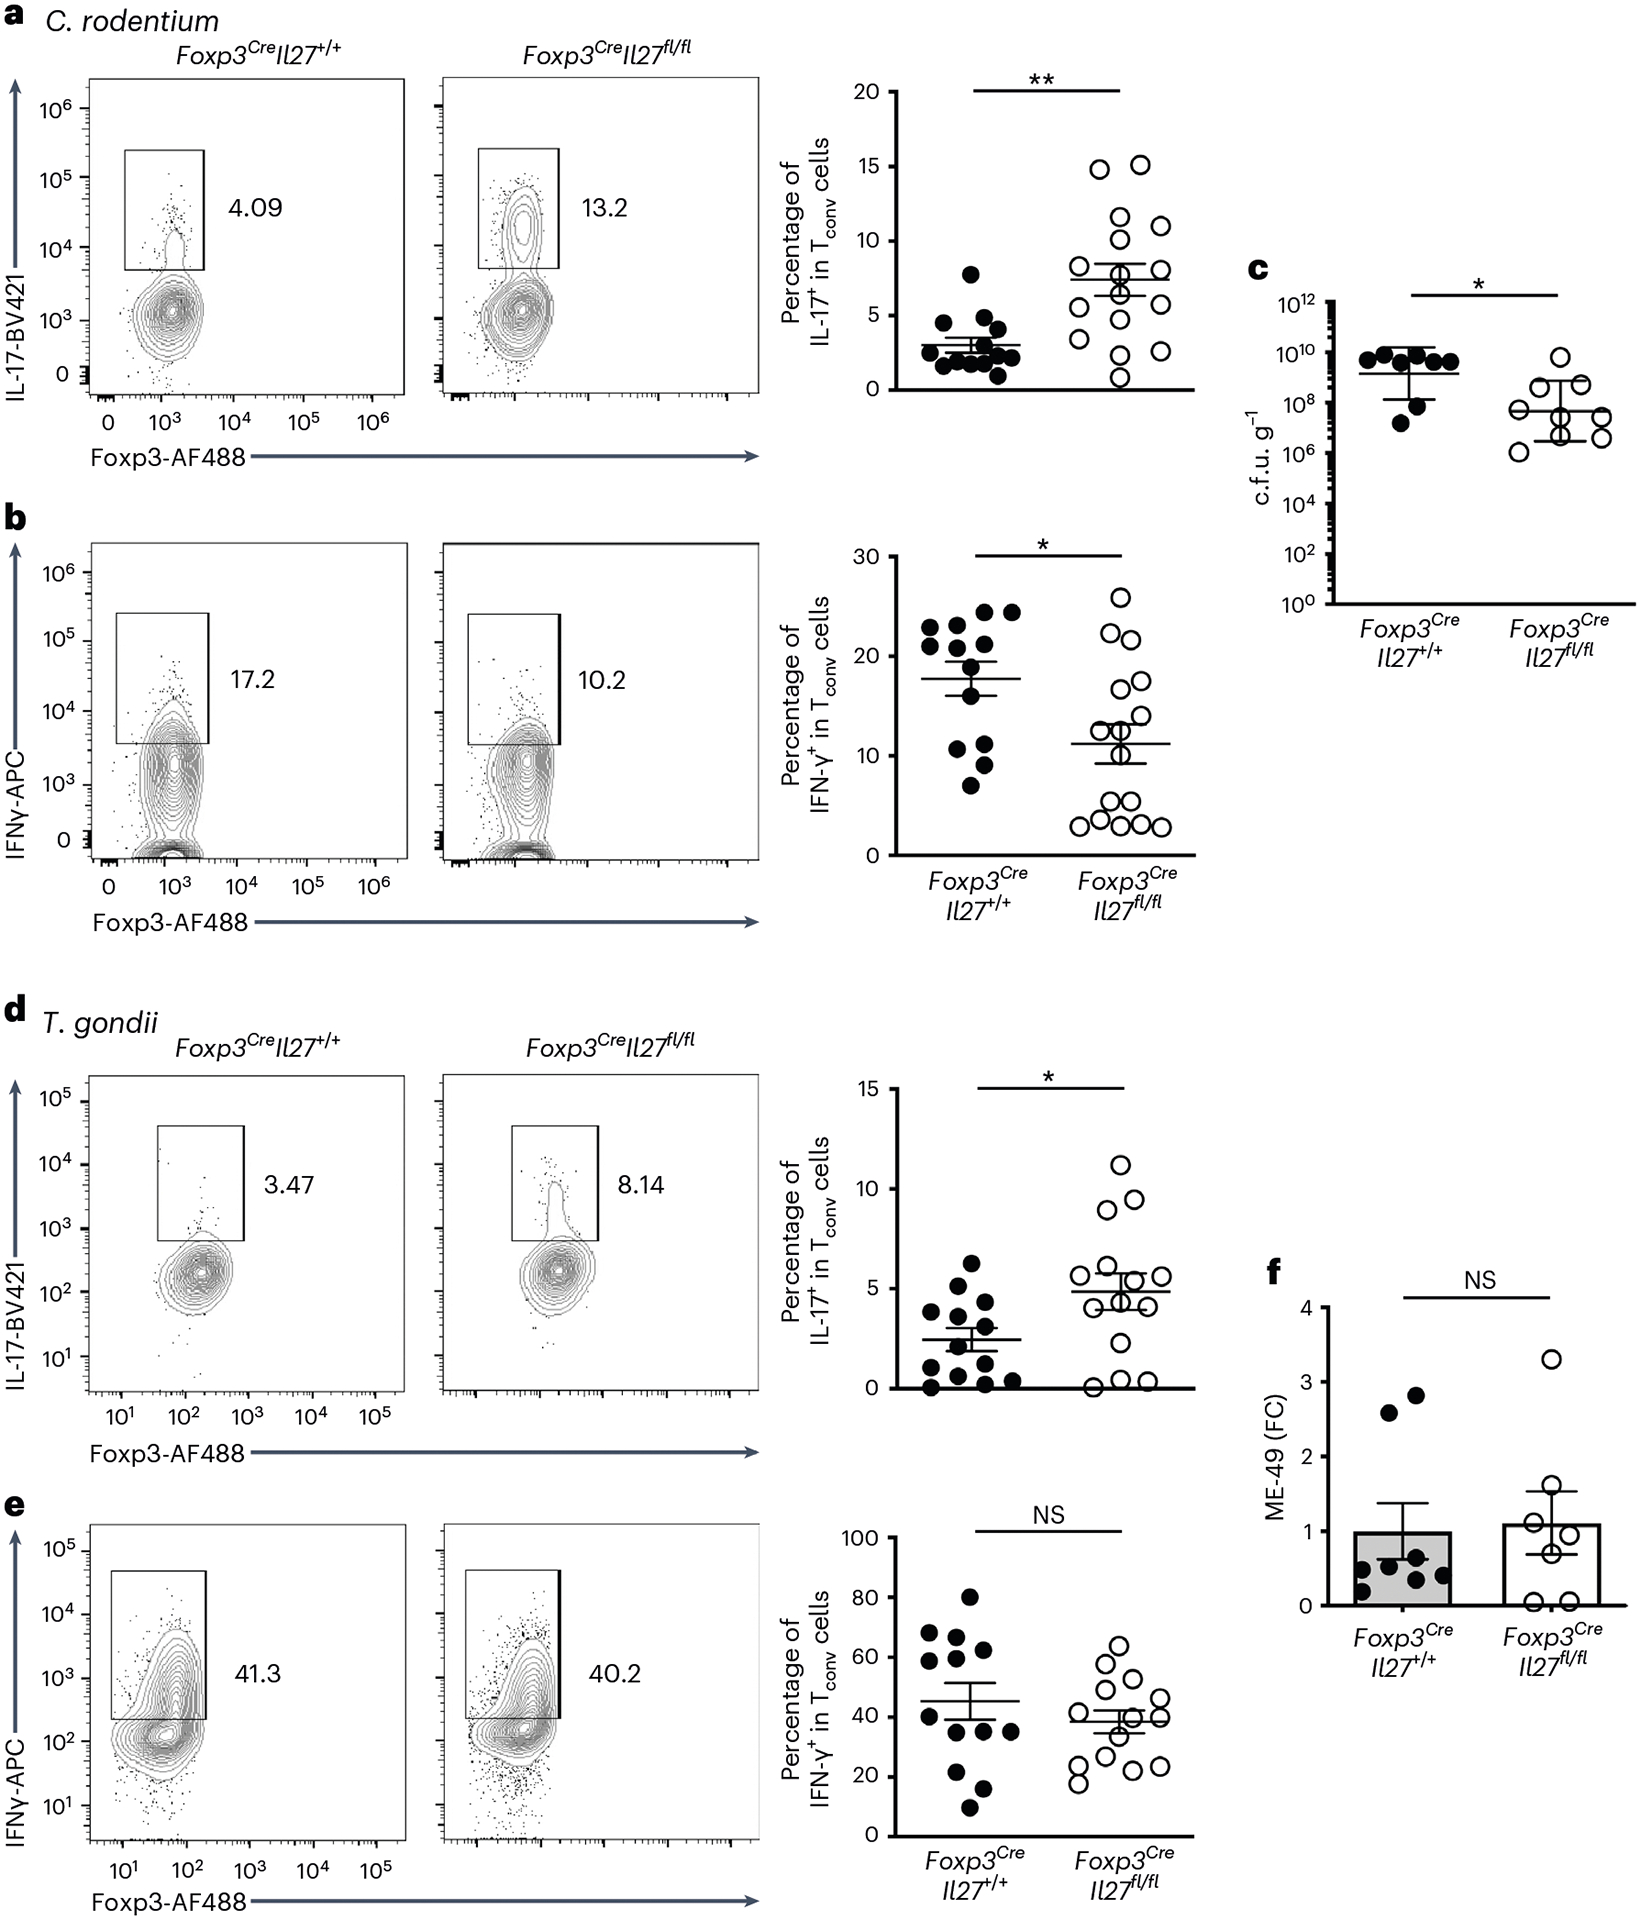
a,b, FACS analysis and frequencies of IL-17+ (a) and IFN-γ+ (b) Tconv cells gated on the live CD4+Foxp3− population in LI LP of Foxp3CreIl27fl/fl mice and WT littermates at day 10 post-C. rodentium infection. Each symbol represents an individual mouse (n = 13 for Foxp3CreIl27+/+ and 16 for Foxp3CreIl27fll/fl). c, Enumeration of C. rodentium in the LI of Foxp3CreIl27fl/fl mice and WT littermates at day 10 post-C. rodentium infection. Each symbol represents an individual mouse (n = 8 for Foxp3CreIl27+/+ and 9 for Foxp3CreIl27fll/fl). d,e, FACS analysis and frequencies of IL-17+ (d) and IFN-γ+ (e) Tconv cells gated on the live CD4+Foxp3− population in SI LP of Foxp3CreIl27fl/fl mice and WT littermates at day 8 post-T. gondii infection. Each symbol represents an individual mouse (n = 13 for Foxp3CreIl27+/+ and 14 for Foxp3CreIl27fll/fl). f, The qPCR analysis of parasite burden in SI of Foxp3CreIl27fl/fl mice and WT littermates at day 8 post-T. gondii infection. Each symbol represents an individual mouse (n = 8 for Foxp3CreIl27+/+ and 7 for Foxp3CreIl27fll/fl). Data are presented as mean values ± s.d. In a, **P = 0.0013. In b, *P = 0.0187. In c, *P = 0.0221. In d, *P = 0.0368. In e, NS = 0.3574. In f, NS = 0.8449. Statistical significance was determined using a two-tailed, unpaired Student’s t-test.
IL-27 produced by a distinct gut Treg cell subset
As several intestinal Treg cell populations have been reported to maintain gut homeostasis and intestinal tolerance29, it remains unclear whether IL-27 can be induced in the entire intestinal Treg cell population or there is a specific Treg cell subset primarily responsible for IL-27 production. To address this question, we performed single-cell RNA-seq (scRNA-seq) analysis of gut Treg cells from mice with or without C. rodentium infection. By using dimensional reduction by uniform manifold approximation and projection (UMAP) for visualization of gut Treg cells, we observed four distinct Treg cell clusters (R0–R3) (Fig. 7a). Treg cells from the R0 cluster exhibit high expression of Tcf7 but not Sell, resembling the previously reported activated Treg cells (Fig. 7b)30. On the other hand, the R1 cluster exhibits high expression of genes resembling effector Treg cells (for example, Il10 and Gzmb), whereas the R2 cluster expresses transcripts (for example, Sell and Bach2) indicative of resting Treg cells (Fig. 7b and Extended Data Fig. 7a,b)31,32. Finally, the R3 cluster is enriched with Il1rl1 (that is, St2)-expressing cells (Fig. 7b and Extended Data Fig. 7c). It is interesting that, although the distribution of these four clusters was rather comparable between controls and C. rodentium-infected mice (Fig. 7c), Il27 transcripts could be detected only in the R0 cluster from the infected group (Fig. 7d). Unfortunately, owing to the inherent lack of sensitivity of scRNA-seq for low-abundance transcripts such as cytokines33, only a few Il27 transcript signals were detected. Nevertheless, we do not think that this is merely an experimental artifact because the signals of Ebi3, a gene that has been well recognized as being highly expressed in Treg cells, were also barely detectable (Fig. 7e). Unlike Il27, signals of Ebi3 could be found in both R0 and R1 clusters, suggesting that the R0 cluster is enriched with IL-27-expressing Treg cells whereas the R1 cluster probably contains Treg cells that could produce other cytokines consisting of EBI3.
Fig. 7 |. Single-cell analyses identify a putative IL-27-producing Treg cell subset in the inflammatory intestinal tissue.
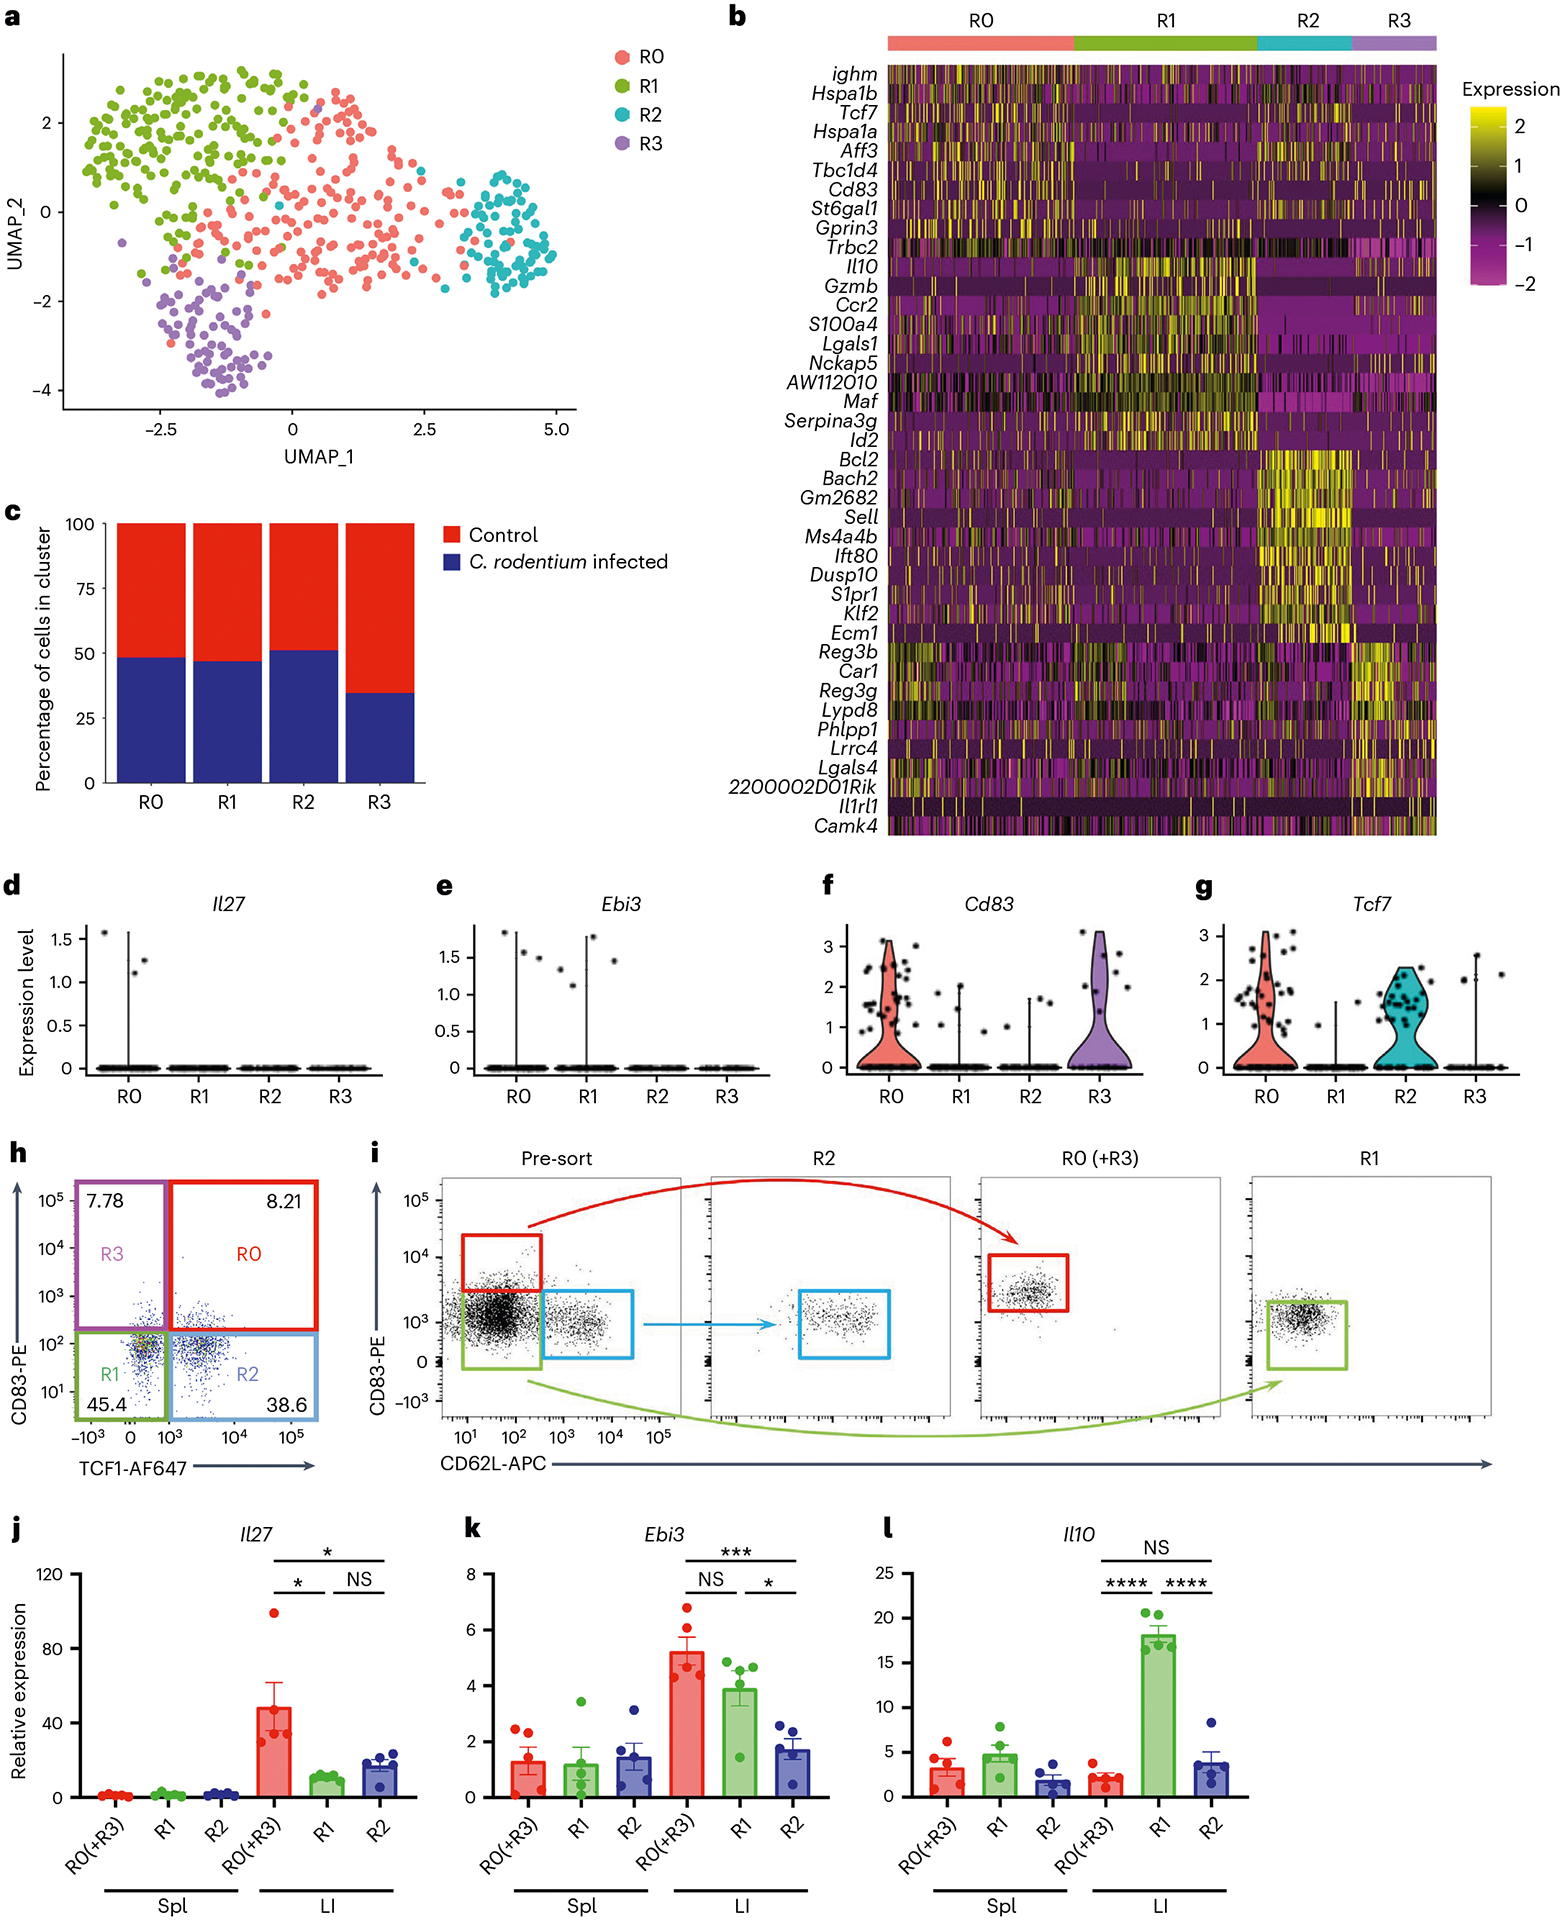
a, UMAP plots of intestinal Treg cell clusters, colored by cluster identity. b, Heatmap of the top ten DEGs between each intestinal Treg cell cluster. c, Percentage of cells within each intestinal Treg cell cluster from mice with or without C. rodentium infection. d–g, Violin plots of Il27 (d), Ebi3 (e), Cd83 (f) and Tcf7 (g) in different intestinal Treg cell clusters from C. rodentium-infected mice. h, FACS analysis of intestinal CD4+Foxp3+ Treg cell clusters based on the expression of CD83 and TCF1. i, Representative FACS profiles with gating strategy for isolating different intestinal Treg cell subsets based on the expression of CD83 and CD62L. j–l, The qPCR analyses for the expressions of Il27 (j), Ebi3 (k) and Il10 (l) in different Treg cell subsets in spleen (Spl) or LI LP from C. rodentium-infected mice. Each symbol represents a FACS-isolated cell sample pooled from three mice (n = 5). Data are presented as mean values ± s.d. In j, *P = 0.0441 (up) and 0.0186 (bottom left), and NS = 0.0806 (bottom right). In k, ***P = 0.0005 (up), NS = 0.1380 (bottom left) and *P = 0.0178 (bottom right). In l, NS = 0.2260 (up), and ****P < 0.0001 (bottom left) and < 0.0001 (bottom right). Statistical significance was determined using a two-tailed, unpaired Student’s t-test.
To further confirm our scRNA-seq results, we FACS analyzed intestinal Treg cell subsets from the infected mice based on the expressions of CD83 and transcription cell factor TCF1. CD83, a heavily glycosylated immunoglobulin-like, type 1 transmembrane protein, known to be a marker for activated Treg cell lineages34, was found to be one of the top ten highly expressed genes, along with Tcf7 (the gene encoding TCF1) in the R0 cluster (Fig. 7b). Moreover, in addition to the R0 cluster, Cd83 and Tcf7 could also be detected in the R3 and R2 clusters to a lesser degree, respectively (Fig. 7f,g). As such, we could divide intestinal Treg cells into four clusters identified by our scRNA-seq analysis: R0: CD83+TCF1+; R1: CD83−TCF1−; R2: CD83−TCF1+; and R3: CD83+TCF1− (Fig. 7h). Next, we used CD62L (encoded by Sell) as a surrogate for TCF1 because it is also highly expressed in the R2 cluster (Fig. 7b and Extended Data Fig. 7b). Although we could not easily separate the R0 and R3 clusters, as both clusters are enriched with Cd83− but not Sell-expressing cells, three populations of Treg cells: R0 + R3 (CD83+CD62Llo; red), R1 (CD83−CD62Llo; green) and R2 (CD83−CD62Lhi; blue) clusters were FACS isolated and subjected to qPCR (Fig. 7i). As shown in Fig. 7j,k, the R0 (and R3) cluster-enriched Treg cells expressed high levels of Il27 and Ebi3 whereas the R1 cluster-enriched Treg cells expressed only Ebi3. On the other hand, only the R1 cluster-enriched Treg cells expressed high levels of Il10, whereas none of these three genes was found to be highly expressed in the R2 cluster-enriched Treg cells, consistent with the aforementioned effector and resting Treg cell features in the R1 and R2 clusters, respectively (Fig. 7l). It should be noted that, even though CD83+CD62Llo Treg cells could also be found in the spleen, expression of Il27 could not be detected, further supporting our previous findings of selective Il27 induction in gut Treg cells. Finally, unlike Cd83, it seems that the previously identified intestinal Treg cell genes such as Rorc and Gata3 could not be used to specifically mark these IL-27-expressing Treg cells (Extended Data Fig. 7d). Together, our studies identify a new CD83+CD62Llo Treg cell subset, which is distinct from other Treg cell populations previously reported in the intestine, responsible for IL-27 production, and that IL-27-expressing Treg cells are pivotal in controlling intestinal TH17 cell immunity, particularly under inflammatory conditions.
Discussion
As opposed to the original concept that Treg cells provide a generic level of immune regulation, it is now well appreciated that there is a high level of heterogeneity in Treg cell populations to effectively control a wide range of immune responses in different tissue microenvironments. Our studies have clearly demonstrated that, under different inflammatory conditions, IL-27 can be specifically induced in gut Treg cells, raising an important question as to what makes the intestinal microenvironment unique for IL-27 expression in Treg cells. It has been previously documented that the production of IL-27 by macrophages can be induced in a toll-like receptor (TLR)/MyD88-dependent manner35. Even though the expression of IL-27 has never been reported in Treg cells, MyD88-dependent sensing of gut microbiome by Treg cells has been shown to be critical in establishing intestinal tolerance and that Treg cells devoid of MyD88 exhibited a selective defect in controlling IL-17 responses in the gut mucosa36. Owing to a strong resemblance between the findings in mice with Treg cell-specific deletion of IL-27 and MyD88, it is intriguing to speculate that loss of IL-27 induction in MyD88-deficient Treg cells could be the underlying mechanism responsible for the dysregulated intestinal TH17 cell responses. Furthermore, dysbiotic gut microbiota, particularly under inflammatory conditions, also probably serve as important environmental factors to drive the expression of IL-27 in gut Treg cells, a notion that is directly supported by our analysis of GF animals on anti-CD3 monoclonal antibody treatment. Nevertheless, future studies employing whole-genomic sequencing and gnotobiotic approaches are required to identify specific microbes that functionally contribute to the induction of IL-27 in intestinal Treg cells.
Loss of IL-27 signaling has also been previously shown to lead to enhanced IFN-γ responses37. Therefore, it seems puzzling why we did not see an effect on IFN-γ responses when IL-27 production was ablated in Treg cells. Moreover, our study suggests that only IL-27 derived from Treg cells, but not from other known IL-27-producing cell populations, is responsible for regulating TH17 cell responses in the intestine. These results were also surprising because the IL-27-expressing Treg cells do not seem to be the major Treg cell subset in the intestine, as suggested by our scRNA-seq study, and the amount of IL-27 secreted by Treg cells is also not likely to be higher than that made by other IL-27 producers in the gut. However, these findings were not completely unexpected. First, although IL-27 is capable of limiting both TH1 and TH17 cell responses in vivo10, it does not seem to repress but might rather promote TH1 cell differentiation through the activation of STAT1 and the induction of T-bet (T-box transcription factor TBX21)38. Second, we have recently demonstrated that IL-27 secreted by DCs, other myeloid cells and IECs plays distinct roles in promoting intestinal homeostasis both at steady state and during infection20. Specifically, IL-27 produced by DCs was shown to be critical for the differentiation of T-bet+ Treg cells, a specific Treg cell subset that is required to control IFN-γ-mediated TH1 cell immunity39. These results, combined with the current work, suggested that, unlike its direct inhibitory effect on TH17 cells, IL-27 controls TH1 cell responses indirectly through the induction of T-bet+ Treg cells. Our studies also further implied that different IL-27-producing cells and their responding cells probably reside in close proximity and directly interact with each other to achieve such a selective effect. As such, the precise location in the intestinal tissue that the IL-27-producing Treg cells inhabit is also probably the place where TH17 cells differentiate: an intriguing hypothesis that warrants further investigation.
Previously, a specific subset of RORγt-expressing intestinal Treg cells known to be important to maintain gut homeostasis was shown to be induced in the periphery in a gut microbiota-dependent manner40,41. It is interesting that, despite a similar reliance of microbiome on the induction of IL-27- and RORγt-expressing Treg cells, our scRNA-seq analysis suggested that not all RORγt+ Treg cells could produce IL-27. It is possible that gut microbiota can drive the expression of IL-27 in a certain Treg cell population (that is, CD83+) within both gut-resident periphery-induced and thymus-derived Treg cells. Considering the diverse features of the intestinal microenvironment, one probably should not be surprised that gut Treg cells can exhibit many unique characteristics. The presence of these functionally distinct Treg cell subsets in the intestine further implies the presence of a certain division of labor between different gut Treg cell subsets to coordinately maintain intestinal homeostasis.
In humans, genome-wide association studies have identified IL-27 as a candidate gene within a susceptibility locus for inflammatory bowel disorder (IBD)42. Significantly, less IL-27 was found in people harboring the risk alleles relative to those with the nonrisk alleles43. These studies provided evidence linking IL-27 and IBD and suggested that the observed elevations in IL-27 in certain patients probably represent an anti-inflammatory response, albeit insufficient to control the ongoing intestinal inflammation42. Nevertheless, it should also be noted that there are reports pointing to a proinflammatory role of IL-27 in promoting colitis44,45. These seemingly contradictory findings further demonstrated the complex nature of this cytokine because IL-27 can exert its diverse activities depending on the cell type that produces it, the cell type that responds to it, as well as the location and probably the timing when the stimulation occurs. In the present study, our studies clearly show that Treg cell-derived IL-27 plays a dominant and nonredundant role in regulating intestinal TH17 cell responses. The approach taken in this work not only allowed us to identify IL-27 as a Treg cell suppressor molecule selectively required for controlling a particular type of immune response in a specific tissue location, but also established a powerful platform for future investigation into tissue-specific Treg cell suppressor programs.
Methods
Mice
Swiss Webster mice, CBA/CaJ mice, Ly5.1+Foxp3KO mice46, Foxp3DTR mice13, Foxp3Thy1.1 mice47, CD11cCreIl27fl/fl mice, LysMCreIl27fl/fl mice, Vil1CreIl27fl/fl mice and CD4CreIl27rafl/fl mice have been described previously20. Treg cell-specific deletion of IL-27p28 was achieved by breeding Il27fl/fl mice to Foxp3Cre mice (also expressing the Foxp3-driven yellow fluorescent protein (YFP) reporter)8. All mice were bred and housed under SPF conditions. GF animal studies were done in collaboration with H. Chu (University of California, San Diego) and those mice were housed in the dedicated GF facility equipped with flexible-film isolators. Mice aged 8 to ~12 weeks of both sexes were used and only Foxp3Cre WT littermates of the same gender served as controls in each experiment. All mice were housed at a temperature between 18 °C and 23 °C with 40–60% humidity. A 12-h light:12-h dark cycle was used. Mice were maintained and handled in accordance with the Institutional Animal Care and Use Guidelines of the University of California, San Diego and National Institutes of Health (NIH) Guidelines for the Care and Use of Laboratory Animals and the Animal Research: Reporting In Vivo Experiments (ARRIVE) guidelines.
Flow cytometry and antibodies
The antibodies were all used at a dilution of 1:400 unless specifically specified below. Cells were stained with Ghost Dye Red 780 (catalog no. 13-0865-T100, Tonbo Biosciences), followed by surface and intracellular antibody staining for CD4 (catalog no. 45-0042-82), Ki67 (catalog no. 51-5698-82,), CD62L (catalog no. 12-0621-82), CD8α (catalog no. 25-0081-82), CD44 (catalog no. 48-0441-80), IFN-γ (catalog no. 25-7311-82), IL-17A (catalog no. 48-7177-82), RORγt (catalog no. 61-6981-82), CD25 (catalog 12-1522-82), ST2 (catalog 46-9335-82) and Foxp3 (catalog no. 53-5773-82, 1:200 dilution for staining) (all from Thermo Fisher Scientific); and CD83 (catalog no. 121508, BioLegend) and TCF1 (catalog no. 6709S, Cell Signaling, 1:200 dilution for staining) at the manufacturers’ recommended concentrations. Fixation and permeabilization of cells were performed with reagents from the Tonbo Biosciences FOXP3/Transcription Factor Staining Kit (catalog no. TNB-0607). To detect cytokine production, cells were stimulated in a 96-well plate with 50 ng ml−1 of phorbol 12-myristate 13-acetate, 0.5 μg ml−1 of ionomycin, and 1 μg ml−1 of Brefeldin A (all from Sigma-Aldrich) in complete 5% Roswell Park Memorial Institute (RPMI) medium for 4 h at 37 °C before staining. An LSRFortessa or LSRFortessa X20 cell analyzer (BD Biosciences) was used for data collection and FACSDiva and FlowJo software (BD Biosciences) for data analysis.
In vivo activation of Treg cells
To eliminate endogenous Treg cells, Foxp3DTR mice were injected with 50 μg of DT per kg body weight or PBS intraperitoneally for 2 d consecutively and every other day thereafter as described previously13. On the second day of DT injection, 2 × 10⁶ CD4+Foxp3Thy1.1+ Treg cells from the spleen and lymph nodes (LNs) of unmanipulated Foxp3Thy1.1 mice were sorted by FACS and transferred into Foxp3DTR mice intravenously. CD4+Foxp3Thy1.1+ Treg cell and CD4+Foxp3Thy1.1− Tconv cell populations from different tissues (that is, spleen, lung and SI LP) of DT- and PBS-treated Foxp3DTR mice were respectively isolated 10 d after Treg cell transfer. All T cell populations were first enriched by positive selection with CD4 MojoSort beads (BioLegend) before FACS.
Tissue preparation and cell isolation
Spleen and LNs were mechanically dissociated between frosted glass slides or with the back of a syringe plunger and filtered through a 100-μm nylon mesh to yield single-cell suspensions. For isolation of lymphocytes from lung, SI LP, LI LP or tumor, after perfusion, tissues were harvested and minced before transferring to conical tubes. The minced pieces were resuspended in 10 ml of complete RPMI-1640 containing 1% penicillin–streptomycin, 20 mM Hepes, pH 7.4, 0.05 mg ml−1 of Liberase TL (Roche) and 0.05% DNase I (Roche) and shaken for 30 min at 37 °C in 50-ml Falcon tubes. The tissue suspension was collected and passed through a 70-μm cell strainer and the cells were pelleted by centrifugation at 300g. The cells were then resuspended and purified by 47% Percoll and centrifuged at 400g for 10 min. The pellet was collected, washed and resuspended in complete RPMI medium.
Gene expression profiling
Poly(A) RNA-seq was performed using three biological replicates for each sorted cell population. Reads were mapped to mouse genome v.mm9 with STAR aligner, counts were generated using htseq/0.6.1 and differential gene expression analysis was conducted using DESeq2/1.30.1 in R. DEGs in Treg cells compared with Tconv cells from their respective tissue origin and treatment condition were generated in DESeq2 using negative binomial generalized linear model fitting with Wald’s test for significance and the Benjamini–Hochberg correction for multiple testing. The DEGs with adjusted P > 0.05 were plotted in scatter plots and used to create the Venn diagrams. Genes annotated as upregulated or downregulated in the scatter plots were used for GO analysis, which was conducted for biological processes using enrichGO in the clusterProfiler package with the following parameters: pvalueCutoff = 0.05, qvalueCutoff = 0.02, pAdjust-Method = Benjamini–Hochberg, dropGO level 5 and simplify cutoff 0.5. Count data were transformed using variance stabilizing transformation for visualization with heatmaps and PCA plots. Violin plots were created for specific genes using normalized counts from DESeq2.
For scRNA-seq analysis, CD45+ immune cells isolated from the large intestine of uninfected mice and mice 10 d after C. rodentium infection were sent for single-cell library preparation according to the protocol for 10× Genomics for Single Cell 5′ Gene Expression. About 10,000 sorted CD45+ cells were loaded and partitioned into Gel Bead In-Emulsions. The fastq files were aligned to the mm10 mouse genome using the Cell Ranger (v.7.0.0) pipeline, including intronic reads. The Seurat (v.4.1.0) package in R (v.4.1.2) was used for the gene expression analysis. Cells that were dying were first removed by filtering out cells with fewer than 200 genes or 500 transcripts or >10% mitochondrial content. All the cells captured were then clustered and the cluster that had the highest expression of Foxp3, as well as a transcriptomic signature of Treg cells, was selected for further analysis. This Treg cell subset included 242 cells from the infected group and 282 from the uninfected group. Differential gene expression analysis was done using the FindMarkers function within the Seurat package, which uses Wilcoxon’s rank-sum test.
Analysis by qPCR
For quantification of Il27, Ebi3, Il12a and Il10 expression, Tconv cells and Treg cells in different tissues from DT- and PBS-treated Foxp3DTR mice or from Foxp3CreIl27fl/fl and WT littermates were sorted on a FACSAria Fusion cell sorter (BD Biosciences) with a purity of >95%. For certain experiments, WT Foxp3Cre mice were infected with C. rodentium as described below. Then, 10 d after infection, splenocytes and colonic immune cells were extracted, followed by FACS isolation of CD83+CD62Llo, CD83−CD62Llo and CD83−CD62LhiCD4+Foxp3YFP+ Treg cells. CD62Lhi Treg cells were used as the reference for the CD83− population because CD62L and CD83 are not co-expressed in the same Treg cells based on our scRNA-seq analysis. For DC cytokine expression profiling, CD11c+ DCs from the spleen or SI of Foxp3CreIl27fl/fl and WT littermates were sorted. Cells were stimulated with or without lipopolysaccharide (LPS; 1 μg ml−1) for 6 h at 37 °C followed by RNA isolation using an RNeasy Kit (QIAGEN). Extracted RNA was converted to complementary DNA with an iScript cDNA Synthesis Kit (BioRad), followed by qPCR reactions using SYBR Select Master Mix (Thermo Fisher Scientific). All real-time reactions were run on a 7900HT Fast Real-Time PCR System (Thermo Fisher Scientific) with the following primers: Il27: 5′-CTGAATCTCGATTGCCAGGAGTGA-3′ (forward) and 5′-AGCGAGGAAGCAGAGTCTCTCAGAG-3′ (reverse); Ebi3: 5′-CGGTGCCCTACATGCTAAAT-3′ (forward) and 5′-GCGG AGTCGGTACTTGAGAG-3′ (reverse); Il12a: 5′-CAGGCTACCTC CTCTTTTTG-3′ (forward) and 5′-CAGCAGTGCAGGAATAATGTT-3′ (reverse); Il10: 5′-CAGAGCCACATGCTCCTAGA-3′ (forward) and 5′-TGTCCAGCTGGTCCTTTGTT-3′ (reverse); Il1b: 5′-ACTCATTGT GGCTGTGGAGA-3′ (forward) and 5′-TTGTTCATCTCGGAGCCTGT-3′ (reverse); Il6: 5′-TGAACAACGATGATGCACTTG-3′ (forward) and 5′-CTGAAGGACTCTGGCTTTGTC-3′ (reverse); Il23: 5′-CCAGCGG GACATATGAATCT-3′ (forward) and 5′-AGGCTCCCCTTTGAAGATGT-3′ (reverse); Tgfb: 5′-GGAGAGCCCTGGATACCAAC-3′ (forward) and 5′-AAGTTGGCATGGTAGCCCTT-3′ (reverse); and Il12b: 5′-AGGT CACACTGGACCAAAGG-3′ (forward) and 5′-TGGTTTGATGATGTC CCTGA-3′ (reverse).
ELISA
For quantification of the production of IL-27, IL-35 and IL-10, Tconv cells and Treg cells in different tissues from DT- and PBS-treated Foxp3DTR mice or from anti-CD3 monoclonal antibody-treated or Citrobacter-infected Foxp3CreIl27fl/fl and WT littermates were sorted on a FACSAria Fusion cell sorter with a purity of >95%. Cells were stimulated with LPS (0.5 μg ml−1) for 48 or 72 h at 37 °C. Supernatant was collected and measured by ELISA kits according to the manufacturer’s instructions (catalog nos. 438707, 440507 and 431414, BioLegend). Absorbance was measured at 450 nm with a microplate reader (Molecular Devices).
In vitro suppression assay
Carboxyfluorescein diacetate succinimidyl ester (CFSE)-labeled, naive CD4+CD25−CD62Lhi T cells, 4 × 10⁴, from Ly5.1+ B6 mice and CD4+Foxp3YFP+ Treg cells in SI LP or spleen from Foxp3CreIl27fl/fl mice or WT control littermates were co-cultured in a 96-well U-bottomed plate at the indicated ratios and stimulated with 1 μg ml−1 of anti-CD3 monoclonal antibody (catalog no. BE0001–1, Bio-X-Cell) in the presence of 15 × 104 mitomycin C-treated, T cell-depleted splenocytes from B6 mice for 72 h at 37 °C. CFSE dilution was assessed by FACS analysis.
In vitro IL-27 inhibition assay
Naive CD4+CD25−CD62Lhi T cells, 1 × 10⁶, from Ly5.1+ B6 mice were cultured in a 24-well plate and stimulated with 1 μg ml−1 of anti-CD3 monoclonal antibody in the presence of 2 × 10⁶ mitomycin C-treated, T cell-depleted splenocytes from B6 mice and 50 U ml−1 of recombinant human IL-2 (PeproTech) under TH1 cell- or TH17 cell-polarizing conditions for 4 d at 37 °C. Th cell polarization medium was supplemented as follows: for TH1 cell differentiation, 2 U ml−1 of IL-12 (PeproTech) and 10 μg ml−1 of anti-IL-4 monoclonal antibody (catalog no. BE0045, Bio-X-Cell); for TH17 cell differentiation, 2 ng ml−1 of human transforming growth factor (hTGF-β, PeproTech) and 20 ng ml−1 of IL-6 (PeproTech). In some samples, 100 ng ml−1 of IL-27 (BioLegend) was added. Surface and intracellular cytokines were stained and analyzed as previously described.
Adoptive T cell transfer study
CD4+ T cells, 1.6 × 10⁶, isolated from spleen and LNs of Ly5.1+Foxp3KO mice, mixed with 4 × 10⁵ CD4+Foxp3YFP+ Treg cells isolated from spleen and LNs of Foxp3CreIl27fl/fl mice or their WT littermates, were intraperitoneally injected into Rag1−/− recipients. Mice were sacrificed 3 weeks after cell transfer or when mice reached <80% of their original body weight. Colonic immune cells were isolated for FACS analysis as described above.
Anti-CD3 monoclonal antibody-induced intestinal inflammation
Anti-CD3 monoclonal antibodies were injected intraperitoneally 3× (20, 20 and 20 μg per mouse) every other day. On day 5, mice were taken down for histology, tissue preparation, cell isolation and immune staining.
T. gondii Infection
The ME-49 strain of T. gondii was maintained in Swiss Webster and CBA/CaJ mice and tissue cysts from the brain were used for infection as previously described20. For all studies, mice were infected with 40 cysts of ME-49 by an oral route and analyzed for parasite burden. To quantify parasite burden, qPCR was performed for DNA isolated from duodenum and liver of infected mice using primers 5′-TCCCCTCTGCTGGCGAAAAGT-3′ (forward) and 5′-AGCGTTCGTGGTCAACTATCGATTG-3′ (reverse) to determine the relative abundance of T. gondii B1 gene to mouse Gapdh gene. The PCR reaction was run using the standard setting on Applied Biosystems 7900 as described previously20.
C. rodentium Infection
For infections, C. rodentium (DBS100 strain) was cultured overnight from a single colony in lysogeny broth (LB) with nalidixic acid (Nal) from day 1. On day 0, each mouse was infected with 5.0 × 10⁹ colony-forming units (c.f.u.) per mouse in a volume of 100 μl by oral gavage. On day 10, mice were taken down for tissue preparation, cell isolation and immune staining. To quantify bacterial burden, LI tissue samples were also collected and homogenized in LB medium at day 10 post-infection. The numbers of bacteria were counted by plating dilutions of the excess inocula sample on to LB agar with Nal as previously described48.
AOM/DSS-induced, colitis-associated cancer
For induction of colon cancer, mice were intraperitoneally injected with 10 mg kg−1 of AOM (Sigma-Aldrich). After 5 d, mice were supplied with 2% DSS solution for 5 d followed by normal drinking water for 15 d. The DSS cycle was repeated 3× and mice were taken down after the last DSS cycle for tissue preparation, cell isolation and immune staining49. AOM-induced tumors will form in the colon. The tumor formation is painless and does not metastasize.
Histology
To assess immunopathology, different tissues were harvested and immediately fixed in 10% formalin solution. Paraffin-embedded sections were cut (5-mm thickness) and stained with hematoxylin and eosin (H&E). All slides were digitized and imaged using the Olympus Nanozoomer and Digital Pathology viewing software (Nikon). Histopathology of SI in the anti-CD3 monoclonal antibody-induced, intestinal inflammation model and LI in the AOM/DSS-induced, colitis-associated cancer model was examined and blindly scored using the scale of 0–4 and 0–15, respectively, as previously described39,50.
Statistics and reproducibility
Statistical analysis was applied to technical replicates or biologically independent mice for each experiment. All experiments described in the present study have been performed independently at least twice and the exact numbers of independent experiments with similar results are indicated in the figure captions. GraphPad Prism 8 software was used for data analysis and representation. P values for comparisons are provided as exact values or as P < 0.0001. The 95% confidence levels were used to determine statistically significant P values. No statistical methods were used to predetermine sample sizes, but our sample sizes were similar to those reported in previous publications. The data met the assumptions of the statistical tests used. Data distributions (individual data points) have been shown in all figures when applicable and were assumed to be normal, but this was not formally tested. Mice were sex and age matched and littermates were used whenever possible. Mice were then allocated into experimental groups according to their genotypes. Data collection and analysis were not performed blind to the conditions of the experiments, except for the H&E staining-based immunopathology analysis. No data points or animals were excluded from the analysis, except for mice that needed to be prematurely euthanized owing to a display of unrelieved clinical signs of pain or those that had lost >20% of their pre-procedure body weight based on our approved animal protocol.
Extended Data
Extended Data Fig. 1 |. Establishing an in vivo experimental model to simultaneously study active suppressor program in different tissue Treg cell subsets.
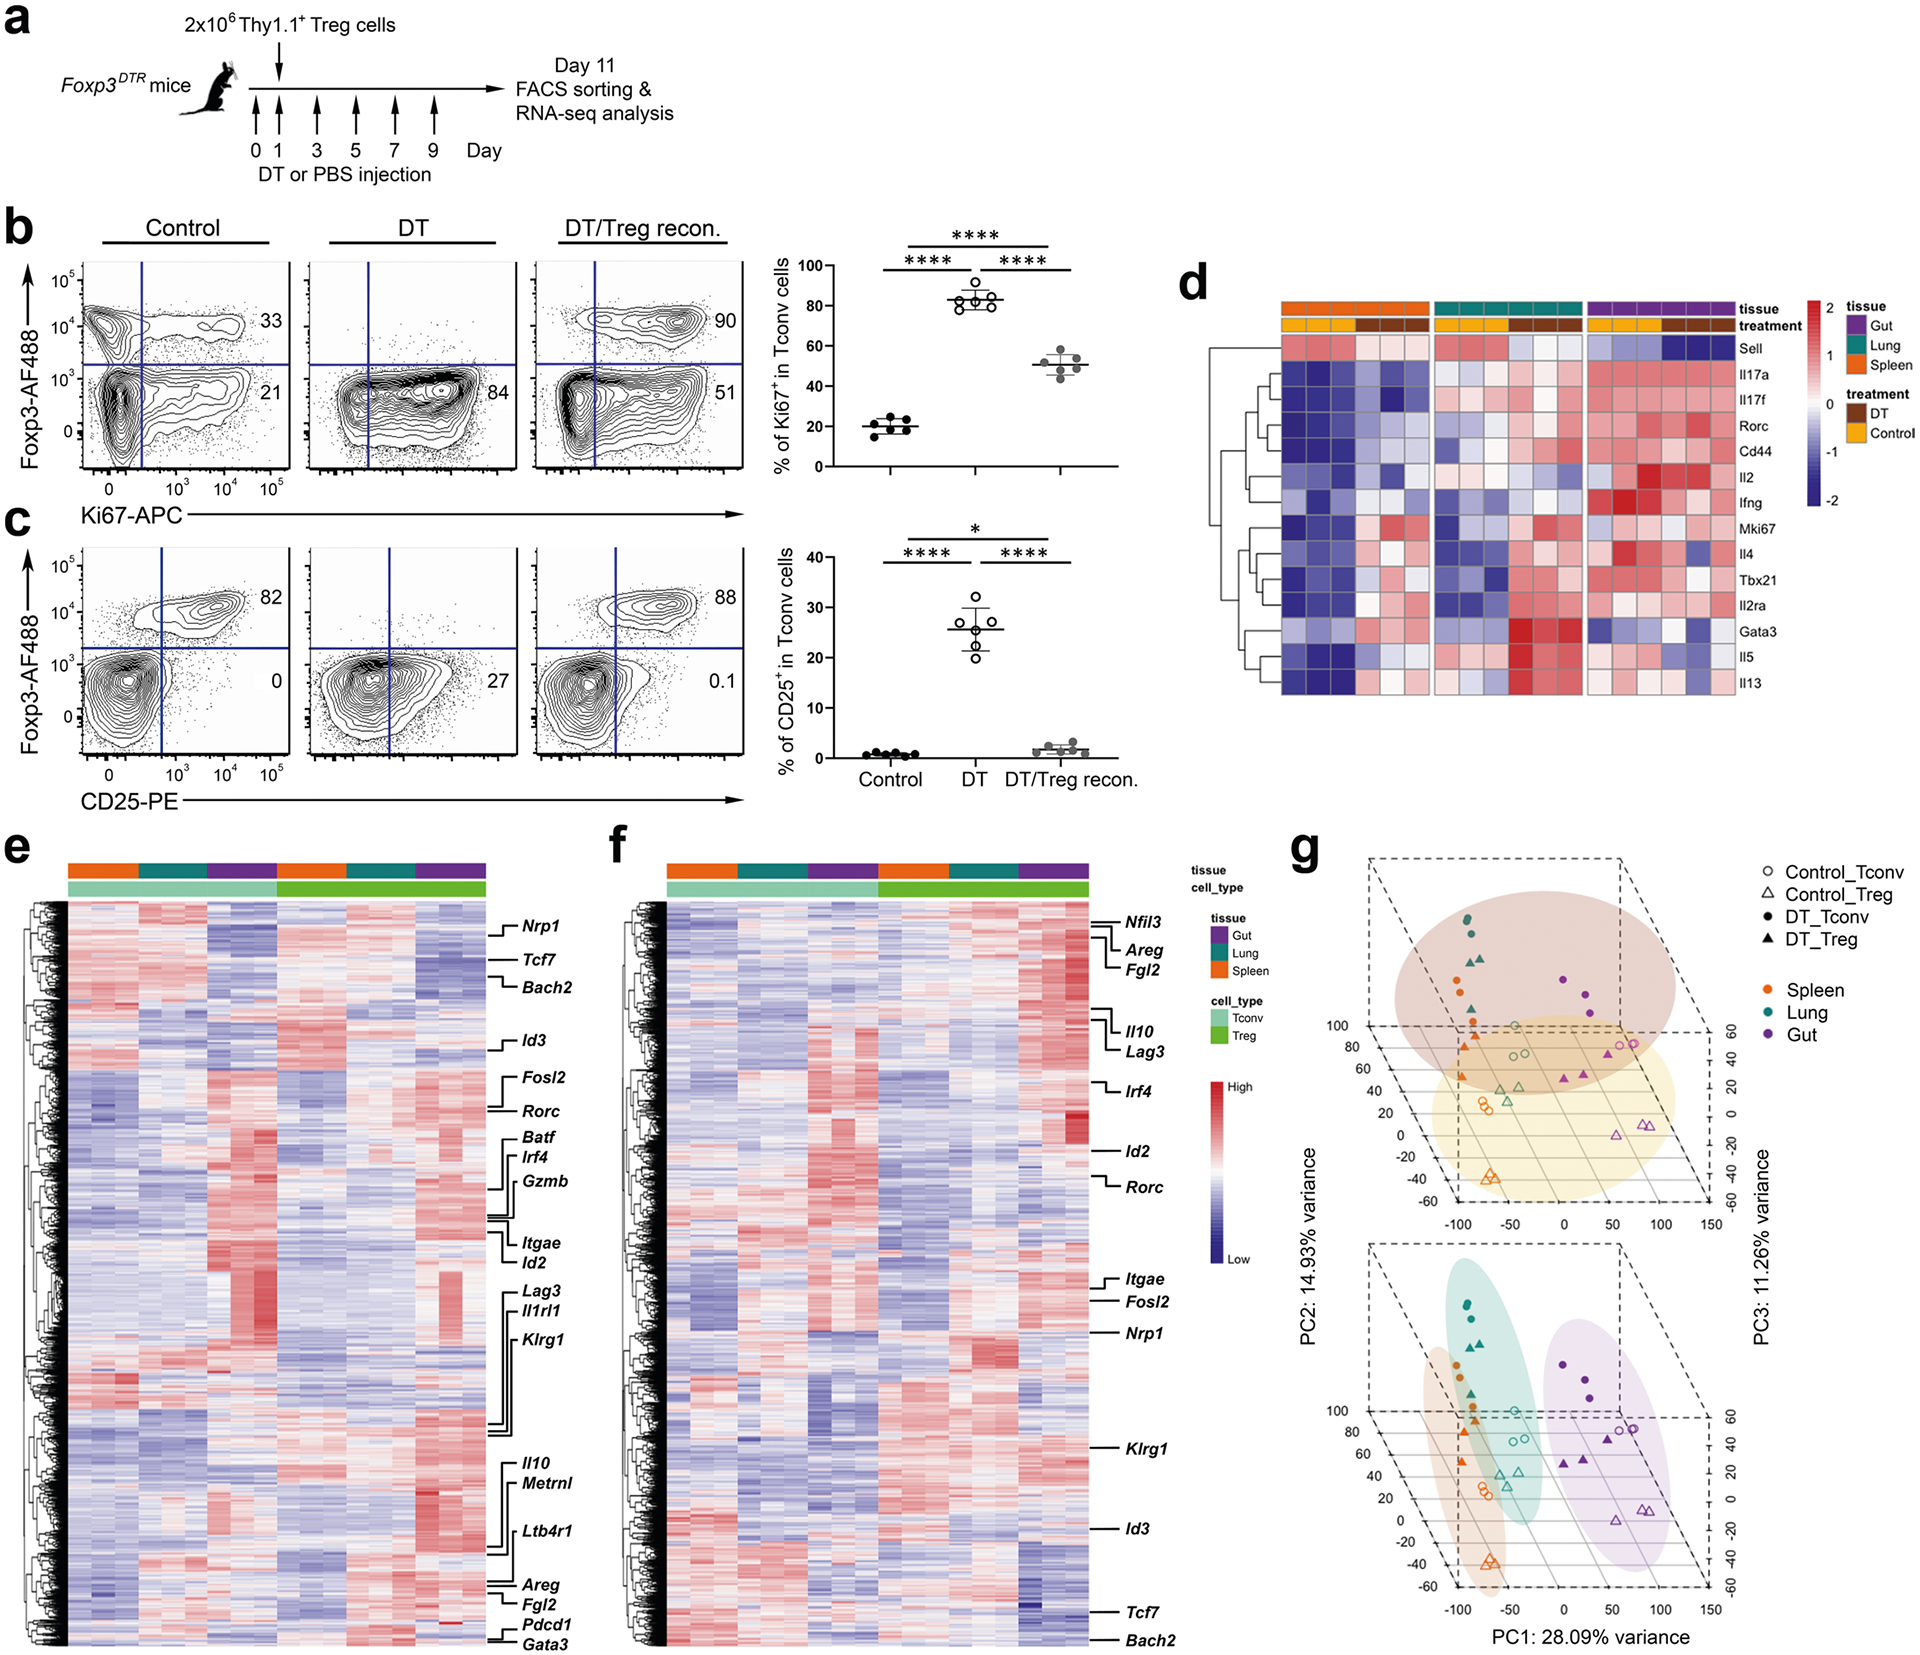
a, Schematic of the experimental model for studying Treg cell-mediated control of systemic autoimmunity. FACS analysis and frequencies of b, Ki67+ and c, CD25+ cells within the Tconv cells gated on the live CD4+Foxp3− population (or Treg cells gated on the live CD4+Foxp3+ population) in spleens of control PBS-treated or DT-treated Foxp3DTR mice with or without transfer of Foxp3Thy1.1+ Treg cells. Each symbol represents an individual mouse (n = 6). Data are presented as mean values +/− SD. In b, ****P < 0.0001 (up); ****P < 0.0001 (bottom left); ****P < 0.0001 (bottom right). In c, *P = 0.0352 (up); ****P < 0.0001 (bottom left); ****P < 0.0001 (bottom right). Statistical significance was determined by two-tailed unpaired t test. d, Heatmap of selected genes characteristic of activated T cells as well as Th1, Th2 and Th17 subsets that were expressed in Tconv cells isolated from indicated tissues in control PBS-treated or DT-treated Foxp3DTR mice 10 days after Treg cell transfer. Heatmaps of top 10% of most variable genes in Treg cells isolated from indicated tissues in e, control PBS-treated or f, DT-treated Foxp3DTR mice 10 days after Treg cell transfer. g, PCA of gene expression by different Treg and Tconv cell subsets. Different cell samples were grouped by treatment (top) or anatomical location (bottom).
Extended Data Fig. 2 |. Tissue Treg cells consistently produced high levels of IL-10 regardless of the presence or absence of inflammatory conditions.
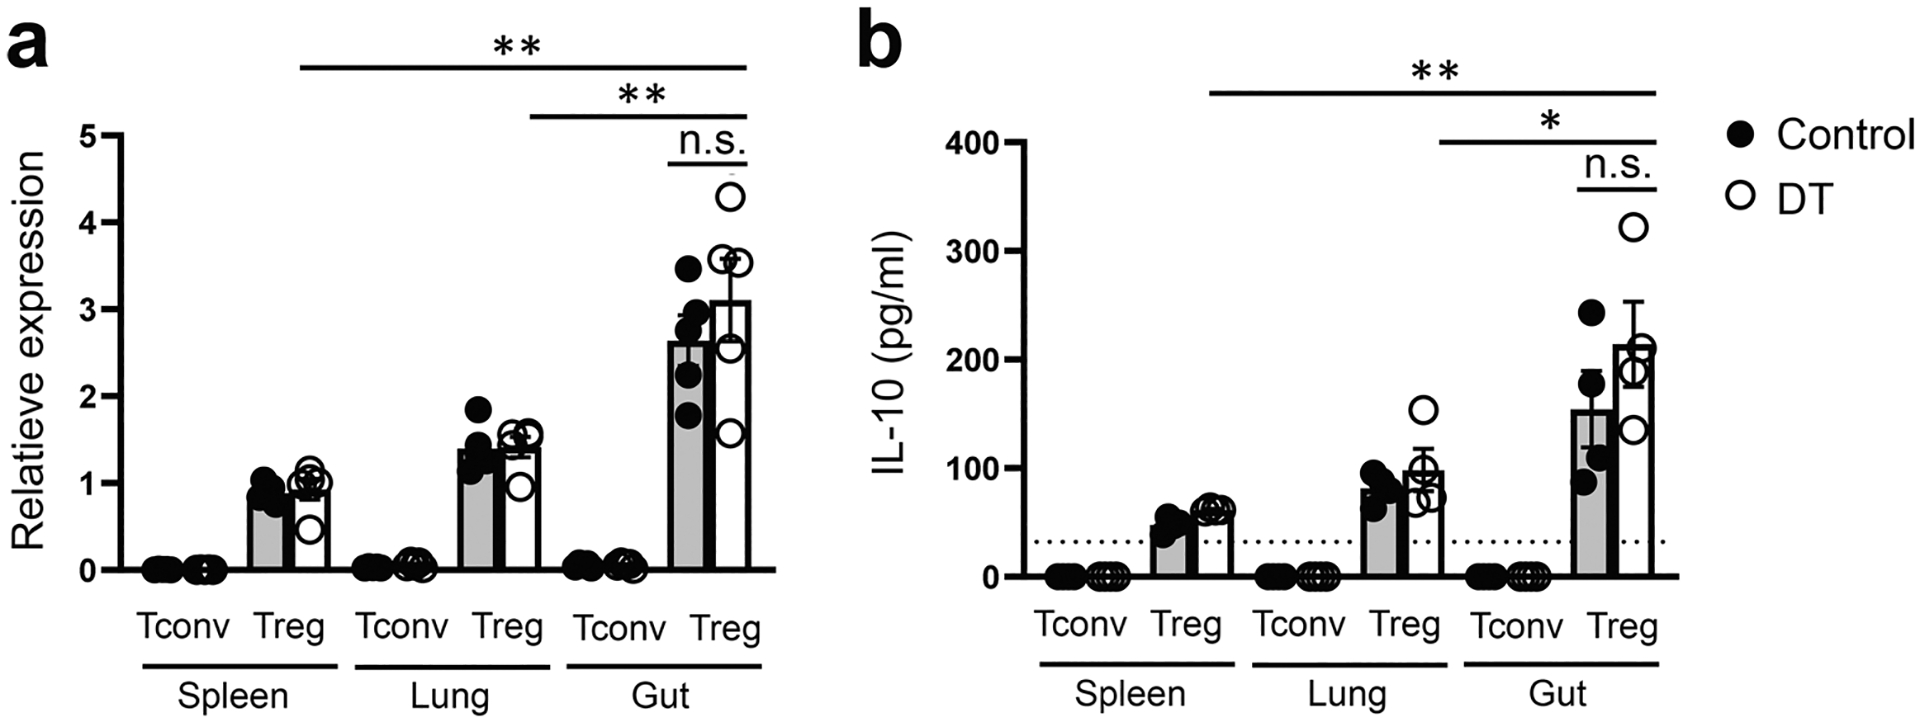
a, qPCR analyses for the expressions of Il10 in Tconv and Treg cells in different tissues from control PBS- or DT-treated Foxp3DTR mice. Each symbol represents an individual mouse (n = 5). b, ELISA analyses of the production of IL-10 by Tconv and Treg cells in different tissues from control PBS- or DT-treated Foxp3DTR mice. Each symbol represents FACS-isolated cell sample pooled from two to three mice (n = 4). Dotted line represents the minimum detection limit of the cytokine. Data are presented as mean values +/− SD. In a, **P = 0.0021 (up); **P = 0.0084 (middle); n.s. = 0.4266 (bottom). In b, **P = 0.0081 (up), *P = 0.0385 (middle); n.s. = 0.3009 (bottom). Statistical significance was determined by two-tailed unpaired t test.
Extended Data Fig. 3 |. Loss of IL-27 produced by Treg cells did not lead to any obvious immune phenotype except for increased Th17 responses in the intestine.
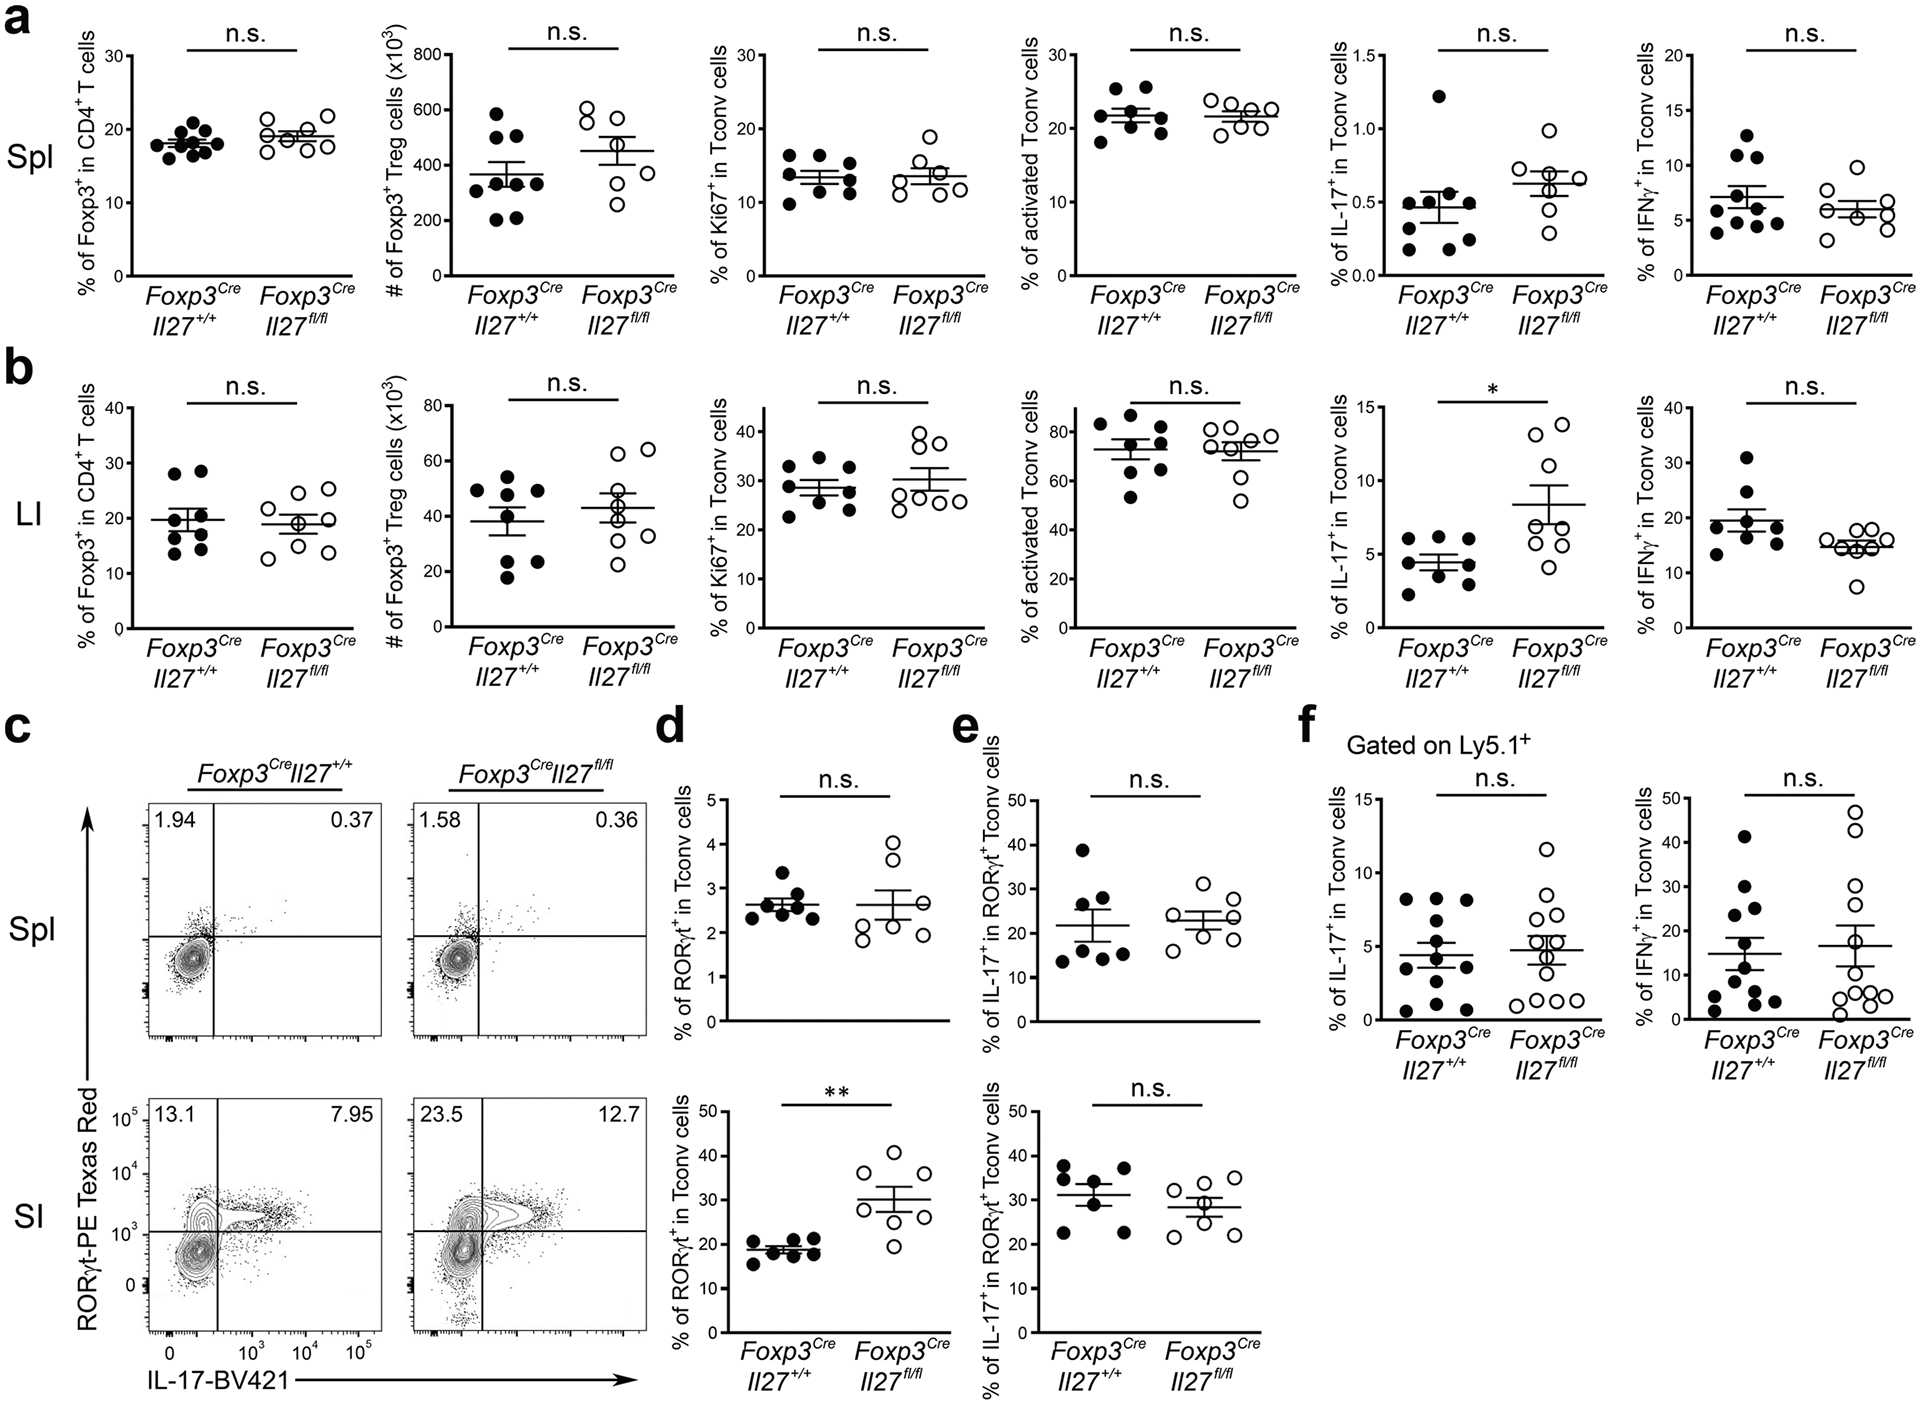
Frequencies and numbers of Foxp3+ Treg cells and frequencies of Ki67+, CD44hiCD62Llo, IL-17+, and IFNγ+ Tconv cells gated on the live CD4+Foxp3− population in a, spleen and b, LI LP of Foxp3CreIl27fl/fl mice and WT littermates (~8–12 weeks). c, FACS analysis and d, frequencies of RORgt+ in Tconv cells gated on the live CD4+Foxp3− population in spleen and SI LP of Foxp3CreIl27fl/fl mice and WT littermates (~8–12 weeks). e, Frequencies of IL-17+ in RORgt+ Tconv cells gated on the live CD4+Foxp3− population in spleen and SI LP of Foxp3CreIl27fl/fl mice and WT littermates (~8–12 weeks). f, Frequencies of IL-17+ and IFNγ+ Ly5.1+ Teff cells (isolated from Foxp3KO mice) gated on the live CD4+Foxp3− population in spleens of RAG-deficient mice three weeks after co-transferred with Treg cells isolated from either Foxp3CreIl27fl/fl mice or WT littermates. Each symbol represents an individual mouse. Data are presented as mean values +/− SD. In a, from right to left: n.s. = 0.2762 (n = 10 for Foxp3CreIl27+/+; 8 for Foxp3CreIl27fll/fl); n.s. = 0.2290 (n = 9 for Foxp3CreIl27+/+; 7 for Foxp3CreIl27fll/fl); n.s. = 0.9168 (n = 8 for Foxp3CreIl27+/+; 7 for Foxp3CreIl27fll/fl); n.s. = 0.9197 (n = 8 for Foxp3CreIl27+/+; 7 for Foxp3CreIl27fll/fl); n.s. = 0.2547 (n = 9 for Foxp3CreIl27+/+; 7 for Foxp3CreIl27fll/fl); n.s. = 0.3885 (n = 10 for Foxp3CreIl27+/+; 8 for Foxp3CreIl27fll/fl). In b, from right to left: n.s. = 0.7752; n.s. = 0.5144; n.s. = 0.5537; n.s. = 0.8933; *P = 0.0155; n.s. = 0.0577 (n = 8). In d, Spl: n.s. = 0.9907; SI: **P = 0.0025 (n = 7). In e, Spl: n.s. = 0.7866; SI: n.s. = 0.4099 (n = 7). In f, IL-17: n.s. = 0.7980; IFNγ: n.s. = 0.7652 (n = 12). Statistical significance was determined by two-tailed unpaired t test.
Extended Data Fig. 4 |. Treg cell-derived IL-27 likely limits Th17 responses through directly acting on T cells.
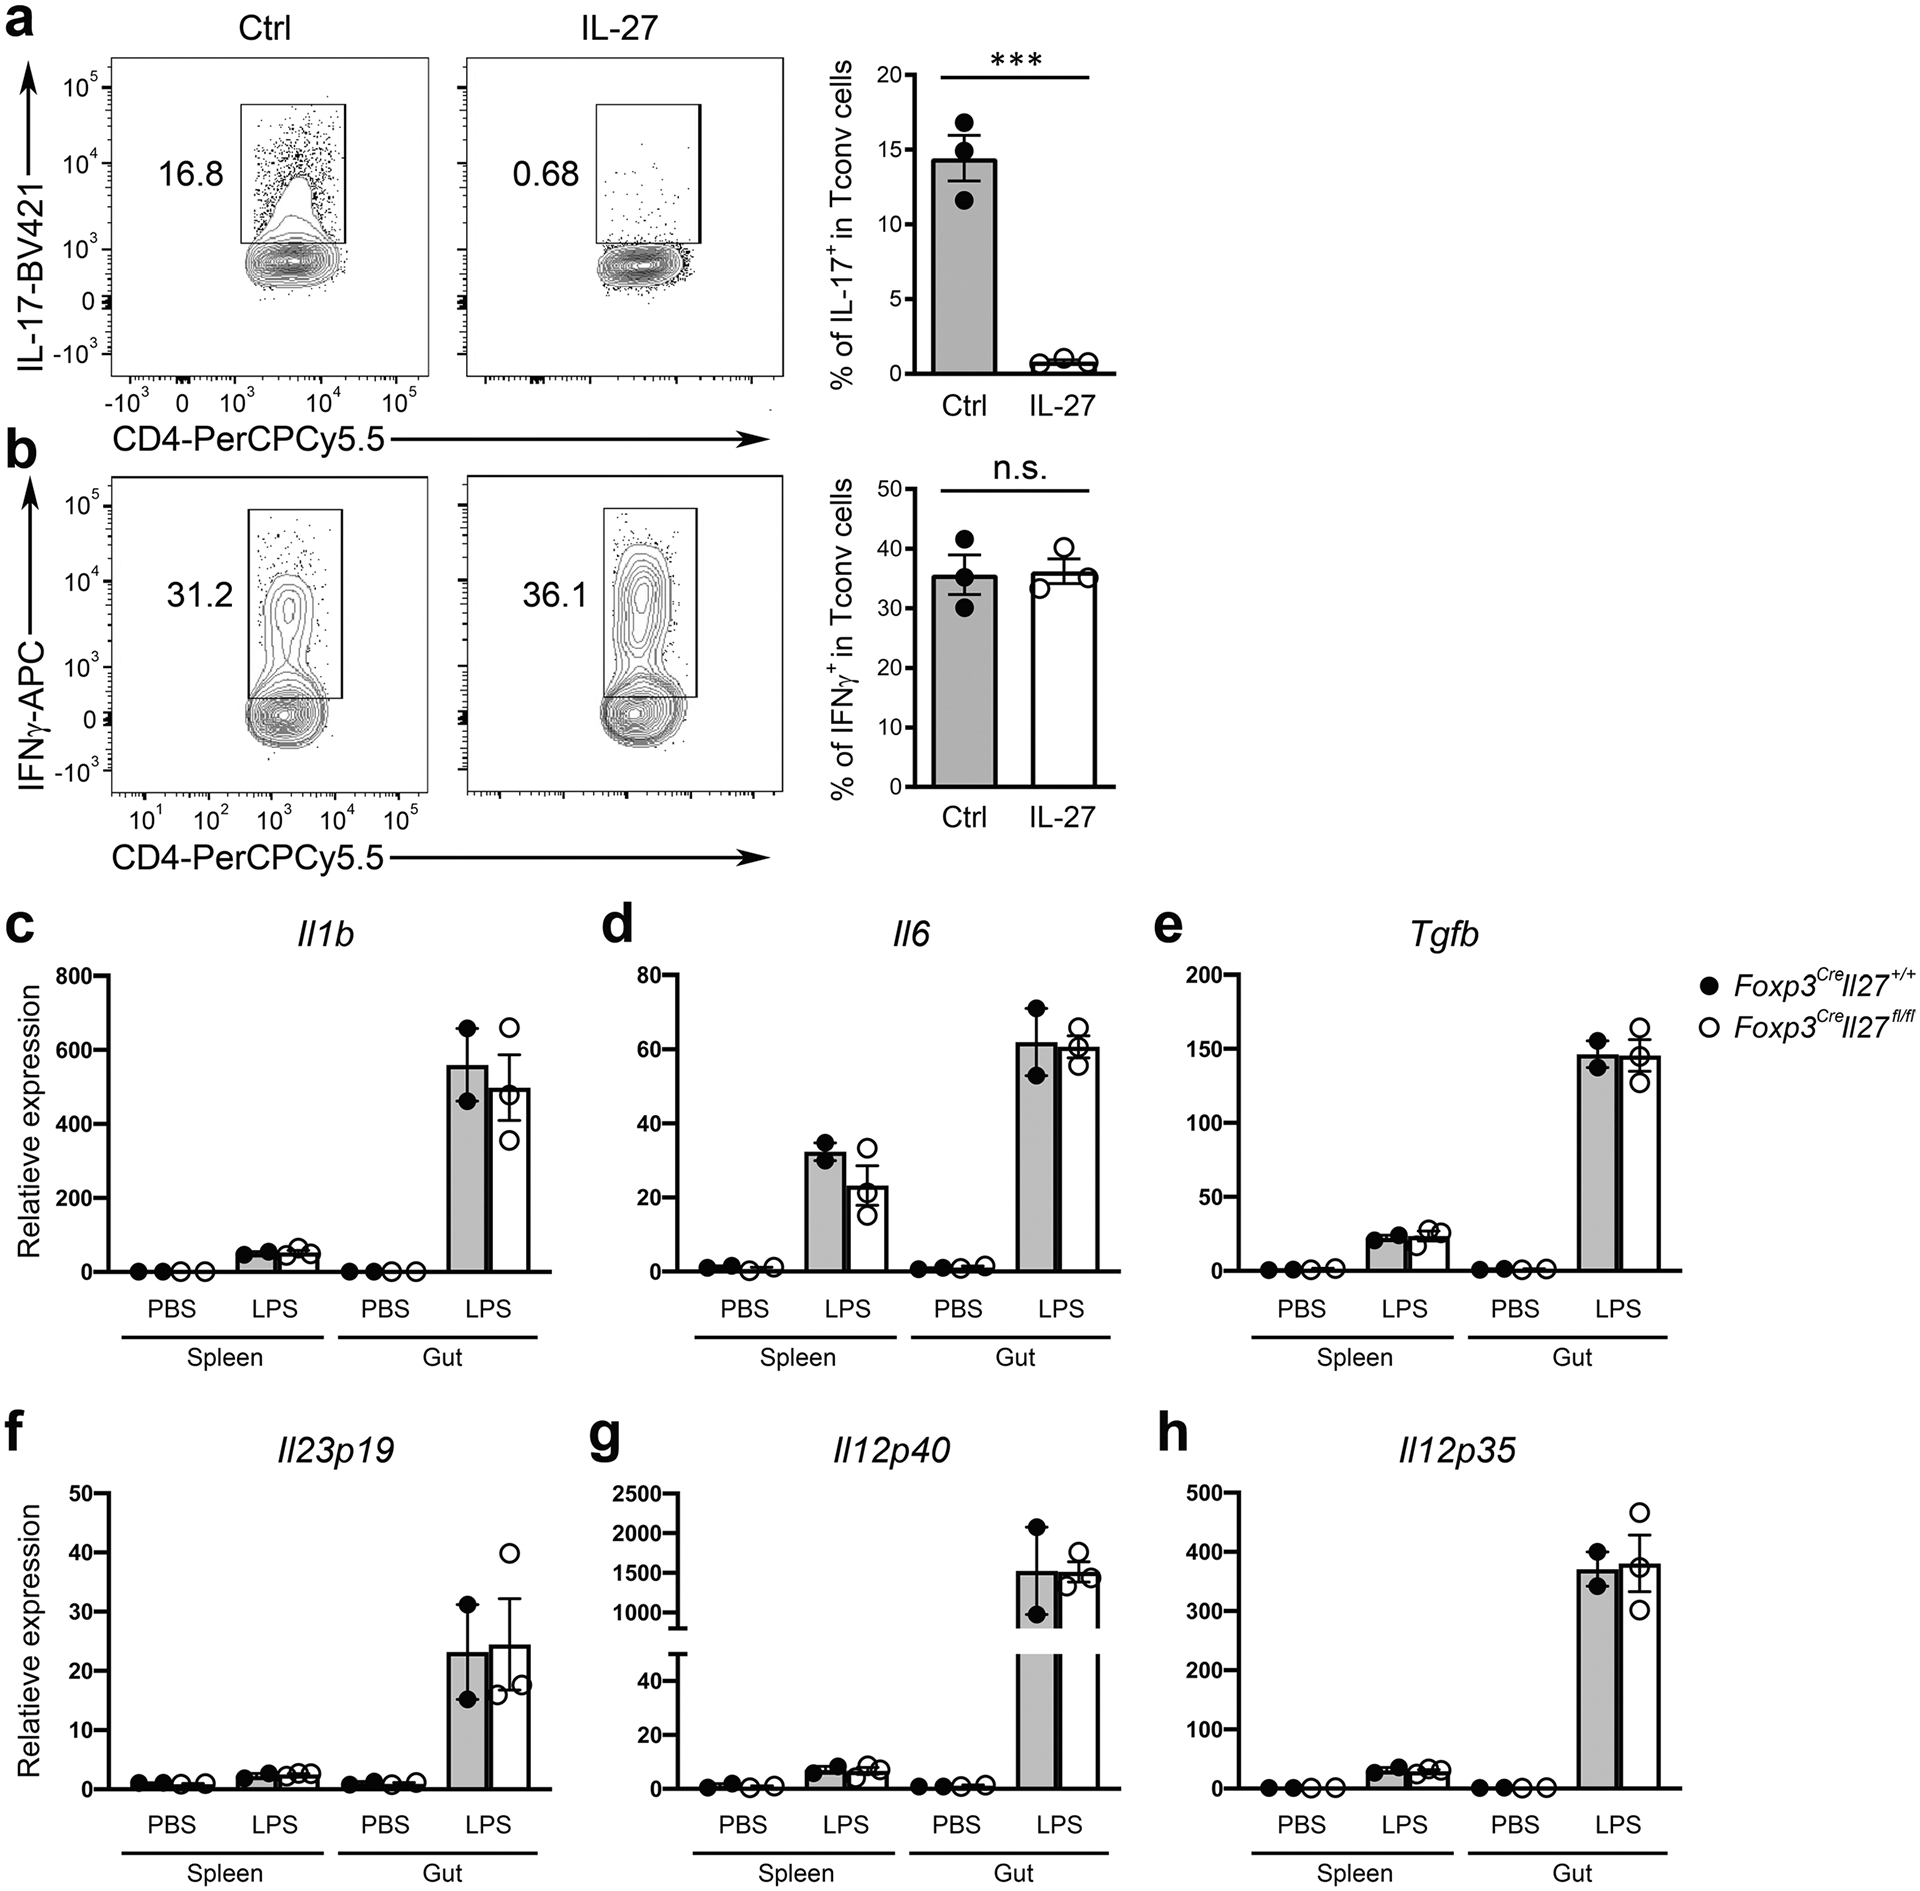
FACS analysis and frequencies of a, IL-17+ and b, IFNγ+ cells in Tconv cells gated on the live CD4+Foxp3− population cultured in the presence or absence of IL-27 (100 ng/ml) under Th17 and Th1 polarizing conditions, respectively. Each symbol represents an individual experiment (n = 3). qPCR analyses for the expressions of c, Il1b, d, Il6, e, Tgfb, f, ll23p19, g, Il12p40, and h, Il12p35 in DCs isolated from SI LP of either Foxp3CreIl27fl/fl mice or WT littermates. Each symbol represents FACS-isolated cell sample pooled from two to three mice (n = 2). Data are presented as mean values +/− SD. In a, ***P = 0.0009. In b, n.s. = 0.8920. Statistical significance was determined by two-tailed unpaired t test.
Extended Data Fig. 5 |. IL-27 produced by other non-Treg intestinal resident cell types is not required for IL-27-mediated regulation of Th17 responses.
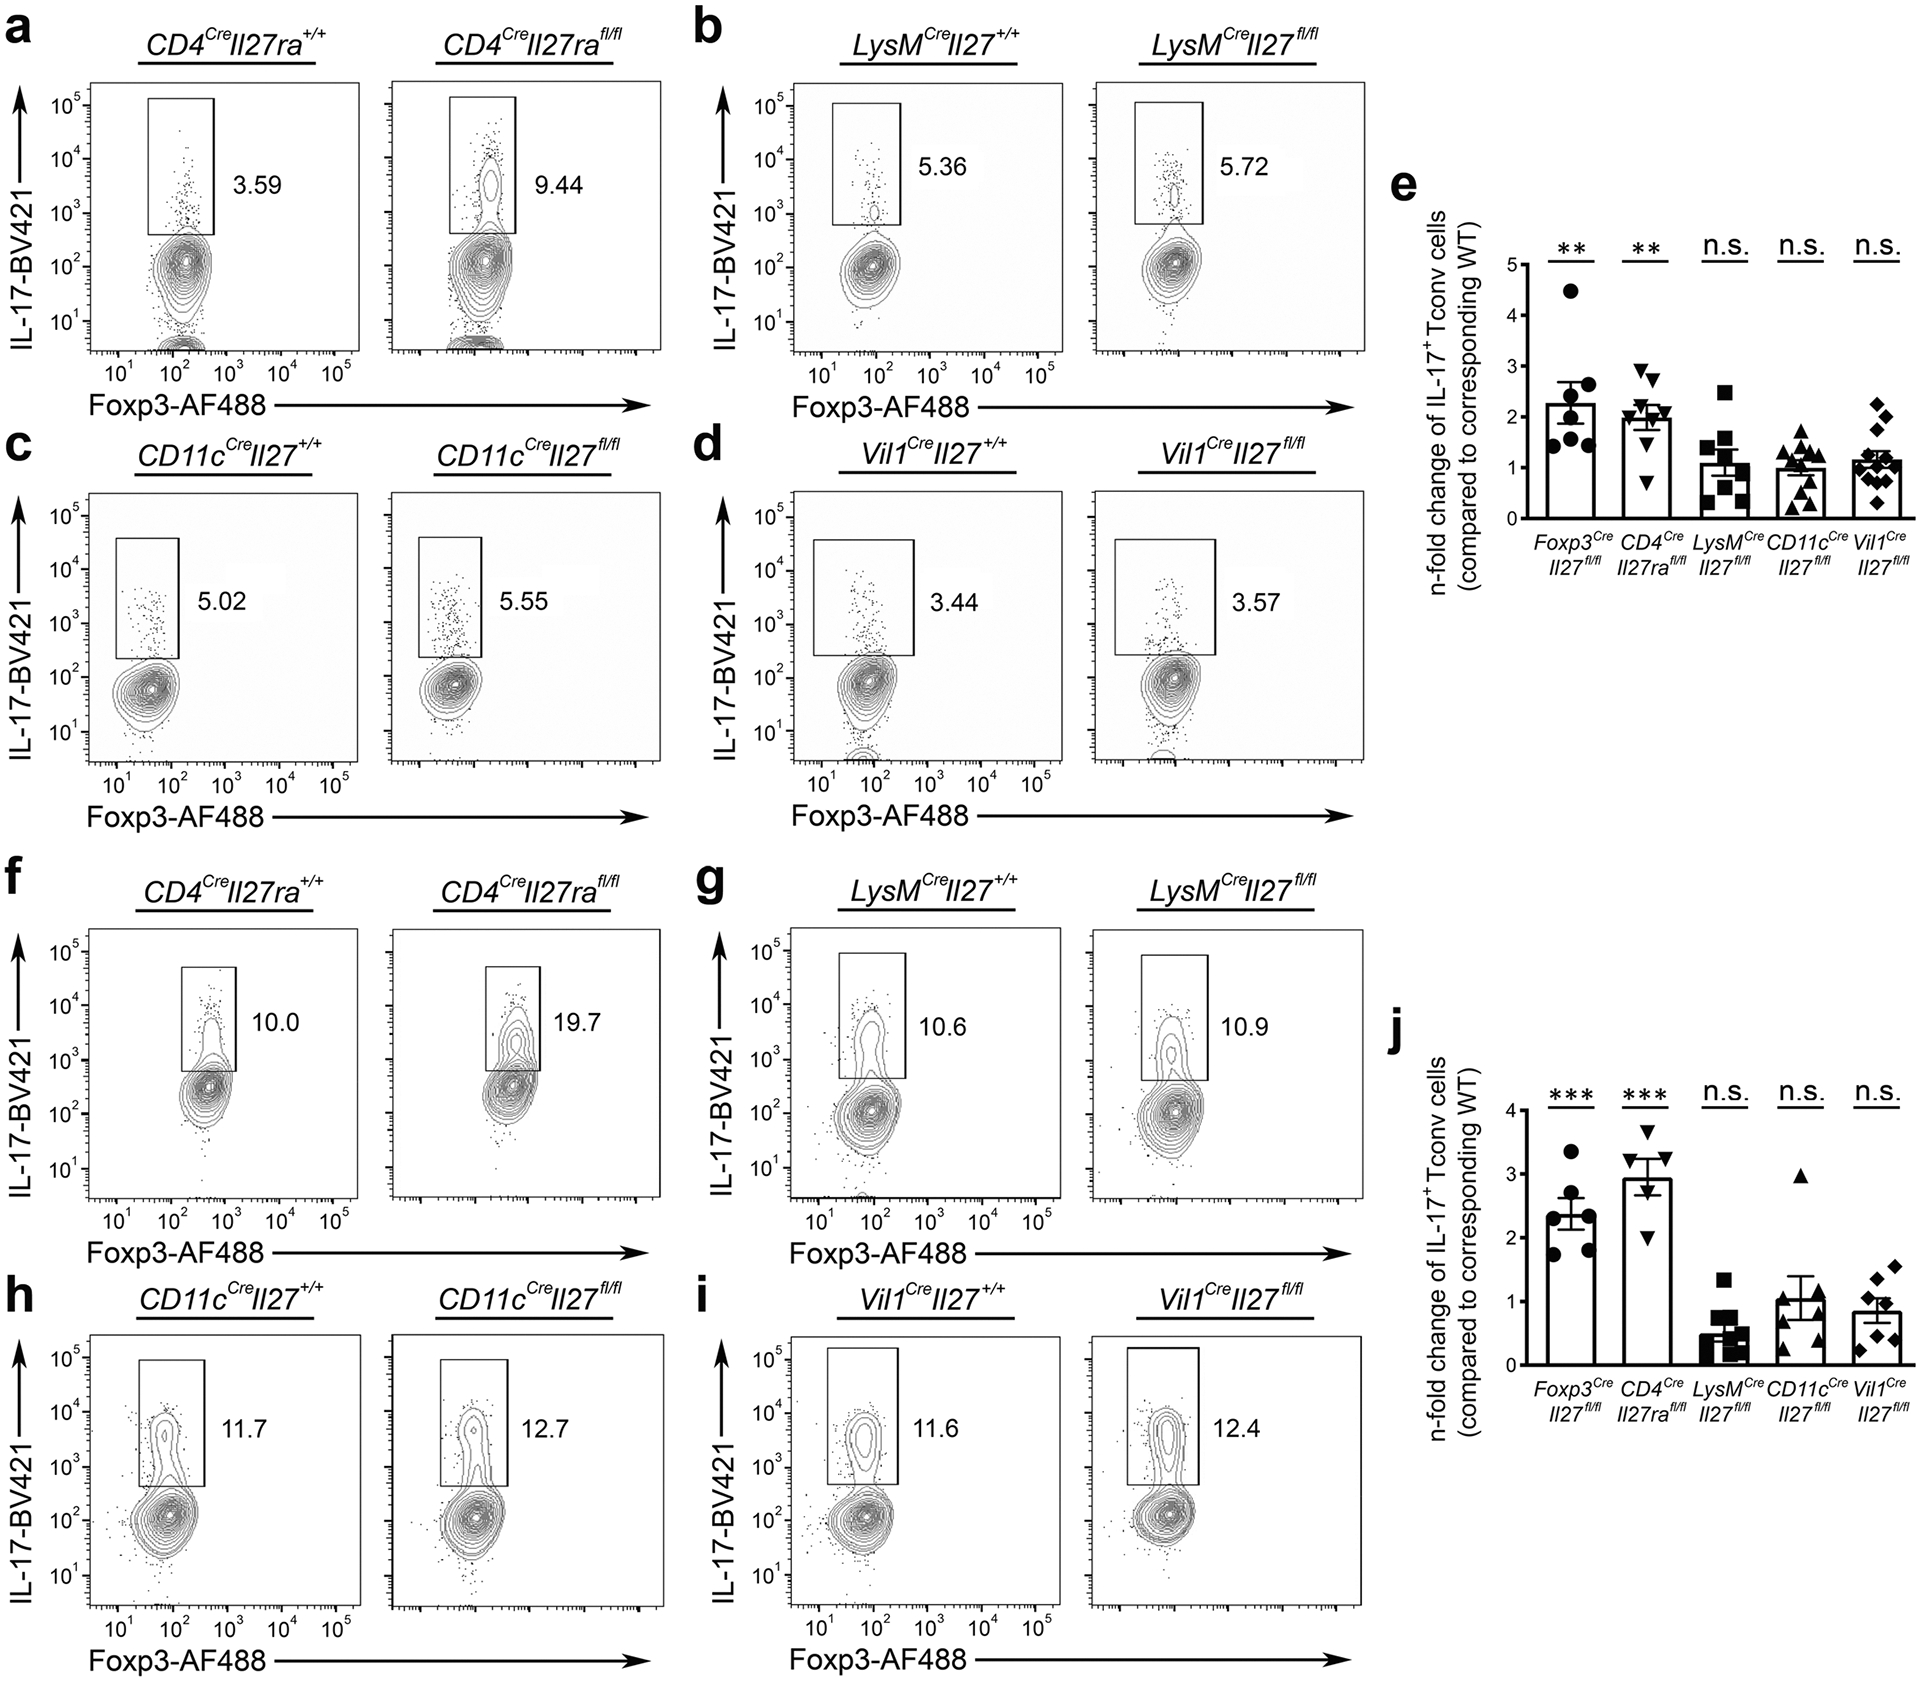
FACS analysis of IL-17+ Tconv cells gated on the live CD4+Foxp3− population in SI LP of a, CD4CreIl27rafl/fl mice, b, LysMCreIl27fl/fl, c, CD11cCreIl27fl/fl, d, Vil1CreIl27fl/fl, and their corresponding WT littermates ( ~ 8–12 weeks). e, n-fold changes (on the basis of corresponding WT controls) of IL-17+ Tconv cell frequencies in indicated mouse lines. FACS analysis of IL-17+ Tconv cells gated on the live CD4+Foxp3− population in SI LP of f, CD4CreIl27rafl/fl mice g, LysMCreIl27fl/fl, h, CD11cCreIl27fl/fl, i, Vil1CreIl27fl/fl, and their corresponding WT littermates 4 days after initial aCD3 mAb injection. j, n-fold changes (on the basis of corresponding WT controls) of IL-17+ Tconv cell frequencies in indicated mouse lines. Each symbol represents an individual mouse. Data are presented as mean values +/− SD. In e, from left to right: **P = 0.0065 (n = 7); **P = 0.006 (n = 8); n.s. = 0.7795 (n = 8); n.s. = 0.7158 (n = 11); n.s. = 0.5244 (n = 12). In j, from left to right: ***P = 0.001 (n = 6); ***P = 0.001 (n = 5); n.s. = 0.1755 (n = 9); n.s. = 0.6306 (n = 7); n.s. = 0.4163 (n = 7). Statistical significance was determined by two-tailed unpaired t test.
Extended Data Fig. 6 |. Elevated IL-27 production by intestinal Treg cells could be observed in other autoimmune- and infection-driven inflammatory settings.
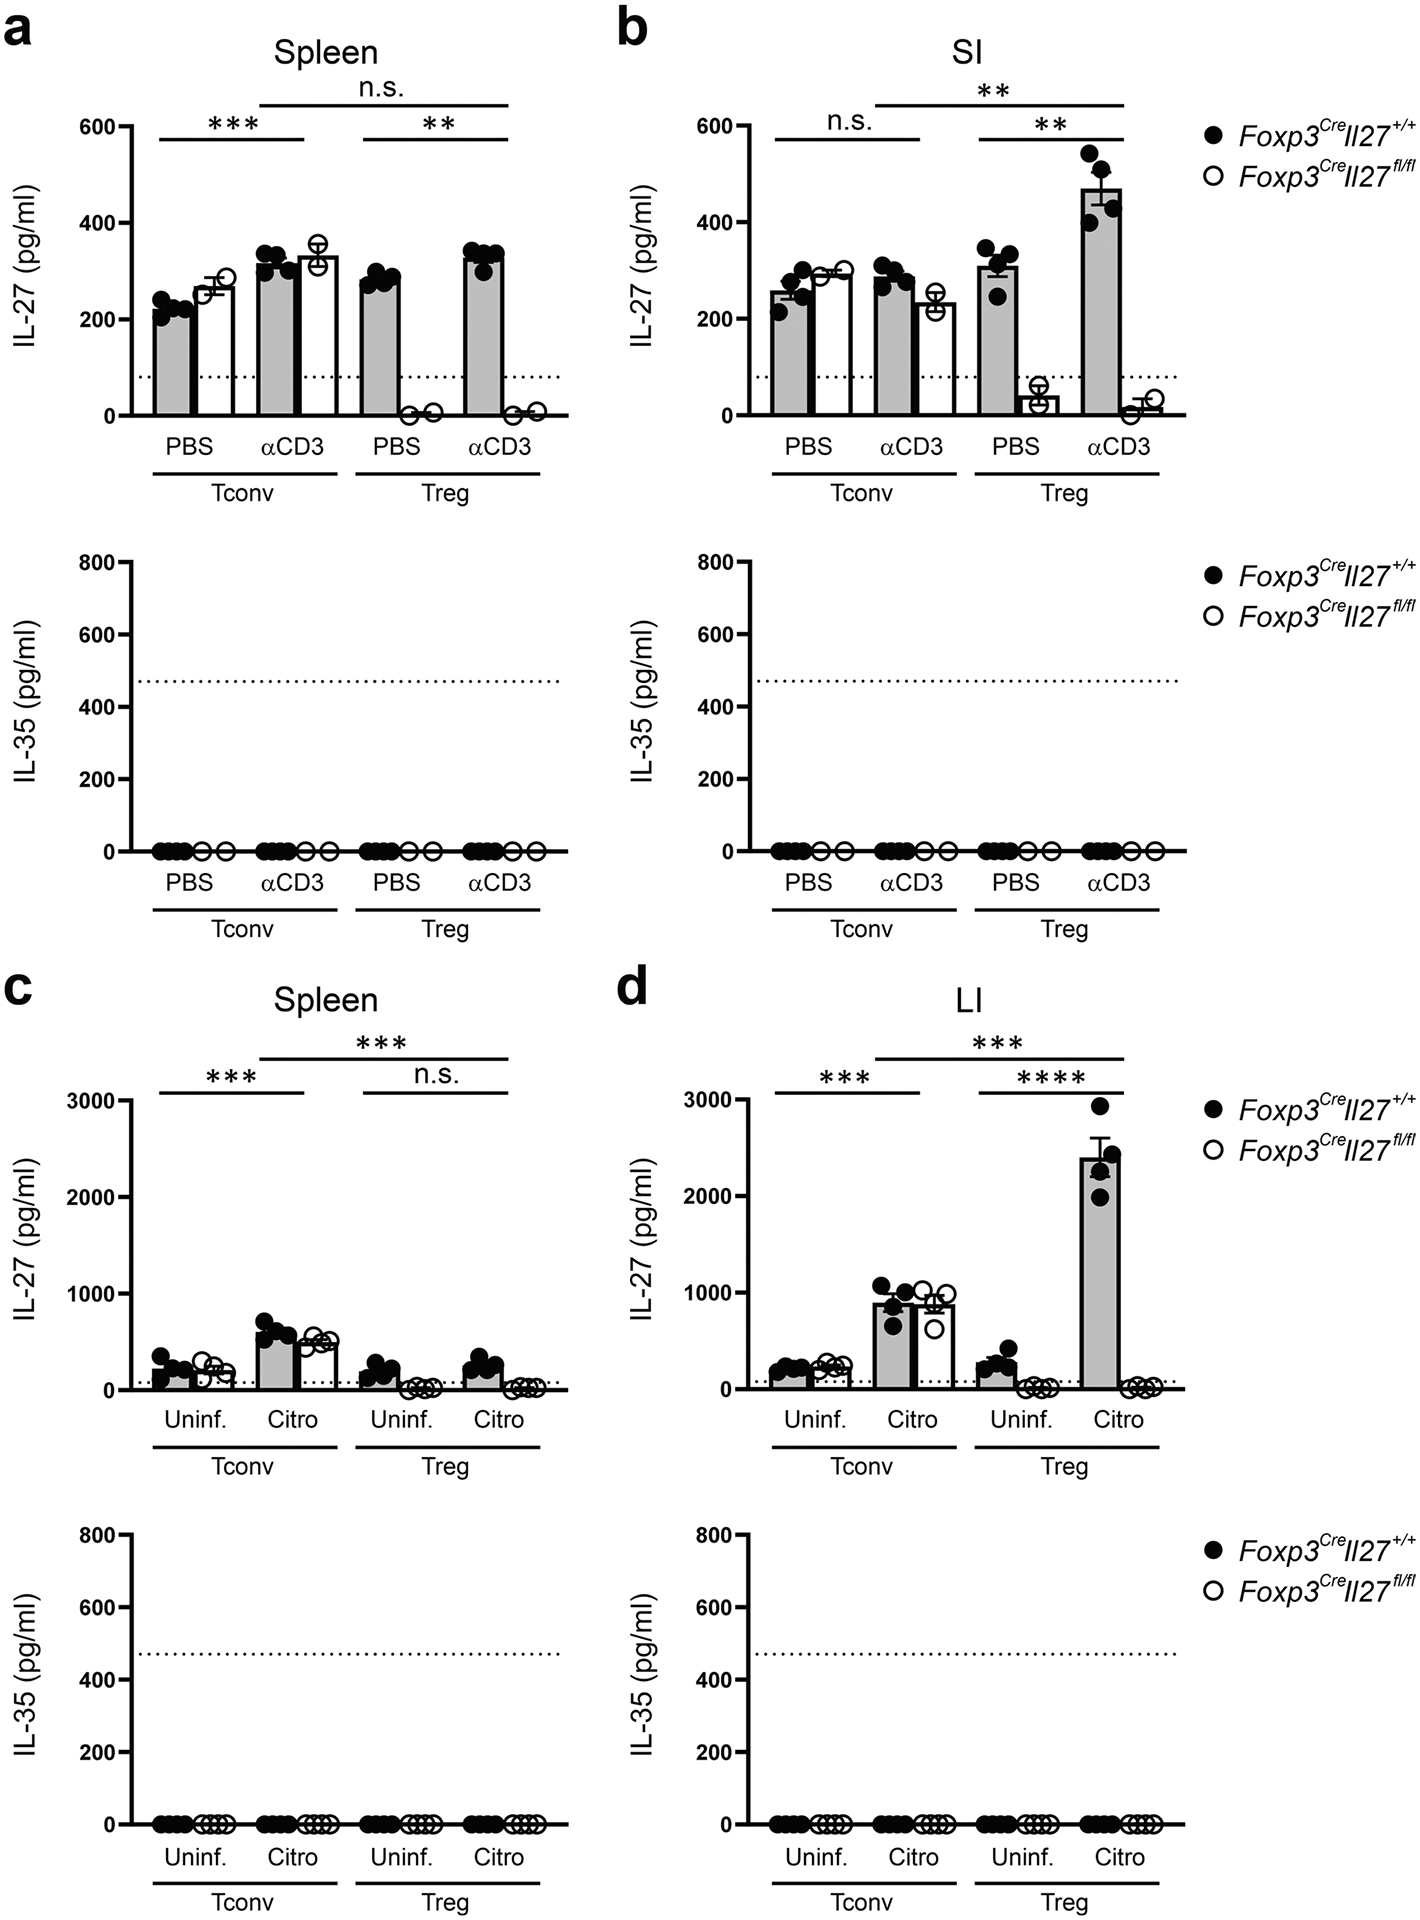
ELISA analyses of the production of IL-27 or IL-35 by Tconv and Treg cells in a, spleen and b, SI LP from PBS or aCD3 mAb treated Foxp3CreIl27fl/fl mice and WT littermates. Each symbol represents FACS-isolated cell sample pooled from two to three mice (n = 4 for Foxp3CreIl27+/+; 2 for Foxp3CreIl27fll/fl). ELISA analyses of the production of IL-27 or IL-35 by Tconv and Treg cells in c, spleen and d, LI LP from Foxp3CreIl27fl/fl mice and WT littermates at day 10 post C. rodentium infection. Each symbol represents FACS-isolated cell sample pooled from two to three mice (n = 4). Dotted line represents the minimum detection limit of the indicated cytokine. Data are presented as mean values +/− SD. In a, n.s. = 0.4560 (top); ***P = 0.0003 (bottom left); **P = 0.0090 (bottom right). In b, **P = 0.0021 (top); n.s. = 0.2264 (bottom left); **P = 0.0074 (bottom right). In c, ***P = 0.0005 (top), ***P = 0.0010 (bottom left), n.s. = 0.2535 (bottom right). In d, ***P = 0.0005 (top), ***P = 0.0003 (bottom left), ****P < 0.0001 (bottom right). Statistical significance was determined by two-tailed unpaired t test.
Extended Data Fig. 7 |. Expression of known intestinal Treg cell markers in different Treg cell clusters.
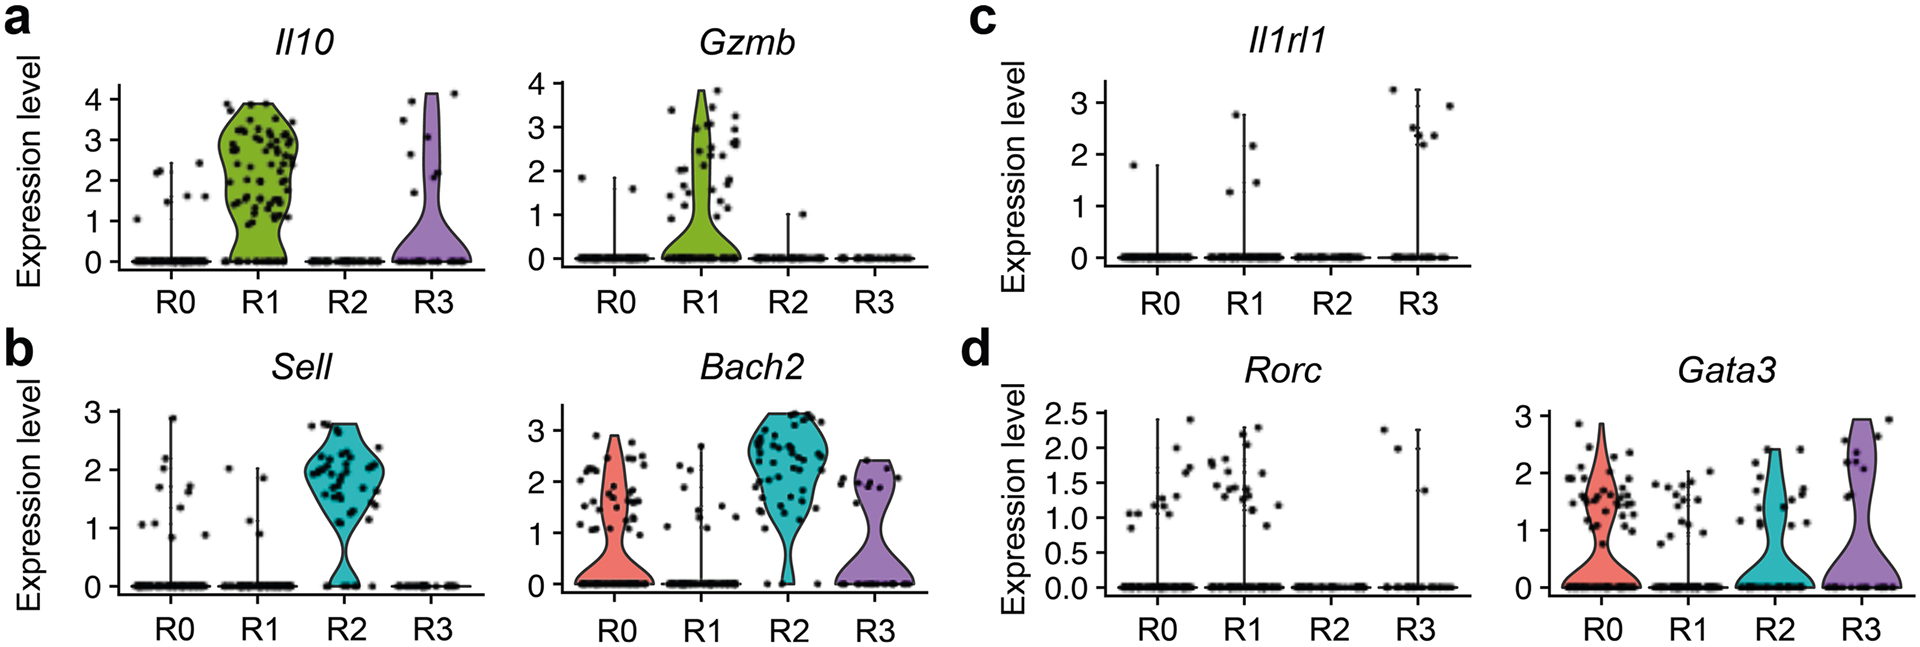
Violin plots of a, Il10 and Gzmb, b, Sell and Bach2, c, Il1rl1, and d, Rorc and Gata3 in different intestinal Treg cell clusters from C. rodentium-infected mice.
Acknowledgements
The present study was supported by the NIH (grant nos. AI108651, AI127751 and AI163813 to L.-F.L., DK110534 and DK120515 to H.C., AI126277, AI145325 and AI154644 to M.R. and AI132122 and BX005106 to J.T.C.). Work in M.R.’s laboratory is also supported by the University of California, San Diego, Center for Mucosal Immunology, Allergy, and Vaccines, Chiba University. M.R. holds an Investigator in the Pathogenesis of Infectious Disease Award from the Burroughs Wellcome Fund. R.P. is a BioLegend fellow. R.R.G. is partly supported by a fellowship from the Crohn’s and Colitis Foundation. We thank all members of our laboratory for discussions.
Competing interests
L.-F.L. is a scientific advisor for Elixiron Immunotherapeutics and receives research grants from AstraZeneca, Avidity Biosciences and Molecular Axiom. E.I., J.B., M.N., M.C. and R.A.M are or were employees of AstraZeneca and may own stock or stock options. As such, they declare that they are bound by confidentiality agreements that prevent them from disclosing their competing interests in this work. The remaining authors declare no competing interests.
Footnotes
Online content
Any methods, additional references, Nature Portfolio reporting summaries, source data, extended data, supplementary information, acknowledgements, peer review information; details of author contributions and competing interests; and statements of data and code availability are available at https://doi.org/10.1038/s41590-023-01667-y.
Reporting summary
Further information on research design is available in the Nature Portfolio Reporting Summary linked to this article.
Extended data is available for this paper at https://doi.org/10.1038/s41590-023-01667-y.
Supplementary information The online version contains supplementary material available at https://doi.org/10.1038/s41590-023-01667-y.
Peer review information Nature Immunology thanks Dan Littman and the other, anonymous, reviewer(s) for their contribution to the peer review of this work. L. A. Dempsey was the primary editor on this article and managed its editorial process and peer review in collaboration with the rest of the editorial team.
Data availability
All data are present in the article and supplementary information files are available from the corresponding authors upon reasonable request. RNA-seq data underlying Figs. 1 and 2 and Extended Data Fig. 1, as well as scRNA-seq data underlying Fig. 7 and Extended Data Fig. 7, are available from the National Center for Biotechnology Information under accession no. GSE217949. Source data are provided with this paper.
References
- 1.Josefowicz SZ, Lu LF & Rudensky AY Regulatory T cells: mechanisms of differentiation and function. Annu. Rev. Immunol 30, 531–564 (2012). [DOI] [PMC free article] [PubMed] [Google Scholar]
- 2.Campbell DJ & Koch MA Phenotypical and functional specialization of FOXP3+ regulatory T cells. Nat. Rev. Immunol 11, 119–130 (2011). [DOI] [PMC free article] [PubMed] [Google Scholar]
- 3.Munoz-Rojas AR & Mathis D Tissue regulatory T cells: regulatory chameleons. Nat. Rev. Immunol 21, 597–611 (2021). [DOI] [PMC free article] [PubMed] [Google Scholar]
- 4.Arpaia N et al. A distinct function of regulatory T cells in tissue protection. Cell 162, 1078–1089 (2015). [DOI] [PMC free article] [PubMed] [Google Scholar]
- 5.Burzyn D et al. A special population of regulatory T cells potentiates muscle repair. Cell 155, 1282–1295 (2013). [DOI] [PMC free article] [PubMed] [Google Scholar]
- 6.Ito M et al. Brain regulatory T cells suppress astrogliosis and potentiate neurological recovery. Nature 565, 246–250 (2019). [DOI] [PubMed] [Google Scholar]
- 7.Li Y et al. Insulin signaling establishes a developmental trajectory of adipose regulatory T cells. Nat. Immunol 22, 1175–1185 (2021). [DOI] [PubMed] [Google Scholar]
- 8.Rubtsov YP et al. IL-10 produced by regulatory T cells contributes to their suppressor function by limiting inflammation at environmental interfaces. Immunity 28, 546–558 (2008). [DOI] [PubMed] [Google Scholar]
- 9.Wei X et al. Reciprocal expression of IL-35 and IL-10 defines two distinct effector treg subsets that are required for maintenance of immune tolerance. Cell Rep. 21, 1853–1869 (2017). [DOI] [PubMed] [Google Scholar]
- 10.Yoshida H & Hunter CA The immunobiology of interleukin-27. Annu. Rev. Immunol 33, 417–443 (2015). [DOI] [PubMed] [Google Scholar]
- 11.Cretney E, Kallies A & Nutt SL Differentiation and function of Foxp3+ effector regulatory T cells. Trends Immunol. 34, 74–80 (2013). [DOI] [PubMed] [Google Scholar]
- 12.Levine AG, Arvey A, Jin W & Rudensky AY Continuous requirement for the TCR in regulatory T cell function. Nat. Immunol 15, 1070–1078 (2014). [DOI] [PMC free article] [PubMed] [Google Scholar]
- 13.Kim JM, Rasmussen JP & Rudensky AY Regulatory T cells prevent catastrophic autoimmunity throughout the lifespan of mice. Nat. Immunol 8, 191–197 (2007). [DOI] [PubMed] [Google Scholar]
- 14.Batten M et al. Interleukin 27 limits autoimmune encephalomyelitis by suppressing the development of interleukin 17-producing T cells. Nat. Immunol 7, 929–936 (2006). [DOI] [PubMed] [Google Scholar]
- 15.Stumhofer JS et al. Interleukin 27 negatively regulates the development of interleukin 17-producing T helper cells during chronic inflammation of the central nervous system. Nat. Immunol 7, 937–945 (2006). [DOI] [PubMed] [Google Scholar]
- 16.Awasthi A et al. A dominant function for interleukin 27 in generating interleukin 10-producing anti-inflammatory T cells. Nat. Immunol 8, 1380–1389 (2007). [DOI] [PubMed] [Google Scholar]
- 17.Hall AO et al. The cytokines interleukin 27 and interferon-gamma promote distinct Treg cell populations required to limit infection-induced pathology. Immunity 37, 511–523 (2012). [DOI] [PMC free article] [PubMed] [Google Scholar]
- 18.Collison LW et al. The inhibitory cytokine IL-35 contributes to regulatory T-cell function. Nature 450, 566–569 (2007). [DOI] [PubMed] [Google Scholar]
- 19.Merger M et al. Defining the roles of perforin, Fas/FasL, and tumour necrosis factor alpha in T cell induced mucosal damage in the mouse intestine. Gut 51, 155–163 (2002). [DOI] [PMC free article] [PubMed] [Google Scholar]
- 20.Lin CH et al. Gut epithelial IL-27 confers intestinal immunity through the induction of intraepithelial lymphocytes. J. Exp. Med 218, e20210021 (2021). [DOI] [PMC free article] [PubMed] [Google Scholar]
- 21.Esplugues E et al. Control of TH17 cells occurs in the small intestine. Nature 475, 514–518 (2011). [DOI] [PMC free article] [PubMed] [Google Scholar]
- 22.Xu ZS et al. FAM64A positively regulates STAT3 activity to promote Th17 differentiation and colitis-associated carcinogenesis. Proc. Natl Acad. Sci. USA 116, 10447–10452 (2019). [DOI] [PMC free article] [PubMed] [Google Scholar]
- 23.Pastille E et al. Transient ablation of regulatory T cells improves antitumor immunity in colitis-associated colon cancer. Cancer Res. 74, 4258–4269 (2014). [DOI] [PubMed] [Google Scholar]
- 24.Korn T & Kallies A T cell responses in the central nervous system. Nat. Rev. Immunol 17, 179–194 (2017). [DOI] [PubMed] [Google Scholar]
- 25.Khader SA, Gaffen SL & Kolls JK Th17 cells at the crossroads of innate and adaptive immunity against infectious diseases at the mucosa. Mucosal Immunol. 2, 403–411 (2009). [DOI] [PMC free article] [PubMed] [Google Scholar]
- 26.Ishigame H et al. Differential roles of interleukin-17A and −17F in host defense against mucoepithelial bacterial infection and allergic responses. Immunity 30, 108–119 (2009). [DOI] [PubMed] [Google Scholar]
- 27.Kimura D et al. Interleukin-27-producing CD4+ T cells regulate protective immunity during malaria parasite infection. Immunity 44, 672–682 (2016). [DOI] [PubMed] [Google Scholar]
- 28.Dupont CD, Christian DA & Hunter CA Immune response and immunopathology during toxoplasmosis. Semin. Immunopathol 34, 793–813 (2012). [DOI] [PMC free article] [PubMed] [Google Scholar]
- 29.Tanoue T, Atarashi K & Honda K Development and maintenance of intestinal regulatory T cells. Nat. Rev. Immunol 16, 295–309 (2016). [DOI] [PubMed] [Google Scholar]
- 30.Yang BH et al. TCF1 and LEF1 control Treg competitive survival and Tfr development to prevent autoimmune diseases. Cell Rep. 27, 3629–3645.e3626 (2019). [DOI] [PMC free article] [PubMed] [Google Scholar]
- 31.Miragaia RJ et al. Single-cell transcriptomics of regulatory T cells reveals trajectories of tissue adaptation. Immunity 50, 493–504.e497 (2019). [DOI] [PMC free article] [PubMed] [Google Scholar]
- 32.Grant FM et al. BACH2 drives quiescence and maintenance of resting Treg cells to promote homeostasis and cancer immunosuppression. J. Exp. Med 217, e20190711 (2020). [DOI] [PMC free article] [PubMed] [Google Scholar]
- 33.Rao DA, Arazi A, Wofsy D & Diamond B Design and application of single-cell RNA sequencing to study kidney immune cells in lupus nephritis. Nat. Rev. Nephrol 16, 238–250 (2020). [DOI] [PMC free article] [PubMed] [Google Scholar]
- 34.Kreiser S et al. Murine CD83-positive T cells mediate suppressor functions in vitro and in vivo. Immunobiology 220, 270–279 (2015). [DOI] [PubMed] [Google Scholar]
- 35.Liu J, Guan X & Ma X Regulation of IL-27 p28 gene expression in macrophages through MyD88- and interferon-gamma-mediated pathways. J. Exp. Med 204, 141–152 (2007). [DOI] [PMC free article] [PubMed] [Google Scholar]
- 36.Wang S et al. MyD88 adaptor-dependent microbial sensing by regulatory T cells promotes mucosal tolerance and enforces commensalism. Immunity 43, 289–303 (2015). [DOI] [PMC free article] [PubMed] [Google Scholar]
- 37.Villarino A et al. The IL-27R (WSX-1) is required to suppress T cell hyperactivity during infection. Immunity 19, 645–655 (2003). [DOI] [PubMed] [Google Scholar]
- 38.Takeda A et al. Cutting edge: role of IL-27/WSX-1 signaling for induction of T-bet through activation of STAT1 during initial Th1 commitment. J. Immunol 170, 4886–4890 (2003). [DOI] [PubMed] [Google Scholar]
- 39.Lee HM et al. IFNgamma signaling endows DCs with the capacity to control type I inflammation during parasitic infection through promoting T-bet+ regulatory T cells. PLoS Pathog. 11, e1004635 (2015). [DOI] [PMC free article] [PubMed] [Google Scholar]
- 40.Ohnmacht C et al. MUCOSAL IMMUNOLOGY. The microbiota regulates type 2 immunity through RORgammat+ T cells. Science 349, 989–993 (2015). [DOI] [PubMed] [Google Scholar]
- 41.Sefik E et al. MUCOSAL IMMUNOLOGY. Individual intestinal symbionts induce a distinct population of RORgamma+ regulatory T cells. Science 349, 993–997 (2015). [DOI] [PMC free article] [PubMed] [Google Scholar]
- 42.Andrews C, McLean MH & Durum SK Interleukin-27 as a novel therapy for inflammatory bowel disease: a critical review of the literature. Inflamm. Bowel Dis 22, 2255–2264 (2016). [DOI] [PMC free article] [PubMed] [Google Scholar]
- 43.Imielinski M et al. Common variants at five new loci associated with early-onset inflammatory bowel disease. Nat. Genet 41, 1335–1340 (2009). [DOI] [PMC free article] [PubMed] [Google Scholar]
- 44.Cox JH et al. IL-27 promotes T cell-dependent colitis through multiple mechanisms. J. Exp. Med 208, 115–123 (2011). [DOI] [PMC free article] [PubMed] [Google Scholar]
- 45.Visperas A, Do JS, Bulek K, Li X & Min B IL-27, targeting antigen-presenting cells, promotes Th17 differentiation and colitis in mice. Mucosal Immunol. 7, 625–633 (2014). [DOI] [PMC free article] [PubMed] [Google Scholar]
- 46.Fontenot JD, Gavin MA & Rudensky AY Foxp3 programs the development and function of CD4+ CD25+ regulatory T cells. Nat. Immunol 4, 330–336 (2003). [DOI] [PubMed] [Google Scholar]
- 47.Liston A et al. Differentiation of regulatory Foxp3+ T cells in the thymic cortex. Proc. Natl Acad. Sci. USA 105, 11903–11908 (2008). [DOI] [PMC free article] [PubMed] [Google Scholar]
- 48.Crepin VF, Collins JW, Habibzay M & Frankel G Citrobacter rodentium mouse model of bacterial infection. Nat. Protoc 11, 1851–1876 (2016). [DOI] [PubMed] [Google Scholar]
- 49.Thaker AI, Shaker A, Rao MS & Ciorba MA Modeling colitis-associated cancer with azoxymethane (AOM) and dextran sulfate sodium (DSS). J. Vis. Exp 67, 4100 (2012). [DOI] [PMC free article] [PubMed] [Google Scholar]
- 50.Hu S et al. cGAS restricts colon cancer development by protecting intestinal barrier integrity. Proc. Natl Acad. Sci. USA 118, e2105747118 (2021). [DOI] [PMC free article] [PubMed] [Google Scholar]
Associated Data
This section collects any data citations, data availability statements, or supplementary materials included in this article.
Data Availability Statement
All data are present in the article and supplementary information files are available from the corresponding authors upon reasonable request. RNA-seq data underlying Figs. 1 and 2 and Extended Data Fig. 1, as well as scRNA-seq data underlying Fig. 7 and Extended Data Fig. 7, are available from the National Center for Biotechnology Information under accession no. GSE217949. Source data are provided with this paper.


