

Abstract
The composition of the fecal microflora of 10 healthy subjects was monitored before (6-month control period), during (6-month test period), and after (3-month posttest period) the administration of a milk product containing Lactobacillus rhamnosus DR20 (daily dose, 1.6 × 10⁹ lactobacilli). Monthly fecal samples were examined by a variety of methods, including bacteriological culture analysis, fluorescent in situ hybridization with group-specific DNA probes, denaturing gradient gel electrophoresis of the V2-V3 region of 16S rRNA genes amplified by PCR, gas-liquid chromatography, and bacterial enzyme activity analysis. The composition of the Lactobacillus population of each subject was analyzed by pulsed-field gel electrophoresis of bacterial DNA digests in order to differentiate between DR20 and other strains present in the samples. Representative isolates of lactobacilli were identified to the species level by sequencing the V2-V3 region of their 16S rRNA genes and comparing the sequences obtained (BLAST search) to sequences in the GenBank database. DR20 was detected in the feces of all of the subjects during the test period, but at different frequencies. The presence of DR20 among the numerically predominant strains was related to the presence or absence of a stable indigenous population of lactobacilli during the control period. Strain DR20 did not persist at levels of >102 cells per g in the feces of most of the subjects after consumption of the product ceased; the only exception was one subject in which this strain was detected for 2 months during the posttest period. We concluded that consumption of the DR20-containing milk product transiently altered the Lactobacillus and enterococcal contents of the feces of the majority of consumers without markedly affecting biochemical or other bacteriological factors.
The large bowel of humans is colonized by a complex microbial community that is often referred to as the intestinal microflora. This community includes possibly hundreds of bacterial species, although it is thought that 30 to 40 species account for 99% of the cells in the community (3). The collection of bacteria detected in feces reflects the bacteria present in the distal large bowel, so studies of the human intestinal microflora usually involve analyses of the bacterial community in fecal samples (16). Interest in the intestinal microflora has been stimulated in recent years by the development and marketing of preparations of living microbial cells that, when consumed, are believed to influence the composition of the intestinal microflora and to benefit the well-being of the consumer. These preparations are known as “probiotics” (5).
Lactobacilli are commonly used as probiotic bacteria. Although greatly outnumbered by obligately anaerobic bacterial species in the intestinal tract, lactobacilli are often detected in fecal samples. Indeed, particular Lactobacillus strains have been found to be long-term residents of the intestinal tracts of some humans. In other humans, lactobacilli are undetectable or the strain composition of the Lactobacillus population changes temporally (11, 13).
Traditionally, the fecal microflora has been analyzed by using bacteriological culture methods. Although it has been claimed that approximately 88% of the total microscopic counts of bacterial cells can be cultivated from feces when appropriate techniques are employed (17), other estimates are less optimistic, and it is clear that a major proportion of the microflora detected by microscopy is currently uncultivable (19). Fortunately, there are molecular techniques which can be used to deal with this problem; these techniques include fluorescent in situ hybridization (FISH) performed with DNA probes that target 16S rRNA sequences and PCR which amplifies hypervariable 16S ribosomal DNA (rDNA) sequences coupled with denaturing gel electrophoresis (4, 18, 19). Additionally, microbial metabolic products can be detected and measured in order to provide indicators of the overall status of the intestinal microflora (9).
In this paper, we describe the results of a long-term study in which healthy human subjects consumed a probiotic product containing viable cells of Lactobacillus rhamnosus DR20, whose probiotic activity influences the natural and adaptive immune systems (6). We measured the impact of consumption of this probiotic on the fecal microflora by using a variety of methods, including selective and nonselective culture techniques, molecular typing of Lactobacillus isolates, FISH, PCR-denaturing gradient gel electrophoresis (DGGE), bacterial enzyme analysis, and short-chain fatty acid analysis.
MATERIALS AND METHODS
Human subjects, probiotic administration, and sampling.
Ten healthy subjects (five females and five males) who were between 25 and 55 years old participated in this study, which was approved by the Southern Regional Health Authority Ethics Committee and was divided into three parts. The study began with a 6-month control period during which the subjects consumed daily 32 g of low-lactose, low-fat milk powder (JENTAL; New Zealand Dairy Board) reconstituted in 250 ml of cold water. A monthly fecal sample was obtained from each subject. During the test period that followed, the subjects consumed each day for 6 months 32 g of reconstituted milk powder that contained approximately 5.1 × 10⁷ CFU of freeze-dried L. rhamnosus DR20 per g, which resulted in a daily dose of about 1.6 × 10⁹ lactobacilli. The bacteriological characteristics of DR20 have been described previously by Prasad et al. (21). Single fecal samples were obtained from each subject at monthly intervals. Finally, there was a 3-month posttest period during which the subjects consumed neither reconstituted milk nor L. rhamnosus DR20. In all other respects, the subjects maintained their usual food intake and lifestyles. A 4-day food diary was completed by 9 of the 10 subjects during the posttest period. The diary was analyzed (to determine the percentages of total energy obtained from different food groups) by workers at the Department of Human Nutrition, University of Otago. Eight subjects completed the entire study, while the other two subjects provided six control period samples but, due to absence overseas, only two test period samples and one posttest period sample. The numbers of Lactobacillus CFU per gram of probiotic powder were determined throughout the study to ensure that the appropriate numbers of lactobacilli were present in the preweighed aliquots of the probiotic preparation, which were stored in sachets under nitrogen at room temperature. Only lactobacilli were present in the preparation, and viability did not vary during the study period.
Examination of fecal samples.
Fecal samples were placed in an anaerobic glove box within 1 h of collection. A weighed sample (about 1 g) was homogenized in prereduced brain heart infusion broth and diluted 10-fold to 10−8 in the same medium, as described previously (13). Portions (100 μl) of each dilution were spread onto the surfaces of plates which contained the following agar media and were incubated anaerobically at 37°C: supplemented brucella blood agar (24) (2 days, total anaerobic CFU), bacteroides bile esculin agar (24) (2 days, Bacteroides fragilis group), egg yolk agar (after equal volumes of 95% ethanol were added to the dilutions and the preparations stood for 30 min to select for clostridial spores) (22) (2 days, clostridia), and Rogosa SL agar (Difco) (2 days for lactobacilli and 4 days for bifidobacteria, after Lactobacillus colonies were marked at 2 days). The dilutions were removed from the anaerobic glove box and were used to inoculate (100-μl inocula) plates which contained the following media and were incubated aerobically at 37°C: supplemented brucella blood agar (2 days, total aerobic CFU), MacConkey agar (Difco) (1 day, enterobacteria), bile esculin azide agar (Difco) (1 day, enterococci), and Sabouraud dextrose agar containing 50 μg of chloramphenicol per ml (Difco) (2 days, yeasts). To analyze the total Lactobacillus population, 10 colonies were picked at random from a dilution agar plate containing about 100 colonies. The isolates were differentiated by performing pulsed-field gel electrophoresis (PFGE) of ApaI-digested DNA as described previously (13).
Weighed fecal samples were diluted approximately 1:10 in 0.1 M sodium phosphate broth (pH 6.5) and used to measure β-glucuronidase activity (15). Similarly, a fecal homogenate in 0.01 M potassium phosphate buffer (pH 7.0) was used to measure the azoreductase activity of each sample (14). Suspensions prepared in pH 6.5 buffer were also used to determine the concentrations of short-chain fatty acids by gas-liquid chromatography (model GC-17A chromatograph; Shimadzu Corporation, Tokyo, Japan) performed with a DB-FFAP column (J & W Scientific, Folsum, Calif.) as described by Macfarlane and colleagues (12).
For the FISH analysis performed with group-specific 16S rRNA-targeted oligonucleotide probes, six fecal samples (two control samples, two test samples, and two posttest samples) from the eight subjects who completed the entire study were fixed with paraformaldehyde and transported to the University of Groningen on dry ice. The fixation method used included homogenization of 0.5 g of feces in 4.5 ml of phosphate-buffered saline at pH 7.4. The homogenate was centrifuged at 700 × g to remove the large particles, and then 1 ml of supernatant was added to 3 ml of a freshly prepared 4% paraformaldehyde solution. After storage overnight at 4°C, the preparations were stored at −80°C until they were analyzed. The following five probes were used to enumerate bacterial groups in the fecal samples: Bact338 (total bacteria), Bac303 (Bacteroides and Prevotella spp.), Erec482 (Eubacterium rectale and Clostridium coccoides), ELGC01 (gram-positive, low-G+C-content, group 2 bacteria), Ato291 (Atopobium, Eggerthella, and Collinsella spp.), and Bif164 (Bifidobacterium spp.). Samples were also stained with 4′,6-diamidino-2-phenylindole (DAPI) to obtain total counts. Harmsen et al. have described the method used previously (4; H. J. M. Harmsen, A. C. M. Wildeboer-Veloo, J. Grijpstra, J. Knol, J. E. Degener, and G. W. Welling, submitted for publication).
Examination of fecal samples by PCR-DGGE.
Three fecal samples (mid-control period, mid-test period, mid-posttest period) from each subject were also examined by determining PCR-DGGE profiles. To extract bacterial DNA, 1 ml of fecal homogenate in pH 7.0 phosphate buffer (the buffer used for the azoreductase assay) was centrifuged at 14,600 × g for 5 min (5°C). DNA was extracted from the resulting pellet with a FastDNA kit (BIO 101, Vista, Calif.) by using CLS-TC (a cell lysis solution used for animal tissues and bacteria) and a 0.25-in. sphere plus garnet matrix as recommended by the manufacturer. The V2-V3 region of the 16S rDNA gene (positions 339 to 539 in the Escherichia coli gene) of bacteria in the fecal samples was amplified by using primers HDA1-GC (5′-CGC CCG GGG CGC GCC CCG GGC GGG GCG GGG GCA CGG GGG GAC TCC TAC GGG AGG CAG CAG T-3′; boldface type indicates the GC clamp) and HDA2 (5′-GTA TTA CCG CGG CTG CTG GCA C-3′). Turner et al. originally described the HDA primers (S. J. Turner, G. D. Lewis, D. J. Saul, C. S. Baker, and A. G. Rodrigo, N. Z. Microbiol. Soc. Annu. Meet., poster paper, 1998). PCR was performed with 0.2-ml tubes by using a PCR Express thermal cycler (Hybaid, Teddington, United Kingdom). Each reaction mixture (50 μl) contained reaction buffer (10 mM [final concentration] Tris-HCl, 2.5 mM [final concentration] MgCl2, 50 mM [final concentration] KCl [pH 8.3]), each deoxynucleoside triphosphate at a concentration of 200 μM, 20 pmol of each primer, 1 μl of fecal DNA, and 2.5 U of Taq DNA polymerase (Boehringer, Mannheim, Germany). The following amplification program was used: 94°C for 3 min, 30 cycles consisting of 94°C for 30 s, 56°C for 30 s, and 68°C for 60 s, and then 7 min at 68°C. DGGE was performed by using a DCode universal mutation detection system (Bio-Rad, Richmond, Calif.) and gels that were 16 cm by 16 cm by 1 mm; 6% polyacrylamide gels were prepared and electrophoresed with 1× TAE buffer prepared from 50× TAE buffer (2 M Tris base, 1 M glacial acetic acid, 50 mM EDTA). The denaturing gradient was formed by using two 6% acrylamide (acrylamide/bisacrylamide ratio, 37.5:1) stock solutions (Bio-Rad). The gels contained a 22 to 55% gradient of urea and formamide that increased in the direction of electrophoresis. A 100% denaturing solution contained 40% (vol/vol) formamide and 7.0 M urea. Electrophoresis was performed at 130 V (constant voltage) and 60°C for about 4.5 h. Electrophoresis was stopped when a xylene cyanol dye marker reached the bottom of a gel. The gels were stained with an ethidium bromide solution (5 μg/ml) for 20 min, washed with deionized water, and viewed by UV transillumination.
DNA extracts from the control period, test period, and posttest period samples obtained from subject 2 were tested for the presence of L. rhamnosus by using PCR and species-specific primers (25).
Identification of Lactobacillus isolates.
One isolate representing each strain detected during the course of the study was identified to the species level. To do this, we amplified and sequenced one polynucleotide strand of the V2-V3 region of the 16S rRNA gene of the isolate and conducted a search of sequences deposited in the GenBank DNA database by using the BLAST algorithm (1). The identities of the isolates were determined on the basis of the highest scores (25). The V2-V3 region was amplified by using primers HDA1 (lacking the GC clamp) and HDA2 and the thermal cycler program used for the DGGE analysis, as described above. Sequencing was carried out by workers at the Centre for Gene Research, University of Otago, who used the dideoxy method of Sanger et al. (22) and a PRISM BigDye Ready Reaction terminator cycle sequencing kit (Applied Biosystems, Inc., Foster City, Calif.) in combination with an Applied Biosystems model 377A automated sequencing system. Nucleotide sequence data were analyzed by using the SeqEd program, version 1.0.3 (Applied Biosystems, Inc.). All of the isolates were catalase negative and produced lactic acid as the major fermentation product from glucose (10).
RESULTS
Bacteriological results.
Consumption of the DR20-containing reconstituted milk during the test period resulted in a greater frequency of detection (100%) of lactobacilli in fecal samples compared to the control period (76%) and posttest period (84%) samples (Fisher's exact test; P < 0.0001 and P = 0.0105, respectively). The frequencies of detection in the control and posttest periods did not differ. The number of Lactobacillus CFU per gram was higher during the test period (median, 5.8 log10 CFU/g; range, 4.1 to 9.3 log10 CFU/g; n = 52) than during the control period (median, 4.5 log10 CFU/g; range, <2.0 to 9.6 log10 CFU/g; n = 60; Mann-Whitney test; P = 0.0004) (Table 1). The control period and posttest period data (median, 5.3 log10 CFU/g; range, <2.0 to 8.4 log10 CFU/g; n = 26) did not differ (P = 0.3397). The frequency of detection of enterococci was greater during the test period than during the control and posttest periods (98, 85, and 76%, respectively; Fisher's exact test; P = 0.0191 and P = 0.0048, respectively). The number of enterococcal CFU was higher during the test period (median, 5.2 log10 CFU/g; range, <2.0 to 6.9 log10 CFU/g; n = 52) than during the control period (median, 3.5 log10 CFU/g; range, <2.0 to 7.8 log10 CFU/g; n = 60) or the posttest period (median, 4.1 log10 CFU/g; range, <2.0 to 7.4 log10 CFU/g; n = 26) (Mann-Whitney test; P = 0.0006 and P = 0.0161, respectively) (Table 2). The control period and posttest period data did not differ (P = 0.9606).
TABLE 1.
Populations of lactobacilli in fecal samples
| Subject |
Lactobacillus population (log10 bacteria/g)
|
||
|---|---|---|---|
| Control period (n = 6) | Test period (n = 6) | Posttest period (n = 3) | |
| 1 | <2.0 (<2.0–4.4)a | 5.4 (0.3)bc | 6.9d |
| 2 | 8.3 (0.5)b | 8.8 (0.1)b | 8.3 (0.1)b |
| 3 | 5.1 (0.6)b | 5.8 (0.1)b | 4.2 (0.5)b |
| 4 | <2.0 (<2.0–5.6)a | 5.4 (0.1)b | 5.2 (<2.0–6.0)a |
| 5 | 3.4 (0.2)b | 5.4 (0.1)b | 4.4 (1.0)b |
| 6 | 7.5 (0.4)b | 7.7 (0.4)b | 7.2 (0.5)b |
| 7 | 6.1 (0.5)b | 5.0 (0.2)b | 5.7 (0.5)b |
| 8 | <2.0 (<2.0–2.5)a | 5.0 (0.9)bc | <2.0d |
| 9 | 5.5 (0.1)b | 5.4 (0.2)b | 4.4 (0.2)b |
| 10 | 3.8 (<2.0–5.5)a | 6.8 (0.3)b | <2.0 (<2.0–7.8)a |
Median (range).
Mean (standard error of the mean).
n = 2.
n = 1.
TABLE 2.
Populations of enterococci in fecal samples
| Subject | Enterococcal population (log10 bacteria/g)
|
||
|---|---|---|---|
| Control period (n = 6) | Test period (n = 6) | Posttest period (n = 3) | |
| 1 | 3.5 (<2.0–5.2)a | 4.3 (0.8)bc | 3.2d |
| 2 | <2.0 (<2.0–5.4)a | 5.5 (0.3)b | <2.0 (<2.0–2.8)a |
| 3 | 4.8 (0.4)b | 5.5 (0.2)b | 7.1 (0.1)b |
| 4 | 3.5 (<2.0–3.5)a | 4.5 (0.5)b | 5.0 (0.7)b |
| 5 | 5.5 (0.3)b | 4.7 (0.5)b | 4.4 (0.8)b |
| 6 | 3.3 (<2.0–4.9)a | 3.7 (0.8)b | 2.8 (<2.0–4.3)a |
| 7 | 5.4 (0.3)b | 5.3 (0.1)b | 2.5 (<2.0–5.3)a |
| 8 | 3.0 (0.1)b | 5.8 (1.1)bc | <2.0d |
| 9 | 3.4 (<2.0–7.8)a | 4.6 (0.6)b | 4.1 (<2.0–4.6)a |
| 10 | 3.8 (0.4)b | 4.6 (0.6)b | 4.8 (0.2)b |
Median (range).
Mean (standard error of the mean).
n = 2.
n = 1.
Comparisons of the numbers of total aerobic, bifidobacterial, lactose-fermenting enterobacterial, clostridial (spores), bacteroides (esculin-hydrolyzing and non-esculin-hydrolyzing forms were enumerated separately), and yeast CFU per gram (wet weight) did not reveal consistent differences in the data for the control, test, and posttest periods (Tables 3 through 9). Differences were observed for some populations in some subjects, but the differences appeared to be idiosyncratic rather than due to the consumption of the probiotic. These differences are indicated in footnotes to Tables 4 through 8. Non-lactose-fermenting enterobacteria were detected occasionally, but the occurrence of these bacteria did not differ in the various periods of the study (data not shown). The total anaerobic counts (Table 10) did not differ throughout the study for most of the subjects; the only exception was subject 5, whose test period and posttest period values were higher than the control period values (Welch's modified t test; P = 0.0173).
TABLE 3.
Total aerobic populations detected in fecal samples
| Subject | Total aerobic population (log10 CFU/g)
|
||
|---|---|---|---|
| Control period (n = 6) | Test period (n = 6) | Posttest period (n = 3) | |
| 1 | 7.3 (0.1)a | 6.8 (0.0)b | 7.7c |
| 2 | 6.6 (0.2) | 6.4 (0.1) | 6.2 (0.2) |
| 3 | 7.5 (0.1) | 7.0 (0.3) | 7.6 (0.3) |
| 4 | 7.2 (0.2) | 6.8 (0.2) | 7.0 (0.2) |
| 5 | 7.6 (0.3) | 8.2 (0.2) | 7.2 (0.5) |
| 6 | 6.8 (0.2) | 6.8 (0.5) | 7.1 (0.1) |
| 7 | 6.6 (0.1) | 6.8 (0.1) | 7.0 (0.2) |
| 8 | 7.4 (0.1) | 7.8 (0.4)b | 7.6c |
| 9 | 7.1 (0.1) | 7.7 (0.3) | 7.4 (0.1) |
| 10 | 7.7 (0.2) | 7.7 (0.1) | 7.7 (0.1) |
Mean (standard error of the mean).
n = 2.
n = 3.
TABLE 9.
Populations of yeasts in fecal samples
| Subject | Yeast population (log10 cells/g)
|
||
|---|---|---|---|
| Control period (n = 6) | Test period (n = 6) | Posttest period (n = 3) | |
| 1 | <2.0 (<2.0–2.0)a | <2.0b (<2.0–<2.0) | 2.0c |
| 2 | <2.0 (<2.0–<2.0)a | <2.0 (<2.0–2.9)a | <2.0 (<2.0–<2.0)a |
| 3 | 2.4 (0.2)d | 2.8 (<2.0–4.8)a | 2.0 (<2.0–2.0)a |
| 4 | <2.0 (<2.0–2.4)a | 2.0 (<2.0–3.7)a | <2.0 (<2.0–2.0)a |
| 5 | 2.7 (0.1)d | 3.1 (0.1)d | 2.8 (0.4)d |
| 6 | 4.0 (0.1)d | 3.9 (0.1)d | 3.8 (0.2)d |
| 7 | 3.4 (0.1)d | 3.5 (0.1)d | 3.4 (0.2)d |
| 8 | <2.0 (<2.0–3.0)a | <2.0 (<2.0–<2.0)ab | <2.0c |
| 9 | <2.0 (<2.0–<2.0)a | 2.6 (<2.0–3.9)a | <2.0 (<2.0–<2.0)a |
| 10 | <2.0 (<2.0–2.0)a | 2.2 (<2.0–3.1)a | <2.0 (<2.0–<2.0)a |
Median (range).
n = 2.
n = 1.
Mean (standard error of the mean).
TABLE 4.
Populations of bifidobacteria in fecal samples
| Subject | Bifidobacterial population (log10 bacteria/g)
|
||
|---|---|---|---|
| Control period (n = 6) | Test period (n = 6) | Posttest period (n = 3) | |
| 1 | 9.7 (0.1)a | 9.7 (0.1)b | 9.8c |
| 2 | 9.7 (0.2) | 9.7 (0.1) | 9.4 (0.1) |
| 3d | 9.6 (0.1) | 9.2 (0.1) | 8.8 (0.1) |
| 4 | 9.9 (0.1) | 9.7 (0.1) | 9.3 (0.1) |
| 5 | 9.7 (0.1) | 9.9 (0.1) | 9.2 (0.7) |
| 6 | 9.5 (0.1) | 9.2 (0.1) | 9.2 (0.2) |
| 7 | 9.6 (0.1) | 9.4 (0.1) | 9.3 (0.2) |
| 8 | 10.2 (0.1) | 10.3 (0.6)b | 9.7c |
| 9 | 9.7 (0.1) | 9.1 (0.1) | 9.1 (0.2) |
| 10e | 9.4 (0.1) | 9.9 (0.1) | 9.8 (0.1) |
Mean (standard error of the mean).
n = 2.
n = 1.
The control and posttest period values for subject 3 are different (Welch's modification of t test; P = 0.0073).
The control and test period values for subject 10 are different (P = 0.0006).
TABLE 8.
Populations of non-esculin-hydrolyzing Bacteroides in fecal samples
| Subject | Non-esculin-hydrolyzing Bacteroides population (log10 bacteria/g)
|
||
|---|---|---|---|
| Control period (n = 6) | Test period (n = 6) | Posttest period (n = 3) | |
| 1 | 9.5 (0.2)a | 9.2 (0.1)ab | 9.2c |
| 2d | 9.1 (0.2)a | 9.1 (0.1)a | 8.8 (0.1)a |
| 3 | 7.9 (1.6)a | 8.9 (0.2)a | 9.2 (0.2)a |
| 4 | 9.0 (0.1)a | 8.8 (0.1)a | 8.8 (0.1)a |
| 5 | 8.7 (0.2)a | 9.1 (0.1)a | 8.9 (0.5)a |
| 6 | 5.6 (1.7)a | 8.4 (<2.0–8.9)e | 7.8 (<2.0–8.0)e |
| 7 | 9.2 (0.1)a | 9.2 (0.1)a | 9.2 (0.1)a |
| 8 | 9.6 (0.2)a | 9.0 (0.1)ab | 8.7c |
| 9 | 8.9 (0.2)a | 8.8 (<2.0–9.3)e | 8.4 (0.5)a |
| 10 | 9.3 (0.2)a | 9.8 (0.1)a | 9.4 (0.2)a |
Mean (standard error of the mean).
n = 2.
n = 1.
The test and posttest period values for subject 2 are different (P = 0.0160).
Median (range).
TABLE 10.
Total anaerobic populations detected in fecal samples
| Subject | Total anaerobic population (log10 CFU/g)
|
||
|---|---|---|---|
| Control period (n = 6) | Test period (n = 6) | Posttest period (n = 3) | |
| 1 | 10.58 (0.06)a | 10.15 (0.15)b | 10.40c |
| 2 | 10.42 (0.13) | 10.53 (0.07) | 10.20 (0.05) |
| 3 | 10.43 (0.11) | 10.12 (0.06) | 10.13 (0.16) |
| 4 | 10.20 (0.11) | 10.03 (0.06) | 10.10 (0.20) |
| 5 | 10.17 (0.09) | 10.67 (0.03) | 10.60 (0.05) |
| 6 | 10.12 (0.14) | 9.82 (0.09) | 9.60 (0.15) |
| 7 | 10.30 (0.05) | 10.22 (0.07) | 10.27 (0.03) |
| 8 | 10.37 (0.18) | 10.25 (0.25)b | 10.50c |
| 9 | 10.43 (0.22) | 10.07 (0.16) | 9.50 (0.15) |
| 10 | 10.43 (0.09) | 10.35 (0.08) | 10.60 (0.10) |
Mean (standard error of the mean).
n = 2.
n = 1.
The azoreductase and β-glucuronidase values varied widely in most of the subjects throughout the study, and statistically significant differences did not occur as a result of administration of DR20 (Tables 11 and 12). The only exception was subject 6, whose azoreductase values were lower during the test period (Welch's modification of Student's t test; P < 0.0100). The concentrations of short-chain fatty acids were also highly variable for each subject, and differences did not occur as a result of probiotic administration (Table 13). The acetic acid and butyric acid concentrations were consistently lower in the feces of subject 5 than in the feces of the other subjects throughout the study.
TABLE 11.
Azoreductase activities in fecal samples
| Subject | Azoreductase activity (μmol/h/g of feces)
|
||
|---|---|---|---|
| Control period (n = 6) | Test period (n = 6) | Posttest period (n = 3) | |
| 1 | 1.05 (0.06)a | 1.01 (0.09)b | 3.15c |
| 2 | 0.96 (0.28) | 1.03 (0.15) | 1.15 (0.07) |
| 3 | 1.13 (0.18) | 1.04 (0.14) | 0.90 (0.13) |
| 4 | 1.64 (0.14) | 1.63 (0.20) | 1.23 (0.15) |
| 5 | 0.93 (0.17) | 0.82 (0.13) | 0.92 (0.14) |
| 6 | 2.39 (0.32) | 0.95 (0.11) | 1.28 (0.27) |
| 7 | 1.58 (0.29) | 1.25 (0.18) | 1.15 (0.22) |
| 8 | 1.14 (0.19) | 1.05 (0.23)b | 1.05c |
| 9 | 0.85 (0.17) | 0.79 (0.04) | 0.89 (0.12) |
| 10 | 1.46 (0.19) | 1.26 (0.07) | 1.98 (0.99) |
Mean (standard error of the mean).
n = 2.
n = 1.
TABLE 12.
β-Glucuronidase activities in fecal samples
| Subject | β-Glucuronidase activity (μmol/h/mg)a
|
||
|---|---|---|---|
| Control period (n = 6) | Test period (n = 6) | Posttest period (n = 3) | |
| 1 | 0.48 (0.09)b | 0.26 (0.05)c | 0.32d |
| 2 | 0.34 (0.14) | 0.58 (0.14) | 0.65 (0.06) |
| 3 | 0.51 (0.10) | 0.78 (0.26) | 1.05 (0.16) |
| 4 | 0.81 (0.24) | 1.08 (0.28) | 0.68 (0.36) |
| 5 | 0.56 (0.08) | 1.39 (0.51) | 0.84 (0.03) |
| 6 | 0.19 (0.03) | 0.35 (0.12) | 0.35 (0.06) |
| 7 | 0.20 (0.05) | 0.23 (0.08) | 0.28 (0.06) |
| 8 | 0.39 (0.10) | 1.63 (0.28)c | 2.05d |
| 9 | 0.41 (0.06) | 0.47 (0.15) | 1.44 (0.31) |
| 10 | 0.17 (0.06) | 0.24 (0.07) | 0.35 (0.08) |
Micromoles of p-nitrophenol released per hour per milligram of protein.
Mean (standard error of the mean).
n = 2.
n = 1.
TABLE 13.
Concentrations of short-chain fatty acids in fecal samples
| Subject | Short-chain fatty acid concn (mmol/kg [wet wt])
|
||||||||||||||
|---|---|---|---|---|---|---|---|---|---|---|---|---|---|---|---|
| Control period (n = 3)
|
Test period (n = 3)
|
Posttest period (n = 2)
|
|||||||||||||
| Acetic acid | Propionic acid | Isobutyric acid | Butyric acid | Isovaleric acid | Acetic acid | Propionic acid | Isobutyric acid | Butyric acid | Isovaleric acid | Acetic acid | Propionic acid | Isobutyric acid | Butyric acid | Isovaleric acid | |
| 1 | 46.9 (10.5)a | 17.5 (3.8) | 1.4 (0.4) | 14.1 (2.7) | 1.5 (0.5) | 87.6 (3.5) | 25.7 (2.7) | 1.2 (0.2) | 30.2 (3.9) | 1.0 (0.1) | 41.7 | 12.6 | 1.1 | 12.2 | 1.3 |
| 2 | 65.9 (19.5) | 22.1 (4.5) | 0.9 (0.1) | 26.1 (6.9) | 0.9 (0.1) | 75.7 (3.2) | 23.2 (0.5) | 1.0 (0.1) | 32.3 (3.9) | 0.9 (0.1) | 69.6 (6.4) | 21.8 (0.6) | 0.8 (0.4) | 23.1 (4.5) | 0.8 (0.3) |
| 3 | 68.4 (11.4) | 17.2 (1.9) | 2.5 (0.5) | 23.1 (4.4) | 3.2 (0.7) | 73.7 (14.4) | 23.2 (3.8) | 3.1 (1.0) | 20.2 (5.1) | 3.8 (1.3) | 58.9 (6.4 ) | 14.6 (0.6) | 1.4 (0.2) | 12.8 (2.2) | 1.7 (0.3) |
| 4 | 56.9 (11.5) | 11.5 (1.8) | 0.3 (0.1) | 12.4 (2.6) | 0.5 (0.1) | 98.8 (31.5) | 31.9 (12.4) | 3.1 (1.7) | 47.3 (20.7) | 3.7 (2.1) | 49.1 (26.1) | 12.4 (5.4) | 1.0 (0.3) | 17.9 (7.7) | 1.1 (0.3) |
| 5 | 31.4 (2.8) | 8.6 (1.5) | 0.8 (0.1) | 8.4 (1.2) | 1.4 (0.2) | 40.1 (3.1) | 12.4 (1.3) | 1.7 (0.2) | 11.6 (0.8) | 2.2 (0.4) | 23.8 (12.2) | 5.8 (2.1) | 0.7 (0.7) | 5.5 (1.7) | 1.2 (0.4) |
| 6 | 51.9 (8.2) | 13.0 (2.1) | 1.7 (0.5) | 14.9 (2.6) | 2.0 (0.7) | 70.3 (24.3) | 12.9 (3.8) | 0.9 (0.1) | 31.6 (7.5) | 1.0 (0.1) | 44.1 (11.8) | 15.1 (1.7) | 1.3 (0.1) | 9.7 (0.9) | 1.5 (0.1) |
| 7 | 69.9 (4.1) | 22.4 (0.6) | 2.5 (0.4) | 28.5 (1.8) | 3.0 (0.7) | 70.6 (5.6) | 23.6 (3.3) | 2.5 (0.3) | 28.0 (5.3) | 3.4 (0.2) | 55.6 (3.5) | 18.9 (3.9) | 1.0 (0.1) | 15.1 (3.2) | 1.6 (0.5) |
| 8 | 70.6 (3.0) | 15.7 (1.7) | 0.6 (0.3) | 17.6 (1.8) | 0.9 (0.1) | 49.4 (0.2) | 15.1 (3.0) | 1.4 (0.5) | 15.1 (4.7) | 1.7 (0.7) | 48.5 | 14.0 | 1.8 | 14.6 | 2.1 |
| 9 | 61.9 (15.0) | 28.9 (6.5) | 1.3 (0.2) | 22.9 (6.9) | 1.6 (0.4) | 59.0 (13.5) | 26.8 (3.9) | 1.7 (0.2) | 18.6 (4.1) | 2.0 (0.1) | 38.5 (19.7) | 15.6 (7.7) | 1.6 (0.2) | 12.7 (4.9) | 2.1 (0.2) |
| 10 | 56.6 (13.4) | 20.2 (2.2) | 1.6 (0.4) | 26.6 (5.0) | 2.1 (0.5) | 57.1 (11.2) | 17.1 (2.2) | 0.8 (0.4) | 24.3 (4.2) | 1.2 (0.4) | 36.5 (3.0) | 14.1 (1.4) | 1.7 (0.4) | 14.0 (2.5) | 2.2 (0.5) |
Mean (standard error of the mean). In most cases three fecal samples were assayed during the control or test period, one at the beginning of the period, one during the middle of the period, and one at the end of the period. For subjects 1 and 8 two samples were assayed during the test period and one sample was obtained during the posttest period.
Composition of the Lactobacillus population as determined by molecular typing.
L. rhamnosus DR20 was easily differentiated from other strains of lactobacilli on the basis of restriction fragment length polymorphic profiles produced by ApaI digestion of chromosomal DNA (Fig. 1). Molecular typing of isolates obtained during the study resulted in detection of 41 strains. As we observed previously (11, 13), each subject harbored a unique collection of Lactobacillus strains prior to administration of DR20 and in the posttest period, except that strain L5 was detected as the numerically dominant strain in both subject 2 and subject 6 (Fig. 2). The isolates obtained from these unrelated subjects had identical PFGE profiles as generated by both ApaI and SmaI. Furthermore, they belonged to the same species (see below). Strain L21 was detected in a single sample from subject 6 and in all but one of the samples from subject 7. These subjects lived in the same residence. L6 was detected in single samples from subjects 3 and 4. L43 was common in two posttest period samples from subject 4 but was detected in only one sample from subject 3. These subjects also lived in the same residence, so some degree of exposure to common strains of lactobacilli, perhaps present in food, or “cross-contamination” may have occurred. Strain L44 was detected in single samples from unrelated subjects 3 and 5, while L12 was detected commonly in subject 5 samples and on a single occasion in subject 3 samples. Strain DR20 was detected by the culture technique (>102 CFU per g [wet weight]) in all of the fecal samples collected from five subjects during the test period, five of six samples collected during the test period from one subject, two of six test period samples collected from one subject, and one of six samples collected from two subjects. DR20 was not cultured from the remaining subject; however, it was detected by PCR performed with L. rhamnosus-specific primers in fecal samples collected during the test period but not in control or posttest period samples. Thus, consumption of the probiotic preparation resulted in consistent detection of strain DR20 as a numerically dominant member of the Lactobacillus population in six of the subjects, inconsistent detection in three of the subjects, and detection only as a subdominant component of the population in one of the subjects (Fig. 2). The number of DR20 CFU per gram (wet weight) of feces could be calculated for samples in which this strain was numerically dominant, and the average value was 3.0 × 10⁵ CFU/g. Taking the average weight of the colon contents as 200 g, each subject harbored about 6.0 × 10⁷ CFU of DR20 in the large bowel. DR20 was not detected among the numerically predominant strains once consumption of the probiotic ceased except in the case of subject 3, in whom DR20 was detectable for 2 months during the posttest period. For the six subjects in which DR20 became numerically dominant during the test period, the strains of lactobacilli detected in the posttest period were different than the strains detected in the control period (Fig. 2). The same strains predominated during the control and posttest periods in the four subjects whose Lactobacillus population compositions were relatively unchanged during the test period (Fig. 2).
FIG. 1.
PFGE profiles of Lactobacillus strains isolated from subject 4. Lane 1, L6; lane 2, L17; lane 3, L37; lane 4, L43; lane 5, DR20.
FIG. 2.


Graphic representation of the strain compositions of Lactobacillus populations harbored by 10 human subjects during the control, test, and posttest periods of the study. For each graph, the x axis indicates the number of isolates, and the y axis indicates the sample number. The strains are identified by numbers, and DR20 is indicated by solid columns.
Identification of representative isolates of lactobacilli.
The identities of the 41 strains detected by molecular typing (one representative isolate of each strain was tested) are shown in Table 14. The majority of the isolates belonged to the Lactobacillus casei group that contains L. casei, Lactobacillus paracasei, L. rhamnosus, and Lactobacillus zeae. These species cannot be distinguished by V2-V3 sequence comparisons.
TABLE 14.
Identities of Lactobacillus strains
| Subject | Strain | GenBank accession no. | Species (or group) |
|---|---|---|---|
| 1 | L1 | AF158980 | L. brevis |
| L2 | AF158981 | L. plantarum group | |
| L3 | AF158982 | L. casei group | |
| L32 | AF159011 | L. casei group | |
| 2 | L4 | AF158983 | L. casei group |
| L5 | AF158984 | L. ruminis | |
| 3 | L6 | AF158986 | L. casei group |
| L7 | AF158987 | L. crispatus | |
| L8 | AF158988 | L. crispatus | |
| L9 | AF158989 | L. casei group | |
| L10 | AF158990 | L. plantarum group | |
| L11 | AF158991 | L. delbrueckii group | |
| L12 | AF158992 | L. plantarum group | |
| L13 | AF158993 | L. plantarum group | |
| L14 | AF158994 | L. casei group | |
| L15 | AF158995 | L. casei group | |
| L31 | AF159010 | L. brevis | |
| L33 | AF159012 | L. plantarum group | |
| L40 | AF159018 | L. viridescens (Weissella viridescens) | |
| L41 | AF159019 | L. casei group | |
| L43 | AF159021 | L. acidophilus | |
| L44 | AF159022 | L. gasseri | |
| 4 | L6 | AF158986 | L. casei group |
| L17 | AF158996 | L. crispatus | |
| L37 | AF159015 | L. casei group | |
| L43 | AF159021 | L. acidophilus | |
| 5 | L12 | AF158992 | L. plantarum group |
| L19 | AF158998 | L. casei group | |
| L20 | AF158999 | L. casei group | |
| L44 | AF159022 | L. gasseri | |
| L45 | AF159023 | L. plantarum group | |
| 6 | L5 | AF158984 | L. ruminis |
| L21 | AF159000 | L. salivarius subsp. salivarius | |
| L22 | AF159001 | L. casei group | |
| 7 | L21 | AF159000 | L. salivarius subsp. salivarius |
| L23 | AF159002 | L. ruminis | |
| L34 | AF159013 | L. salivarius subsp. salivarius | |
| 8 | L24 | AF159008 | L. brevis |
| L25 | AF159004 | L. casei group | |
| 9 | L26 | AF159005 | L. salivarius subsp. salivarius |
| 10 | L27 | AF159006 | L. casei group |
| L28 | AF159007 | L. casei group | |
| L29 | AF159008 | L. casei group | |
| L30 | AF159009 | L. casei group | |
| L31 | AF159010 | L. brevis | |
| L35 | AF159014 | L. acidophilus |
Comparison of results obtained by bacteriological culturing and FISH.
The numbers of bacterial cells belonging to the groups detected with the FISH probes and by DAPI staining did not differ in the control period, test period, and posttest period samples that were examined (data not shown). The FISH and DAPI data were compared with the data obtained for the same eight samples by bacteriological analysis in Table 15. Altogether, the total cell counts were higher when the organisms were detected by DAPI staining (10.88 ± 0.03 log10 CFU/g [mean ± standard error of the mean]) and with the Bact338 DNA probe (10.64 ± 0.05 log10 CFU/g) than when they were detected by culture on nonselective medium (10.21 ± 0.05 log10 CFU/g) (Welch's modification of Student's t test; P < 0.0001). DAPI staining gave higher counts than analysis with the Bact338 probe (P < 0.0001) for the following reasons: dividing cells may have contained two DAPI-stained chromosomes which were recognized as two cells by the automated counting system; the Bact338 probe sequence did not match sequences in all of the bacterial cells; some bacterial cells were not sufficiently permeable to the Bact338 probe; and some cells contained insufficient rRNA targeted by the probe. The bifidobacterial population data did not differ whether they were obtained by the culture technique (9.55 ± 0.05 log10 CFU/g) or FISH (9.43 ± 0.04 log10 CFU/g) (P = 0.1278), nor were the Bacteroides population data different (culture, 9.23 ± 0.07 log10 CFU/g; FISH, 9.31 ± 0.05 log10 CFU/g) (P = 0.3691).
TABLE 15.
Comparison of results obtained by bacteriological culture and FISH
| Subject | Log10 counts (CFU or cells) per g (wet wt) of feces
|
|||||||||
|---|---|---|---|---|---|---|---|---|---|---|
| Total cells (DAPI strain) | Total anaerobic CFU | Total bacterial cells (Bact338 probe) | Bifidobacterial CFU (Rogosa medium) | Bifidobacterial cells (Bif164 probe) | Bacteroides CFU (bacteroides bile esculin medium) | Bacteriodes- Prevotella cells (Bac303 probe) | Eubacterium rectale-Clostridium coccoides cells (Erec482 probe) | Low-G+C-content eubacterial cells (ELGC01 probe) | Atopobium- Eggerthella- Collinsella cells (Ato291 probe) | |
| 2 | 11.18 (0.03)a | 10.45 (0.13) | 10.98 (0.04) | 9.85 (0.18) | 9.74 (0.09) | 9.68 (0.22) | 9.92 (0.12) | 10.30 (0.04) | 9.93 (0.04) | 9.02 (0.06) |
| 3 | 10.85 (0.09) | 10.12 (0.09) | 10.57 (0.07) | 9.13 (0.13) | 9.37 (0.16) | 9.05 (0.14) | 9.21 (0.08) | 9.90 (0.09) | 9.31 (0.11) | 9.01 (0.15) |
| 4 | 10.90 (0.06) | 10.08 (0.09) | 10.73 (0.08) | 9.50 (0.10) | 9.54 (0.17) | 9.05 (0.12) | 9.38 (0.09) | 10.14 (0.04) | 9.78 (0.11) | 9.47 (0.17) |
| 5 | 11.19 (0.04) | 10.43 (0.10) | 10.82 (0.04) | 9.83 (0.16) | 9.75 (0.06) | 9.37 (0.23) | 9.54 (0.13) | 10.13 (0.07) | 9.65 (0.11) | 9.59 (0.09) |
| 6 | 10.94 (0.07) | 9.90 (0.14) | 10.70 (0.07) | 9.35 (0.12) | 9.39 (0.09) | 8.83 (0.13) | 9.29 (0.12) | 9.95 (0.12) | 9.33 (0.17) | 9.74 (0.09) |
| 7 | 10.90 (0.06) | 10.22 (0.06) | 10.68 (0.08) | 9.50 (0.08) | 9.41 (0.09) | 9.32 (0.09) | 9.21 (0.14) | 10.01 (0.09) | 9.60 (0.08) | 9.36 (0.07) |
| 9 | 10.72 (0.10) | 10.03 (0.23) | 10.55 (0.08) | 9.55 (0.22) | 9.09 (0.12) | 8.95 (0.28) | 9.19 (0.16) | 10.15 (0.07) | 9.31 (0.10) | 9.36 (0.06) |
| 10 | 10.92 (0.06) | 10.43 (0.09) | 10.62 (0.09) | 9.65 (0.07) | 9.48 (0.07) | 9.62 (0.14) | 9.22 (0.07) | 10.24 (0.07) | 9.46 (0.11) | 8.81 (0.14) |
Mean (standard error of the mean).
Examination of fecal samples by PCR-DGGE.
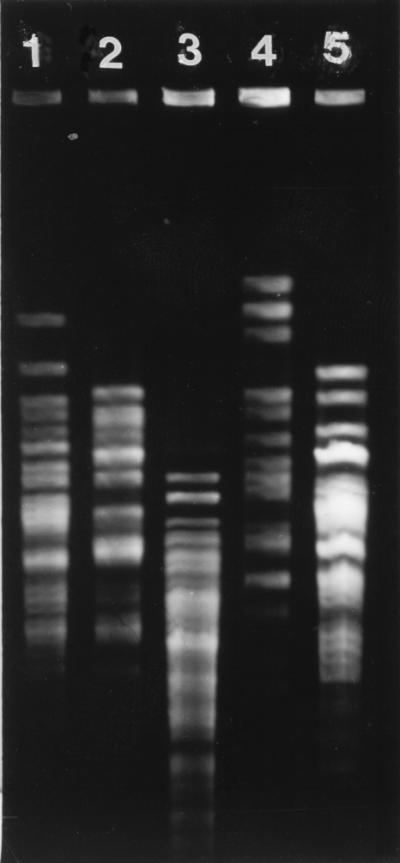
16S rRNA gene sequences that were amplified from bacterial DNA extracted from feces produced profiles in denaturing gradient gels that were characteristic of each individual (Fig. 3). As described by Zoetendal and colleagues, some DNA fragments were found in all individuals and may represent the “core” or “true” fecal microflora of humans (28). Changes in the profiles during the course of the study were not observed consistently in the subjects, but the appearance of a fragment in a test period sample from subject 6 and alterations in the posttest period profile of subject 9 compared to the control and test period profiles of this subject were notable (Fig. 3), as were alterations in the control period profiles of subjects 3 and 10 compared to the test and posttest period profiles of these subjects (data not shown). The changes observed were probably not related to probiotic consumption. We have not determined the bacterial groups responsible for these changes. The V2-V3 fragment of DR20 could not be detected in the test period samples when the results were compared to migration of the sequence generated by PCR from a pure culture of the strain. PCR-DGGE detects 90 to 99% of the numerically dominant bacterial species in fecal samples according to Zoetendal et al. (28). Thus, this method is best for monitoring the populations of obligately anaerobic bacteria present in human feces.
FIG. 3.

PCR-DGGE profiles generated from fecal samples. Lanes 1 through 3, subject 5 control, test, and posttest period samples; lanes 4 through 6, subject 6 samples, showing the appearance of a new 16S rDNA sequence in the profile during the test period (lane 5, circle); lanes 7 through 9, subject 7 samples; lanes 10 through 12, subject 9 samples, showing alterations in the profiles (circle) of control and test period samples compared to the posttest period sample.
Food diary.
Obvious correlations between consumption of particular food groups and Lactobacillus population size and composition were not observed (Table 16).
TABLE 16.
Food group analysis based on 4-day diaries completed by the subjects
| Subject | % of energy from the following food groups:
|
||||||||
|---|---|---|---|---|---|---|---|---|---|
| Meat | Dairy | Fruit | Vegetables | Breakfast cereals | Other cereals | Bakery products | Sugar and confectionery | Other | |
| 1 | 10.7 | 17.5 | 5.9 | 6.0 | 0.0 | 14.6 | 20.4 | 4.1 | 20.8 |
| 2 | 8.2 | 7.4 | 6.1 | 1.2 | 0.0 | 3.2 | 43.4 | 2.3 | 28.2 |
| 3 | 3.6 | 25.3 | 7.3 | 6.9 | 0.7 | 15.3 | 14.5 | 6.9 | 19.5 |
| 4 | 3.0 | 14.6 | 3.5 | 6.4 | 5.5 | 9.4 | 16.9 | 6.4 | 34.3 |
| 5 | 15.9 | 8.0 | 18.5 | 7.3 | 0.0 | 0.0 | 30.7 | 7.3 | 12.3 |
| 6 | 12.8 | 4.4 | 3.2 | 14.7 | 11.1 | 3.7 | 23.9 | 14.7 | 11.5 |
| 7 | 14.7 | 7.9 | 2.7 | 14.5 | 10.1 | 3.5 | 21.1 | 14.5 | 11.0 |
| 9 | 26.7 | 9.3 | 3.8 | 17.1 | 4.4 | 4.4 | 14.4 | 17.1 | 2.8 |
| 10 | 27.2 | 14.6 | 1.5 | 9.4 | 2.4 | 3.3 | 16.0 | 9.4 | 16.2 |
DISCUSSION
Consumption of the probiotic product used in this study changed the fecal microflora of the human subjects in several ways. Lactobacilli and enterococci were detected more frequently and in higher numbers, and the compositions of the Lactobacillus populations changed in terms of the numerically predominant strains. While the increased presence of lactobacilli might have been expected because of the consumption of the probiotic containing L. rhamnosus DR20, the detection of higher numbers of enterococci was unexpected. It seems likely that the enterococcal population was influenced by the presence of strain DR20 rather than by the constituents of the milk powder. Reconstituted milk powder was consumed during the control period but not during the posttest period. The enterococci detected in these periods did not differ. Less obvious but nevertheless noteworthy was the detection of Lactobacillus acidophilus L35 in the feces of subject 10. This strain was detected only after consumption of the probiotic commenced and was undetectable 2 months into the posttest period.
Consistent alterations in the biochemistry of the fecal samples were not observed as a result of consumption of the probiotic. It has been reported previously that azoreductase and β-glucuronidase activities in human feces decrease when a probiotic is consumed (8). Previous studies of humans have been relatively short, however, and the degree of fluctuation in these enzyme activities that occurs in human feces has not been reported previously. Short-term observations could result in inaccurate predictions of probiotic effects on fecal biochemistry.
Monitoring of the fecal community by FISH and PCR-DGGE could be useful in future studies of microbial ecology even though these techniques did not detect changes in the microflora that could be directly related to consumption of the probiotic in this study. It has been shown that PCR-DGGE detects alterations in the simpler microbial community in the murine stomach, in which the number of Lactobacillus cells is much higher than the number of DR20 cells in feces (27). FISH is particularly useful for monitoring the populations of obligate anaerobes for which selective culture media are not available. Both methods have the potential to detect both cultivable and noncultivable populations. Our results show that even if good anaerobic bacteriological techniques are used, only 21.4 and 37.5% of the total population detected microscopically (with DAPI and the Bact338 probe, respectively) can be enumerated by the culture technique. Overall, the results obtained with the FISH, PCR-DGGE, and bacteriological culture techniques clearly show that while long-term consumption of a probiotic altered the Lactobacillus population, it did not affect the populations of obligate anaerobes which are the numerically dominant members of the fecal microflora.
In a previous study, Kimura et al. found that about one-half of the subjects that were investigated harbored a relatively simple Lactobacillus population in which one or two strains were the numerically predominant isolates throughout the study (11). We observed the same phenomenon in this study, in which subjects 2, 6, 7, and 9 were hosts of single dominant strains. Interestingly, these strains belonged to only two species, Lactobacillus ruminis (subjects 2 and 6) and Lactobacillus salivarius subsp. salivarius (subjects 7 and 9). These four subjects consistently harbored Lactobacillus populations containing between 104 and 109 CFU/g throughout the study (Table 1). In contrast, the feces of subjects 1, 4, 8, and 10 contained widely fluctuating numbers of lactobacilli, and lactobacilli were undetectable in some fecal samples (Table 1). Strain DR20 was the predominant Lactobacillus strain during the test period for subjects whose Lactobacillus populations fluctuated in terms of size (subjects 1, 4, 8, and 10) or composition (subject 3) during the control period (Table 1 and Fig. 2). In these subjects, the strains of lactobacilli present in the feces during the posttest period were different than the strains present during the control period, which emphasized the general instability of the Lactobacillus populations in these individuals. The probiotic strain was not the predominant strain in samples collected from subjects whose Lactobacillus populations were stable (subjects 2, 6, 7, and 9) (Table 1 and Fig. 2). Thus, the presence of lactobacilli (L. ruminis, L. salivarius subsp. salivarius) that were capable of persisting for a long time in the feces of a subject appeared to preclude the establishment of DR20 as the numerically dominant strain. In the future, the results of long-term control studies such as we describe here might permit predictions of changes in the fecal microflora to be made prior to consumption of a probiotic.
The important ecological observations described above indicate that the relationship between Lactobacillus strains and the human host must be defined. Many of the strains detected in this investigation belonged to the L. casei and Lactobacillus plantarum groups. We propose that at least a proportion of these strains detected in feces were transient strains that originated in food and passed through the intestinal tract. In ecological terms, these strains were “allochthonous” (strains found in a place other than where they were formed) with respect to the intestinal tract. In contrast, the L. ruminis or L. salivarius subsp. salivarius strains persisted for at least 18 months in subjects 2, 6, 7, and 9. These strains could be referred to as “autochthonous” strains (strains inhabiting a place or region from earliest times). As we observed in our study, strains of probiotic bacteria incorporated into probiotic products can usually be detected in the feces of human subjects only while the subjects continue to consume the product (7). Therefore, their presence in the intestinal tract depends on environmental circumstances (purchase and consumption of the probiotic). Probiotic bacterial strains should thus be considered allochthonous. If a strain is derived from a human it may once have been autochthonous with respect to that individual, but it is allochthonous with respect to the majority of other humans. There is a need to introduce this terminology in order to rationalize the effects of probiotic administration on the consumer relative to the effects of strains that are already present in the intestinal tract. Autochthonous strains must be highly compatible with the intestinal environments of their hosts, since they persist as members of the Lactobacillus population. They are tolerated by the immune system of a host to the extent that they are not eliminated from the intestinal ecosystem. Their interactions with the host and hence their influence on host characteristics may be entirely different from the interactions and influence of allochthonous strains. Berg and Savage (2) noted that Lactobacillus and Bacteroides strains isolated from the murine intestinal tract (autochthonous strains) elicited a relatively weak immune response when they were administered parenterally to mice. Strains from humans (allochthonous strains) produced a stronger response in mice. Germfree animals that were monoassociated with autochthonous lactobacilli or Bacteroides strains for 1 to 5 weeks did not exhibit evidence of an immune response to these bacteria. Animals associated with allochthonous strains exhibited a substantial response (2). The enhanced phagocytosis and adjuvant effects resulting from administration of some probiotic strains to rodents and humans may thus reflect the allochthonous nature of the bacteria (20, 23).
In this study, relatively long-term consumption of DR20 did not result in consistent alterations in the biochemistry or bacteriology of the fecal microflora of the 10 human subjects; the only effects were on the size, frequency of detection, and composition of the Lactobacillus population and the size and frequency of detection of the enterococcal population. Analysis of the Lactobacillus populations during the control, test, and posttest periods of the study, however, led to recognition of the importance of autochthonous strains of lactobacilli in the microbial ecology of human feces. Our observations permit reappraisal of the probiotic concept. Probiotic action may not necessarily be related to alterations in the composition of the autochthonous microflora of the large bowel but could have an effect in the small bowel, where the intestinal ecosystem is first exposed to the allochthonous microbes. It may now be possible to replace Fuller's definition of a probiotic (“a live microbial feed supplement which beneficially affects the host animal by improving its intestinal microbial balance”) (5), which has provided a useful basis for probiotic research for many years, with a definition that more accurately reflects microbe-host relationships. “Probiotics contain microbial cells which transit the gastrointestinal tract and which, in doing so, benefit the health of the consumer” may be a suitable definition.
TABLE 5.
Populations of lactose-fermenting enterobacteria in fecal samples
| Subject | Lactose-fermenting enterobacterial population (log10 bacteria/g)
|
||
|---|---|---|---|
| Control period (n = 6) | Test period (n = 6) | Posttest period (n = 3) | |
| 1 | 5.5 (0.3)a | 6.3 (0.2)b | 7.7c |
| 2 | 6.5 (0.2) | 6.3 (0.1) | 6.1 (0.3) |
| 3 | 7.1 (0.2) | 7.3 (0.1) | 7.3 (0.4) |
| 4 | 6.2 (0.3) | 6.4 (0.2) | 5.9 (0.3) |
| 5d | 7.0 (0.1) | 5.8 (0.6) | 3.8 (0.3) |
| 6 | 5.4 (0.3) | 5.6 (0.4) | 4.8 (0.1) |
| 7 | 5.8 (0.2) | 6.4 (0.2) | 6.2 (0.3) |
| 8 | 7.2 (0.2) | 7.5 (0.3)b | 7.4c |
| 9e | 5.3 (0.4) | 7.0 (0.3) | 7.2 (0.1) |
| 10 | 6.0 (0.1) | 5.7 (0.6) | 5.7 (0.6) |
Mean (standard error of the mean).
n = 2.
n = 1.
The control and posttest period values for subject 5 are different (P = 0.0155).
The control period value for subject 9 is different from the test and posttest period values (P = 0.0162 and P = 0.0099, respectively).
TABLE 6.
Populations of sporing clostridia in fecal samples
| Subject | Sporing clostridial population (log10 bacteria/g)
|
||
|---|---|---|---|
| Control period (n = 6) | Test period (n = 6) | Posttest period (n = 3) | |
| 1 | 5.4 (0.3)a | 5.1 (0.6)b | 5.4c |
| 2 | 3.7 (0.6) | 4.1 (0.3) | 2.6 (0.4) |
| 3 | 5.3 (0.2) | 5.8 (0.1) | 5.2 (0.2) |
| 4 | 4.3 (0.2) | 4.8 (0.2) | 4.7 (0.1) |
| 5 | 5.1 (0.4) | 5.6 (0.3) | 5.1 (0.4) |
| 6d | 4.5 (0.2) | 5.8 (0.1) | 5.4 (0.4) |
| 7 | 4.4 (0.2) | 5.1 (0.1) | 5.0 (0.6) |
| 8 | 4.1 (1.0) | 6.0 (0.1)b | 6.2c |
| 9 | 5.1 (0.1) | 4.9 (0.1) | 5.1 (0.2) |
| 10e | 5.9 (0.2) | 5.8 (0.2) | 6.7 (0.1) |
Mean (standard error of the mean).
n = 2.
n = 1.
The control and test period values for subject 6 are different (P = 0.0104).
The control and posttest period values for subject 10 are different (P = 0.0162), as are test and posttest period values (P = 0.0129).
TABLE 7.
Populations of esculin-hydrolyzing Bacteroides in fecal samples
| Subject | Esculin-hydrolyzing Bacteroides population (log10 bacteria/g)
|
||
|---|---|---|---|
| Control period (n = 6)) | Test period (n = 6) | Posttest period (n = 3) | |
| 1 | 10.1 (0.1)a | 9.3 (0.2)b | 9.5c |
| 2 | 9.7 (0.2) | 9.6 (0.1) | 9.0 (0.1) |
| 3 | 9.2 (0.1) | 7.6 (1.5) | 8.3 (0.2) |
| 4 | 8.5 (0.1) | 8.8 (0.1) | 8.7 (0.1) |
| 5 | 8.7 (0.1) | 9.2 (0.1) | 9.2 (0.3) |
| 6d | 9.2 (0.1) | 8.9 (0.3) | 8.7 (0.1) |
| 7 | 9.1 (0.1) | 9.1 (0.1) | 9.3 (0.2) |
| 8 | 9.1 (0.2) | 9.3 (0.3)b | 9.4c |
| 9 | 9.1 (0.3) | 9.2 (0.2) | 8.5 (0.3) |
| 10 | 9.4 (0.1) | 9.5 (0.1) | 9.5 (0.2) |
Mean (standard error of the mean).
n = 2.
n = 1.
The control and posttest period values for subject 6 are different (P = 0.0021).
ACKNOWLEDGMENT
The participation of the subjects in this study is gratefully acknowledged.
REFERENCES
- 1.Altschul S F, Gish W, Miller W, Myers E W, Lipman D J. Basic local alignment search tool. J Mol Biol. 1990;215:403–410. doi: 10.1016/S0022-2836(05)80360-2. [DOI] [PubMed] [Google Scholar]
- 2.Berg R D. Host immune response to antigens of the indigenous intestinal flora. In: Hentges D J, editor. Human intestinal microflora in health and disease. New York, N.Y: Academic Press; 1983. pp. 101–126. [Google Scholar]
- 3.Drasar B S, Barrow P A. Intestinal microbiology. Washington, D.C.: American Society for Microbiology; 1985. [Google Scholar]
- 4.Franks A H, Harmsen H J M, Raangs G C, Jansen G J, Schut F, Welling G W. Variations of bacterial populations in human feces measured by fluorescent in situ hybridization with group-specific 16S rRNA-targeted oligonucleotide probes. Appl Environ Microbiol. 1998;64:3336–3345. doi: 10.1128/aem.64.9.3336-3345.1998. [DOI] [PMC free article] [PubMed] [Google Scholar]
- 5.Fuller R. Probiotics in man and animals. J Appl Bacteriol. 1989;66:365–378. [PubMed] [Google Scholar]
- 6.Gill H S, Rutherford K J, Prasad J, Gopal P K. Enhancement of natural and acquired immunity by Lactobacillus rhamnosus (HN001), Lactobacillus acidophilus (HN017) and Bifidobacterium lactis (HN019) Br J Nutr. 2000;83:167–176. doi: 10.1017/s0007114500000210. [DOI] [PubMed] [Google Scholar]
- 7.Goldin B R, Gorbach S L, Saxelin M, Barakat S, Gualtieri L, Salminen S. Survival of Lactobacillus species (strain GG) in human gastrointestinal tract. Dig Dis Sci. 1992;37:121–128. doi: 10.1007/BF01308354. [DOI] [PubMed] [Google Scholar]
- 8.Goldin B R, Swenson L, Dwyer J, Sexton M, Gorbach S L. Effect of diet and Lactobacillus acidophilus supplements on human fecal bacterial enzymes. JNCI. 1980;64:255–261. doi: 10.1093/jnci/64.2.255. [DOI] [PubMed] [Google Scholar]
- 9.Gordon H A, Pesti L. The gnotobiotic animal as a tool in the study of host-microbial relationships. Bacteriol Rev. 1971;35:390–429. doi: 10.1128/br.35.4.390-429.1971. [DOI] [PMC free article] [PubMed] [Google Scholar]
- 10.Holdeman L V, Cato E P, Moore W E C. Anaerobe laboratory manual. Blacksburg: VPI Anaerobe Laboratory, Virginia Polytechnic Institute and State University; 1973. [Google Scholar]
- 11.Kimura K, McCartney A L, McConnell M A, Tannock G W. Analysis of fecal populations of bifidobacteria and lactobacilli and investigations of the immunological responses of their human hosts to the predominant strains. Appl Environ Microbiol. 1997;63:3394–3398. doi: 10.1128/aem.63.9.3394-3398.1997. [DOI] [PMC free article] [PubMed] [Google Scholar]
- 12.Macfarlane G T, Gibson G R, Cummings J H. Comparison of fermentation reactions in different regions of the human colon. J Appl Bacteriol. 1992;72:57–64. doi: 10.1111/j.1365-2672.1992.tb04882.x. [DOI] [PubMed] [Google Scholar]
- 13.McCartney A L, Wang W, Tannock G W. Molecular analysis of the composition of the bifidobacterial and lactobacillus microflora of humans. Appl Environ Microbiol. 1996;62:4608–4613. doi: 10.1128/aem.62.12.4608-4613.1996. [DOI] [PMC free article] [PubMed] [Google Scholar]
- 14.McConnell M A, Tannock G W. Lactobacilli and azoreductase activity in the murine cecum. Appl Environ Microbiol. 1991;57:3664–3665. doi: 10.1128/aem.57.12.3664-3665.1991. [DOI] [PMC free article] [PubMed] [Google Scholar]
- 15.McConnell M A, Tannock G W. A note on lactobacilli and β-glucuronidase activity in the intestinal contents of mice. J Appl Bacteriol. 1993;74:649–651. doi: 10.1111/j.1365-2672.1993.tb05198.x. [DOI] [PubMed] [Google Scholar]
- 16.Moore W E C, Cato E P, Holdeman L V. Some current concepts in intestinal bacteriology. Am J Clin Nutr. 1978;31:S33–S42. doi: 10.1093/ajcn/31.10.S33. [DOI] [PubMed] [Google Scholar]
- 17.Moore W E C, Holdeman L V. Special problems associated with the isolation and identification of intestinal bacteria in fecal flora studies. Am J Clin Nutr. 1974;27:1450–1455. doi: 10.1093/ajcn/27.12.1450. [DOI] [PubMed] [Google Scholar]
- 18.Muyzer G, Smalla K. Application of denaturing gradient gel electrophoresis (DGGE) and temperature gradient gel electrophoresis (TGGE) in microbial ecology. Antonie Leeuwenhoek. 1998;73:127–141. doi: 10.1023/a:1000669317571. [DOI] [PubMed] [Google Scholar]
- 19.O'Sullivan D J. Methods of analysis of the intestinal microflora. In: Tannock G W, editor. Probiotics: a critical review. Wymondham, United Kingdom: Horizon Scientific Press; 1999. pp. 23–44. [Google Scholar]
- 20.Perdigon G, Alvarez S. Probiotics and the immune state. In: Fuller R, editor. Probiotics. The scientific basis. London, United Kingdom: Chapman and Hall; 1992. pp. 146–180. [Google Scholar]
- 21.Prasad J, Gill H, Smart J, Gopal P K. Selection and characterisation of lactobacillus and bifidobacterium strains for use as probiotics. Int Dairy J. 1998;8:993–1002. [Google Scholar]
- 22.Sanger F, Nicklen S, Coulson A R. DNA sequencing with chain-terminating inhibitors. Proc Natl Acad Sci USA. 1977;74:5463–5467. doi: 10.1073/pnas.74.12.5463. [DOI] [PMC free article] [PubMed] [Google Scholar]
- 23.Schiffrin E J, Rochat F, Link-Amster H, Aeschlimann J M, Donnet-Hughes A. Immunomodulation of human blood cells following the ingestion of lactic acid bacteria. J Dairy Sci. 1995;78:491–497. doi: 10.3168/jds.S0022-0302(95)76659-0. [DOI] [PubMed] [Google Scholar]
- 24.Summanen P, Baron E J, Citron D M, Strong C, Wexler H, Finegold S M. Wadsworth anaerobic bacteriology manual. 5th ed. Belmont, Calif: Star Publishing Company; 1993. [Google Scholar]
- 25.Tannock G W, Tilsala-Timisjarvi A, Rodtong S, Ng J, Munro K, Alatossava T. Identification of Lactobacillus isolates from the gastrointestinal tract, silage, and yoghurt by 16S-23S rRNA gene intergenic spacer region sequence comparisons. Appl Environ Microbiol. 1999;65:4264–4267. doi: 10.1128/aem.65.9.4264-4267.1999. [DOI] [PMC free article] [PubMed] [Google Scholar]
- 26.Tilsala-Timisjarvi A, Alatossava T. Development of oligonucleotide primers from the 16S-23S rRNA intergenic sequences for identifying different dairy and probiotic lactic acid bacteria by PCR. Int J Food Microbiol. 1997;35:49–56. doi: 10.1016/s0168-1605(97)88066-x. [DOI] [PubMed] [Google Scholar]
- 27.Walter J, Tannock G W, Tilsala-Timisjarvi A, Rodtong S, Loach D M, Munro K, Alatossava T. Detection and identification of gastrointestinal Lactobacillus species by using denaturing gradient gel electrophoresis and species-specific PCR primers. Appl Environ Microbiol. 2000;66:297–303. doi: 10.1128/aem.66.1.297-303.2000. [DOI] [PMC free article] [PubMed] [Google Scholar]
- 28.Zoetendal E, Akkermans A D, De Vos W M. Temperature gradient gel electrophoresis analysis of 16S rRNA from human fecal samples reveals stable and host-specific communities of active bacteria. Appl Environ Microbiol. 1998;64:3854–3859. doi: 10.1128/aem.64.10.3854-3859.1998. [DOI] [PMC free article] [PubMed] [Google Scholar]