

Abstract
Purpose:
Plexiform neurofibromas (PNF) are peripheral nerve sheath tumors that cause significant morbidity in persons with neurofibromatosis type 1 (NF1), yet treatment options remain limited. To identify novel therapeutic targets for PNF, we applied an integrated multi-omic approach to quantitatively profile kinome enrichment in a mouse model that has predicted therapeutic responses in clinical trials for NF1-associated PNF with high fidelity.
Experimental Design:
Utilizing RNA sequencing combined with chemical proteomic profiling of the functionally enriched kinome using multiplexed inhibitor beads coupled with mass spectrometry, we identified molecular signatures predictive of response to CDK4/6 and RAS/MAPK pathway inhibition in PNF. Informed by these results, we evaluated the efficacy of the CDK4/6 inhibitor, abemaciclib, and the ERK1/2 inhibitor, LY3214996, alone and in combination in reducing PNF tumor burden in Nf1flox/flox;PostnCre mice.
Results:
Converging signatures of CDK4/6 and RAS/MAPK pathway activation were identified within the transcriptome and kinome that were conserved in both murine and human PNF. We observed robust additivity of the CDK4/6 inhibitor, abemaciclib, in combination with the ERK1/2 inhibitor, LY3214996, in murine and human NF1(Nf1) mutant Schwann cells. Consistent with these findings, the combination of abemaciclib (CDK4/6i) and LY3214996 (ERK1/2i) synergized to suppress molecular signatures of MAPK activation and exhibited enhanced anti-tumor activity in Nf1flox/flox;PostnCre mice in vivo.
Conclusion:
These findings provide rationale for the clinical translation of CDK4/6 inhibitors alone and in combination with therapies targeting the RAS/MAPK pathway for the treatment of PNF and other peripheral nerve sheath tumors in persons with NF1.
Translational Relevance
Plexiform neurofibromas (PNF) represent a major source of morbidity in persons with neurofibromatosis type 1 (NF1). There remains an unmet need to develop new and effective treatment strategies for PNF given that a significant proportion of patients do not exhibit durable responses to currently available therapies. Using an integrated multi-omic approach, we identified molecular signatures predictive of response to CDK4/6 and RAS/MAPK pathway inhibition in PNF. Concordantly, combined CDK4/6 and ERK1/2 inhibition demonstrated robust synergism and enhanced anti-tumor activity in a mouse model of NF1-associated PNF that has demonstrated high fidelity in forecasting therapeutic responses in clinical trials. Collectively, these results demonstrate the utility of systems biology coupled with preclinical modeling to rationally inform novel single agent and combination therapies in the treatment of rare diseases.
Introduction
Neurofibromatosis type 1 (NF1) is one of the most common genetic cancer predisposition syndromes, affecting 1:3000 individuals worldwide and more than 100,000 individuals in the United States alone (1). It is caused by germline mutations of the NF1 tumor suppressor gene, encoding the neurofibromin protein, a p21RAS guanosine triphosphate (GTP) activating protein (GAP), which accelerates the hydrolysis of RAS-GTP to its inactive, GDP bound form (2–4). Neurofibromin loss of function results in aberrant activation of the RAS signaling pathway and its downstream effectors, resulting in abnormal cellular growth and neoplasia (2–4).
Plexiform neurofibromas (PNF) are benign tumors that arise from the peripheral nerve fascicles and are amongst the most frequent and serious medical complications of NF1. PNF cause disfigurement, chronic pain, and potentially life-threatening compression of vital structures such as the airway and spinal cord (5). Rates of local recurrence and tumor regrowth following attempted surgical debulking are high (6,7).
Over the past decade, our molecular understanding of PNF biology has been informed by genetic, cellular, and biochemical evidence that loss of neurofibromin potentiates p21RAS-dependent activation of the RAF/MEK/ERK signaling pathway in multiple lineages including Schwann cells, the tumorigenic cell of origin for plexiform neurofibroma (8,9). Notably, recent phase 2 clinical trials of MEK inhibitors, including selumetinib, binimetinib, trametinib and mirdametinib, have demonstrated activity in NF1-associated PNF (10–14). Furthermore, selumetinib is now FDA and EMA approved for the treatment of symptomatic and inoperable PNF in children with NF1. However, despite considerable progress, there remains a significant subset of patients who do not respond to MEK inhibitor monotherapy or who ultimately develop progressive disease after an initial partial response.
Drugs inhibiting MEK and other protein kinases remain at the forefront of drug discovery as tractable therapeutics in human disease. To date, more than 500 protein kinases have been identified and a total of 89 kinase inhibiting drugs have been approved by the FDA (15). Yet, beyond the RAS/RAF/MEK signaling axis itself (16) and receptor tyrosine kinases upstream that signal through RAS (17,18), the functional landscape of kinome activity in PNF remains largely uncharted – a knowledge gap that has hampered the identification of novel therapeutic targets. Recently, innovative chemical proteomic technologies have evolved to allow for the broad profiling of the functional kinome to help inform the repurposing of kinase inhibitors in cancer and other disease states (19–22).
Here, we utilized RNAseq coupled with multiplexed kinase inhibitor bead affinity chromatography and mass spectrometry (MIB/MS) to quantitatively profile the comprehensive signature of functionally enriched kinases in PNF arising in Nf1flox/flox;PostnCre mice, a genetically engineered mouse model (GEMM) that has demonstrated high fidelity in forecasting therapeutic responses of multiple kinase inhibitors in clinical trials for NF1-associated PNF (17,23). Our attention was drawn to converging signatures of CDK4/6 and RAS/MAPK pathway activation within the transcriptome and kinome, which were conserved across both murine and human PNF. Concordantly, we observed robust additivity of the CDK4/6 inhibitor, abemaciclib, in combination with the ERK1/2 inhibitor, LY3214996, in murine and human NF1(Nf1) deficient Schwann cells. Consistent with these findings, the combination of abemaciclib (CDK4/6i) and LY3214996 (ERK1/2i) synergized to suppress molecular signatures of MAPK activation and exhibited enhanced anti-tumor activity in Nf1flox/flox;PostnCre mice in vivo. Collectively, these data demonstrate the utility of a systems biology approach coupled with clinically relevant GEMMs to identify novel therapeutic targets in orphan diseases where the ability to conduct clinical trials is limited. These findings further provide rationale for the clinical translation of CDK4/6 inhibitors alone and in combination with therapies targeting the RAS/MAPK pathway for the treatment of PNF and other peripheral nerve sheath tumors in persons with NF1.
Methods
RNA sequencing
Total RNA was isolated from normal and plexiform neurofibroma bearing trigeminal nerve tissues of WT and Nf1flox/flox;PostnCre mice using the RNeasy Plus Mini Kit (Qiagen) according to the manufacturer’s protocol with the optional DNase I treatment (Qiagen) for 15min. 800ng total RNA was used as input for RNA-seq library construction with a Kapa Stranded mRNA kit according to the manufacturer’s protocol. TruSeq adapter sequences were used for indexing. Library amplification was run as described with 10 PCR cycles. Equimolar amounts of each library were run as multiplexed 1.65pM pools, single-indexed, on an Illumina NextSeq 500—75 cycle, high output V2 kit. FastQC-passed reads were aligned to the mouse reference genome (mm10) using STAR 2.4.2a (RRID:SCR_004463) (24) and reads were translated to transcriptome coordinates using Salmon 0.60 (25). Isoform data were collated to single gene IDs using the R package biomaRt (RRID:SCR_019214) (26), and abundance estimates were upper quartile normalized using R. Gene values were filtered to include only those with 10 or more reads in at least one sample and values (x + 1) were log2 transformed and used for unsupervised hierarchical clustering (complete linkage) in Morpheus (https://software.broadinstitute.org/morpheus/, RRID:SCR_017386). Abundance values for genes were used as input for DESeq2 (RRID:SCR_000154) to identify differentially expressed genes (27). Heatmaps were generated using the R package ComplexHeatmap (28) under default settings whereby 1-Person correlation was used to obtain a distance matrix with complete clustering. Gene expression values (rows) were Z-score normalized.
For comparison of vehicle, LY3214996 (ERK1/2i), abemaciclib (CDK4/6i), and combination treated mice, total RNA was isolated from sciatic nerve tissue using the RNeasy Plus Mini Kit (Qiagen) according to manufacturer’s protocol with the optional DNase I treatment (Qiagen) for 15min. 100ng total RNA and 15 cycles of amplification were used as input for library construction with a KAPA RNA HyperPrep Kit and Qiagen QIAseq FastSelect rRNA removal kit according to the manufacturer’s protocol. RNAseq was conducted on a NovaSeq 6000, 100bp paired-end reads. FastQC-passed reads were aligned to the mouse reference genome (mm10) using STAR RNA-seq aligner 2.7.0a (24). Differential gene expression analysis was conducted using DESeq2 (27).
Using the output from DESeq2 (Supplemental Table 5), Venn diagrams were generated with BioVenn (biovenn.nl) (29) to compare differentially expressed genes (DEGs) between treatment groups (Fig. 5A and B). Thresholds were set at p-value ≤ 0.05 and log2FoldChange ≥ 1 for upregulated DEGs, ≤ −1 for downregulated DEGs. The list of upregulated or downregulated DEGs for each treatment group (abemaciclib, LY3214996, and combo) was loaded into BioVenn’s ID Set X, Y, and Z, respectively, to generate Venn diagrams and numbers of overlapping genes.
Figure 5. Transcriptional responses to single agent and combined CDK4/6 and ERK1/2 inhibition in murine PNF in vivo.
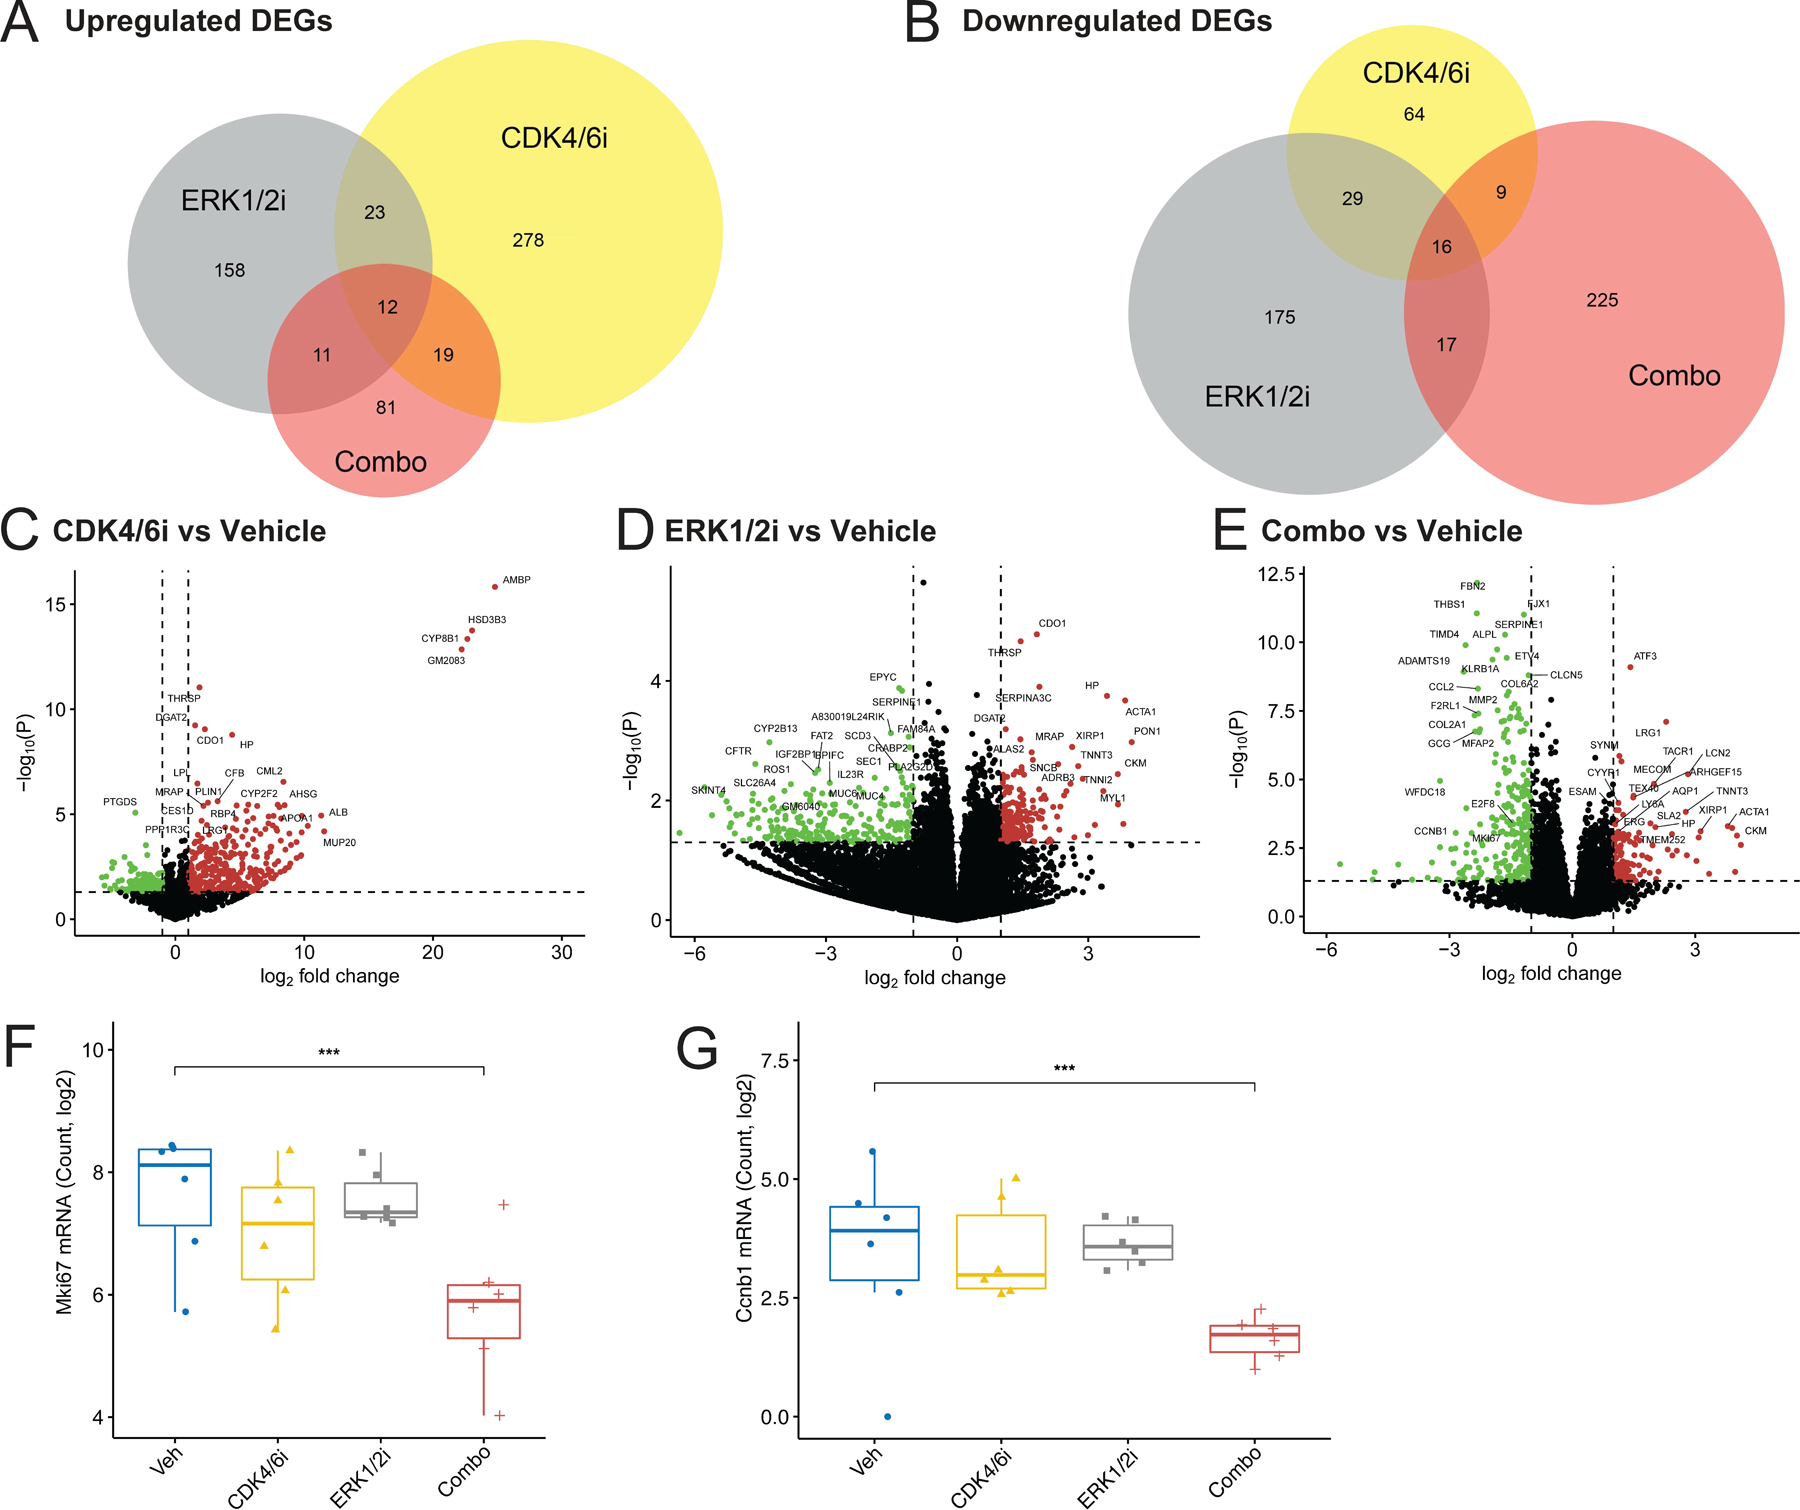
(A) Venn diagram depicting numbers of significantly upregulated differentially expressed genes (DEGs) common between abemaciclib (CDK4/6i), LY3214996 (ERK1/2i), and the combination (Combo) treatment groups compared to the vehicle (Veh) control. The thresholds for the DEGs were defined as log2 fold change ≥ 1 and p-value ≤ 0.05. (B) Venn diagram depicting numbers of significantly downregulated differentially expressed genes (DEGs) common between the abemaciclib, LY3214996, and combination (Combo) treatment groups compared to the vehicle (Veh) control. The thresholds for the DEGs were defined as log2 fold change ≤ −1 and p-value ≤ 0.05. (C) Volcano plot showing log2 fold-change in gene expression for PNF from Nf1flox/flox;PostnCre mice treated with abemaciclib (n=6) vs Vehicle (n=6) plotted against the -log10 p-value (-log10(P)). The dashed horizontal line denotes -log10(P=0.05). The dashed vertical lines denote log2 fold-changes of −1 and 1. Significantly upregulated genes above these thresholds are denoted in red, while significantly downregulated genes are denoted in green. (D) Volcano plot showing log2 fold-change in gene expression for PNF from Nf1flox/flox;PostnCre mice treated with LY3214996 (n=6) vs Vehicle (n=6) plotted against the -log10 p-value (-log10(P)). The dashed horizontal line denotes -log10(P=0.05). The dashed vertical lines denote log2 fold-changes of −1 and 1. Significantly upregulated genes above these thresholds are denoted in red, while significantly downregulated genes are denoted in green. (E) Volcano plot showing log2 fold-change in gene expression for PNF from Nf1flox/flox;PostnCre mice treated with LY3214996 plus abemaciclib combination (n=6) vs Vehicle (n=6) plotted against the -log10 p-value (-log10(P)). The dashed horizontal line denotes -log10(P=0.05). The dashed vertical lines denote log2 fold-changes of −1 and 1. Significantly upregulated genes above these thresholds are denoted in red, while significantly downregulated genes are denoted in green. (F) Box and whisker plots showing Mki67 mRNA log2 counts in PNF from Nf1flox/flox;PostnCre mice treated with vehicle (n=6), abemaciclib (n=6), LY3214996 (n=6), and combination therapy (Combo; n=6). Whiskers extend from the minima to maxima. The center line represents the median. The box spans the 25th to 75th percentiles. Asterisks indicate statistical significance of treatment vs vehicle according to the Wald test performed by DESeq2 (*** = P ≤ 0.001). Non-significant comparisons are not shown. (G) Box and whisker plots showing Ccnb1 mRNA log2 counts in PNF from Nf1flox/flox;PostnCre mice treated with vehicle (n=6), abemaciclib (n=6), LY3214996 (n=6), and combination therapy (n=6). Whiskers extend from the minima to maxima. The center line represents the median. The box spans the 25th to 75th percentiles. Asterisks indicate statistical significance of treatment vs vehicle according to the Wald test performed by DESeq2 (*** = P ≤ 0.001). Non-significant comparisons are not shown.
Multiplexed inhibitor bead (MIB) chromatography and mass spectrometry (MS)
MIB/MS were performed on snap-frozen sciatic nerve tissue from WT and Nf1flox/flox;PostnCre tumor bearing mice. Tissue was crushed by mortar and pestle in ice-cold MIB lysis buffer (50mM HEPES, 150mM NaCl, 0.5% Triton X-100, 1mM EDTA, 1mM EGTA, pH 7.5) supplemented with cOmplete Protease Inhibitor Cocktail (Roche) and 1% phosphatase inhibitor cocktails 2 and 3 (Sigma). Extracts were sonicated 3 times for 10 seconds, clarified by centrifugation, and syringe-filtered (0.22µm) prior to Bradford assay quantitation of concentration. Equal amounts of total protein were gravity-flowed over multiplexed inhibitor bead (MIB) columns in high salt MIB lysis buffer (1M NaCl). The MIB columns consisted of 175µL of a mixture of five Type I kinase inhibitors: VI-16832, PP58, Purvalanol B, UNC-21474 custom-synthesized with hydrocarbon linkers and covalently linked to ECH-Sepharose, and Purvalanol B linked to EAH-Sepharose beads as previously described (19, 20). Columns were washed with 5mL of high salt (1M NaCl), 5mL of low salt (150mM NaCl) MIB lysis buffer, and 0.5mL low-salt lysis buffer with 0.1%SDS. Bound protein was eluted twice with 0.5% SDS, 1% beta-mercaptoethanol, 100mM Tris-HCl (pH 6.8) for 15 min at 100°C. Eluate was treated with DTT (5mM) for 25 min at 60°C and 20mM iodoacetamide for 30 min in the dark. Following spin concentration using Amicon Ultra-4 (10k cut-off) to ~100 µL, samples were precipitated by methanol/chloroform, dried in a speed-vac, and resuspended in 50mM HEPES (pH 8.0). Tryptic digests were performed overnight at 37°C, extracted four times with 1mL ethyl acetate to remove detergent, dried in a speed-vac, and peptides further cleaned using C-18 spin columns according to manufacturer’s protocol (Pierce).
Peptides were resuspended in 5% ACN and 0.1% formic acid. Approximately 40% of the final peptide suspension was injected onto a Thermo Easy-Spray 75μm x 25cm C-18 column and separated on a 180min gradient (5–40% ACN) using an Easy nLC-1000. The Thermo Q Exactive mass spectrometry ESI parameters were as follows: 3e6 AGC MS1, 80ms MS1 max inject time, 1e5 AGC MS2, 100ms MS2 max inject time, 20 loop count, 1.8 m/z isolation window, 45s dynamic exclusion. Raw files were processed for label-free quantification by MaxQuant LFQ using the Uniprot/Swiss-Prot mouse database, fixed carbidomethyl (C) and variable phospho (STY), oxidation (M), and acetyl (Protein N-term) modifications. LFQ intensities for kinases with at least two peptides were imported into Perseus. Log2 transformed LFQ intensities (Supplemental Table 2) were filtered to include only kinases with at least three valid values in at least one treatment group and missing values were imputed (width 0.3, down shift 1.8) from the total matrix in Perseus. Student’s t-tests were performed in Perseus with Benjamini-Hochberg correction for multiple hypothesis testing. Log2 LFQ intensities were used for Principal Component Analysis (Fig. 2A). “Tree” plots of the kinome were generated in Coral (30), in which log2 fold change is encoded in node color and significance encoded in node size, proportional to the –log10 Benjamini-Hochberg adjusted p-value (Fig. 2D).
Figure 2. Kinome profiling of murine PNF reveals increased CDK4/6 signaling.
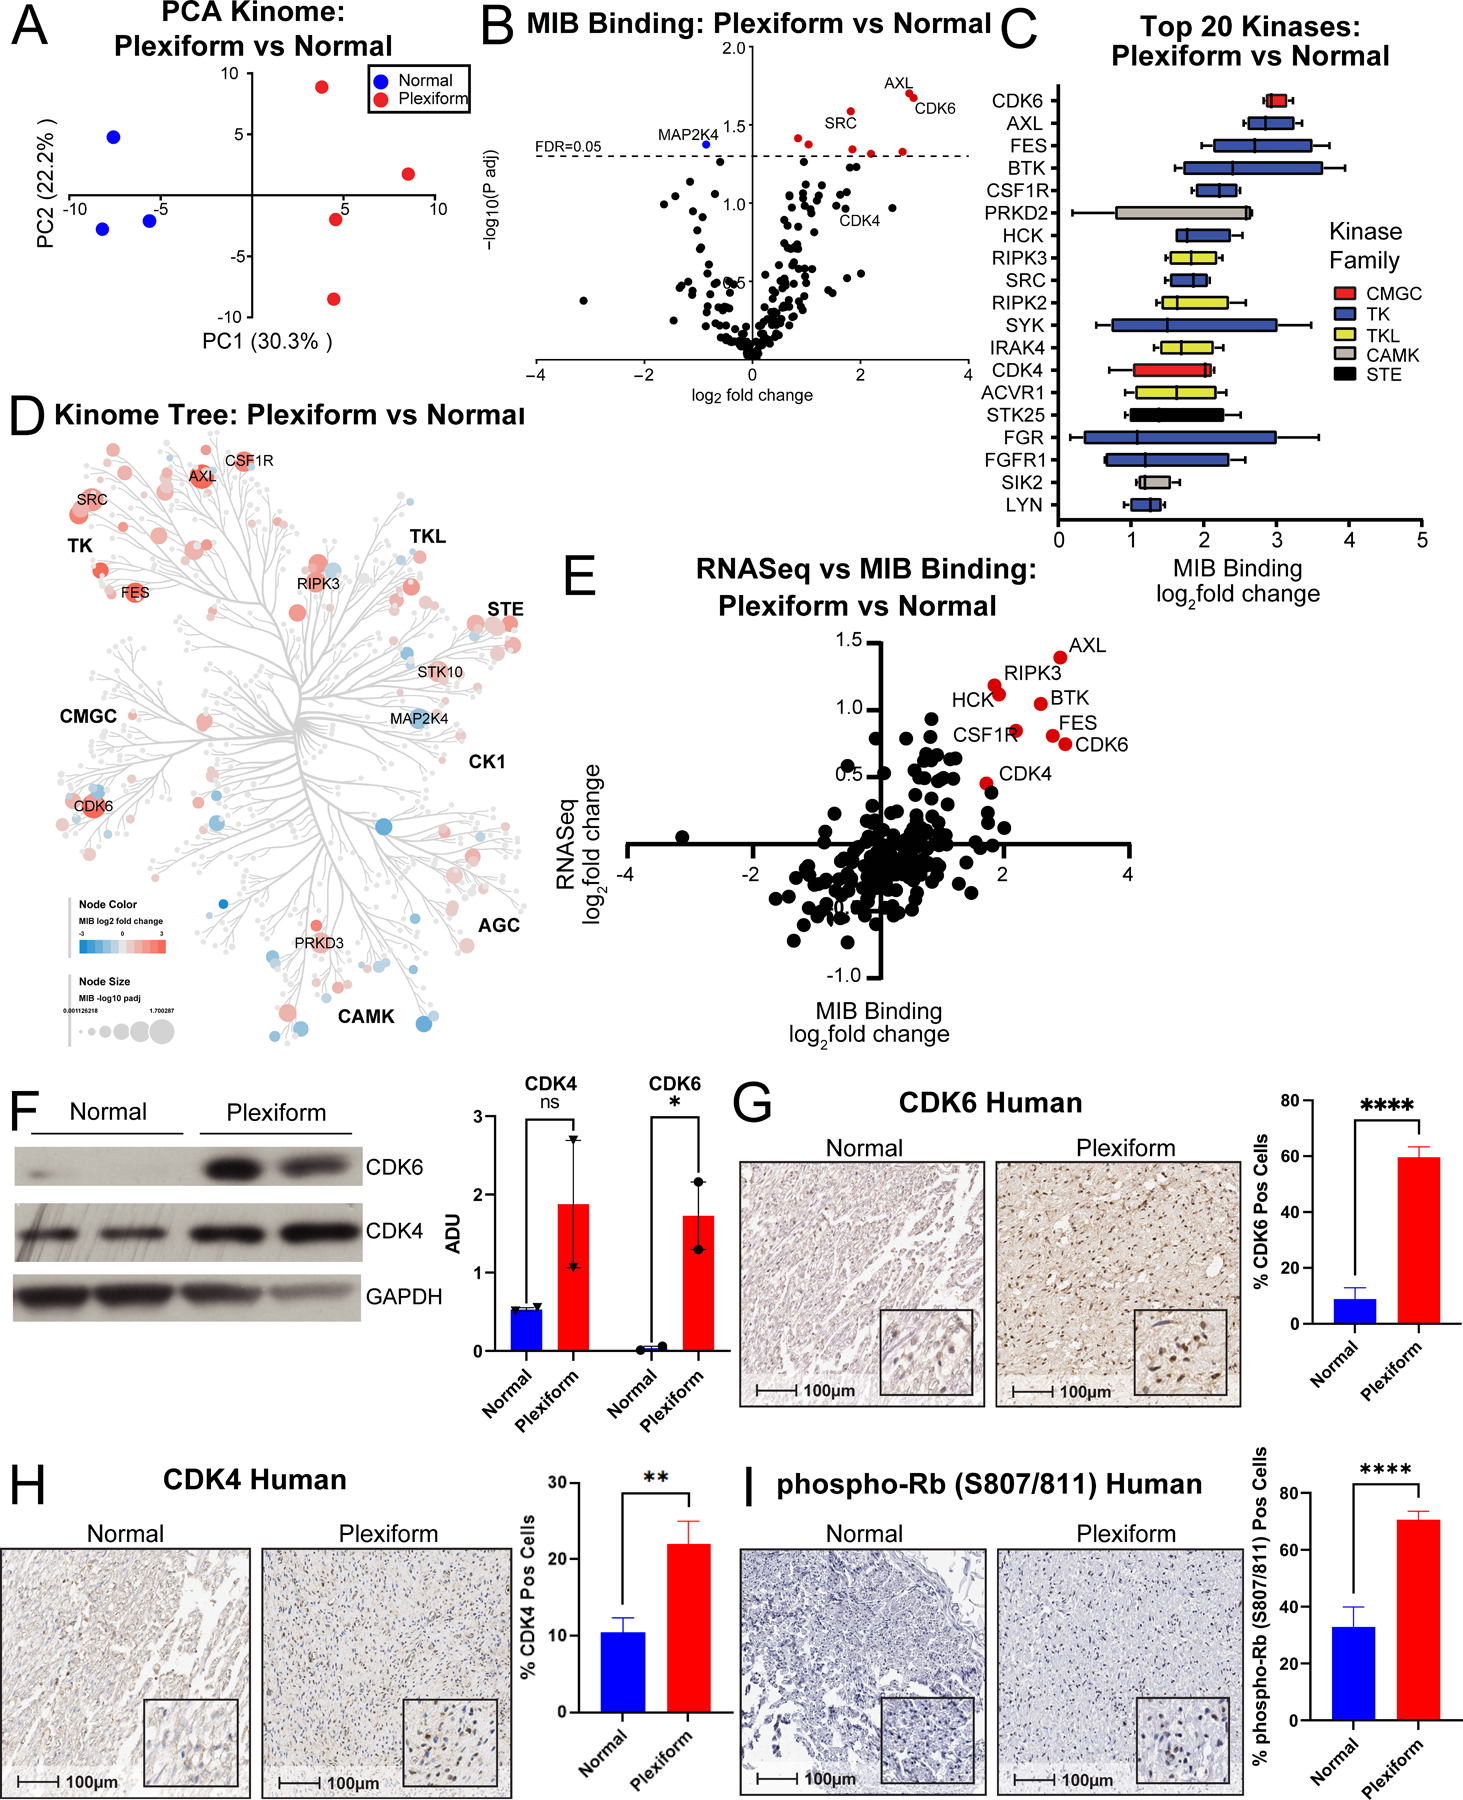
(A) Principal component analysis (PCA) identifies variation in the functional kinome of PNF bearing sciatic nerve tissue from Nf1flox/flox;PostnCre mice (Plexiform; n=4) vs WT control (Normal; n=3). (B) Volcano plot showing the mean log2 fold-change in MIB binding (LFQ intensity) for kinases in PNF bearing sciatic nerve tissue from Nf1flox/flox;PostnCre mice (Plexiform; n=4) vs WT control (Normal; n=3) plotted against the -log10 Benjamini-Hochberg adjusted p-value. The horizontal dashed line denotes a false discovery rate (FDR) of 0.05. Kinases with significantly increased MIB binding (log2 fold-change ≥1 and -log10 adjusted p-value above the FDR threshold) are denoted in red. Kinases with significantly decreased MIB binding (log2 fold-change ≤ −1 and -log10 adjusted p-value above the FDR threshold) are denoted in green. Several of the top kinases with significantly increased or decreased binding in tumor tissue relative to the control are annotated on the plot. (C) Box and whisker plots demonstrating the mean log2 fold-change in MIB binding (LFQ intensity) of the top 20 kinases with increased binding in PNF bearing sciatic nerve tissue from Nf1flox/flox;PostnCre mice (Plexiform; n=4) vs WT control (Normal; n=3). The box color indicates the family to which each kinase belongs as depicted in the legend. (D) “Tree” plot comparing the functionally enriched kinome of PNF bearing sciatic nerve tissue from Nf1flox/flox;PostnCre mice (Plexiform; n=4) vs WT control (Normal; n=3). The log2 fold change in MIB binding is encoded by node color with red denoting kinases that are increased in abundance and blue denoting kinases that are decreased in abundance. The size of each node is proportional to the –log10 Benjamini-Hochberg adjusted p-value as denoted in the figure legend. Kinases with significantly increased or decreased MIB binding in PNF relative to the WT control are annotated alongside their respective kinase families in bold font. (E) Scatter plot showing log2 fold-change in gene expression of kinases (by RNAseq) vs log2 fold-change MIB binding (LFQ intensity) for PNF bearing nerve tissue in Nf1flox/flox;PostnCre mice (Plexiform; n=4 for MIB binding, n=6 for RNAseq) vs WT control nerve tissue (Normal; n=3 for MIB binding, n=6 for RNAseq). Top kinases with increase in MIB binding and RNAseq expression are highlighted in red and labeled. (F) CDK6, CDK4, and GAPDH (loading control) were detected independently by western blot in PNF bearing nerve tissue from Nf1flox/flox;PostnCre mice (Plexiform; n=2) and WT control nerve tissue (Normal; n=2). Bar graph shows arbitrary densitometry units (ADUs) calculated using KwikQuant Image Analyzer for each band normalized to the loading control. Error bars reflect standard error of the mean (SEM). Asterisks indicate statistical significance according to an unpaired, one-sided t-test (* = P ≤ 0.05). (G) Representative photomicrographs of CDK6 immunohistochemistry-stained sections of normal nerve and human NF1-associated PNF. Corresponding 100μm scale bars denote the magnification with inset high-power magnification showing cellular localization. Bar graph shows the percentage of CDK6 positive cells quantified by the HALO Cytonuclear analysis algorithm (Indica Labs). n=11 Normal and n=6 Plexiform samples were analyzed with n=11 and n=24 fields respectively. Error bars reflect standard error of the mean (SEM). Asterisks indicate statistical significance according to an unpaired, two-sided t-test (**** = P ≤ 0.0001). (H) Representative photomicrographs of CDK4 IHC stained sections of normal nerve and human NF1-associated PNF. Corresponding 100μm scale bars denote the magnification with inset high-power magnification showing cellular localization. Bar graph shows the percentage of CDK4 positive cells quantified by manual counting. n=8 Normal and n=6 Plexiform samples were analyzed with n=24 and n=36 fields respectively. Error bars reflect standard error of the mean (SEM). Asterisks indicate statistical significance according to an unpaired, two-sided t-test (** = P ≤ 0.01) (I) Representative photomicrographs of phospho-Rb (S807/811) IHC stained sections of normal nerve and human NF1-associated PNF. Corresponding 100μm scale bars denote the magnification with inset high-power magnification showing nuclear localization. Bar graph shows percentage of phospho-Rb (S807/811) positive nuclei quantified by the HALO Cytonuclear analysis algorithm (Indica Labs). n=14 Normal and n=5 Plexiform samples were analyzed with n=14 and n=30 fields respectively. Error bars reflect standard error of the mean (SEM). Asterisks indicate statistical significance according to an unpaired, two-sided t-test (**** = P ≤ 0.0001).
Isolation and culture of primary murine Nf1−/− DNSCs
Dorsal root ganglia (DRG) neurosphere cell (DNSC) complete media was made with serum-free DMEM/F12 media (Gibco) containing heparin (0.2%. StemCell), glucose (30%, Gibco), sodium bicarbonate (7.5%, Gibco), HEPES (1M, Gibco), N2 supplement (1%, Gibco), glutamine (1%, Gibco), sodium pyruvate (1%, Gibco), penicillin/streptomycin (1%, Lonza), epidermal growth factor (20ng/mL, Sigma-Aldrich), basic fibroblast growth factor (40ng/mL, PeproTech), B27 (without vitamin A) (2%, Gibco), amphotericin B/fungizone (40µg/mL, Gibco), and prophylactic plasmocin (5µg/mL, Invivogen).
Embryos were removed at E13.5 from pregnant female Nf1f/f; PostnCre- mice following euthanasia. The DRG and spinal nerve roots of embryos were microdissected using a stereomicroscope. DRGs were incubated in 20mg/mL collagenase, centrifuged, resuspended in PBS, pH 7.2 (#20012027, Gibco), centrifuged, and then the supernatant was removed. The pellet was resuspended in DNSC complete media and cultured in low adhesion plates for 7–10 days for expansion. DNSCs were then transferred to fibronectin-coated plates for subsequent passages. Adenovirus GFP Cre (University of Iowa) was added to the cell media at a dilution of 1:500, incubated for 24 hours, and then replaced with fresh media. Recombination of Nf1 was confirmed through PCR genotyping using the following primers: P1: 5’-AATGTGAAATTGGTGTCGA GTAAGGTAACCAC 3’, P2: 5’- TTAAGAGCATCTGCTGCTCTTAGAGGGAA 3’, P3: 5’- TCAGACTGATTGTTGTACCTGAT GGTTGTACC 3’ as well as independent western blot validation for neurofibromin. Every 3–4 days, DNSCs were fed and passaged upon reaching confluence using TrypLE express enzyme (1X, ThermoFisher) to dissociate cells. Cultures were tested for mycoplasma prior to use in experiments and confirmed to be negative.
Culture of human immortalized NF1−/− Schwann cells
Human immortalized NF1−/− Schwann cells (ipNF05.5 and ipNF95.6) were obtained from the Peggy Wallace lab (31). Cells were passaged in DMEM media containing FBS (10%, Harvest Midsci), glutamine (1%, Gibco), penicillin/streptomycin (1%, Lonza), antibiotic-antimycotic (1%, Gibco), and prophylactic plasmocin (5ug/mL, Invivogen). Trypsin-EDTA (0.05%, Gibco) was used to dissociate cells for passaging upon reaching confluence. Cultures were tested for Mycoplasma prior to use in experiments and confirmed to be negative.
Cell Titer-Glo® Synergy assays
Human immortalized NF1−/− Schwann cells (ipNF05.5 and ipNF95.6) were plated at a density of 5,000 and 1,200 cells per well, respectively, in 96-well plates, allowed to adhere overnight, and then treated with a 2D dose response matrix of increasing concentrations of abemaciclib (CDK4/6i) from 62.5nM to 1µM and LY3214996 (ERK1/2i) from 156.25nM to 10µM. Murine Nf1−/− dorsal root ganglia (DRG) neurosphere cells (DNSCs) were plated at a density of 5,000 cells per well in fibronectin (#F1141-5MG, Sigma-Aldrich) coated 96-well plates, allowed to adhere overnight and then treated with a 2D dose response matrix of increasing concentrations of abemaciclib and LY3214996 from 62.5nM to 1µM. At 48 hours post-treatment, 20µL CellTiter-Glo® reagent was added to the plate and incubated at room temperature for approximately 5 minutes. Endpoint luminescence was read using a SynergyH4 (528/20 and hole filter sets, top read, 4mm read height, gain 135, 0.5 second integration time). Synergy graphs and ZIP, Bliss, Loewe, and HSA synergy scores were computed using SynergyFinder (32).
Caspase-Glo® 3/7 assay
Murine Nf1−/− dorsal root ganglia (DRG) neurosphere cells (DNSCs) were plated at a density of 15,000 cells per well in fibronectin (#F1141-5MG, Sigma-Aldrich) coated 96-well plates and allowed to adhere overnight. DNSCs were treated with 32.25nM or 62.5nM idarubicin (positive control) or a 2D dose matrix of increasing concentrations of abemaciclib (CDK4/6i) and LY3214996 (ERK1/2i) from 62.5nM to 1µM. At 48 hours post-treatment, 100µL Caspase-Glo® 3/7 reagent was added to the plate and allowed to incubate at room temperature for approximately 1 hour. Endpoint luminescence was read using a SynergyH4 (528/20 and hole filter sets, top read, 4mm read height, gain 135, 0.5 second integration time). Dose response curves of single agents and a 2D dose response matrix of both agents in combination were computed using SynergyFinder (32).
Colony Formation assays
Murine Nf1−/− DNSCs were plated at a density of 25,000 cells per well in fibronectin (#F1141-5MG, Sigma-Aldrich) coated 6-well plates, allowed to adhere overnight and then treated with either DMSO or 50 nM, 100nM and 250 nM of abemaciclib (CDK4/6i), 100 nM, 250nM, and 500nM of LY3214996 (ERK1/2i), or combinations. Cells were retreated every 3–4 days. After seven days, the media from the plates was removed and colonies were fixed with methylene blue. Analysis was performed using ImageJ (National Institutes of Health) to quantify densitometry of colonies normalized to background signal. Statistical analysis was conducted in GraphPad Prism as described below.
Pharmacokinetic (PK) evaluation of abemaciclib (CDK4/6i) and LY3214996 (ERK1/2i) in vivo
To assess the pharmacokinetic properties of LY3214996 and abemaciclib inhibitor therapy in vivo, peripheral blood was collected at 1, 2, 4, 8, and 24 hours after administering a single dose of 50mg/kg of each compound according to the previously established maximal tolerable does. Sciatic nerve tissues were collected at 4 and 24 hours after dosing for determination of tissue concentration.
LY3214996 and abemaciclib were quantified from mouse plasma using temazepam as the internal standard and HPLC-MS/MS (5500 QTRAP® Sciex, Framingham, MA). In brief, LY3214996, abemaciclib, and temazepam were separated by a gradient mobile phase (acetonitrile: 0.1% formic acid in water) with an Agilent Zorbax Eclipse XDB-C8 50X4.6 mm 5-micron column. The mass spectrometer utilized an electrospray ionization probe run in positive mode. The multiple reaction monitoring (MRM) Q1/Q3 (m/z) transitions for LY3214996, abemaciclib, and temazepam were 455.1/368.2, 506.9/393.2, and 301.0/255.2 respectively. Plasma samples and standards (20µL) were transferred to polypropylene tubes, temazepam was added as the internal standard (20µL of 0.1ng/µL), and the extraction was performed by the addition of 0.1M phosphate buffer (pH=7.4) followed by the addition of methyl tertiary butyl ether. The samples were then vortex mixed and centrifuged. Then the organic layer was transferred to a clean polypropylene tube and evaporated to dryness. The samples were reconstituted with methanol (50µL) and an aliquot (10µL) was injected to the HPLC-MS/MS. The standard curve was prepared in naïve mouse plasma with a linear range from 0.3 – 3000 ng/mL.
LY3214996 and abemaciclib were quantified from tissue samples using a slightly modified method from the plasma sample analysis. Briefly, the tissue was weighed then transferred to a polypropylene tube. Phosphate buffered saline, pH 7.4, was added to the tissue to bring the total volume to 0.5mL (assumption 1g=1mL). The tissue was homogenized using a TissueRuptor® with a single use disposable probe. An aliquot (0.4mL) was transferred to a clean polypropylene tube and temazepam was added as the internal standard, (20µL of 0.1ng/µL). The extraction procedure and HPLC-MS/MS conditions were the same as for the plasma samples. The standard curve was prepared in phosphate buffer with a linear range from 0.04 – 40ng/sample.
Non-compartmental analysis of the data was performed using PK Solver add-ins in Excel®. Pharmacokinetic parameters obtained included: Cmax (the maximal plasma concentration), tmax (the time of maximal plasma concentration), AUC0−∞ (area under the plasma concentration time curve from zero to infinity), kel (the elimination rate constant), and t1/2 (half-life, t1/2=0.693/kel). The AUC0−∞ was calculated from the AUC0-t (time zero to the last quantifiable concentration Clast) and the AUC from Clast to infinity (Clast/kel). The systemic clearance (Cl/F, where F is the bioavailability) was calculated from the dose and AUC0−∞. The apparent volume of distribution at steady state (Vdss/F) was calculated by the Cl and kel.
Pharmacodynamic evaluation of abemaciclib (CDK4/6i) and LY3214996 (ERK1/2i) in vivo
Cohorts of n=4 animals per group were treated with either vehicle, LY3214996, abemaciclib, or the combination for a duration of 7 days at a dose of 50 mg/kg/d for each compound. Mice were euthanized 4 hours after the final dose of compound was administered, and tumor bearing nerve tissues were collected and flash frozen for pharmacodynamic evaluation by western blot.
Experimental animals and genotyping
Genetically engineered Nf1flox/flox;PostnCre mice that develop multiple plexiform neurofibromas along the peripheral nerves were utilized for in vivo studies, with genotypes confirmed by polymerase chain reaction (PCR). The WT, Nf1 floxed, and recombination bands were detected using the following primers: P1: 5’-AATGTGAAATTGGTGTCGA GTAAGGTAACCAC 3’, P2: 5’- TTAAGAGCATCTGCTGCTCTTAGAGGGAA 3’, P3: 5’- TCAGACTGATTGTTGTACCTGAT GGTTGTACC 3’. PostnCre was detected using forward primer: 5’-TGTTTAGCTGGCCCAAATG-3’ and reverse primer: 5’-CGACCACTACCAGCAGAACA-3’. Animal care and experiments were conducted according to the guidelines established by the Indiana University Animal Care and Use Committee (IACUC).
In vivo drug treatment
Historical data from prior therapeutics studies conducted in the Nf1 flox/flox;PostnCre model indicated the coefficients of variation in tumor number and proximal nerve root volume to be approximately 30 and 35%, respectively. Thus, assuming a type I error rate of 5%, we conducted a power analysis indicating that n=12 animals per group would allow for detection of a 50% reduction in tumor number and a 30% difference in proximal nerve root volume with greater than 85% power.
Mice were treated with vehicle, abemaciclib, LY3214996 or the combination by daily oral gavage according to the dosing schedule outlined in Supplemental Table 6. Following 12 weeks of treatment, the mice were sacrificed and the peripheral nerves microdissected to quantify tumor burden as described below. LY3214996 mice started on 100mg/kg/d and transitioned to 50mg/kg/d due to toxicity were included in final analysis if they survived for 12 weeks of treatment.
Nerve tree microdissection and measurement of tumor volume
Immediately postmortem, mice were perfused and fixed in 10% neutral buffered formalin. The bodies were decalcified in a 50:50 solution of 10% formic acid and 10% neutral buffered formalin solution. The proximal spinal nerve roots from the lumbosacral spine were dissected microscopically. The volume of proximal peripheral nerves was determined using calipers to measure the length and width of dissected tumors (or equivalent region in absence of tumor) in maximal dimension. Volume was then approximated using the formula for the volume of a spheroid = 0.52 × (width)2 × length.
Histopathology
Nerve and tumor tissues were microdissected from euthanized animals, fixed and decalcified as described above. Specimens were then dehydrated with graded alcohols, cleared with xylenes, infiltrated with molten paraffin, and embedded in paraffin blocks. Five-micron thick sections were cut on a Leica rotary microtome and stained with hematoxylin and eosin (H&E). PNF throughout the peripheral nervous system were enumerated according to histopathological criteria described by Miettinen et al. (33) and as utilized in our previously published work (34).
Immunohistochemical (IHC) staining
IHC of SPI1 (#CST-2258, Cell Signaling Technology, RRID:AB_2186909, 1:200 dilution), ETV4 (#10684-1-AP, proteintech, RRID:AB_2100984, 1:200 dilution), CDK6 (#14052-1-AP, proteintech, RRID:AB_10642144, 1:200 dilution), and pRSK1 (#CST-11989, Cell Signaling Technology, RRID:AB_2687613, 1:300 dilution) in murine and human neurofibroma and normal nerve were performed by iHisto (Salem, MA). Human normal nerve was obtained from a peripheral nerve tumor tissue array (#SO1001b, US Biomax, Inc.). Tissues sections were deparaffinized and hydrated through xylenes or other clearing agents and graded alcohol series. Vector® Antigen Unmasking Solution, Citrate-based, pH 6.0 (H-3300) or Tris-based, pH 9.0 (H-3301) was applied. Sections were then incubated in BLOXALL Blocking Solution for 10 minutes, wash buffer for 5 minutes, 2.5% normal horse serum for 20 minutes, followed by incubation in primary antibody diluted in normal horse serum overnight. Sections were then washed in buffer for 5 minutes, followed by a 30-minute incubation with ImmPRESS Reagent and then an additional two 5-minute washes. Equal volumes of ImmPACT DAB EqV Reagent 1 with Reagent 2 were combined and mixed to generate ImmPACT DAB EqV working solution. Then, sections were incubated in ImmPACT DAB EqV working solution until the desired stain intensity was achieved. Finally, samples were washed twice in buffer for 5 minutes, rinsed in tap water, counterstained with hematoxylin, cleared and mounted.
IHC of human CDK4 (#BS-0633R, Bioss, RRID:AB_10856091, 1:400 dilution), murine and human phospho-Rb (S807/811) (#CST-8516, Cell Signaling Technology, RRID:AB_11178658, 1:100 dilution), murine CSF1R (#CST-3152, Cell Signaling Technology, RRID:AB_2085233, 1:100 dilution), and murine Ki67 (#ab16667, Abcam, RRID:AB_302459, 1:200 dilution) was performed in house. Human normal nerve was obtained from a peripheral nerve tumor tissue array (#SO1001b, US Biomax, Inc.). Tissue sections were incubated at 60°C for 1 hour and then deparaffinized and hydrated through xylenes and a graded alcohol series. Slides underwent antigen retrieval using sodium citrate, pH 6.0 or Tris-EDTA, pH 9.0 in a pressure cooker at low pressure for 3 minutes or high pressure for 15 minutes. Sections were cooled and then incubated in 3% hydrogen peroxide for 10 minutes, ddH2O twice for 5 minutes, tris buffered saline + Tween 20 (TBST) for 5 minutes, 5% goat serum blocking buffer for 1 hour, followed by incubation in primary antibody diluted in blocking buffer at 4°C overnight. Sections were then washed three times in TBST for 5 minutes each, incubated in secondary antibody (#ab205718, Abcam, 1:1000 dilution) diluted in blocking buffer for 1 hour at room temperature, followed by incubation with Vector® DAB Substrate Kit (SK-4100) until the desired stain intensity was achieved. Finally, samples were rinsed in tap water, counterstained with hematoxylin, cleared, and mounted.
Quantitative immunohistochemical analysis was conducted using the Cytonuclear IHC module for HALO Image Analysis software (version 2.0.5 for murine SPI1, murine and human phospho-Rb (S807/811), and murine CSF1R, version 1.6 for human ETV4, CDK6, and pRSK1; Indica Labs; RRID:SCR_018350). Cytonuclear analysis settings were optimized for each stain and the intensity of nuclear staining in each cell per field was scored by the algorithm as negative (0, blue), weakly positive (1+, yellow), moderately positive (2+, orange), or strongly positive (3+, red). Based on the degree of background staining, minimum optical density settings, and variations in nuclear staining intensity, either strongly positive cells (3+) or all positive cells (1+,2+, and 3+) were used for statistical analysis as denoted in the figure legends. Data was exported to GraphPad Prism for statistical analysis as described below.
Immunofluorescence (IF) staining
Immunofluorescence of phospho-Rb (S780) (#PA5-114632, Invitrogen, RRID:AB_2899268, 1:400 dilution) was performed utilizing nerve tissue from vehicle and drug treated mice. Tissue sections were incubated at 60° C for 1 hour and then deparaffinized and hydrated through xylenes and a graded alcohol series. Slides underwent antigen retrieval using Tris-EDTA, pH 9.0 in a pressure cooker at low pressure for 3 minutes. Sections were cooled and then incubated in 3% hydrogen peroxide for 10 minutes, ddH2O twice for 5 minutes, tris buffered saline + Tween 20 (TBST) for 5 minutes, 5% bovine serum albumin (BSA) blocking buffer for 1 hour, followed by incubation in primary antibody diluted in blocking buffer at 4°C overnight. Sections were then washed three times in TBST for 5 minutes each, incubated in Alexa Fluor™ 647 secondary antibody (#A-21245, Invitrogen, 1:2000 dilution) diluted in TBST for 1 hour at room temperature, rinsed in tap water, cleared, and mounted with ProLong Diamond™ antifade mountant with 4′,6‐diamidino‐2‐phenylindole (DAPI; #P36962, Invitrogen). Fluorescence signals were obtained using a Deltavision Ultra microscope with a 60X lens (GE Healthcare, Chicago, IL, USA). Images were acquired with z‐section of 0.2 μm each and deconvolved using Softworx (GE healthcare). Images were processed using Imaris (Bitplane, RRID:SCR_007370), with figures representing individual z‐sections of deconvolved stacks. Colocalization channels identifying areas of signal overlap between DAPI and phospho-Rb (S780) were generated using ImarisColoc for each field of view. The signal intensity sums of the colocalization and phospho-Rb (S780) channels were obtained from the colocalization channel surfaces constructed with the Surfaces module in Imaris. Statistical analysis was performed in GraphPad Prism as described below.
Western blot
Nerve tissue lysates for western blots in Fig. 2F, Fig. 4C, Fig. 6G, as well as Supplemental Figs. S5B, S10C and S10D were prepared as follows. One tablet cOmplete Mini Protease Inhibitor Cocktail (#11836153001, Roche) and one tablet PhosSTOP Phosphotase Inhibitor Cocktail (#4906837001, Roche) were added to 10mL xTractor buffer (#635671, Takara Bio) and mixed to generate lysis buffer. 200uL lysis buffer was added to each tissue sample, followed by sonication for 5 seconds at 70% AMPL three times and centrifugation for 20 minutes at 13,000rpm. Protein concentrations of the supernatants were determined using the Pierce BCA Protein Assay Kit (#23227, Thermo).
Figure 4. In vivo pharmacodynamic and anti-tumor activity of abemaciclib (CDK4/6i) and LY3214996 (ERK1/2i) single agent and combination therapy in plexiform neurofibroma bearing Nf1flox/flox;PostnCre mice.
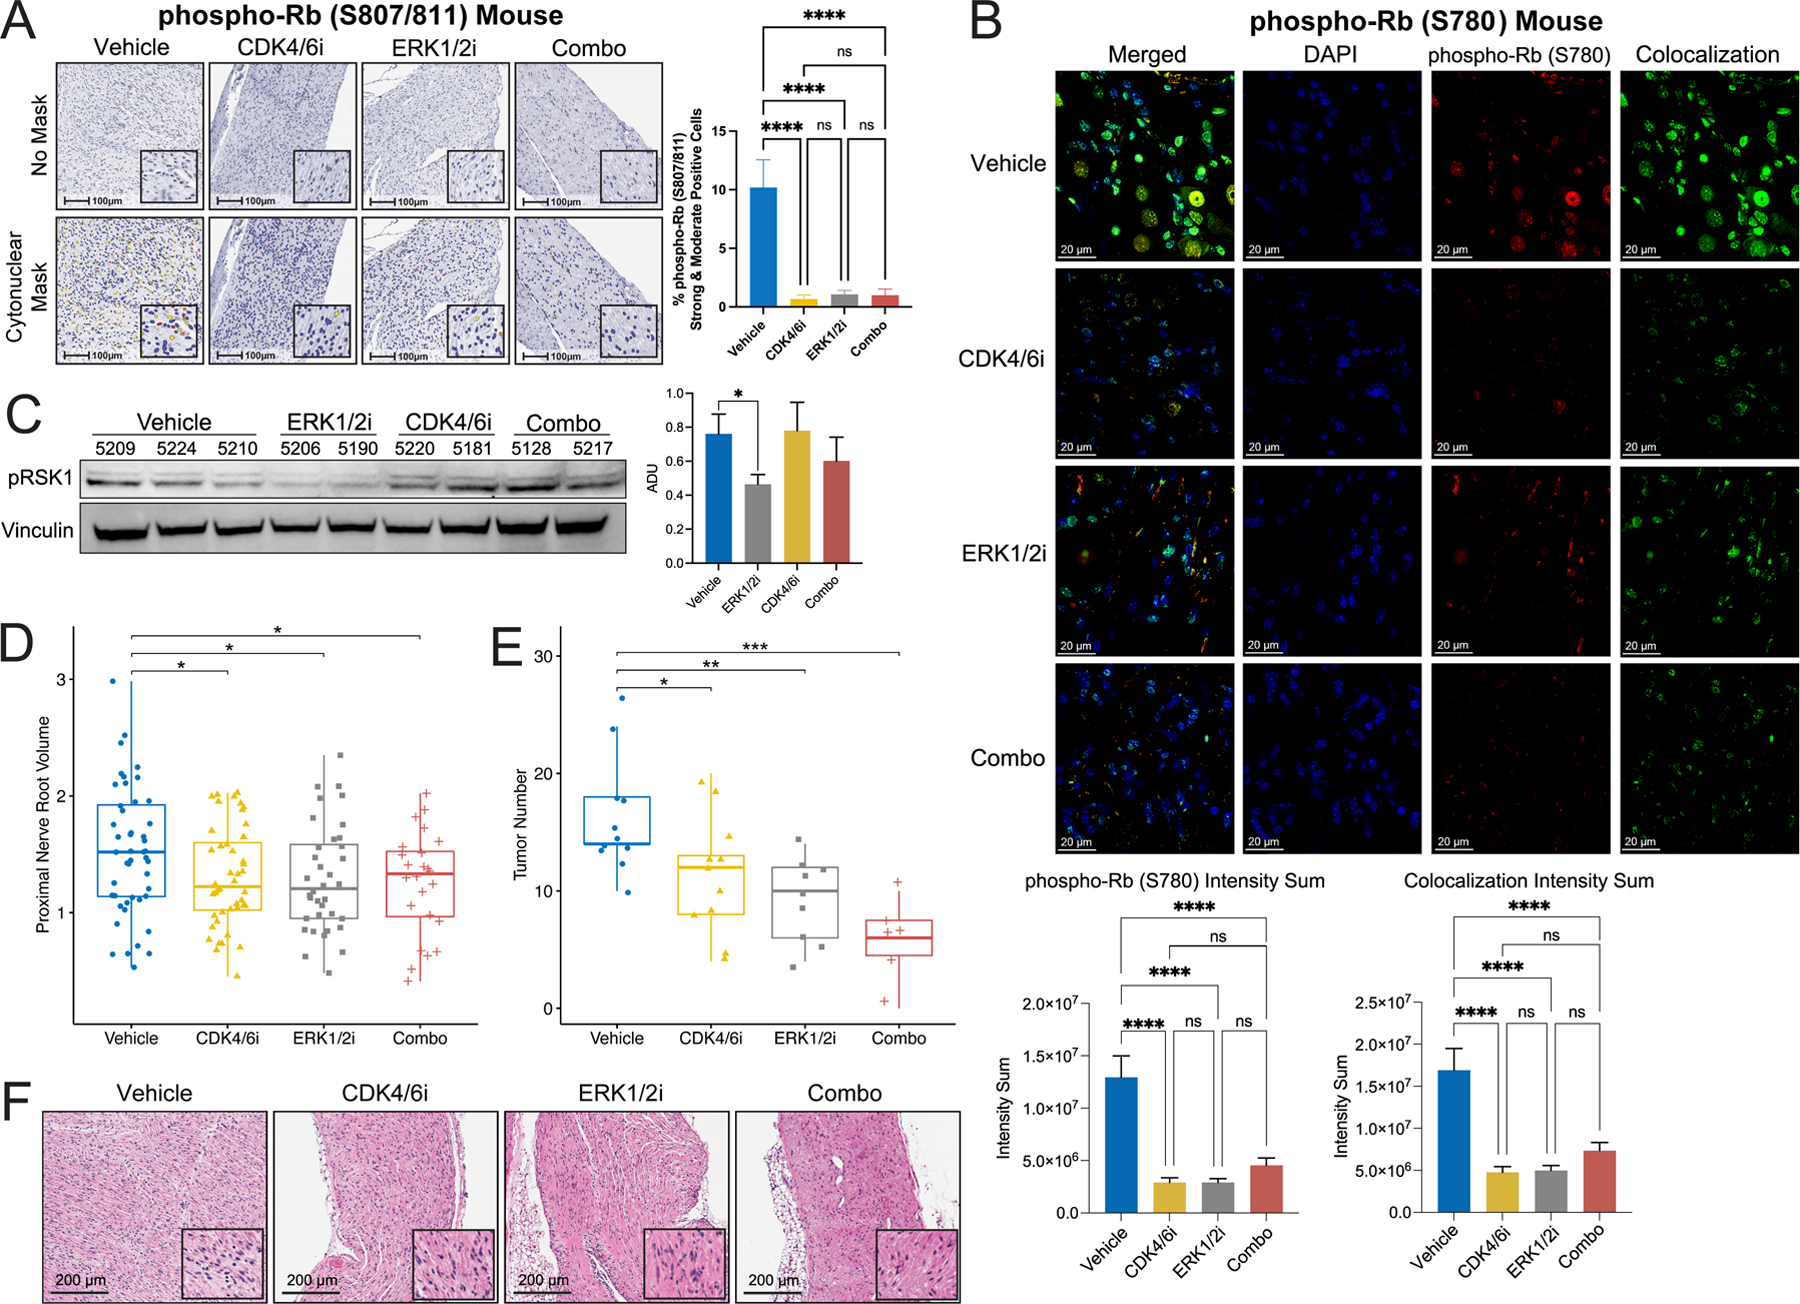
(A) Representative photomicrographs of phospho-Rb (S807/811) IHC staining of nerve tissue sections from Nf1flox/flox;PostnCre mice treated with vehicle, abemaciclib, LY3214996, and combination (Combo). Corresponding 100μm scale bars denote the magnification with inset high-power magnification showing nuclear localization. Bar graph shows the percentage of phospho-Rb (S807/811) positive cells quantified by the HALO Cytonuclear analysis algorithm (Indica Labs). n=6 Vehicle, n=5 abemaciclib, n=6 LY3214996, and n=6 combination (Combo) samples were analyzed with n=41, n=43, n=49, and n=47 fields respectively. Error bars reflect standard error of the mean (SEM). Asterisks indicate statistical significance according to Tukey’s multiple comparisons tests (**** = P ≤ 0.0001). (B) Representative images of immunofluorescent staining for phospho-Rb (S780) (Red) in nerve tissue sections from Nf1flox/flox;PostnCre mice treated with vehicle, abemaciclib, LY3214996 and combination (Combo). Colocalization channel (Green) generated with ImarisColoc demonstrates the degree of colocalization between DAPI (Blue) and phospho-Rb (S780) (Red). Bar graphs show quantification of the intensity sum of phospho-Rb (S780) (left) and colocalization channel (right) obtained from colocalization surfaces generated using ImarisSurfaces. Vehicle: n= 6, fields=11, surfaces= 511; abemaciclib: n= 5, fields= 9, surfaces= 227; LY3214996: n= 4, fields= 6, surfaces= 419; and Combo: n= 4, fields=7, surfaces=556. Asterisks indicate statistical significance according to Tukey’s multiple comparisons tests (**** = P ≤ 0.0001) and error bars reflect standard error of the mean (SEM). Corresponding 20 μm scale bars denote the magnification. (C) Representative western blot showing phospho-RSK1 (pRSK1) (S380) and Vinculin (loading control) expression in PNF bearing trigeminal nerve tissue from Nf1flox/flox;PostnCre mice treated with vehicle (n=7), abemaciclib (n=6), LY3214996 (n=6), or the combination (n=7) for 7 days. Bar graph showing quantification of arbitrary densitometry units (ADUs) obtained with ImageJ and normalized to loading control. Data reflects analysis of samples pooled from three independent experiments with additional blots shown in Supplemental Figure S10C. Asterisks indicate statistical significance for the comparison according to an unpaired, two-sided t-test with Welch’s correction (* = P ≤ 0.05) and error bars reflect standard error of the mean (SEM). (D) Proximal nerve root volume (mm3) was measured in mice treated with vehicle vs LY3214996 or abemaciclib monotherapy, vs the combination (Combo) for 12 weeks. The number of proximal spinal nerve roots evaluated per treatment group were as follows: vehicle (n=48), LY3214996 (n=36), abemaciclib (n=44), and the combination (n=24). Whiskers extend from the minima to maxima. The center line represents the median. The box spans the 25th to 75th percentiles. Outliers were identified by Grubbs test (alpha = 0.05) and excluded (vehicle, n=1 excluded). Asterisks indicate statistical significance of treatment vs vehicle according to an unpaired, two-sided t-test (* = P ≤ 0.05). (E) Microdissected nerve tissues were examined for histopathological evidence of plexiform neurofibroma. The mean number of plexiform neurofibroma tumors per mouse in each treatment group is shown in the plot. The number of independent animals evaluated per treatment group are as follows: vehicle (n=11 mice), LY3214996 (n=9), abemaciclib (n=11), and the combination (n=6). Whiskers extend from the minima to maxima. The center line represents the median. The box spans the 25th to 75th percentiles. Asterisks indicate statistical significance of treatment vs vehicle according to an unpaired, two-sided t-test (* = P ≤ 0.05, ** = P ≤ 0.01, *** = P ≤ 0.001). (F) Representative photomicrographs of H&E-stained sections of Nf1flox/flox;PostnCre mice tumor nerve tissue in each group after 12 weeks of vehicle, LY3214996, abemaciclib, or combination (Combo) treatment. Corresponding 200μm scale bars denote the magnification with inset high-power magnification highlighting tissue architecture.
Figure 6. LY3214996 (ERK1/2i) and abemaciclib (CDK4/6i) synergize to repress MAPK-dependent activation of ETV4 and DUSP6 in PNF in vivo.
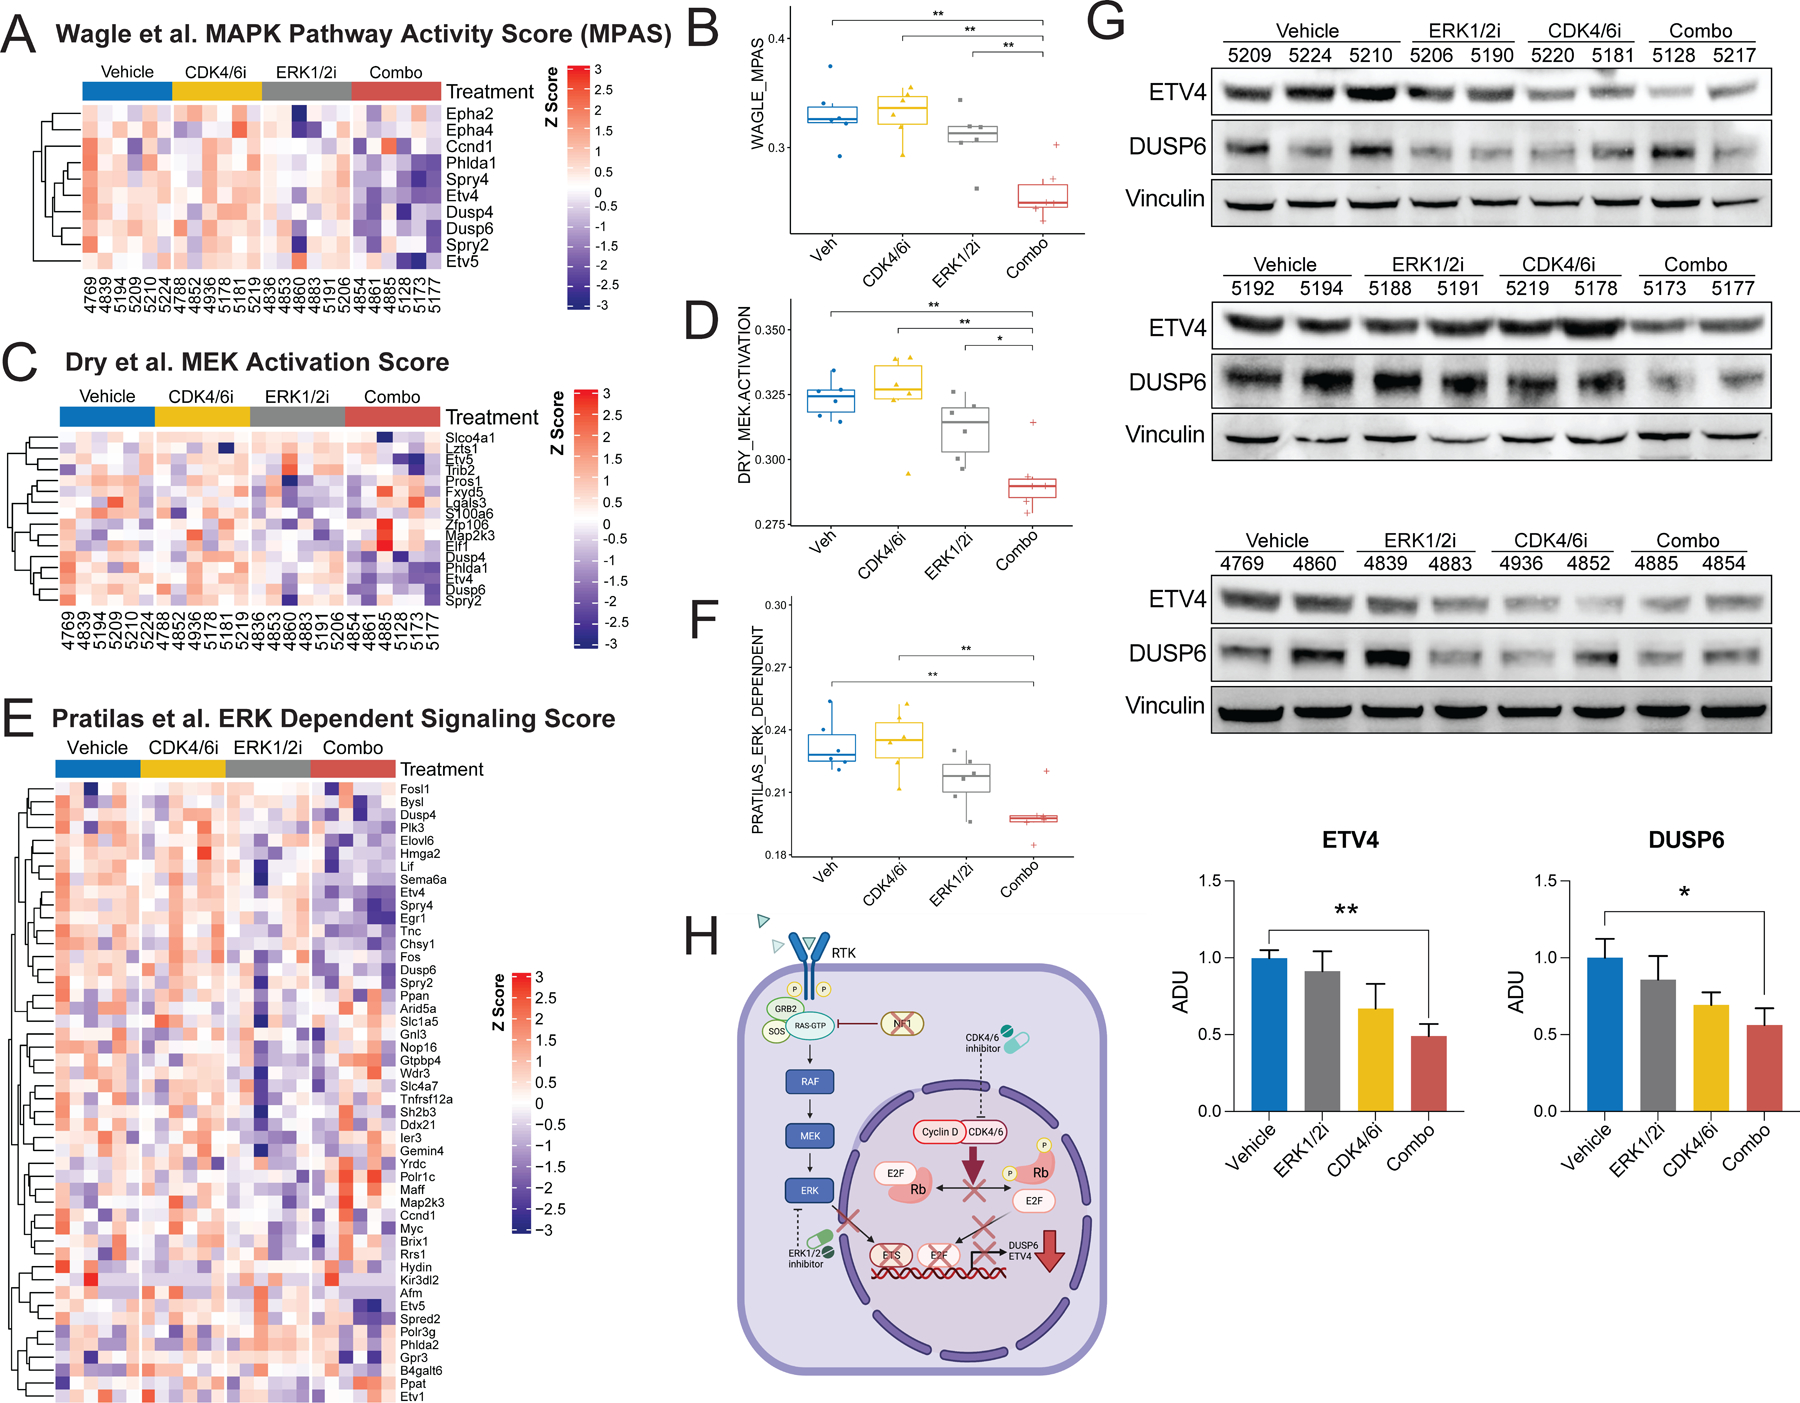
(A) Hierarchically-clustered heatmap of MAPK Pathway Activity Score (MPAS) signature genes, curated by Wagle et al., in PNF from Nf1flox/flox;PostnCre mice treated with vehicle (n=6), abemaciclib (n=6), LY3214996 (n=6), or combination therapy (Combo; n=6). 1-Pearson correlation was used to obtain a distance matrix with complete clustering. Gene expression values (rows) were Z-score normalized. (B) Box and whisker plots showing the Wagle et al. MAPK Pathway Activity Score (MPAS) in PNF from Nf1flox/flox;PostnCre mice treated with vehicle (n=6), abemaciclib (n=6), LY3214996 (n=6), or combination therapy (Combo; n=6). Whiskers extend from the minima to maxima. The center line represents the median. The box spans the 25th to 75th percentiles. Asterisks indicate statistical significance according to the Wilcoxon test (** = P ≤ 0.01). Non-significant comparisons are not shown. (C) Hierarchically-clustered heatmap of MEK activation score signature genes, curated by Dry et al., in PNF from Nf1flox/flox;PostnCre mice treated with vehicle (n=6), abemacicilb (n=6), LY3214996 (n=6), or combination therapy (Combo; n=6). 1-Pearson correlation was used to obtain a distance matrix with complete clustering. Gene expression values (rows) were Z-score normalized. (D) Box and whisker plots showing the Dry et al. MEK activation score in PNF from Nf1flox/flox;PostnCre mice treated with vehicle (n=6), abemaciclib (n=6), LY3214996 (n=6), or combination therapy (n=6). Whiskers extend from the minima to maxima. The center line represents the median. The box spans the 25th to 75th percentiles. Asterisks indicate statistical significance according to the Wilcoxon test (* = P ≤ 0.05; ** = P ≤ 0.01). Non-significant comparisons are not shown. (E) Hierarchically-clustered heatmap of ERK dependent signature genes, curated by Pratilas et al., in PNF from Nf1flox/flox;PostnCre mice treated with vehicle (n=6), abemacicilb (n=6), LY3214996 (n=6), or combination therapy (n=6). 1-Pearson correlation was used to obtain a distance matrix with complete clustering. Gene expression values (rows) were Z-score normalized. (F) Box and whisker plots showing the Pratilas et al. ERK dependent signature score in PNF from Nf1flox/flox;PostnCre mice treated with vehicle (n=6), abemaciclib (n=6), LY3214996 (n=6), or combination therapy (n=6). Whiskers extend from the minima to maxima. The center line represents the median. The box spans the 25th to 75th percentiles. Asterisks indicate statistical significance according to the Wilcoxon test (** = P ≤ 0.01). Non-significant comparisons are not shown. (G) ETV4, DUSP6, and Vinculin (loading control) were detected by Western blot in PNF bearing trigeminal nerve tissue from Nf1flox/flox;PostnCre mice treated with vehicle (n=7), abemaciclib (n=6), LY3214996 (n=6), or the combination (n=6) for 7 days. Bar graphs show quantification of arbitrary densitometry units (ADUs) calculated using ImageJ and normalized to loading control and average of vehicle. Analysis includes data generated from two independent animal experiments with western blots performed in triplicate. An additional blot shown in Supplemental Figure S10D demonstrates ETV4 and DUSP6 expression in the sciatic nerve of animals represented in Figure 6G. Asterisks indicate statistical significance for the comparisons according to Dunnett’s multiple comparisons test (* = P ≤ 0.05; ** = P ≤ 0.01) and error bars reflect standard error of the mean (SEM). (H) Schematic depicting molecular synergism of combined ERK1/2 and CDK4/6 pathway inhibition to reduce RAS/MAPK dependent DUSP6 and ETV4 transcriptional output in PNF.
Cell lysates for in vitro western blots in Fig. 3E and F as well as Supplemental Fig. S7B and S7C were prepared as follows. One tablet cOmplete Mini Protease Inhibitor Cocktail (#11836153001, Roche) and one tablet PhosSTOP Phosphatase Inhibitor Cocktail (#4906837001, Roche) were added to 10mL xTractor buffer (#635671, Takara Bio) and mixed to generate lysis buffer. At 24 hours post-treatment, 10cm plates of murine Nf1−/− DNSCs had media removed, were washed with phosphate buffered saline (PBS), pH 7.2 (#20012027, Gibco), dissociated with TrypLE (#12605010, Gibco), resuspended in DNSC complete media, and centrifuged for 5min at 1500rpm. The media supernatant was removed, the cell pellet was resuspended in 1mL PBS, pH 7.2 (#20012027, Gibco), and then centrifuged again for 5min at 1500rpm. The PBS supernatant was removed, and the cell pellet was resuspended in 150-200uL of lysis buffer depending on the size. At 24 hours post-treatment, 10cm plates of human immortalized NF1−/− Schwann cells (ipNF05.5 and ipNF95.6) had media removed, were washed with PBS, had 150-300uL lysis buffer added, and then were scraped and transferred to a 1.5mL Eppendorf tube to collect the cell lysate. Cell lysates were sonicated for 10 seconds at 35% AMPL twice, and then centrifuged for 10 minutes at 13,000rpm. The protein concentrations of the cell lysate supernatants were determined using the Pierce BCA Protein Assay Kit (#23227, ThermoFisher).
Figure 3. Additive inhibitory activity of abemaciclib (CDK4/6i) and LY3214996 (ERK1/2i) in primary murine Nf1−/− dorsal root ganglia (DRG) neurosphere cells (DNSCs) and human immortalized NF1−/− Schwann cells (ipNF05.5 and ipNF95.6) in vitro.
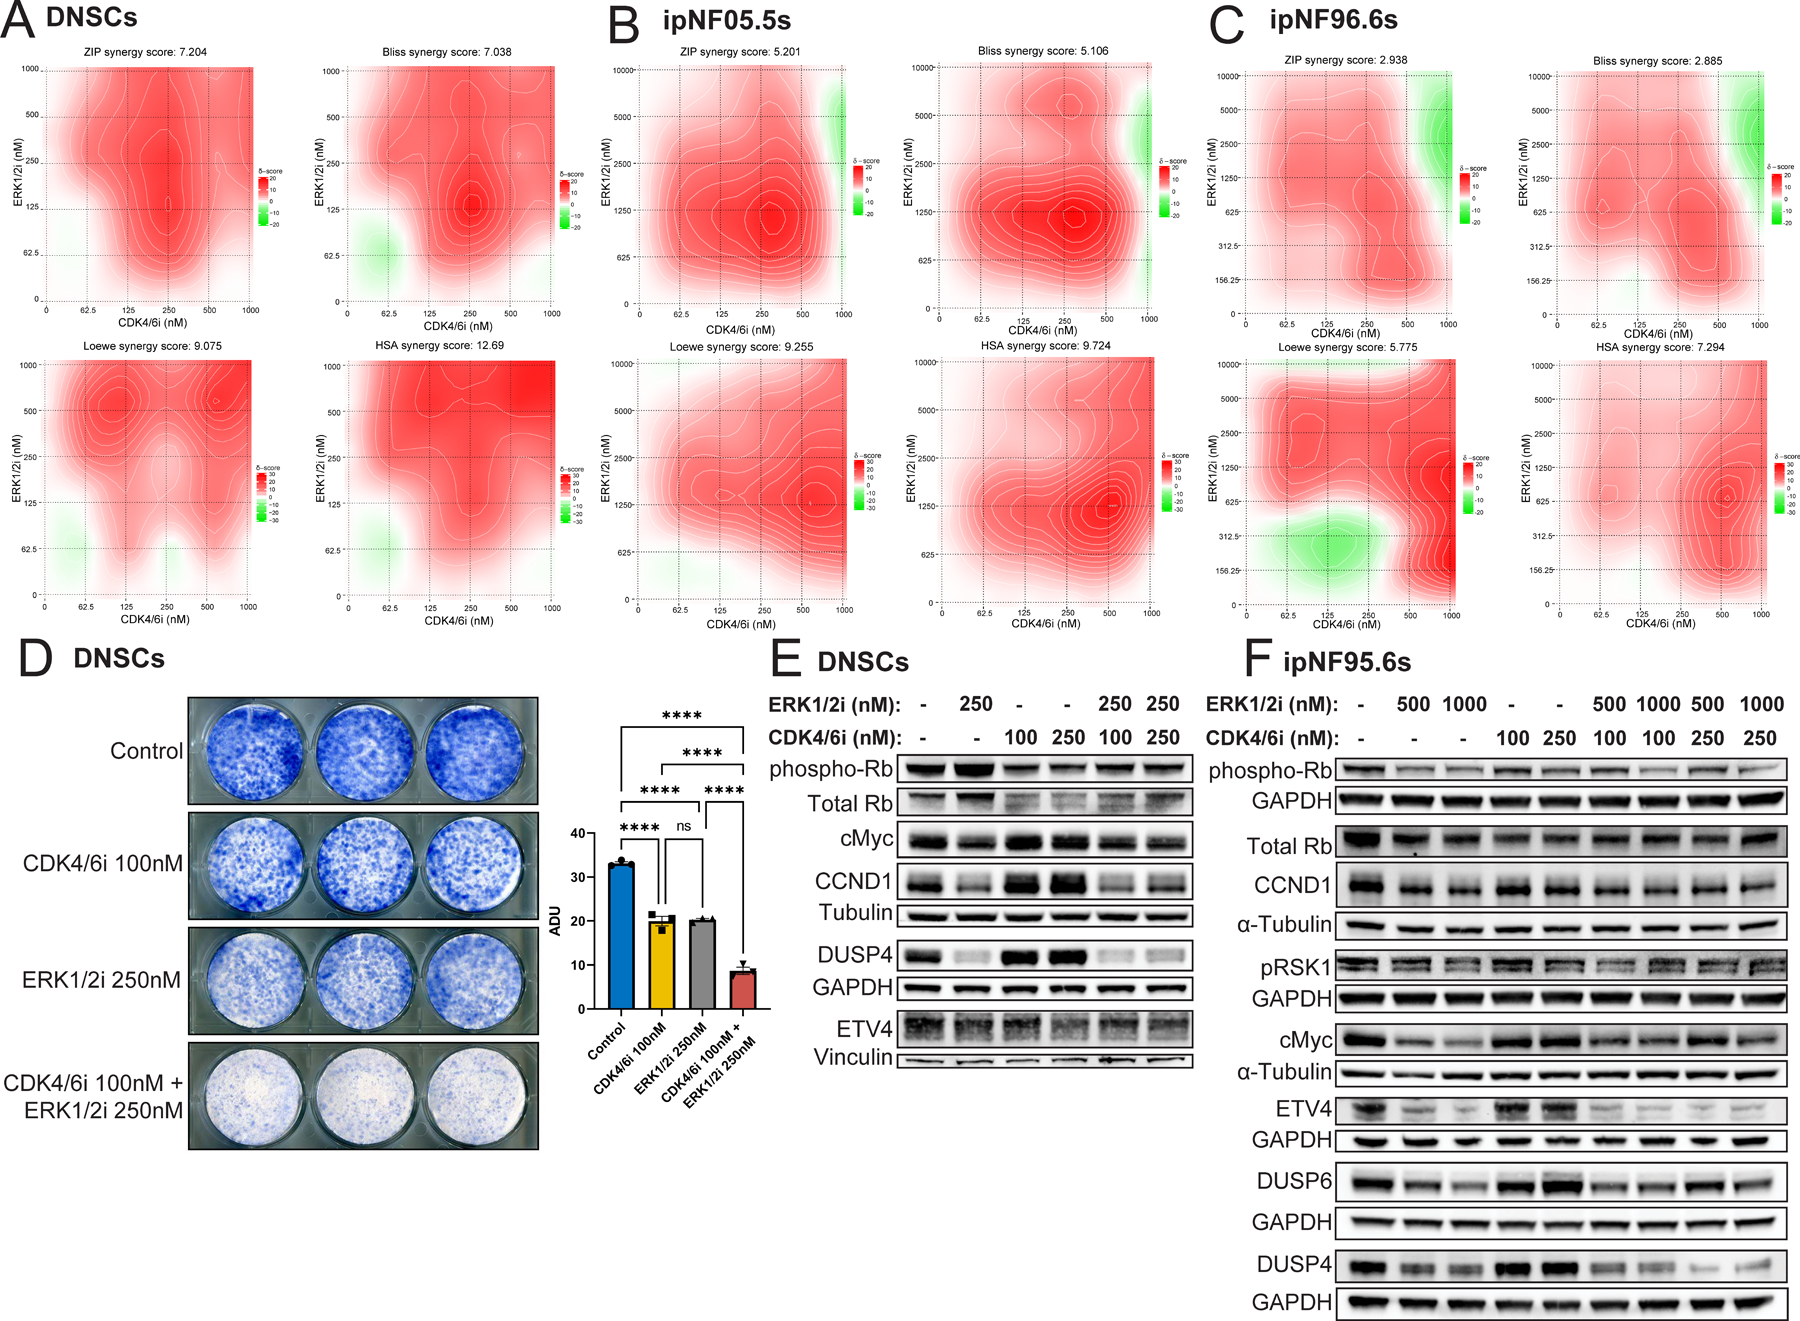
(A) Primary murine Nf1−/− dorsal root ganglia (DRG) neurosphere cell (DNSC) viability was evaluated at 48 hours by CellTiter-Glo® following exposure to escalating concentrations of LY3214996 and abemaciclib in a 2D dose response matrix. Data represent the mean of 2 replicates for each condition. Percent viability was calculated as drug condition Relative Light Units (RLU) divided by average vehicle RLU * 100. Synergy graphs and ZIP, Bliss, Loewe, and HSA synergy scores were computed using SynergyFinder. The experiment was repeated three times independently with similar results. (B) Human immortalized NF1−/− Schwann cell (ipNF05.5) viability was evaluated at 48 hours using CellTiter-Glo® following exposure to escalating concentrations of LY3214996 and abemaciclib in a 2D dose response matrix. Data represent the mean of 2 replicates for each condition. Percent viability was calculated as drug condition RLU divided by average vehicle RLU * 100. Synergy graphs and ZIP, Bliss, Loewe, and HSA synergy scores were computed using SynergyFinder. The experiment was repeated three times independently with similar results. (C) Human immortalized NF1−/− Schwann cell (ipNF95.6) viability was evaluated at 48 hours using CellTiter-Glo® following exposure to escalating concentrations of LY3214996 and abemaciclib in a 2D dose matrix. Percent viability was calculated as drug condition RLU divided by average vehicle RLU * 100. Synergy graphs and ZIP, Bliss, Loewe, and HSA synergy scores were computed using SynergyFinder. The experiment was repeated three times independently with similar results. (D) Colony formation assays were conducted in primary murine Nf1−/− DNSCs in the presence of DMSO, 250nM LY3214996, 100nM abemaciclib, and the combination. Colonies were stained with methylene blue after 7 days. Bar graph shows quantification of colony formation in arbitrary densitometry units (ADUs) measured in ImageJ for each well. Error bars reflect standard error of the mean (SEM). Asterisks indicate statistical significance for the comparison according to Tukey’s multiple comparisons tests (**** = P ≤ 0.0001).(E) Phospho-Rb (S807/811), total Rb, cMyc, CCND1, DUSP4, ETV4, Tubulin (loading control), Vinculin (loading control), and GAPDH (loading control) were detected by western blot in primary murine Nf1−/− DNSCs treated with DMSO, 250nM LY3214996, 100nM or 250nM abemaciclib, or a combination for 24 hours. The experiment was repeated twice with similar results. (F) Phospho-Rb (S807/811), total Rb, pRSK1, cMyc, CCND1, DUSP4, DUSP6, ETV4, α-Tubulin (loading control), Vinculin (loading control), and GAPDH (loading control) were detected by western blot in human immortalized NF1−/− Schwann cell (ipNF95.6) treated with DMSO, 500nM or 1µM LY3214996, 100nM or 250nM abemaciclib, or a combination for 24 hours. The experiment was repeated twice with similar results.
Isolated proteins were fractionated using NuPAGE 4–12% Bis-Tris Gels (#NP0322BOX , Invitrogen) and electro-transferred to PVDF membranes. Immunoblots were carried out using antibodies specific to CDK6 (#CST-3136, Cell Signaling Technology, RRID:AB_2229289), CDK4 (#sc-70832, Santa Cruz Biotechnology, RRID:AB_1121415), CSF1R (#CST-3152, Cell Signaling Technology, RRID:AB_2085233), STK10 (#25471-1-AP, Proteintech, RRID:AB_2880096), pERK1/2 (#CST-9101, Cell Signaling Technology, RRID:AB_331646), ETV4/Pea3 (#ab189826, Abcam or #10684-1-AP, proteintech, RRID:AB_2100984), DUSP6 (#ab76310, Abcam, RRID:AB_1523517), DUSP4 (#ab216576, Abcam), cMyc (#CST-18583, Cell Signaling Technology, RRID:AB_2895543), CCND1 (#CST-2922, Cell Signaling Technology, RRID:AB_2228523), phospho-RSK1 (pRSK1) (S380) (#CST-11989, Cell Signaling Technology, RRID:AB_2687613), phospho-Rb (S807/811) (#CST-8516, Cell Signaling Technology, RRID:AB_11178658), phospho-Rb (S780) (#CST-9307, Cell Signaling Technology, RRID:AB_330015), Rb (#CST-9313, Cell Signaling Technology, RRID:AB_1904119), vinculin (#CST-4650, Cell Signaling Technology, RRID:AB_10559207 or #CP74, Calbiochem, RRID:AB_2214490), alpha tubulin (#A11126, Invitrogen, RRID:AB_2534135), tubulin (#ab6161, Abcam, RRID:AB_305329), and GAPDH (#CST-5174, RRID:AB_10622025 or #CST-2118, RRID:AB_561053, Cell Signaling Technology). After incubation with appropriate HRP conjugated secondary antibodies Anti-rabbit (#NA934V, GE Healthcare), Anti-rat (#AP-136P, EMD), and Anti-mouse (#NA931V, Cytiva) signals were detected using ECL chemiluminescence substrate (ECL Prime, GE Healthcare).
Western blots for phospho-RSK1 (pRSK1) (T359) (#ab32413, Abcam, RRID:AB_2181172), pERK1/2 (#CST-4370, Cell Signaling Technology, RRID:AB_2315112), and Actin (#A5441, Sigma-Aldrich, RRID:AB_476744) loading control shown in Supplemental Fig. S10A and B were performed as follows. Nerve tissues were pulverized, and powdered tissues were transferred to a tube containing Lysine Matrix D beads (#6913–500, MP Biochemical) and RIPA buffer (#R0278, Sigma) with the Halt protease and phosphatase inhibitor cocktail (#78440, ThermoFisher). The samples were physically disrupted further on a FastPrep Cell Disruptor. The homogenates were spun at 20,000g for 30 minutes at 4°C, and protein concentrations of the supernatants were determined using the Pierce BCA Protein Assay Kit (#23225, ThermoFisher).
Samples were resolved on a 4–20% SDS-PAGE and transferred to a nitrocellulose membrane. The membrane was blocked in SEA BLOCK Blocking Buffer (#37527, ThermoFisher) for 1 hour at room temperature, and then incubated with primary antibodies overnight at 4°C. The membranes were washed with PBST, followed by incubation with a fluorescence labeled secondary antibody for 1 hour at room temperature. The membrane was then washed in phosphate buffered saline + Tween 20 (PBST) and scanned with a Li-Cor Odyssey Classic Infrared Imaging System using IR Dye 800CW Donkey Anti-Goat (#926–32214, LiCor, RRID:AB_621846), IR Dye 800CW Goat Anti-Mouse (#926–32210, LiCor, RRID:AB_621842), and Alexa Fluor 680 Goat Anti-Rabbit (#A-21076, Life Technologies, RRID:AB_2535736).
Densitometry analysis for western blots presented in Fig. 2F, Supplemental Fig. S10A and B was performed using KwikQuant Image Analyzer 5.9 (Kindle Biosciences, LLC) to measure the density of individual bands after correcting for background signal. Arbitrary densitometry units (ADUs) were calibrated to the band of highest intensity for each blot. Ratios of each protein of interest normalized to the loading control were then computed for statistical analysis in GraphPad Prism as described below. Western blot quantification for Fig. 4C and Fig. 6G was performed using ImageJ (National Institutes of Health) to measure the density of individual bands normalized to loading control and then normalized to the average of the vehicle. Statistical analysis was performed in GraphPad Prism as detailed below.
Statistical analysis
Statistical analyses were performed with GraphPad Prism 9.5.1 software (GraphPad, La Jolla, CA, RRID:SCR_002798). Outliers were identified by Grubbs test (alpha = 0.05) and excluded from statistical analyses and graphs. Analysis of variance (ANOVA) and Student’s t-tests with post-hoc correction for multiple comparisons were used to evaluate for statistically significant differences between samples as described in detail within the figure legends.
Data Availability
Raw FASTQ files pertaining to RNA sequencing data presented in this study are publicly available in the Gene Expression Omnibus database, accession numbers GSE213789 and GSE213787.
Results
Transcriptome profiling reveals converging signatures of RAS/MAPK and CDK4/6 pathway activation in murine PNF.
We began by performing RNA sequencing (RNAseq) to comprehensively characterize the transcriptional landscape of PNF arising in Nf1flox/flox;PostnCre+ mice and allow for the identification of differentially expressed genes in comparison to normal nerve tissue from Nf1flox/flox;PostnCre- wild-type (WT) control mice (Fig. 1A). Gene Set Enrichment Analysis (GSEA) of Hallmark signatures (Fig. 1B) further illuminated upregulation of RAS dependent signatures (Fig. 1C, Supplemental Fig. S1, Supplemental Table 1), ERK-dependent signaling (Fig. 1D) (35), and cell cycle related gene signatures (Fig. 1E and F, Supplemental Fig. S2) in murine PNF. Amongst cell cycle genes, we observed a coordinated increase in both cyclin dependent kinases (CDK) 4 and 6 (Cdk4 and 6) as well as D-type cyclins (Ccnd1, 2, and 3) that cooperate with CDK4/6 to activate E2F transcription factors through phosphorylation of the retinoblastoma protein (Rb) as cells proceed to S-phase of the cell cycle (36–38). Furthermore, we observed increased expression of downstream E2F target gene signatures (Supplemental Fig. S3) as well as the E26 transformation specific (ETS) family of transcription factors (Fig. 1G), including Spi1 and Etv4, which we validated by immunohistochemical assays in murine and human NF1-associated PNF respectively (Fig. 1H and I, Supplemental Fig. S4A and B).
Figure 1. Transcriptional signatures of murine PNF.
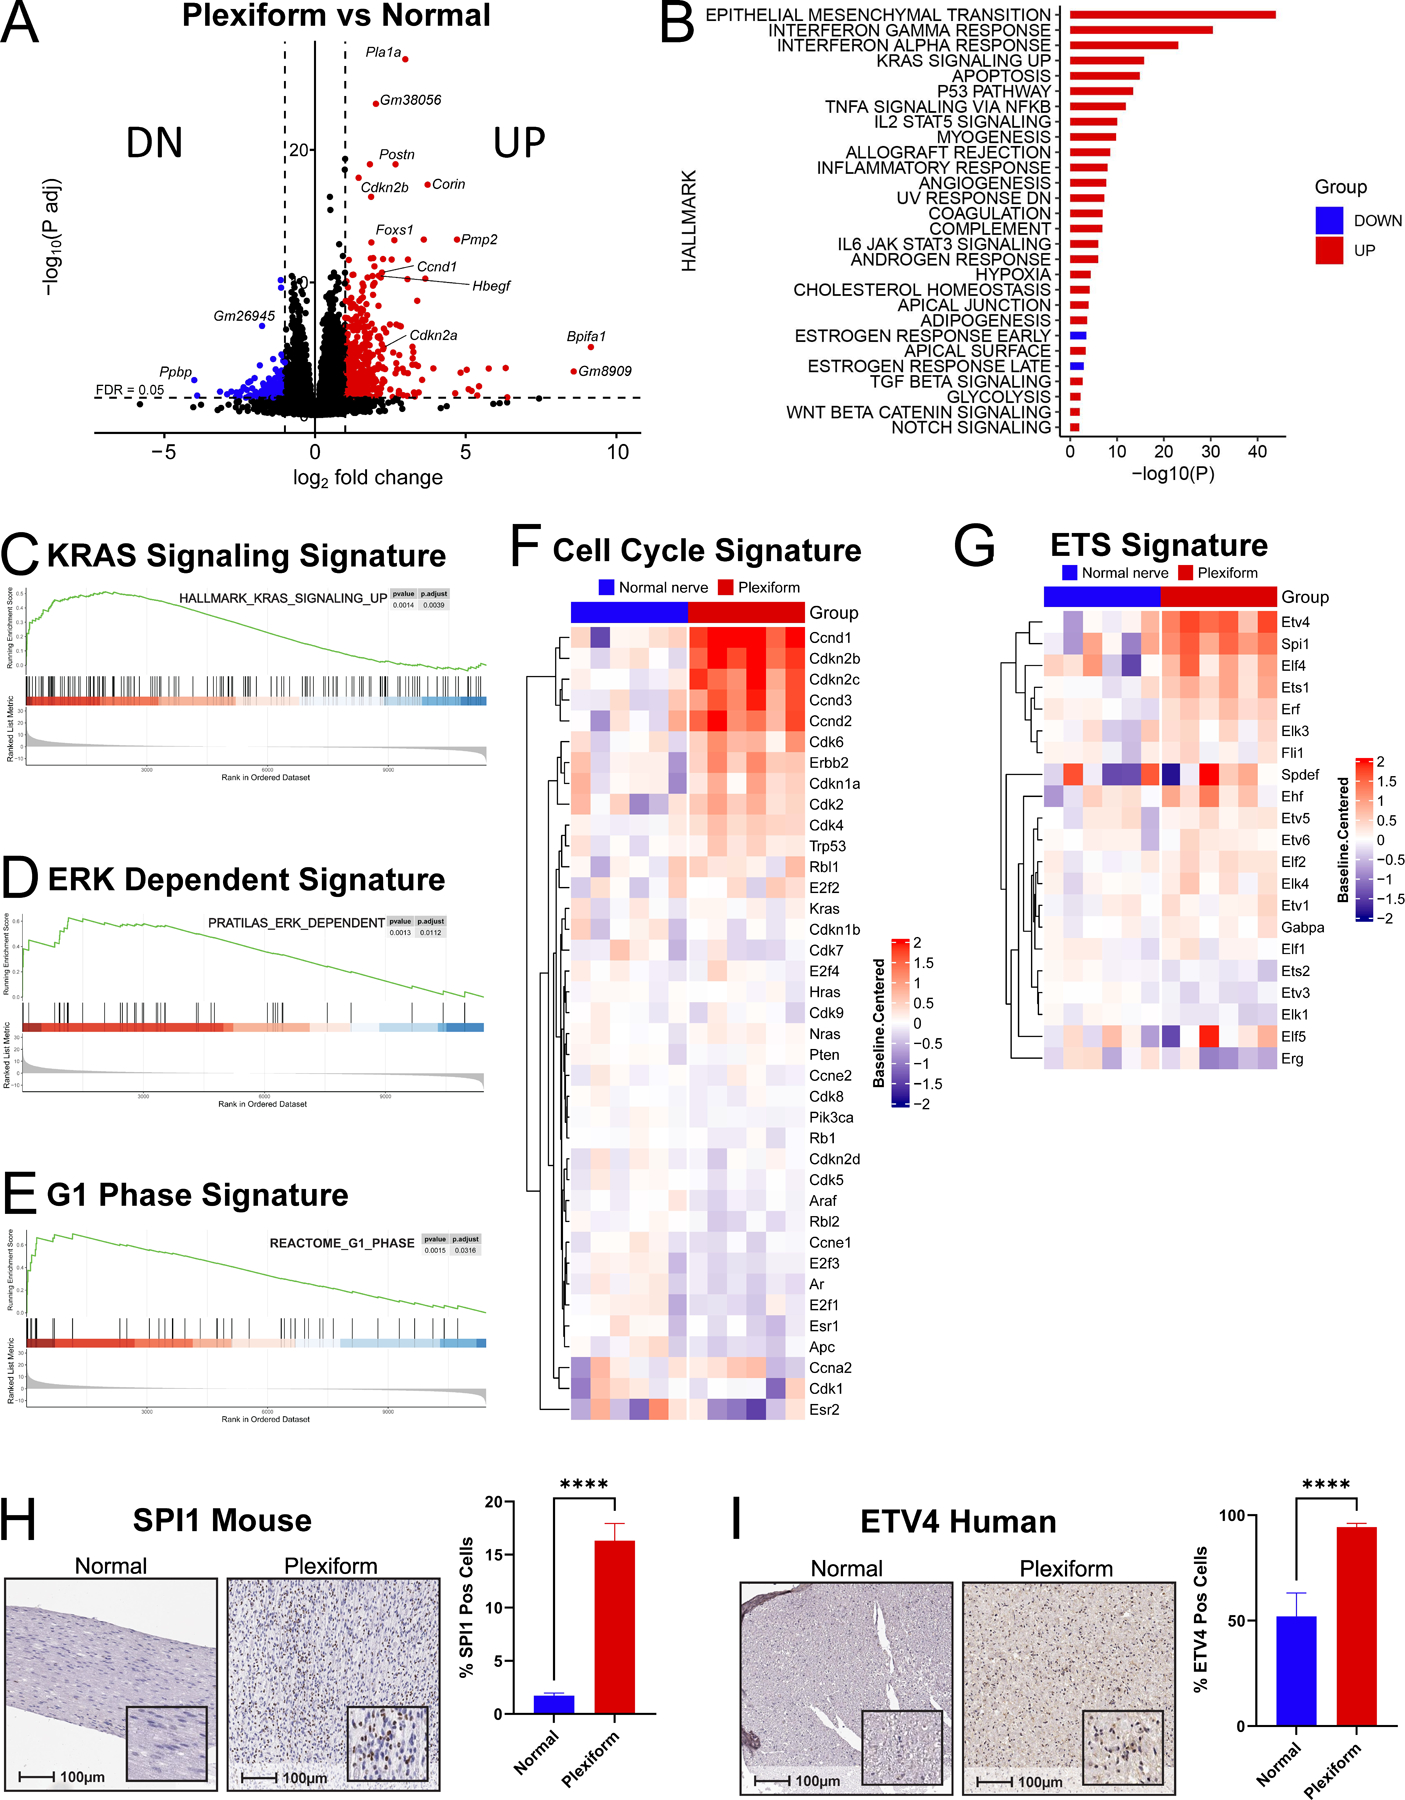
(A) Volcano plot depicting whole-transcriptome differentially expressed genes (DEGs) by RNAseq between PNF bearing trigeminal nerve tissue from Nf1flox/flox;PostnCre mice (Plexiform; n=6) vs wild-type (WT) control (Normal; n=6). The dashed horizontal line denotes a false discovery rate (FDR) of 0.05. The dashed vertical lines denote log2 fold-changes of −1 and 1. 510 upregulated genes with log2 fold-change of ≥ 1 and a -log10 adjusted p-value above the FDR threshold are denoted in red. 140 downregulated genes with log2 fold-change ≤ −1 and a -log10 adjusted p-value above the FDR threshold are denoted in green. (B) Hallmark gene signatures significantly up- or downregulated by overrepresentation analysis (ORA) of RNAseq data in PNF bearing trigeminal nerve tissue from Nf1flox/flox;PostnCre mice (Plexiform; n=6) vs WT control (Normal; n=6) (FDR ≤ 0.05). (C) Enrichment plot showing significantly upregulated Hallmark KRAS-signaling transcripts by Gene Set Enrichment Analysis (GSEA) in PNF bearing trigeminal nerve tissue from Nf1flox/flox;PostnCre mice (n=6) vs WT control (n=6). P-adj = 0.0039. (D) Enrichment plot showing significant upregulation of a MEK/ERK dependent gene signature described in Pratilas et al. PNAS, 2009 in PNF bearing trigeminal nerve tissue from Nf1flox/flox;PostnCre mice (n=6) vs WT control (n=6). P-adj = 0.0013. (E) Enrichment plot depicting significant upregulation of Reactome G1 phase signature genes by GSEA in PNF bearing trigeminal nerve tissue from Nf1flox/flox;PostnCre mice (n=6) vs WT control (n=6). P-adj =0.0316. (F) Hierarchically-clustered heatmap of cell cycle signature genes in WT trigeminal nerve tissue (Normal nerve; n=6) and PNF bearing trigeminal nerve tissue from Nf1flox/flox;PostnCre mice (Plexiform; n=6). 1-Pearson correlation was used to obtain a distance matrix with complete clustering. Gene expression values (rows) were Z-score normalized. (G) Hierarchically-clustered heatmap of ETS signature genes in WT trigeminal nerve tissue (Normal nerve; n=6) and PNF bearing trigeminal nerve tissue from Nf1flox/flox;PostnCre mice (Plexiform; n=6). 1-Pearson correlation was used to obtain a distance matrix with complete clustering. Gene expression values (rows) were Z-score normalized. (H) Representative photomicrographs of immunohistochemical (IHC) staining of SPI1 in WT (Normal) and PNF nerve tissue (Plexiform) sections from Nf1flox/flox;PostnCre mice. Corresponding 100μm scale bars denote the magnification with inset high-power magnification showing nuclear localization. Bar graph shows the percentage of SPI1 positive cells quantified by the HALO Cytonuclear analysis algorithm (Indica Labs). n=5 Normal and n=5 Plexiform samples were analyzed with n=49 and n=32 fields respectively. Error bars reflect standard error of the mean (SEM). Asterisks indicate statistical significance according to an unpaired, two-sided t-test (**** = P ≤ 0.0001). (I) Representative photomicrographs of ETV4 IHC-stained sections of normal nerve (Normal) from unaffected controls and PNF from human NF1 patients (Plexiform). Corresponding 100μm scale bars denote the magnification with inset high-power magnification showing nuclear localization. Bar graph shows the percentage of ETV4 positive cells quantified by the HALO Cytonuclear analysis algorithm (Indica Labs). n=6 Normal and n=6 Plexiform samples were analyzed with n=13 and n=24 fields respectively. Error bars reflect standard error of the mean (SEM). Asterisks indicate statistical significance according to an unpaired, two-sided t-test (**** = P ≤ 0.0001).
MIB/MS confirms functional enrichment of CDK4/6 activity in murine PNF.
Transcriptome profiling revealed dominant molecular signatures of both RAS/MAPK and CDK4/6 pathway activation in murine PNF. Seeking independent confirmation of these findings, we directly probed the functional state of the PNF kinome using MIB/MS. A total of 200 kinases were cumulatively identified in PNF-bearing Nf1flox/flox;PostnCre+ mice and Nf1flox/flox;PostnCre- wild-type (WT) control sciatic nerve tissue (Supplemental Table 2). Principal component analysis (PCA) (Fig. 2A) revealed global separation between tumor bearing and control nerve tissue. A generalized increase in PNF kinome enrichment was indicated by an overall enhancement in MIB binding relative to the control (Fig. 2B). Increased MIB binding of several tyrosine kinases with putative roles in the tumor microenvironment were observed (Fig. 2C and D) including AXL, which is expressed in endothelial cells, myeloid cells, and tumorigenic Schwann cells (39). AXL is a known target of cabozantinib, a multi-receptor tyrosine kinase inhibitor that has demonstrated activity in a recent multi-institutional phase 2 clinical trial in adult PNF (17). Additional kinases known to promote tumorigenesis and demonstrating activation in murine PNF compared to control included Colony Stimulating Factor 1 Receptor (CSF1R) (Supplemental Fig. S5A and B) (40), Serine/Threonine Kinase 10 (STK10) (Supplemental Fig. S5B) (41), Proto-oncogene tyrosine-protein kinase Src (SRC) (42), Receptor Interacting Serine/Threonine Kinase 3 (RIPK3) (43) and Feline sarcoma oncogene (FES) (44,45).
Orthogonal integration of the log2 fold changes in MIB binding and transcript expression confirmed CDK4 and CDK6 to be among the top enriched kinases in murine PNF with respect to both mRNA expression (RNAseq) and functional state (MIB binding) (Fig. 2E). We independently validated these findings by western blot (Fig. 2F). To determine if a parallel signature of CDK4/6 pathway activation was represented in human NF1-associated PNF, we performed immunohistochemical assays on human PNF tissue and normal control nerves from individuals without NF1. The results revealed increases in CDK6 (Fig. 2G, Supplemental Fig. S5B), CDK4 (Fig. 2H), phospho-Rb (S807/811) (Fig. 2I, Supplemental Fig. S5C), and the ERK1/2-dependent target, phosphorylated p90 ribosomal S6 kinase (pRSK1) (Supplemental Fig. S5D), in human PNF compared to healthy control nerve tissue. These data demonstrate coherence in signatures of RAS/MAPK and CDK4/6 pathway activation across murine and human PNF.
Abemaciclib (CDK4/6i) and LY3214996 (ERK1/2i) exhibit additive inhibition of murine and human NF1(Nf1) deficient Schwann cell proliferation and biochemical activity.
Given our findings implicating juxtaposed hyperactivation of CDK4/6 and RAS/MAPK dependent signaling in PNF, we sought to explore the therapeutic potential of CDK4/6 inhibition as a novel targeted therapy for PNF, both alone and in combination with pharmacologic inhibition of RAS/MAPK pathway. Abemaciclib (LY2835219) is a potent and selective inhibitor of CDK4/6 developed by Eli Lilly that has been FDA approved as first-line treatment for hormone receptor-positive, HER2-negative metastatic breast cancer (46). LY3214966 is a selective and potent ERK1/2 inhibitor that has demonstrated anti-tumor activity in pre-clinical models harboring BRAF, RAS, and MAP2K1 mutations (47) and has been well tolerated during preliminary safety studies in phase 1 clinical trials (48).
Murine Nf1−/− dorsal root ganglia (DRG) neurosphere cells (DNSCs) are Schwann cell precursors that represent the tumorigenic cells of origin for PNF (8), and have been employed in multiple studies to model PNF development in vivo and understand the molecular underpinnings of NF1 tumorigenesis (34,49). Primary murine DNSCs were isolated from E13.5 Nf1flox/flox embryos and transduced with adenovirus encoding Cre recombinase to ablate the floxed Nf1 alleles for synergy screens and biochemical assays as outlined below. Human NF1−/− immortalized Schwann cells (ipNF05.5 and ipNF95.6) are patient-derived neurofibroma cell lines obtained from the Peggy Wallace lab (31) and have been utilized in the preclinical evaluation of a number of targeted therapeutic agents for NF1-associated PNF, including cabozantinib (17), TAK-733 (MEKi) (50), and selumetinib (51). Using these murine and human NF1−/− (Nf1−/−) cell lines, we evaluated the anti-proliferative and biochemical additivity of abemaciclib and LY3214996 in vitro.
Nf1−/− DNSCs, ipNF05.5s, and ipNF95.6s were treated with a 2D dose response matrix of increasing concentrations of abemaciclib and LY3214996 and then cell viability was measured using Cell Titer Glo ® (Promega) (Fig. 3A, B, and C). Nf1−/− DNSCs showed a mix of additivity (ZIP score = 7.204, Bliss score = 7.038, Loewe score = 9.075) and synergy (HSA score = 12.69), with additivity defined as a score between −10 and 10 and synergy as a score ≥ 10. Concordantly, human NF1−/− Schwann cell lines showed primarily additivity with synergy scores ranging from 5.106 to 9.724 and 2.885 to 7.294 for the ipNF05.5 and ipNF95.6s, respectively. Additionally, to investigate the apoptotic effect of these drugs, a Caspase-Glo® 3/7 (Promega) assay was used to measure activated caspase-3/7 in DNSCs 48 hours after treatment with the same 2D dose response matrix implemented in the Cell Titer Glo ® assays above (Supplemental Fig. S6). Idarubicin was included as a positive control. Apoptosis was not observed with either single agent or the combination, suggesting a predominantly cytostatic effect of abemaciclib, LY3214996, and the combination.
To investigate the long-term effect of the single agents and combination, Nf1−/− DNSCs were plated at low density, treated with submicromolar concentrations of abemaciclib, LY3214996, and the combination, and left to form colonies for one week. We observed a significant additive effect with the combination as compared to the single agents at 100nM abemaciclib and 250nM LY3214996, indicated by reduced colony formation (Fig. 3D, Supplemental Fig. S7A).
Additionally, to confirm target inhibition with monotherapy and biochemical additivity of the combination, western blots of CDK4/6 and ERK1/2 dependent signaling targets, including cMyc, CCND1, phospho-RSK1 (pRSK1), phospho-Rb (S807/811), phospho-Rb (S780), DUSP4, DUSP6, and ETV4, were performed in the DNSCs (Fig. 3E), ipNF05.5s (Supplemental Fig. S7B), and ipNF95.6s (Fig. 3F, Supplemental Fig. S7C). At physiologically relevant doses of abemaciclib (25-250nM) and LY3214996 (250nM-1μM), reduction of downstream targets, including ETS transcription factors, was observed at 24 hours post-treatment. Furthermore, decreased expression of several of these proteins, including DUSP4 and ETV4, was seen to a greater degree with combination treatment as compared to monotherapy across the three cell lines.
Importantly, unlike in a malignant cancer where potent cytotoxicity is often required to achieve therapeutic benefit, in indolent, slow growing tumors such as PNF, cytostatic agents including selumetinib (and other MEK inhibitors) (10–14) and cabozantinib (17) have demonstrated robust biological activity in patients. Therefore, based on the potent additivity of combined abemaciclib and LY3214996 in arresting the growth of primary murine Nf1−/− DNSCs and human immortalized NF1−/− Schwann cells in vitro, we proceeded to test the activity of abemaciclib alone and in combination with LY3214996 in spontaneous PNF arising in Nf1flox/flox;PostnCre mice. These mice harbor conditional biallelic inactivation of Nf1 in embryonic Schwann cell precursors driven by Cre recombinase expression under the control of a 3.9kb fragment of the Periostin promoter (52–54).
Pharmacokinetic (PK) analysis of abemaciclib (CDK4/6i) and LY3214996 (ERK1/2i) in Nf1flox/flox;PostnCre mice.
To ensure effective concentrations of abemaciclib and LY3214996 were achieved in both the plasma and PNF-bearing nerve tissues of Nf1flox/flox;PostnCre mice, we conducted pharmacokinetic profiling following single doses of abemaciclib (50 mg/kg) and LY3214996 (50 mg/kg) administered by oral gavage. Consistent with previously published data (55), abemaciclib and LY3214996 exhibited excellent oral bioavailability, achieving peak plasma concentrations of 1.5 µg/mL at 2 hours after administration and 2.4 µg/mL at 4 hours after administration, respectively (Supplemental Fig. S8 and Supplemental Table 3). Notably, robust penetration into nerve tissue was also observed with a Cmax of 0.8 µg/g for abemaciclib 4 hours after administration, and 69 ng/mL for LY3214996 4 hours after administration. The half-life (t1/2) of LY3214996 and abemaciclib in plasma was approximately 2.3 and 44 hours, respectively. Maximally tolerated doses of abemaciclib (50 mg/kg) and LY3214996 (50 mg/kg) alone and in combination were established in pilot studies, where mice treated at an initial dose of 100 mg/kg LY3214996 exhibited excess mortality due to gastroparesis. Thus, a dose of 50 mg/kg LY3214996 was subsequently used for efficacy studies with considerably improved tolerability albeit still with some excess mortality as compared to the vehicle and abemaciclib treated mice (Supplemental Fig. S9). We did not observe increased toxicity in the combination treated mice relative to LY3214996 monotherapy. We attribute these side effects to species and strain dependent findings in the Nf1flox/flox;PostnCre model as we have observed similar toxicity in other preclinical therapeutics studies utilizing these mice. Importantly, LY3214996 has been well tolerated clinically and similar adverse events have not been observed at bioequivalent doses in human subjects (48).
Pharmacodynamic activity of abemaciclib (CDK4/6i) and LY3214996 (ERK1/2i) in PNF bearing mice.
Having established that abemaciclib and LY3214996 achieved biologically relevant concentrations in the plasma and PNF bearing nerve tissues of Nf1flox/flox;PostnCre mice, we sought to further establish pharmacodynamic evidence of target inhibition in the tumor tissue itself. Immunohistochemistry of phospho-Rb (S807/811) and immunofluorescence of phospho-Rb (S780), downstream markers of the CDK4/6 pathway (56–59), indicated significant reduction in the nerves of single agent abemaciclib and combination treated mice (Fig. 4A and B). We observed reduction in the ERK1/2-dependent target, phospho-RSK1(pRSK1) (S380 and T359), by western blot in both LY3214996 and combination treated mice (Fig. 4C, Supplemental Fig. S10A-C). LY3214996 mediated inactivation of ERK1/2 itself is regulated through feedback activation of c-Raf (47), thus levels of phosphorylated ERK1/2 (pERK1/2) were not suppressed even in LY3214996 treated mice (Supplemental Fig. S10A and B) in accordance with previously published findings. These biochemical data, together with the observed additivity of combined CDK4/6 and ERK1/2 inhibition in abrogating NF1(Nf1) deficient Schwann cell growth led us to postulate that the combination of abemaciclib plus LY3214996 may exhibit enhanced activity against PNF in vivo in Nf1flox/flox;PostnCre mice.
Abemaciclib (CDK4/6i) and LY3214996 (ERK1/2i) in combination exhibit enhanced anti-tumor activity in PNF bearing Nf1flox/flox;PostnCre mice in vivo.
To establish the efficacy of abemaciclib and LY3214996 alone and in combination in the treatment of PNF in vivo, Nf1flox/flox;PostnCre mice with established PNF were treated, starting at 4 months of age (Supplemental Table 4), with either vehicle control, abemaciclib (50 mg/kg daily), LY3214996 (50 mg/kg daily), or abemaciclib (50 mg/kg daily) plus LY3214996 (50 mg/kg daily) in combination for a duration of 12 weeks. Upon completion of therapy, mice were euthanized, and the peripheral nerve tissues were harvested by microdissection to measure the size of proximal spinal nerve roots and quantify tumor burden by histopathology. Single agent abemaciclib and LY3214996 significantly reduced both proximal nerve root volume (Fig. 4D) and the total number of PNF per mouse (Fig. 4E). Notably, the combination of abemaciclib plus LY3214996 resulted in a greater reduction in the number of PNF tumors per mouse as compared to either drug alone, with normalization of nerve microarchitecture observed on hematoxylin and eosin (H&E) staining (Fig. 4F).
Abemaciclib (CDK4/6i) and LY3214996 (ERK1/2i) synergize to repress MAPK-dependent activation of ETV4 and DUSP6 in PNF in vivo.
Given that abemaciclib and LY3214996 combination therapy exhibited enhanced anti-tumor activity in PNF in vivo, we extended our investigation to explore the molecular mechanisms associated with this apparent synergy. RNAseq was performed on flash frozen PNF bearing sciatic nerve tissues from mice treated with vehicle, single agent abemaciclib or LY3214996, and the combination. Intriguingly, in PNF treated with single agent abemaciclib relative to the vehicle control, we observed compensatory upregulation of many differentially expressed genes (DEGs) when evaluating both unadjusted and multiplicity adjusted p-values (Fig. 5A-C, Supplemental Fig. S11A and C, Supplemental Table 5). The DEG expression pattern in response to LY3214996 was mixed with an approximately equal number of up- and downregulated genes (Fig. 5A, B, and D; Supplemental Fig. S11A and D; Supplemental Table 4). Contrastingly, with combination therapy we observed a notable shift toward downregulation of DEGs, indicating a distinct global transcriptional response to combined CDK4/6 and ERK1/2 inhibition as compared to monotherapy (Fig. 5A, B, and E; Supplemental Fig. S11A, B, and E; Supplemental Table 5). While the expression of proliferative genes was not impacted by either abemaciclib or LY3214996 monotherapy, the combination produced a significant reduction in the expression of multiple M-phase related genes including Mki67 and Ccnb1 (Fig. 5F and G). Immunohistochemical-staining of Ki67 revealed no significant difference in Ki67 positive cells between the treatment groups, likely due to the low proliferative index of these benign tumors at baseline (Supplemental Fig. S12).
To further dissect the molecular basis for this observed synergy, we interrogated the activation state of the RAS-MAPK pathway in abemaciclib, LY3214996 and combination treated PNF bearing nerve tissues by employing a ten gene panel to score MAPK Pathway Activation (Fig. 6A).This panel was described by Wagle et al. as a clinically relevant prognostic biomarker in multiple cancer types (60) and we observed repression of the MAPK Pathway Activation Score (MPAS) with combination therapy compared to the single agents or the vehicle control (Fig. 6B). Similarly, scoring of MEK activation using a 16 gene panel (Fig. 6C), curated by Dry and colleagues (61) and shown to predict sensitivity to MEK inhibitor in melanoma, colon, breast and lung xenograft models, again demonstrated pronounced suppression of MEK activation with combined inhibition of ERK1/2 and CDK4/6 (Fig. 6D). Concordantly, a signature of ERK-dependent genes established by Pratilas et al. using BRAFV600E tumor cells (35), was also significantly reduced in response to LY3214996 monotherapy and to an even greater extent with combination therapy (Fig. 6E and F). Several genes overlapped between the Wagle, Dry, and Pratilas signatures and among these, Dups4, Dusp6, Etv4, and Phlda1 were significantly downregulated with the combination treatment in comparison with abemaciclib or LY3214996 alone (Supplemental Fig. S13). Similar to the results observed in primary murine Nf1−/− DNSCs and human immortalized NF1−/− Schwann cell lines (Fig. 3E and F, Supplemental Fig. S7B), ETV4 and DUSP6 were significantly reduced in response to combination therapy by western blot in murine PNF in vivo (Fig. 6G and Supplemental Fig. S10D and E). Collectively, these findings suggest that CDK4/6 and ERK1/2 inhibition synergize to suppress MAPK-dependent activation of ETV4 and DUSP6 in PNF (Fig. 6H).
Discussion
PNF cause significant pain, disfigurement, and a range of other serious functional morbidities in persons with NF1 (5). Hyperactivation of the RAS/RAF/MEK/ERK signaling cascade is recognized to underlie PNF genesis and progression. Moreover, pharmacologic targeting of this axis with MEK inhibitors (MEKi) has demonstrated clinical efficacy (10–14), however there remains a significant subset of patients who do not exhibit durable responses. Unfortunately, beyond the RAS/MAPK axis itself, the functional landscape of activated protein kinases in PNF remains poorly characterized. In order to rationally inform the development and repurposing of kinase inhibitors for treatment of PNF, we set out to comprehensively profile the functional PNF kinome in a genetically engineered mouse model that has predicted biological responses in the clinic with high fidelity (13,14,17,23).
Employing a combination of MIB/MS and RNAseq, we identified convergent molecular signatures of RAS/MAPK and CDK4/6 pathway hyperactivation in PNF. Concordantly, we also observed increased expression of E2F and ETS-related genes, including the ETV4 transcription factor in murine and human PNF. The ETS family of transcription factors plays critical physiologic roles in embryonic development (62), cell stemness (63), and has been implicated in the pathobiology of a range of human cancers including undifferentiated round cell sarcoma (64), synovial sarcoma (65), and other solid malignancies (66). Importantly, ETS transcription factors and their downstream targets have been implicated in driving resistance to MAPK pathway inhibition in human cancer (67).
Informed by multi-omic analyses demonstrating enrichment of RAS/MAPK and CDK4/6 dependent signaling in PNF, we evaluated the combination of ERK1/2i (LY3214996) and CDK4/6i (abemaciclib) in PNF in vitro and in vivo. While MEKi has been extensively studied in preclinical PNF models (16,68) and human NF1 patients (10–14), we selected the ERK1/2 inhibitor, LY3214996, for this study because ERK reactivation is a common mechanism of acquired resistance to MEKi therapies in multiple human cancers (69,70) suggesting that the direct inhibition of ERK may provide an opportunity to prevent compensatory resistance mechanisms (47,71). Furthermore, LY3214996 and abemaciclib have already been administered concurrently in early phase clinical trials to establish optimal phase 2 combination doses (NCT04534283, NCT04391595), thus providing an expedient path forward to clinical translation. Utilizing both human and murine NF1−/− (Nf1−/−) Schwann cell cultures, we observed robust additivity of abemaciclib in combination with LY3214996 in vitro. Consistent with these findings, the combination of abemaciclib and LY3214996 exhibited enhanced anti-tumor activity in Nf1flox/flox;PostnCre mice in vivo, associated with pronounced suppression of MAPK-dependent expression of ETS signature genes including ETV4.
PNF are associated with an 8–13% lifetime incidence of transformation to malignant peripheral nerve sheath tumor (MPNST), a highly aggressive form of soft tissue sarcoma that represents the leading cause of death in persons with NF1 (72). Unfortunately, MPNST development has been observed in patients receiving MEK inhibitors, suggesting that MEKi monotherapy is insufficient to prevent malignant transformation (73). The malignant transformation of PNF often occurs through the development of atypical neurofibroma/atypical neurofibromatous neoplasms of uncertain biological potential (ANF/ANNUBP), which are characterized by the presence of cytologic atypia, hypercellularity, loss of neurofibroma architecture, and a mitotic index between 1/50 and 3/10 high power fields (33). Notably, 60–90% of these premalignant lesions exhibit loss of the CDKN2A/B locus (9p21.3) (74,75), which encodes a key tumor suppressor complex known to control both p53 and phosphorylation of the retinoblastoma protein (Rb) through negative regulation of CDK4/6 (76,77).
In previous studies, we reported that inactivation of Nf1 in embryonic neural crest cells together with the loss of the Cdkn2a alternate reading frame (Arf) is necessary and sufficient to drive the development of murine ANF/ANNUBP, which spontaneously progress to MPNST with high penetrance (34). These murine ANNUBP lesions exhibited notable increases in phospho-Rb relative to PNF suggesting that in addition to aberrant RAS/RAF/MEK signaling, disruption of the CDK4/6-Rb pathway may contribute to disease progression. Concordant with these findings, RNAseq of a series of human NF1-associated PNF, ANF and MPNST revealed transcript expression of cyclins D1 and D2 (CCND1 and CCND2) and CDK4/6 to be significantly elevated in tumors spanning the entire neurofibroma to MPNST continuum compared to normal tissues (75). It has been predicted that loss of CDKN2A may confer increased sensitivity to CDK4/6 inhibition (78), and given these data, it is conceivable that CDK4/6 inhibition may be efficacious across a spectrum of NF1-associated tumors including ANF/ANNUBP and MPNST. Supporting this hypothesis, Wang and colleagues recently reported enhanced and durable activity of combined SHP2 and CDK4/6 inhibition in patient derived xenograft models of NF1-associated MPNST (79) that frequently harbor functional inactivation of CDKN2A. Contrastingly, a study profiling a large number of human cancer cell lines suggested that CDKN2A mutation may endow resistance to CDK4/6 inhibition by allowing cancer cells to maintain Rb phosphorylation via compensatory activation of CDK2-dependent signaling (80). In the present studies conducted in benign PNF, we did not observe evidence of CDK2-mediated adaptive resistance to CDK4/6 pathway inhibition as previously reported in other malignant cancers. Further investigation of CDK2 and other potential resistance mechanisms to CDK4/6 inhibitors in ANF/ANNUBP and MPNST preclinical models that have a high incidence of CDKN2A loss is needed. Notably, a phase I/II study at the National Cancer Institute (NCT04750928) is actively enrolling patients to assess the safety and response rate of abemaciclib (CDK4/6i) in the treatment of NF1-associated ANF that cannot or will not be surgically resected.
In summary, the present investigation highlights the utility of systems biology in combination with high fidelity preclinical models to rationally inform target selection in orphan diseases such as NF1, where geographic dispersion of limited patient numbers poses a critical bottleneck to conducting clinical trials. Collectively, these data strongly support further clinical evaluation of CDK4/6 pathway inhibitors alone and in combination in early phase trials for NF1-associated peripheral nerve sheath tumors where treatment options remain limited, and a significant subset of patients remain unresponsive to currently available therapies. Importantly, further investigation will be needed to determine whether CDK4/6 inhibition either as a single agent or in combination with other targeted therapies can alter the natural history of tumor progression along the neurofibroma to MPNST continuum, either by delaying and/or preventing the malignant transformation to ANF precursor lesions that harbor CDKN2A copy number loss and are not amenable to surgical resection. Leveraging preclinical models in conjunction with integrated, multi-omic approaches to comprehensively define mechanisms of treatment response and adaptive resistance will be critical for developing rational combination therapies that achieve deeper and more durable therapeutic responses in future early phase trials where patient numbers remain limited.
Supplementary Material
Acknowledgments
This publication was supported by a Subagreement from the Johns Hopkins University via the Neurofibromatosis Therapeutic Acceleration Program (NTAP) with funds provided by Grant Agreement from the Bloomberg Family Foundation (Award ID 182015). Its contents are solely the responsibility of the authors and do not necessarily represent the official views of the Bloomberg Family Foundation or the Johns Hopkins University. This research was supported by a Developmental and Hyperactive Ras Tumor SPORE funded through the NIH/NCI (U54CA196519-04, DWC), and grants from the NIH/NIDDK (U24DK116204, GLJ) and NIH/NCI (U01CA238475, GLJ). Abemaciclib and LY3214996 were provided by Loxo@Lilly | Eli Lilly and Company. Steven Rhodes is supported by the Francis S. Collins Scholars Program in Neurofibromatosis Clinical and Translational Research funded by the Neurofibromatosis Therapeutic Acceleration Program (NTAP), a K08 Mentored Clinical Scientist Research Career Development Award funded by the NIH/National Institute of Neurological Disorders and Stroke (NINDS) (1K08NS128266–01), the Department of Pediatrics at the Indiana University (IU) School of Medicine and the IU Simon Comprehensive Cancer Center (IUSCCC). Mass spectrometry work and non-compartmental analysis was provided by the Clinical Pharmacology Analytical Core at Indiana University School of Medicine; a core facility supported by the IUSCCC Support Grant (P30CA082709). RNA sequencing was performed by the Center for Medical Genomics at Indiana University School of Medicine. We also thank the Precision Health Initiative at Indiana University and the Riley Children’s Foundation for their support of this project.
Footnotes
Conflict of Interest Statement
W. Shen is an employee and stockholder at Loxo@Lilly | Eli Lilly and Company. J. Liu is an employee and stockholder at Loxo@Lilly | Eli Lilly and Company. A. Aggarwal was an employee and stockholder at Loxo@Lilly | Eli Lilly and Company while these studies were conducted. A. Aggarwal is currently an employee and stockholder of Daiichi Sankyo. G.P. Donoho is an employee and stockholder at Loxo@Lilly | Eli Lilly and Company. M.D. Willard is an employee and stockholder at Loxo@Lilly | Eli Lilly and Company. S.V. Bhagwat was an employee and stockholder at Loxo@Lilly | Eli Lilly and Company while these studies were conducted and has an ownership interest (including patents) in Eli Lilly and Company.
Abemaciclib and LY3214996 were provided by Loxo@Lilly | Eli Lilly and Company.
References
- 1.Friedman JM. Epidemiology of neurofibromatosis type 1. Am J Med Genet 1999;89(1):1–6. [PubMed] [Google Scholar]
- 2.Ballester R, Marchuk D, Boguski M, Saulino A, Letcher R, Wigler M, et al. The NF1 locus encodes a protein functionally related to mammalian GAP and yeast IRA proteins. Cell 1990;63(4):851–9 doi 10.1016/0092-8674(90)90151-4. [DOI] [PubMed] [Google Scholar]
- 3.Viskochil D, Buchberg AM, Xu G, Cawthon RM, Stevens J, Wolff RK, et al. Deletions and a translocation interrupt a cloned gene at the neurofibromatosis type 1 locus. Cell 1990;62(1):187–92 doi 10.1016/0092-8674(90)90252-a. [DOI] [PubMed] [Google Scholar]
- 4.Wallace MR, Marchuk DA, Andersen LB, Letcher R, Odeh HM, Saulino AM, et al. Type 1 neurofibromatosis gene: identification of a large transcript disrupted in three NF1 patients. Science 1990;249(4965):181–6 doi 10.1126/science.2134734. [DOI] [PubMed] [Google Scholar]
- 5.Ferner RE, Gutmann DH. Neurofibromatosis type 1 (NF1): diagnosis and management. Handb Clin Neurol 2013;115:939–55 doi 10.1016/B978-0-444-52902-2.00053-9. [DOI] [PubMed] [Google Scholar]
- 6.Needle MN, Cnaan A, Dattilo J, Chatten J, Phillips PC, Shochat S, et al. Prognostic signs in the surgical management of plexiform neurofibroma: the Children’s Hospital of Philadelphia experience, 1974–1994. J Pediatr 1997;131(5):678–82 doi 10.1016/s0022-3476(97)70092-1. [DOI] [PubMed] [Google Scholar]
- 7.Prada CE, Rangwala FA, Martin LJ, Lovell AM, Saal HM, Schorry EK, et al. Pediatric plexiform neurofibromas: impact on morbidity and mortality in neurofibromatosis type 1. J Pediatr 2012;160(3):461–7 doi 10.1016/j.jpeds.2011.08.051. [DOI] [PubMed] [Google Scholar]
- 8.Chen Z, Liu C, Patel AJ, Liao CP, Wang Y, Le LQ. Cells of origin in the embryonic nerve roots for NF1-associated plexiform neurofibroma. Cancer Cell 2014;26(5):695–706 doi 10.1016/j.ccell.2014.09.009. [DOI] [PMC free article] [PubMed] [Google Scholar]
- 9.Zhu Y, Ghosh P, Charnay P, Burns DK, Parada LF. Neurofibromas in NF1: Schwann cell origin and role of tumor environment. Science 2002;296(5569):920–2 doi 10.1126/science.1068452. [DOI] [PMC free article] [PubMed] [Google Scholar]
- 10.McCowage GB, Mueller S, Pratilas CA, Hargrave DR, Moertel CL, Whitlock J, et al. Trametinib in pediatric patients with neurofibromatosis type 1 (NF-1)–associated plexiform neurofibroma: A phase I/IIa study. Journal of Clinical Oncology 2018;36(15_suppl):10504- doi 10.1200/JCO.2018.36.15_suppl.10504. [DOI] [Google Scholar]
- 11.Mueller S, Reddy AT, Dombi E, Allen J, Packer R, Clapp W, et al. NFB-17. MEK INHIBITOR BINIMETINIB SHOWS CLINICAL ACTIVITY IN CHILDREN WITH NEUROFIBROMATOSIS TYPE 1- ASSOCIATED PLEXIFORM NEUROFIBROMAS: A REPORT FROM PNOC AND THE NF CLINICAL TRIALS CONSORTIUM. Neuro-Oncology 2020;22(Supplement_3):iii420–iii1 doi 10.1093/neuonc/noaa222.619. [DOI] [Google Scholar]
- 12.Weiss B, Plotkin S, Widemann B, Tonsgard J, Blakeley J, Allen J, et al. NFM-06. NF106: PHASE 2 TRIAL OF THE MEK INHIBITOR PD-0325901 IN ADOLESCENTS AND ADULTS WITH NF1-RELATED PLEXIFORM NEUROFIBROMAS: AN NF CLINICAL TRIALS CONSORTIUM STUDY. Neuro-Oncology 2018;20(suppl_2):i143–i doi 10.1093/neuonc/noy059.514. [DOI] [PMC free article] [PubMed] [Google Scholar]
- 13.Dombi E, Baldwin A, Marcus LJ, Fisher MJ, Weiss B, Kim A, et al. Activity of Selumetinib in Neurofibromatosis Type 1-Related Plexiform Neurofibromas. N Engl J Med 2016;375(26):2550–60 doi 10.1056/NEJMoa1605943. [DOI] [PMC free article] [PubMed] [Google Scholar]
- 14.Gross AM, Wolters PL, Dombi E, Baldwin A, Whitcomb P, Fisher MJ, et al. Selumetinib in Children with Inoperable Plexiform Neurofibromas. N Engl J Med 2020;382(15):1430–42 doi 10.1056/NEJMoa1912735. [DOI] [PMC free article] [PubMed] [Google Scholar]
- 15.Dundee MPPaUUUo. 2021. List of clinically approved kinase inhibitors. <https://www.ppu.mrc.ac.uk/list-clinically-approved-kinase-inhibitors>. [Google Scholar]
- 16.Jessen WJ, Miller SJ, Jousma E, Wu J, Rizvi TA, Brundage ME, et al. MEK inhibition exhibits efficacy in human and mouse neurofibromatosis tumors. J Clin Invest 2013;123(1):340–7 doi 10.1172/JCI60578. [DOI] [PMC free article] [PubMed] [Google Scholar]
- 17.Fisher MJ, Shih CS, Rhodes SD, Armstrong AE, Wolters PL, Dombi E, et al. Cabozantinib for neurofibromatosis type 1-related plexiform neurofibromas: a phase 2 trial. Nat Med 2021;27(1):165–73 doi 10.1038/s41591-020-01193-6. [DOI] [PMC free article] [PubMed] [Google Scholar]
- 18.Yang FC, Ingram DA, Chen S, Zhu Y, Yuan J, Li X, et al. Nf1-dependent tumors require a microenvironment containing Nf1+/−- and c-kit-dependent bone marrow. Cell 2008;135(3):437–48 doi 10.1016/j.cell.2008.08.041. [DOI] [PMC free article] [PubMed] [Google Scholar]
- 19.Angus SP, Stuhlmiller TJ, Mehta G, Bevill SM, Goulet DR, Olivares-Quintero JF, et al. FOXA1 and adaptive response determinants to HER2 targeted therapy in TBCRC 036. NPJ Breast Cancer 2021;7(1):51 doi 10.1038/s41523-021-00258-0. [DOI] [PMC free article] [PubMed] [Google Scholar]
- 20.Duncan JS, Whittle MC, Nakamura K, Abell AN, Midland AA, Zawistowski JS, et al. Dynamic reprogramming of the kinome in response to targeted MEK inhibition in triple-negative breast cancer. Cell 2012;149(2):307–21 doi 10.1016/j.cell.2012.02.053. [DOI] [PMC free article] [PubMed] [Google Scholar]
- 21.Stuhlmiller TJ, Zawistowski JS, Chen X, Sciaky N, Angus SP, Hicks ST, et al. Kinome and Transcriptome Profiling Reveal Broad and Distinct Activities of Erlotinib, Sunitinib, and Sorafenib in the Mouse Heart and Suggest Cardiotoxicity From Combined Signal Transducer and Activator of Transcription and Epidermal Growth Factor Receptor Inhibition. J Am Heart Assoc 2017;6(10) doi 10.1161/JAHA.117.006635. [DOI] [PMC free article] [PubMed] [Google Scholar]
- 22.Brighton HE, Angus SP, Bo T, Roques J, Tagliatela AC, Darr DB, et al. New Mechanisms of Resistance to MEK Inhibitors in Melanoma Revealed by Intravital Imaging. Cancer Res 2018;78(2):542–57 doi 10.1158/0008-5472.CAN-17-1653. [DOI] [PMC free article] [PubMed] [Google Scholar]
- 23.Robertson KA, Nalepa G, Yang FC, Bowers DC, Ho CY, Hutchins GD, et al. Imatinib mesylate for plexiform neurofibromas in patients with neurofibromatosis type 1: a phase 2 trial. Lancet Oncol 2012;13(12):1218–24 doi 10.1016/S1470-2045(12)70414-X. [DOI] [PMC free article] [PubMed] [Google Scholar]
- 24.Dobin A, Davis CA, Schlesinger F, Drenkow J, Zaleski C, Jha S, et al. STAR: ultrafast universal RNA-seq aligner. Bioinformatics 2013;29(1):15–21 doi 10.1093/bioinformatics/bts635. [DOI] [PMC free article] [PubMed] [Google Scholar]
- 25.Patro R, Duggal G, Love MI, Irizarry RA, Kingsford C. Salmon provides fast and bias-aware quantification of transcript expression. Nat Methods 2017;14(4):417–9 doi 10.1038/nmeth.4197. [DOI] [PMC free article] [PubMed] [Google Scholar]
- 26.Durinck S, Moreau Y, Kasprzyk A, Davis S, De Moor B, Brazma A, et al. BioMart and Bioconductor: a powerful link between biological databases and microarray data analysis. Bioinformatics 2005;21(16):3439–40 doi 10.1093/bioinformatics/bti525. [DOI] [PubMed] [Google Scholar]
- 27.Love MI, Huber W, Anders S. Moderated estimation of fold change and dispersion for RNA-seq data with DESeq2. Genome Biol 2014;15(12):550 doi 10.1186/s13059-014-0550-8. [DOI] [PMC free article] [PubMed] [Google Scholar]
- 28.Gu Z, Eils R, Schlesner M. Complex heatmaps reveal patterns and correlations in multidimensional genomic data. Bioinformatics 2016;32(18):2847–9 doi 10.1093/bioinformatics/btw313. [DOI] [PubMed] [Google Scholar]
- 29.Hulsen T, de Vlieg J, Alkema W. BioVenn - a web application for the comparison and visualization of biological lists using area-proportional Venn diagrams. BMC Genomics 2008;9:488 doi 10.1186/1471-2164-9-488. [DOI] [PMC free article] [PubMed] [Google Scholar]
- 30.Metz KS, Deoudes EM, Berginski ME, Jimenez-Ruiz I, Aksoy BA, Hammerbacher J, et al. Coral: Clear and Customizable Visualization of Human Kinome Data. Cell Syst 2018;7(3):347–50 e1 doi 10.1016/j.cels.2018.07.001. [DOI] [PMC free article] [PubMed] [Google Scholar]
- 31.Li H, Chang LJ, Neubauer DR, Muir DF, Wallace MR. Immortalization of human normal and NF1 neurofibroma Schwann cells. Lab Invest 2016;96(10):1105–15 doi 10.1038/labinvest.2016.88. [DOI] [PubMed] [Google Scholar]
- 32.Ianevski A, Giri AK, Aittokallio T. SynergyFinder 3.0: an interactive analysis and consensus interpretation of multi-drug synergies across multiple samples. Nucleic Acids Res 2022;50(W1):W739–43 doi 10.1093/nar/gkac382. [DOI] [PMC free article] [PubMed] [Google Scholar]
- 33.Miettinen MM, Antonescu CR, Fletcher CDM, Kim A, Lazar AJ, Quezado MM, et al. Histopathologic evaluation of atypical neurofibromatous tumors and their transformation into malignant peripheral nerve sheath tumor in patients with neurofibromatosis 1-a consensus overview. Hum Pathol 2017;67:1–10 doi 10.1016/j.humpath.2017.05.010. [DOI] [PMC free article] [PubMed] [Google Scholar]
- 34.Rhodes SD, He Y, Smith A, Jiang L, Lu Q, Mund J, et al. Cdkn2a (Arf) loss drives NF1-associated atypical neurofibroma and malignant transformation. Hum Mol Genet 2019;28(16):2752–62 doi 10.1093/hmg/ddz095. [DOI] [PMC free article] [PubMed] [Google Scholar]
- 35.Pratilas CA, Taylor BS, Ye Q, Viale A, Sander C, Solit DB, et al. (V600E)BRAF is associated with disabled feedback inhibition of RAF-MEK signaling and elevated transcriptional output of the pathway. Proc Natl Acad Sci U S A 2009;106(11):4519–24 doi 10.1073/pnas.0900780106. [DOI] [PMC free article] [PubMed] [Google Scholar]
- 36.Harbour JW, Luo RX, Dei Santi A, Postigo AA, Dean DC. Cdk phosphorylation triggers sequential intramolecular interactions that progressively block Rb functions as cells move through G1. Cell 1999;98(6):859–69 doi 10.1016/s0092-8674(00)81519-6. [DOI] [PubMed] [Google Scholar]
- 37.Hiebert SW, Chellappan SP, Horowitz JM, Nevins JR. The interaction of RB with E2F coincides with an inhibition of the transcriptional activity of E2F. Genes Dev 1992;6(2):177–85 doi 10.1101/gad.6.2.177. [DOI] [PubMed] [Google Scholar]
- 38.Weintraub SJ, Chow KN, Luo RX, Zhang SH, He S, Dean DC. Mechanism of active transcriptional repression by the retinoblastoma protein. Nature 1995;375(6534):812–5 doi 10.1038/375812a0. [DOI] [PubMed] [Google Scholar]
- 39.Li R, Chen J, Hammonds G, Phillips H, Armanini M, Wood P, et al. Identification of Gas6 as a growth factor for human Schwann cells. J Neurosci 1996;16(6):2012–9. [DOI] [PMC free article] [PubMed] [Google Scholar]
- 40.Dai XM, Ryan GR, Hapel AJ, Dominguez MG, Russell RG, Kapp S, et al. Targeted disruption of the mouse colony-stimulating factor 1 receptor gene results in osteopetrosis, mononuclear phagocyte deficiency, increased primitive progenitor cell frequencies, and reproductive defects. Blood 2002;99(1):111–20 doi 10.1182/blood.v99.1.111. [DOI] [PubMed] [Google Scholar]
- 41.Walter SA, Cutler RE, Jr, Martinez R, Gishizky M, Hill RJ. Stk10, a new member of the polo-like kinase kinase family highly expressed in hematopoietic tissue. J Biol Chem 2003;278(20):18221–8 doi 10.1074/jbc.M212556200. [DOI] [PubMed] [Google Scholar]
- 42.Lowell CA. Src-family kinases: rheostats of immune cell signaling. Mol Immunol 2004;41(6–7):631–43 doi 10.1016/j.molimm.2004.04.010. [DOI] [PubMed] [Google Scholar]
- 43.Moriwaki K, Chan FK. RIP3: a molecular switch for necrosis and inflammation. Genes Dev 2013;27(15):1640–9 doi 10.1101/gad.223321.113. [DOI] [PMC free article] [PubMed] [Google Scholar]
- 44.Sangrar W, Gao Y, Zirngibl RA, Scott ML, Greer PA. The fps/fes proto-oncogene regulates hematopoietic lineage output. Exp Hematol 2003;31(12):1259–67. [DOI] [PubMed] [Google Scholar]
- 45.Smith JA, Samayawardhena LA, Craig AW. Fps/Fes protein-tyrosine kinase regulates mast cell adhesion and migration downstream of Kit and beta1 integrin receptors. Cell Signal 2010;22(3):427–36 doi 10.1016/j.cellsig.2009.10.014. [DOI] [PubMed] [Google Scholar]
- 46.Dickler MN, Tolaney SM, Rugo HS, Cortes J, Dieras V, Patt D, et al. MONARCH 1, A Phase II Study of Abemaciclib, a CDK4 and CDK6 Inhibitor, as a Single Agent, in Patients with Refractory HR(+)/HER2(−) Metastatic Breast Cancer. Clin Cancer Res 2017;23(17):5218–24 doi 10.1158/1078-0432.CCR-17-0754. [DOI] [PMC free article] [PubMed] [Google Scholar]
- 47.Bhagwat SV, McMillen WT, Cai S, Zhao B, Whitesell M, Shen W, et al. ERK Inhibitor LY3214996 Targets ERK Pathway-Driven Cancers: A Therapeutic Approach Toward Precision Medicine. Mol Cancer Ther 2020;19(2):325–36 doi 10.1158/1535-7163.MCT-19-0183. [DOI] [PubMed] [Google Scholar]
- 48.Pant S, Bendell JC, Sullivan RJ, Shapiro G, Millward M, Mi G, et al. A phase I dose escalation (DE) study of ERK inhibitor, LY3214996, in advanced (adv) cancer (CA) patients (pts). Journal of Clinical Oncology 2019;37(15_suppl):3001- doi 10.1200/JCO.2019.37.15_suppl.3001. [DOI] [Google Scholar]
- 49.Mund JA, Park S, Smith AE, He Y, Jiang L, Hawley E, et al. Genetic disruption of the small GTPase RAC1 prevents plexiform neurofibroma formation in mice with neurofibromatosis type 1. J Biol Chem 2020;295(29):9948–58 doi 10.1074/jbc.RA119.010981. [DOI] [PMC free article] [PubMed] [Google Scholar]
- 50.Wang W, Cui XW, Gu YH, Wei CJ, Li YH, Ren JY, et al. Combined Cyclin-Dependent Kinase Inhibition Overcomes MAPK/Extracellular Signal-Regulated Kinase Kinase Inhibitor Resistance in Plexiform Neurofibroma of Neurofibromatosis Type I. J Invest Dermatol 2022;142(3 Pt A):613–23 e7 doi 10.1016/j.jid.2021.07.164. [DOI] [PubMed] [Google Scholar]
- 51.Tian Z, You Y, Xiao M, Liu J, Xu G, Ma C, et al. Inhibition of YAP Sensitizes the Selumetinib Treatment for Neurofibromatosis Type 1 Related Plexiform Neurofibroma. Int J Med Sci 2023;20(1):125–35 doi 10.7150/ijms.78386. [DOI] [PMC free article] [PubMed] [Google Scholar]
- 52.Armstrong AE, Rhodes SD, Smith A, Chen S, Bessler W, Ferguson MJ, et al. Early administration of imatinib mesylate reduces plexiform neurofibroma tumor burden with durable results after drug discontinuation in a mouse model of neurofibromatosis type 1. Pediatr Blood Cancer 2020;67(8):e28372 doi 10.1002/pbc.28372. [DOI] [PMC free article] [PubMed] [Google Scholar]
- 53.Burks CA, Rhodes SD, Bessler WK, Chen S, Smith A, Gehlhausen JR, et al. Ketotifen Modulates Mast Cell Chemotaxis to Kit-Ligand, but Does Not Impact Mast Cell Numbers, Degranulation, or Tumor Behavior in Neurofibromas of Nf1-Deficient Mice. Mol Cancer Ther 2019;18(12):2321–30 doi 10.1158/1535-7163.MCT-19-0123. [DOI] [PMC free article] [PubMed] [Google Scholar]
- 54.Lindsley A, Snider P, Zhou H, Rogers R, Wang J, Olaopa M, et al. Identification and characterization of a novel Schwann and outflow tract endocardial cushion lineage-restricted periostin enhancer. Dev Biol 2007;307(2):340–55 doi 10.1016/j.ydbio.2007.04.041. [DOI] [PMC free article] [PubMed] [Google Scholar]
- 55.Kohler J, Zhao Y, Li J, Gokhale PC, Tiv HL, Knott AR, et al. ERK Inhibitor LY3214996-Based Treatment Strategies for RAS-Driven Lung Cancer. Mol Cancer Ther 2021;20(4):641–54 doi 10.1158/1535-7163.MCT-20-0531. [DOI] [PMC free article] [PubMed] [Google Scholar]
- 56.Baldin V, Lukas J, Marcote MJ, Pagano M, Draetta G. Cyclin D1 is a nuclear protein required for cell cycle progression in G1. Genes Dev 1993;7(5):812–21 doi 10.1101/gad.7.5.812. [DOI] [PubMed] [Google Scholar]
- 57.Kato J, Matsushime H, Hiebert SW, Ewen ME, Sherr CJ. Direct binding of cyclin D to the retinoblastoma gene product (pRb) and pRb phosphorylation by the cyclin D-dependent kinase CDK4. Genes Dev 1993;7(3):331–42 doi 10.1101/gad.7.3.331. [DOI] [PubMed] [Google Scholar]
- 58.Narasimha AM, Kaulich M, Shapiro GS, Choi YJ, Sicinski P, Dowdy SF. Cyclin D activates the Rb tumor suppressor by mono-phosphorylation. Elife 2014;3 doi 10.7554/eLife.02872. [DOI] [PMC free article] [PubMed] [Google Scholar]
- 59.Kim S, Leong A, Kim M, Yang HW. CDK4/6 initiates Rb inactivation and CDK2 activity coordinates cell-cycle commitment and G1/S transition. Sci Rep 2022;12(1):16810 doi 10.1038/s41598-022-20769-5. [DOI] [PMC free article] [PubMed] [Google Scholar]
- 60.Wagle MC, Kirouac D, Klijn C, Liu B, Mahajan S, Junttila M, et al. A transcriptional MAPK Pathway Activity Score (MPAS) is a clinically relevant biomarker in multiple cancer types. NPJ Precis Oncol 2018;2(1):7 doi 10.1038/s41698-018-0051-4. [DOI] [PMC free article] [PubMed] [Google Scholar]
- 61.Dry JR, Pavey S, Pratilas CA, Harbron C, Runswick S, Hodgson D, et al. Transcriptional pathway signatures predict MEK addiction and response to selumetinib (AZD6244). Cancer Res 2010;70(6):2264–73 doi 10.1158/0008-5472.CAN-09-1577. [DOI] [PMC free article] [PubMed] [Google Scholar]
- 62.Diez Del Corral R, Morales AV. The Multiple Roles of FGF Signaling in the Developing Spinal Cord. Front Cell Dev Biol 2017;5:58 doi 10.3389/fcell.2017.00058. [DOI] [PMC free article] [PubMed] [Google Scholar]
- 63.Akagi T, Kuure S, Uranishi K, Koide H, Costantini F, Yokota T. ETS-related transcription factors ETV4 and ETV5 are involved in proliferation and induction of differentiation-associated genes in embryonic stem (ES) cells. J Biol Chem 2015;290(37):22460–73 doi 10.1074/jbc.M115.675595. [DOI] [PMC free article] [PubMed] [Google Scholar]
- 64.Okimoto RA, Wu W, Nanjo S, Olivas V, Lin YK, Ponce RK, et al. CIC-DUX4 oncoprotein drives sarcoma metastasis and tumorigenesis via distinct regulatory programs. J Clin Invest 2019;129(8):3401–6 doi 10.1172/JCI126366. [DOI] [PMC free article] [PubMed] [Google Scholar]
- 65.DeSalvo J, Ban Y, Li L, Sun X, Jiang Z, Kerr DA, et al. ETV4 and ETV5 drive synovial sarcoma through cell cycle and DUX4 embryonic pathway control. J Clin Invest 2021;131(13) doi 10.1172/JCI141908. [DOI] [PMC free article] [PubMed] [Google Scholar]
- 66.Sizemore GM, Pitarresi JR, Balakrishnan S, Ostrowski MC. The ETS family of oncogenic transcription factors in solid tumours. Nat Rev Cancer 2017;17(6):337–51 doi 10.1038/nrc.2017.20. [DOI] [PubMed] [Google Scholar]
- 67.Wang B, Krall EB, Aguirre AJ, Kim M, Widlund HR, Doshi MB, et al. ATXN1L, CIC, and ETS Transcription Factors Modulate Sensitivity to MAPK Pathway Inhibition. Cell Rep 2017;18(6):1543–57 doi 10.1016/j.celrep.2017.01.031. [DOI] [PMC free article] [PubMed] [Google Scholar]
- 68.Jousma E, Rizvi TA, Wu J, Janhofer D, Dombi E, Dunn RS, et al. Preclinical assessments of the MEK inhibitor PD-0325901 in a mouse model of Neurofibromatosis type 1. Pediatr Blood Cancer 2015;62(10):1709–16 doi 10.1002/pbc.25546. [DOI] [PMC free article] [PubMed] [Google Scholar]
- 69.Paraiso KH, Fedorenko IV, Cantini LP, Munko AC, Hall M, Sondak VK, et al. Recovery of phospho-ERK activity allows melanoma cells to escape from BRAF inhibitor therapy. Br J Cancer 2010;102(12):1724–30 doi 10.1038/sj.bjc.6605714. [DOI] [PMC free article] [PubMed] [Google Scholar]
- 70.Long GV, Fung C, Menzies AM, Pupo GM, Carlino MS, Hyman J, et al. Increased MAPK reactivation in early resistance to dabrafenib/trametinib combination therapy of BRAF-mutant metastatic melanoma. Nat Commun 2014;5:5694 doi 10.1038/ncomms6694. [DOI] [PubMed] [Google Scholar]
- 71.Hayes TK, Neel NF, Hu C, Gautam P, Chenard M, Long B, et al. Long-Term ERK Inhibition in KRAS-Mutant Pancreatic Cancer Is Associated with MYC Degradation and Senescence-like Growth Suppression. Cancer Cell 2016;29(1):75–89 doi 10.1016/j.ccell.2015.11.011. [DOI] [PMC free article] [PubMed] [Google Scholar]
- 72.Evans DG, Baser ME, McGaughran J, Sharif S, Howard E, Moran A. Malignant peripheral nerve sheath tumours in neurofibromatosis 1. J Med Genet 2002;39(5):311–4 doi 10.1136/jmg.39.5.311. [DOI] [PMC free article] [PubMed] [Google Scholar]
- 73.Fasih S, Suppiyah S, Barron J, Barnett-Tapia C, Avery R, Dickson B, et al. Malignant transformation of plexiform neurofibroma to MPNST while on MEK inhibitor. Neurooncol Adv 2021;3(1):vdab033 doi 10.1093/noajnl/vdab033. [DOI] [PMC free article] [PubMed] [Google Scholar]
- 74.Beert E, Brems H, Daniels B, De Wever I, Van Calenbergh F, Schoenaers J, et al. Atypical neurofibromas in neurofibromatosis type 1 are premalignant tumors. Genes Chromosomes Cancer 2011;50(12):1021–32 doi 10.1002/gcc.20921. [DOI] [PubMed] [Google Scholar]
- 75.Pemov A, Hansen NF, Sindiri S, Patidar R, Higham CS, Dombi E, et al. Low mutation burden and frequent loss of CDKN2A/B and SMARCA2, but not PRC2, define premalignant neurofibromatosis type 1-associated atypical neurofibromas. Neuro Oncol 2019;21(8):981–92 doi 10.1093/neuonc/noz028. [DOI] [PMC free article] [PubMed] [Google Scholar]
- 76.Liggett WH Jr, Sidransky D. Role of the p16 tumor suppressor gene in cancer. J Clin Oncol 1998;16(3):1197–206 doi 10.1200/jco.1998.16.3.1197. [DOI] [PubMed] [Google Scholar]
- 77.Sherr CJ. Parsing Ink4a/Arf: “pure” p16-null mice. Cell 2001;106(5):531–4 doi 10.1016/s0092-8674(01)00486-x. [DOI] [PubMed] [Google Scholar]
- 78.Finn RS, Dering J, Conklin D, Kalous O, Cohen DJ, Desai AJ, et al. PD 0332991, a selective cyclin D kinase 4/6 inhibitor, preferentially inhibits proliferation of luminal estrogen receptor-positive human breast cancer cell lines in vitro. Breast Cancer Res 2009;11(5):R77 doi 10.1186/bcr2419. [DOI] [PMC free article] [PubMed] [Google Scholar]
- 79.Wang J, Calizo A, Pollard K, Hirbe AC, Pratilas CA. Abstract P125: Combined inhibition of SHP2 and CDK4/6 is active in NF1-associated malignant peripheral nerve sheath tumor. Molecular Cancer Therapeutics 2021;20(12_Supplement):P125-P doi 10.1158/1535-7163.Targ-21-p125. [DOI] [Google Scholar]
- 80.Gong X, Litchfield LM, Webster Y, Chio LC, Wong SS, Stewart TR, et al. Genomic Aberrations that Activate D-type Cyclins Are Associated with Enhanced Sensitivity to the CDK4 and CDK6 Inhibitor Abemaciclib. Cancer Cell 2017;32(6):761–76 e6 doi 10.1016/j.ccell.2017.11.006. [DOI] [PubMed] [Google Scholar]
Associated Data
This section collects any data citations, data availability statements, or supplementary materials included in this article.
Supplementary Materials
Data Availability Statement
Raw FASTQ files pertaining to RNA sequencing data presented in this study are publicly available in the Gene Expression Omnibus database, accession numbers GSE213789 and GSE213787.