. 2024 Apr 30;12:RP89098. doi: 10.7554/eLife.89098

Figure 8. Involvement of endogenous reactive oxygen species (ROS) in agr-mediated protection from lethal H2O2 stress.

(A) Protective effect of menadione on survival. S. aureus LAC wild type (BS819) and Δagr mutant (BS1348) cultures were grown to late exponential phase (4 hr after dilution of overnight cultures), exposed to 80 μM menadione (MD) with or without 4 mM N-acetyl cysteine (NAC) for 30 min prior to treatment with H2O2 (20 mM for 1 hr) and measurement of survival. (B) Effect of sodA deletion on survival. Cultures of wild-type (BS819), Δagr (BS1348), a sodA::tetM (BS1422), and sodA::tetM-agr double mutant (BS1423) were grown to early (1 hr after dilution, OD600~0.15) or late log (4 hr after dilution, OD600~4.0) prior to treatment with 20 mM H2O2 for 60 min. (C) Effect of H2O2 concentration on survival. Late log (4 hr, OD600~4.0) cultures of the wild-type and Δagr mutant strains were treated with indicated concentrations of H2O2 for 60 min. (D) Complementation of sodA deletion mutation. A plasmid-borne wild-type sodA gene was expressed under control of the sarA constitutive promoter (pJC1111-sodA) in late log-phase (4 hr, OD600~4.0) cells treated with 20 mM H2O2 for 60 min. (E) SodA activity. Wild-type or the indicated mutants were grown to late-exponential phase (OD600~4.0); Sod activity was measured as in Methods. (F) Effect of ahpC deletion on survival. Late log-phase cultures of wild-type (BS819), Δagr (BS1348), ahpC::bursa (BS1486), and ΔahpC::bursa-agr double-mutant (BS1487) cells were treated with 20 mM H2O2 for 60 min. (G) Effect of ahpC deletion on expression of katA in the indicated mutants. Total cellular RNA was extracted from late exponential-phase cultures (OD600~4.0), followed by reverse transcription and PCR amplification of the indicated genes, using rpoB as an internal standard. mRNA levels were normalized to those of each gene to wild-type control. Data represent the mean ± SD. from (n=3) biological replicates. One-way ANOVA was used to determine statistical differences between samples (****p<0.0001).

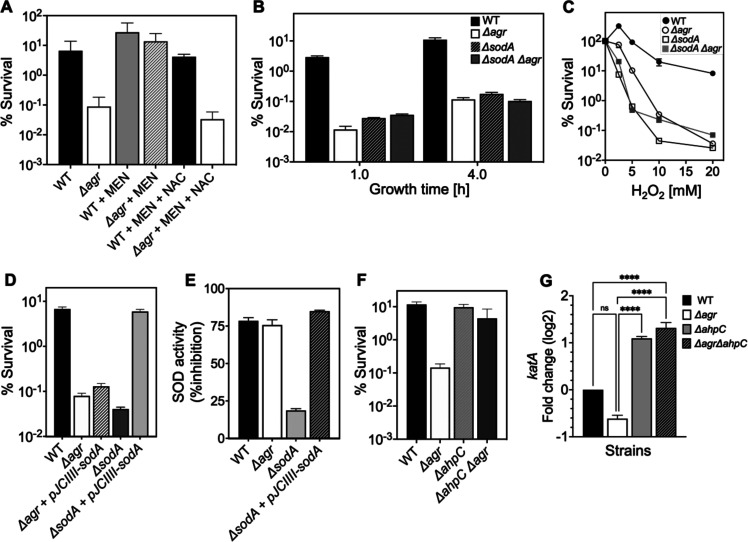
Figure 8.

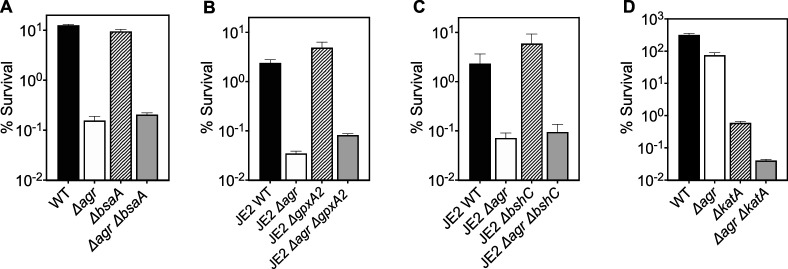
Figure 8—figure supplement 1. Deficiency in reactive oxygen species (ROS) detoxification genes katA, bsaA1/gpxA1, bsaA2/gpxA2, and bacilliothiol (BSH) have no effect on agr-mediated protection from H2O2-mediated cell death.

Figure 8—figure supplement 1.

Effect of (A) bsaA (B) gpxA2, (C) bshC and (D) katA on survival during treatment with H2O2. Cells were grown to early log phase (OD6000.15) and treated with 20 mM of H2O2 for 60 min for A-C or with 2 mM of H2O2 for 60 min for D. Data represent the mean ± SD. from biological replicates (n=3). Bacterial strains were BS819 (LAC) and BS867 (LAC) for WT, and BS1348 (LAC), BS1010 (JE2), BS1490-91, BS1522-23, BS1527-28 and BS1488-89 for the agr, bsaA, gpxA2, bshC, and katA mutants, respectively. Our data with superoxide dismutases (sodA) and the peroxiredoxin ahpC (Figure 7) suggest that homeostatic detoxification pathways contribute to agr-mediated phenotypes with respect to lethal H2O2 stress. Mutations in additional genes involved in H2O2 detoxification that included catalase, (katA), two thiol-dependent peroxidases (gpxA1 and gpxA2), and the low-molecular-weight thiol bacillithiol (bshC) showed no differential effect with respect to agr-mediated phenotypes. Notably, gpxA1, which is also known as bsaA1, was essential for the oxidation-sensing ability of AgrA to confer resistance to H2O2-mediated growth inhibition (Sun et al., 2012). The ΔkatA mutation was hyperlethal with the wild-type and Δagr mutant, even when otherwise sub-inhibitory concentrations of H2O2 were used. Collectively, the data support the idea that agr-mediated phenotypes are detoxification pathway-specific.
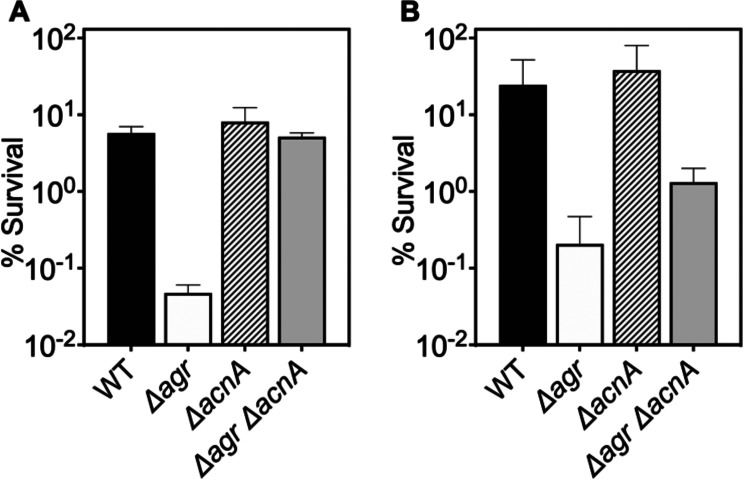
Figure 8—figure supplement 2. Deficiency in TCA cycle gene acnA reverses the effect of an agr deficiency with respect to subsequent challenges with H2O2.

Figure 8—figure supplement 2.

(A–B) Effect of acnA on survival during treatment with H2O2. Cells were grown to (A) late (OD600∼4.0) or (B) early (OD600∼0.15) log phase and treated with 20 mM of H2O2 for 60 min. Bacterial strains were S. aureus LAC wild-type (WT, BS819), Δagr mutant (BS1348), acnA::bursa (BS1744), and acnA::bursa-Δagr double mutant (BS1745). Data represent the mean ± SD. from biological replicates (n=3).
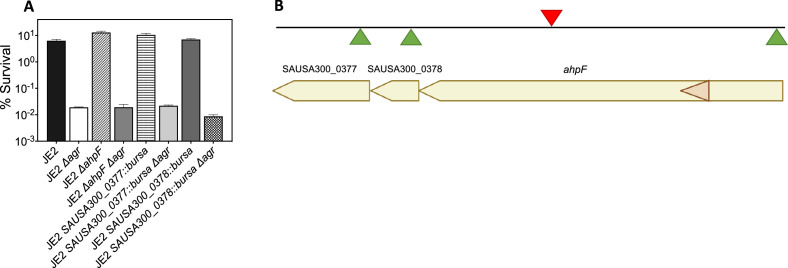
Figure 8—figure supplement 3. Effects of transposon insertion in ahpC unexplained by polarity of transposon insertion.

Figure 8—figure supplement 3.

(A) Cultures of S. aureus wild-type, Δagr mutant, and various double mutants were treated with H2O2 (20 mM for 60 min) prior to measurement of survival. For strain descriptions, see Table 1. (B) ahpC locus map showing the three ORFs located downstream of ahpC. The location of four Bursa aurealis insertions (NE911, NE1571, NE537, NE725), obtained from The Nebraska Transposon Mutant Library (NTML) Fey et al., 2013 used in this study are indicated by triangles. Green triangles, plus-strand insertion; red triangle, minus-strand insertion. Data represent the mean ± SD. from biological replicates (n=3). Bacterial strains were BS435 for WT and BS1010, BS1494, BS1504, BS1495, BS1501, BS1496 and BS1506 for the agr, ahpF, SAUSA300_0377, and SAUSA300_0378 mutants, respectively. Since the Bursa aurealis (bursa) transposon insertion in ahpC was upstream of several open reading frames (ORFs) in the ahpC-F operon, polarity could complicate interpretation of the results. We, therefore, analyzed the effects of the three bursa mutants in strain JE2 downstream genes: ahpF, SAUSA300_0378, SAUSA300_0377. We found that polar effects on downstream elements could not explain the properties of ahpC::bursa. Thus, ahpC::bursa could provide insights into the role of ahpC in agr-mediated phenotypes.
© 2024, BioRender Inc
Panel B was created with BioRender.com and is published under a CC BY-NC-ND 4.0. Further reproductions must adhere to the terms of this license