

Abstract
Objective
Microglia/macrophages line the border of demyelinated lesions in both cerebral white matter and cortex in multiple sclerosis brains. Microglia/macrophages associated with chronic white-matter lesions are thought to be responsible for slow lesion expansion and disability progression in progressive multiple sclerosis whereas those lining gray matter lesions are less studied. Profiling these microglia/macrophages could help to focus therapies on genes or pathways specific to lesion expansion and disease progression.
Methods
We compared the morphology and transcript profiles of microglia/macrophages associated with borders of white matter (WM line) and subpial gray matter lesions (GM line) using laser capture microscopy. We performed RNAseq on isolated cells followed by immunocytochemistry to determine distribution of translational products of transcripts increased in WM line.
Results
Cells in WM line appear activated with shorter processes and larger cell bodies, whereas those in GM Line appear more homeostatic with smaller cell bodies and multiple thin processes. Transcript profiling revealed 176 genes in WM lines and 111 genes in GM lines as differentially expressed. Transcripts associated with immune activation and iron homeostasis were increased in WM line whereas genes belonging to canonical Wnt signaling pathway were increased in GM line.
Interpretation
We propose that mechanisms of demyelination and dynamics of lesion expansion are responsible for differential transcript expression in WM lines and GM lines, and posit that increased expression of Fc epsilon receptor, spleen tyrosine kinase, and Bruton’s tyrosine kinase play a key role in regulating microglia/macrophage function at the border of chronic active white matter lesions.
Introduction
Multiple sclerosis (MS) is an inflammatory-mediated demyelinating disease of the central nervous system (CNS). Failure of anti-inflammatory drugs to halt neurological disability in the progressive forms of MS has been attributed to compartmentalized inflammation behind an intact blood-brain barrier (BBB)1. Microglia/macrophages associated with the borders of chronic active white-matter (WM) lesions are the most prominent feature of this compartmentalized inflammation2. Brain imaging studies have reported slow expansion of chronic active MS lesions,3, 4 including those with paramagnetic iron-enhancing rings at their border.5, 6 Accumulation of iron-laden microglia/macrophages at the border of chronic active WM lesions has been proposed as a surrogate marker of chronic WM lesion expansion and increased neurological disability in progressive MS.5
Cortical demyelination is also prominent in MS,7–9 to the extent that it is estimated to exceed WM demyelination in some patients.8 Subpial lesions, the most abundant type of cortical lesions, are usually restricted to cortical layers I-IV, and some subpial lesions can transverse several gyri.7, 8 In contrast to cerebral WM lesions, subpial lesions are not associated with breakdown of the BBB, infiltration of immune cells, perivascular cuffs, or significant astrogliosis.7, 8, 10 There is a predilection for subpial lesions in cortical areas with deep sulci8 and speculation that meningeal inflammation, and possibly B-cell follicles, in the cerebrospinal fluid (CSF) space of deep sulci play a pathogenic role in inducing subpial demyelination.11, 12 Similar to chronic active WM lesions, microglia/macrophages can accumulate at the border of subpial cortical lesions, but they have not been detected by iron-sensitive modalities in MRI studies.
Establishing microglial genotypes in discrete locations in MS brains is viable, but it is technically challenging.13 Microglial yield is relatively low and lacks precise spatial orientation in single-cell or single-nuclei approaches,13, 14 and dissection of microglial lines from frozen postmortem tissues is also challenging. To overcome these limitations, the present study characterizes the transcriptional profile of laser-captured microglia/macrophages using RNA sequencing (RNA-seq). We compare the transcriptional profile of microglia/macrophage cells lining the border of chronic active WM lesions (WM lines) with transcripts from microglia that line the border of subpial cortical lesions (GM lines). We focus on WM lines and identify increased expression of transcripts related to iron homeostasis and Fc epsilon receptor (FCER1G), spleen tyrosine kinase (SYK), and Bruton’s tyrosine kinase (BTK). At present, rodent models with chronic active WM lesions and/or subpial cortical lesions are not available. This study, therefore, identifies molecular candidates that can be used to define, characterize, and develop functional models to investigate the role of microglial cells lining MS lesions.
Materials and methods
Human brain tissue
This research was approved by the Cleveland Clinic Institutional Review Board. Tissue donation from patients with MS was obtained with consent from the patient or next of kin. Tissue procurement and processing of MS tissues at the Cleveland Clinic have been described in detail.15 Disease course and demographic characteristics of the patient cohort used for laser capture studies are listed in supplementary table 1. All patients were secondary-progressive MS with an average age of 52 and EDSS of 8.25. Paraformaldehyde-fixed tissue sections were used to characterize the morphology of microglia associated with WM and GM lesions, and to establish the cellular distribution of translational products of differentially-expressed genes (DEGs) identified in WM microglial lines. Tissues, frozen at autopsy, stored at −80°C, were used for studies that compared RNA-seq profiles of laser-captured microglia/macrophages located at the borders of chronic WM lesions and subpial cortical lesions.
Tissue selection and lesion characterization
WM lesions in MS brains were macroscopically identified and removed from fixed and frozen cm-thick brain slices. Since subpial cortical lesions are not macroscopically visible, we dissected prefrontal cortices from fixed and frozen blocks, cut sections, and identified subpial lesions by immunocytochemistry. All fixed tissue blocks were cryoprotected, frozen, sectioned at a thickness of 30 µm on a sliding microtome, stored in cryopreservation buffer, and subsequently immunostained as free-floating sections. Frozen tissue blocks were placed in a cryostat and sectioned at a thickness of 10 µm and stored at −80°C. Demyelination of fixed and frozen WM lesions was confirmed by PLP immunostaining as described previously.16 WM and subpial lesions were identified by a paucity of proteolipid protein (PLP) staining (Fig. 1A, D) as described previously.16 Demyelinated WM and subpial cortical lesions were further characterized by staining adjacent sections with MHC Class II (CII) antibodies for microglia/macrophages that accumulate at the border of WM and subpial GM lesions (Fig. 1B, E). (excluded lymphocytes based on morphology)
Figure 1. Characterization of lesions and microglial lines.
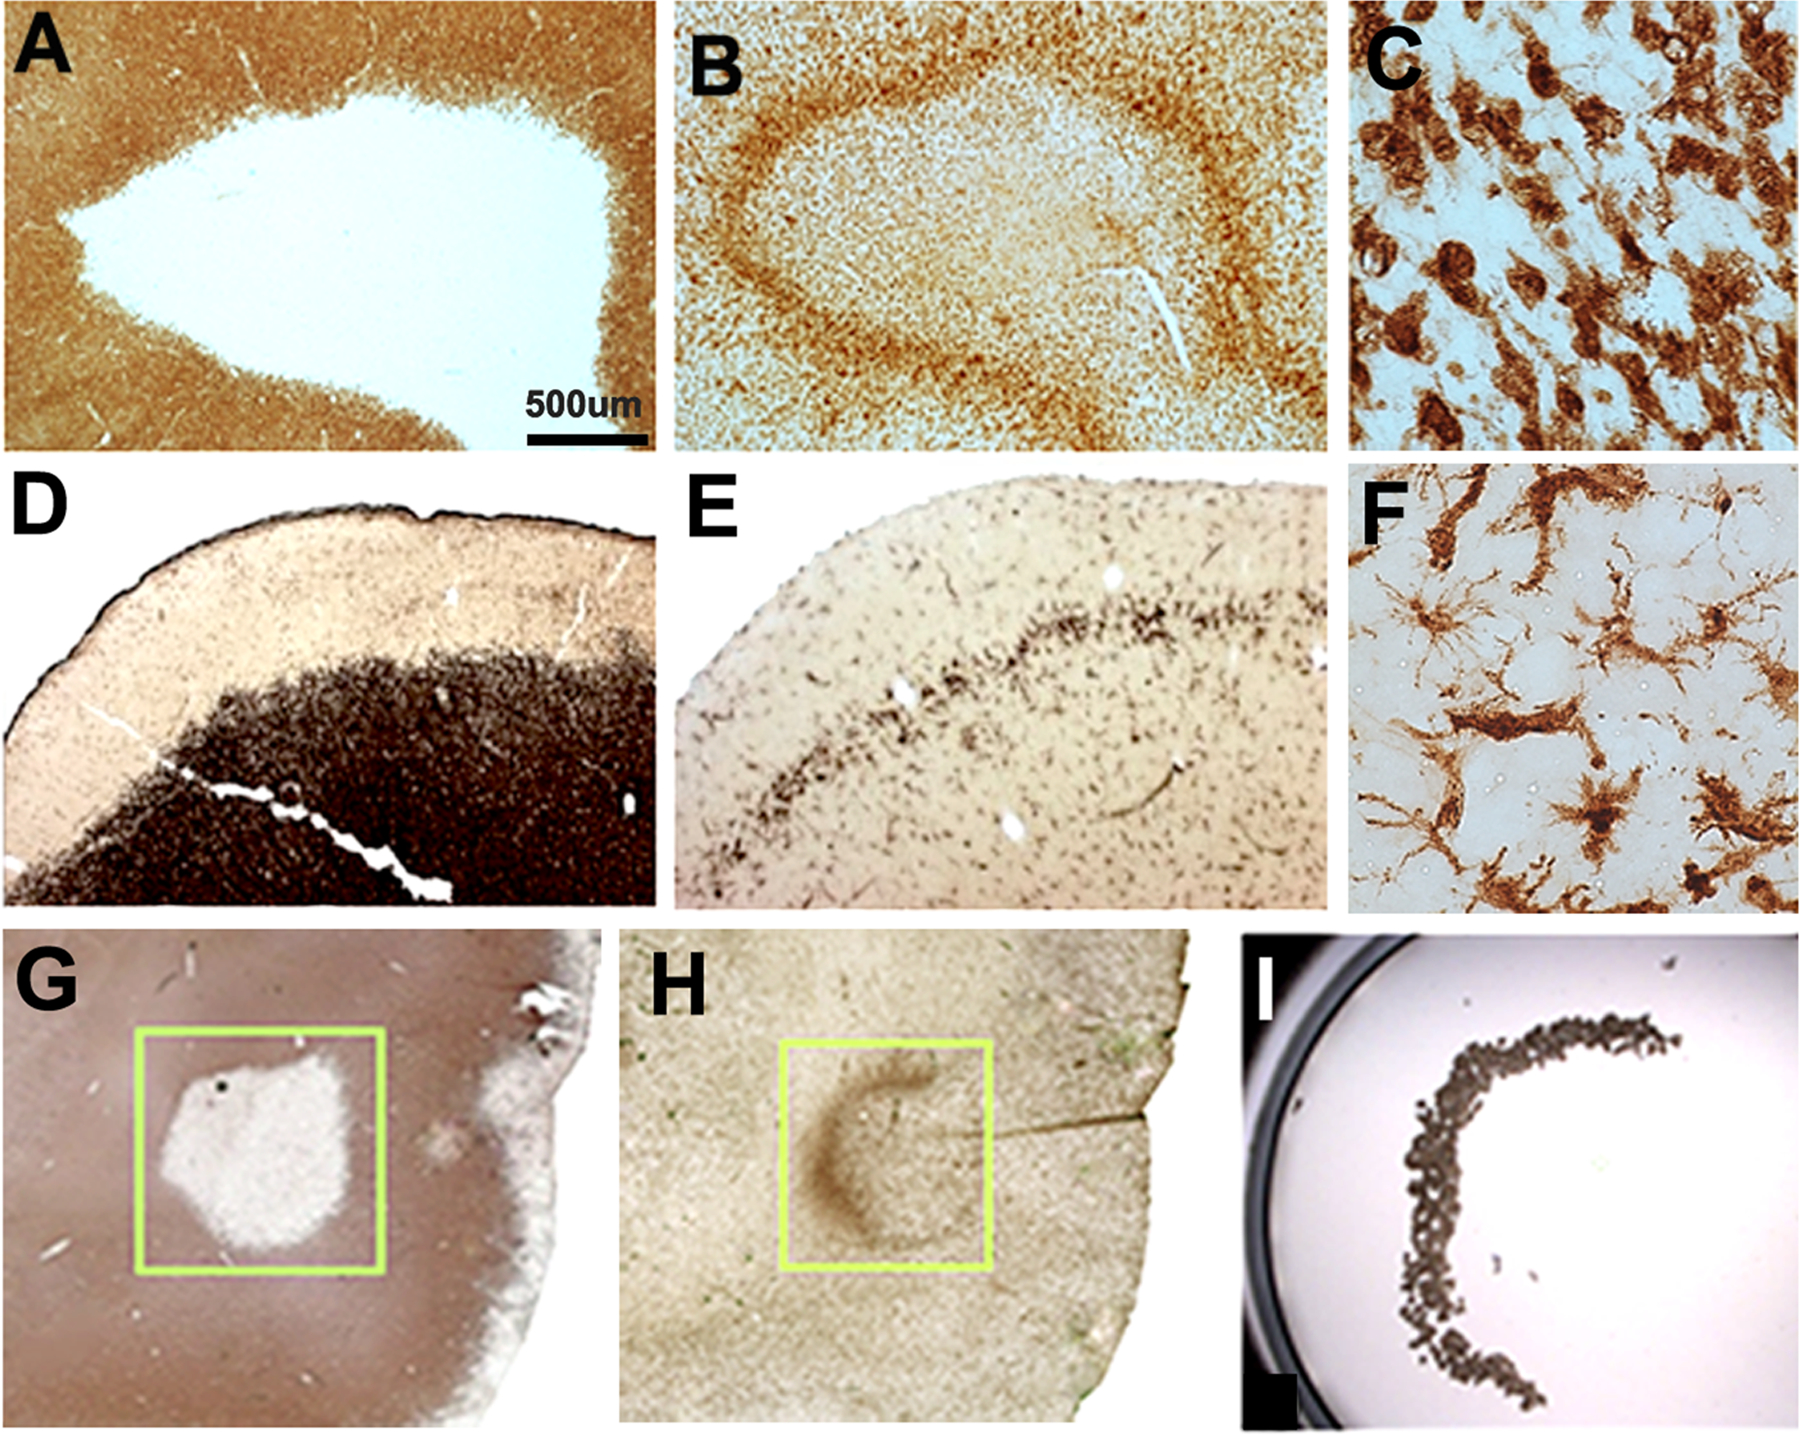
Demyelinated lesions were identified using myelin-specific antibodies directed against proteolipid protein (PLP) (A, D, G). Microglia/immune cells were identified using antibodies directed against MHC Class II (CII) (B, E, H). Chronic active WM lesions (A) are surrounded by a dense line of MHC CII-positive cells at the lesion border (B). WM line microglia/macrophages have large cell bodies and short processes (C). Many subpial cortical (GM) lesions (D) have dense lines of microglia at their borders (E). These microglia have smaller cell bodies and more processes (F) than CII-positive cells at the border of chronic active WM lesions (C). WM lines at lesion borders were identified in frozen tissue sections using PLP (G) and CII (H) antibodies and then isolated by infrared laser capture microscopy. Panel I depicts microglia captured from chronic active WM at the lesion border. Scale bar = 500 µm
Laser capture of microglia/macrophages and RNA isolation
After characterization with PLP (Fig. 1G) and MHC CII (Fig. 1H) antibodies, frozen tissue blocks containing WM and subpial lesions with microglial lines were sectioned at a thickness of 10 µm and stained by a modified “quickstain” immuno protocol with CD68 antibodies (Dako Inc., USA). The “quickstain” protocol includes incubations in primary and secondary antibodies for 5 min each in RNase-free buffers, which significantly limits RNA degradation compared to staining protocols with longer antibody incubations. CD68 immuno-positive cells (≥4000) from WM lines (n=5) and GM lines (n=5) were collected using an Arcturus XT infrared laser capture microscope (Fig. 1I). Collected cells were lysed and RNA was isolated in RLT buffer (Qiagen RNeasy micro kit). RNA quality was assessed after isolation from LCM-collected cells with a Bioanalyzer (Agilent Technologies USA). RNA integrity number (RIN) was determined for each sample, and only those with RINs > 5 were used for library preparation and sequencing.
Library preparation and sequencing
Before library preparation, RNA quality was again evaluated, and quantification was performed on Advanced Analytical’s Fragment Analyzer and its High Sense RNA kit (Agilent Technologies USA). Total RNA was normalized to 100 picograms prior to oligo-dT capture and cDNA synthesis with Takara’s SMART-Seq v4. The resulting cDNA was assessed on the Fragment Analyzer with the High Sense Large Fragment kit and quantified using Qubit 3.0 fluorometer (Life Technologies Inc.). Libraries were generated using Illumina’s Nextera XT DNA Library Prep kit. Medium-depth sequencing (>30 million reads per sample) was performed with an Illumina HiSeq 2500 on a Rapid Run v2, 125 base pairs, Paired End run.
RNA-Seq analysis
On average, 11 million reads (3–23 million) were obtained per sample, and the average mapping of 76.43% (49–92%) to the GRCh38 reference genome using HISAT217 after trimming of adapters through cutadapt.18 DESeq219 normalized raw counts using median-of-ratios methods after filtering > 10 reads per gene. DEGs and pathways were compared in WM and GM line microglia. All statistical analyses, including PCA, clustering, volcano plots, and heatmaps, were conducted using R/Bioconductor packages (R version 4.1.1).
Function and pathway analysis
Enriched functions and pathways of DEGs were discovered by Enrichr (Fig. 2B, C).20 We focused on Gene Ontology Biological Process (GO BP),21 Kyoto Encyclopedia of Genes and Genomes (KEGG) database,22 and Hallmark.23 In addition, for consistency of results, Gene Set Enrichment (GSEA)24 was used with the same gene sets. Hallmark contains 50 gene signatures from over 4,000 original overlapping gene sets from v4.0 MSigDB collections and KEGG contains 186 gene signatures in c2.cp.kegg.v7.4 (MSigDB). Enriched gene sets were identified by the signal-to-noise method with 1000 permutations. Gene sets with normalized enrichment scores (NES) > 1.5 or < −1.5 were considered as significant. The Networks Analysis module (Advaita iPathway Inc, USA) was utilized to integrate our differential expression data with known gene-gene interactions and annotation to generate networks (Fig. 2B) and hub genes (Fig. 2C).
Figure 2. Transcript comparisons of microglia from WM lines versus GM lines.
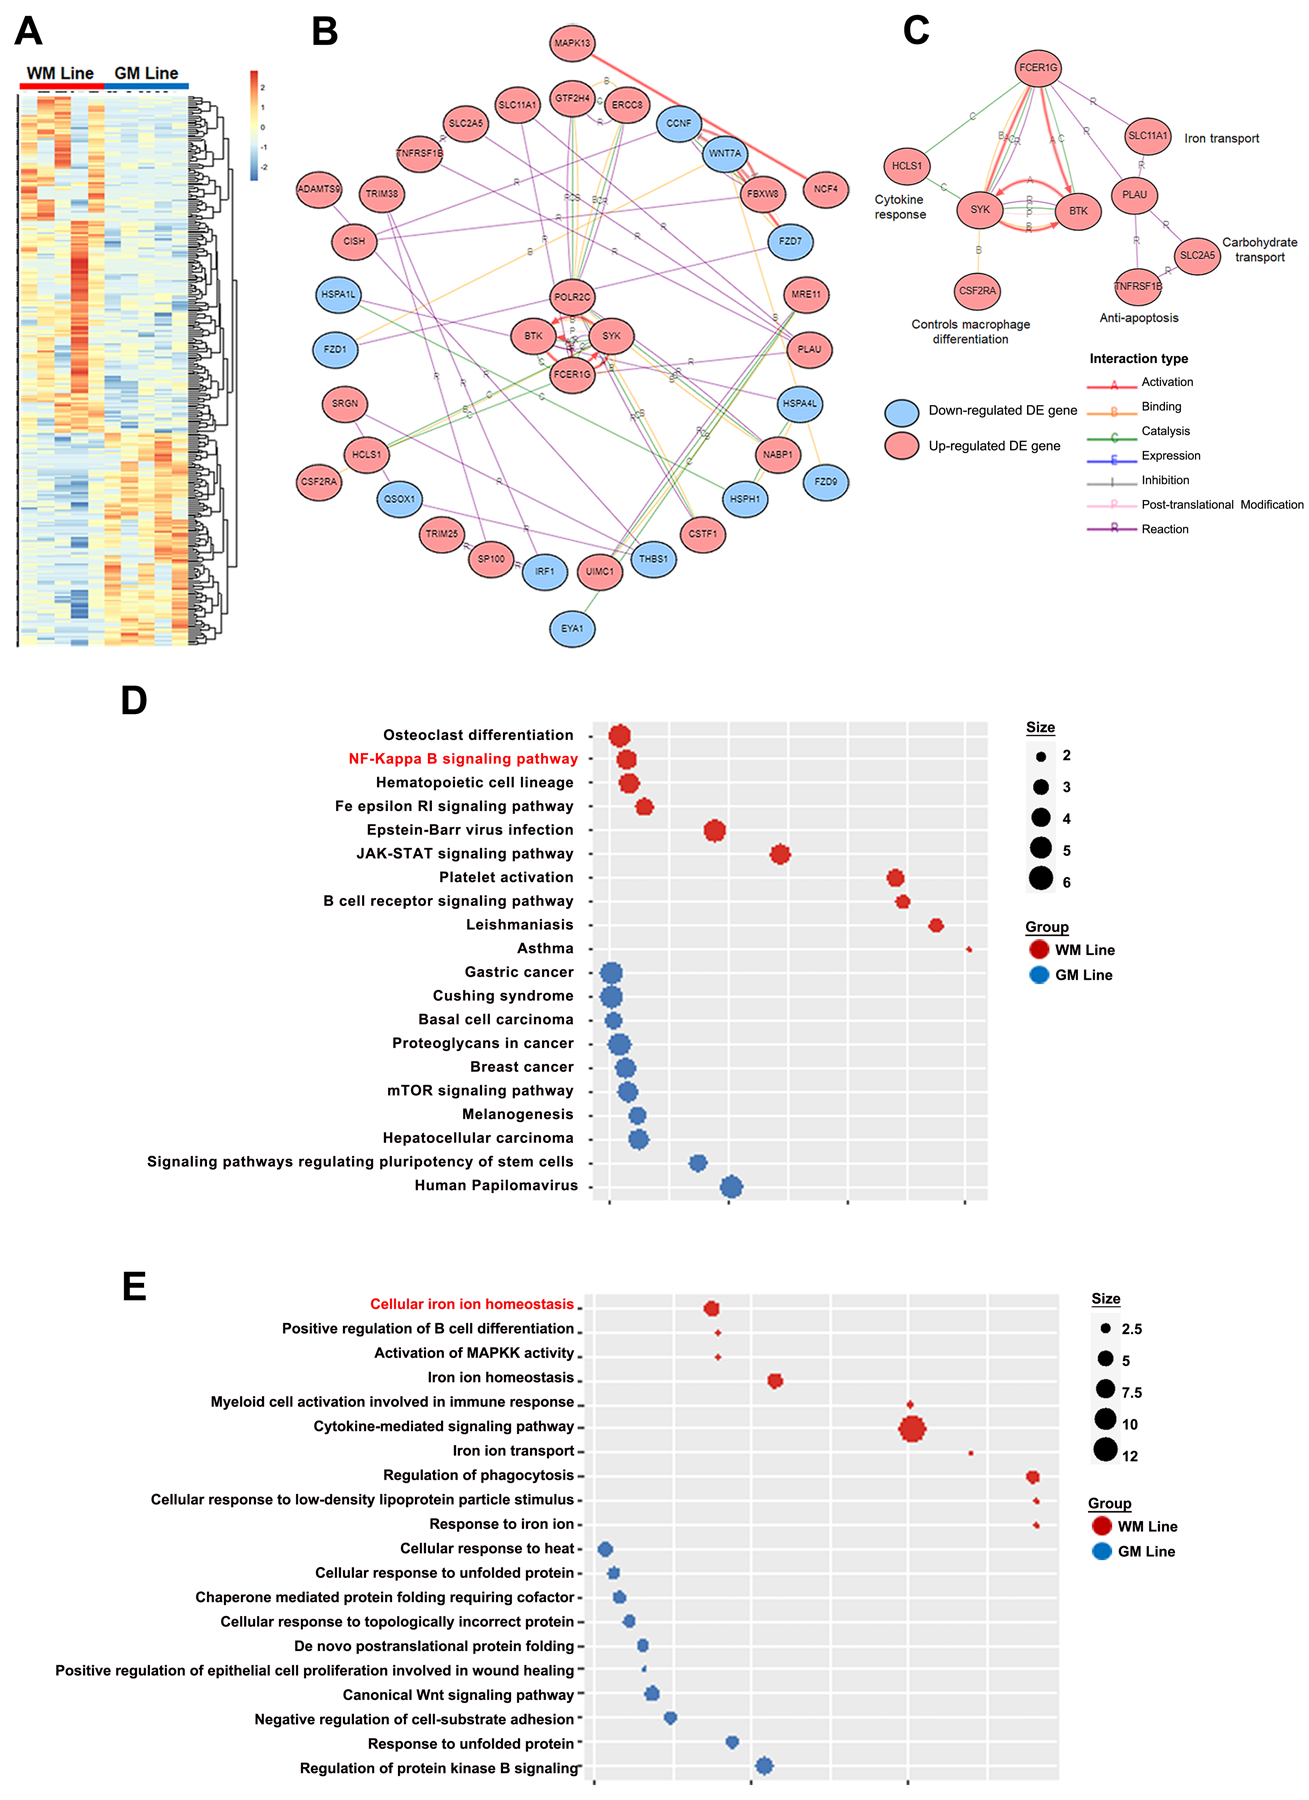
Two hundred and eighty-seven transcripts were significantly increased: 176 in WM line microglia/macrophages and 111 in GM line microglia (A); P< 0.01 and |log2FC| >1.5 for clustered expression levels. (B) Network analysis shows interactions between DEGs and regulatory networks (C) (isolated nodes not shown). Significantly altered KEGG pathways (D) and the top enriched Gene Ontology (GO) Biological Processes Terms (E) for WM line (red) and GM line (blue) microglia.
Validation of RNA-seq data
To validate the cellular specificity and location of translational products of DEGs, immunocytochemistry was performed as previously described25 using 30 µm-thick free-floating sections. Sections containing WM and GM lines were stained with individual antibodies using the avidin-biotin method and diaminobenzidine (DAB) and double-labelled with MHC CII antibodies (Dako Inc. USA) as a global microglia/macrophage marker and selected genes (p < 0.01) belonging to key functional pathways. These antibodies were specific for hepicidin (Sigma Aldrich, USA), FCER1G (Cell Signaling Technologies, USA 1:250), SYK (Cell Signaling Technologies, USA 1:250), and BTK (Cell Signaling Technologies, USA 1:100). For double-labelling experiments, secondary antibodies were conjugated with Alexa-488 or Alexa-594 (Life Technologies 1:250). Sections were imaged on Leica TCS or Stellaris confocal microscopes. Acquired images were processed and Z stacks were generated using ImageJ. The cell counter plugin in ImageJ was used to mark positive cells with two users generating counts across multiple tissue sections per antibody.
Iron staining of postmortem tissues
The DAB-enhanced Turnbull staining protocol was used to detect iron with slight modifications.26 Thirty µm-thick free-floating tissue sections were rinsed in 0.1 phosphate buffer and immersed in an aqueous solution containing 2% ammonium sulfide for 90 minutes, washed in phosphate buffer, and incubated for 30 minutes in an aqueous solution containing 5% potassium ferricyanide and 0.5% hydrochloric acid (HCl). To block endogenous peroxidase, sections were incubated in methanol containing 0.01 M sodium azide and 0.3% hydrogen peroxide for 60 minutes. Following a buffer wash, iron staining was amplified by placing the sections in a solution containing 0.025% DAB (Sigma Aldrich) and 0.005% hydrogen peroxide in a 0.1 M phosphate buffer for 5–10 minutes. The reaction was stopped by rinsing the sections in tap water. Sections were mounted in glycerol on glass slides and bright field images were taken using a Zeiss Axiophot microscope (Carl Zeiss MicroImaging, Thornwood, NY)
Results
WM and GM lines are morphologically distinct
We compared the morphological appearances of MHC CII-positive cells associated with the borders of WM and subpial GM lesions (Fig. 1). The absence of PLP staining identified WM (Fig. 1A) and subpial GM lesions (Fig. 1D). In sections cut adjacent to these PLP-stained sections, MHC CII-positive cells lined the border of both WM (Fig. 1B) and GM (Fig. 1E) lesions. In general, microglial lines were thicker and microglial density was greater in WM lines compared to GM lines. Microglia in normal brain have a tile-like distribution, and microglial processes of neighboring microglia rarely overlap. Parenchymal domains of individual microglia, therefore, are maintained by a mechanism of contact inhibition with neighboring microglial processes. As predicted by a mechanism of contact inhibition, WM line microglia/macrophages had short processes. Many MHC CII-positive WM line cells had larger cell bodies with fewer processes (Fig. 1C). Subpial lesions were characterized by a band of demyelination that extends from the pial surface and stops at cortical layer IV (Fig. 1D). Microglia often line the border of subpial lesions (Fig. 1E). These microglial lines were thinner and less dense than the microglial/macrophage lines of chronic active WM lesions. When present, they can line the entire length of individual subpial lesions, which can occupy an entire cortical gyrus. Compared to WM lines (Fig. 1C), microglia that line subpial lesions appear less activated, with smaller cell bodies with symmetrically-oriented and longer processes (Fig. 1F). Monocyte/macrophage cells were not prominent features of the subpial lesion area or subpial microglial lines. Small (10–12um diameter) MHC Class II-positive cells indicative of lymphocytes were not prominent features of WM or cortical lines. In summary, WM line cells appeared activated with short processes and round cell bodies (indicative of activated microglia and macrophages) while GM line cells appeared more homeostatic with smaller cell bodies and multiple thin processes (indicative of microglial cells).
Transcript profiles of WM and GM microglial/macrophage lines are significantly different
Comparative analysis revealed 287 gene transcripts as differentially expressed genes (DEGs) between WM lines and GM lines (DEG data averaged across samples) (P<0.05) (Fig. 2A). Of these DEGs, 176 were enriched in WM lines and 111 DEGs were enriched in GM lines (supplementary table 2). To help elucidate the function of DEG changes, network, pathway, and gene ontology analyses were performed. Network analysis shows interactions of DEGs (Fig. 2B), and central to these interactions is a core hub (Fig. 2C) of enriched genes in WM lines that includes: 1) FCER1G binding and activation of SYK; 2) FCER1G activation of BTK; and 3) binding and activation between SYK and BTK. FCER1G also activates SLC11A1, which regulates iron homeostasis,27 and SYK binds to CSF2RA, which regulates macrophage differentiation.28 Other upregulated transcripts downstream of FCER1G include those involved in carbohydrate transport (SLC2A5), negative regulator of apoptosis (TNFRSF1B), and cytokine response (HLCS1) (Fig. 2C).
DEGs were further probed by Gene Ontology (GO) (Fig. 2E) and KEGG pathway (Fig. 2D) analyses. The top 10 GO biological processes altered in WM lines included 6 related to immune cell function and 4 related to iron ion homeostasis (Fig. 2E). Consistent with the network analysis, several genes were also prominent in these analyses. SYK and BTK were enriched in 5/6 of the immune-related GO groups, while FCER1G was enriched in 4/6. The top 10 KEGG pathways identified in WM lines included FCER1G signaling, NF-κB signaling, JAK-STAT signaling, and B-cell receptor signaling (Fig. 2D). Of the top 9 KEGG pathways, SYK and BTK were enriched in 6 and MAPK13 was enriched in 4. Activation of FCER1G signals through SYK to promote cytokine signaling, myeloid cell activation, phagocytosis, and response to low-density lipoprotein (LDL) particle stimulation (Fig. 2D). Altered cytokine signaling DEGs included interleukin receptors IL1 and IL2, TRIM 25 and TRIM28, CSF receptors 2A and 3, and TNF receptor SF1.a.
Heat shock protein response and canonical wnt signaling DEGs are increased in GM microglial lines
Analysis of the canonical pathways associated with GM lines identified the Bcl-2-associated athanogene 2 (BAG2) signaling pathway as significantly associated with GM line microglia. This pathway works through BAG2 and interacts with several heat shock proteins (HSPs) to mediate chaperone activity. In several model systems, HSPs have been shown to have anti-inflammatory and anti-apoptotic effects. For example, microglial activation and cytotoxicity were decreased by HSP70 expression in a stroke model and activation of inflammatory transcription factor NF-κB was significantly decreased with HSP70 overexpression.29 Wnt signaling, and the role(s) it plays in inflammation in the brain, is currently being investigated in more depth. It is postulated, however, that activation of the canonical vs. non-canonical wnt pathways is protective in AD.30 Collectively, these data support further studies of these two pathways to understand the functional role of microglial cells bordering GM lesions.
Transcripts involved in FCER1G signaling are increased in WM microglial lines
Analysis of DEGs suggested functional changes associated with FCER1G signaling, NF-κB signaling, and cytokine signaling in WM lines (Fig. 3A). FCER1G, SYK, and BTK transcripts were increased in WM lines. These DEGs are associated with multiple KEGG pathways, GO categories associated with immune activation, and were identified as core hub genes in this activation. FCER1G has been identified as a key driver of microglial activation in CNS disease31–34, and SYK is a pivotal regulator of microglial activation in disease states.35 BTK is expressed by B cells and microglia, is involved in NF-κB signaling, and its inhibition is currently a therapeutic target in MS clinical trials.36 We compared the location of translation products of these transcripts in WM and GM microglial lines using immunocytochemistry and confocal microscopy (Fig 3B–G). FCER1G, BTK, and SYK showed higher expression in WM lines (Fig. 3H, J, L) compared to GM lines (Fig. 3I, K, M). Cells were counted across multiple sections and patients for BTK and SYK (Fig. 3N). Though transcript profiles from laser-captured NAWM microglia were not included in this study, apparent levels of FCER1G and SYK immunoreactivity appear elevated in WM lines compared to microglia/macrophages found in normal appearing white matter (NAWM) (Supplemental Fig. 1A, B).
Figure 3. Immune signaling transcripts are increased in WM line microglia.
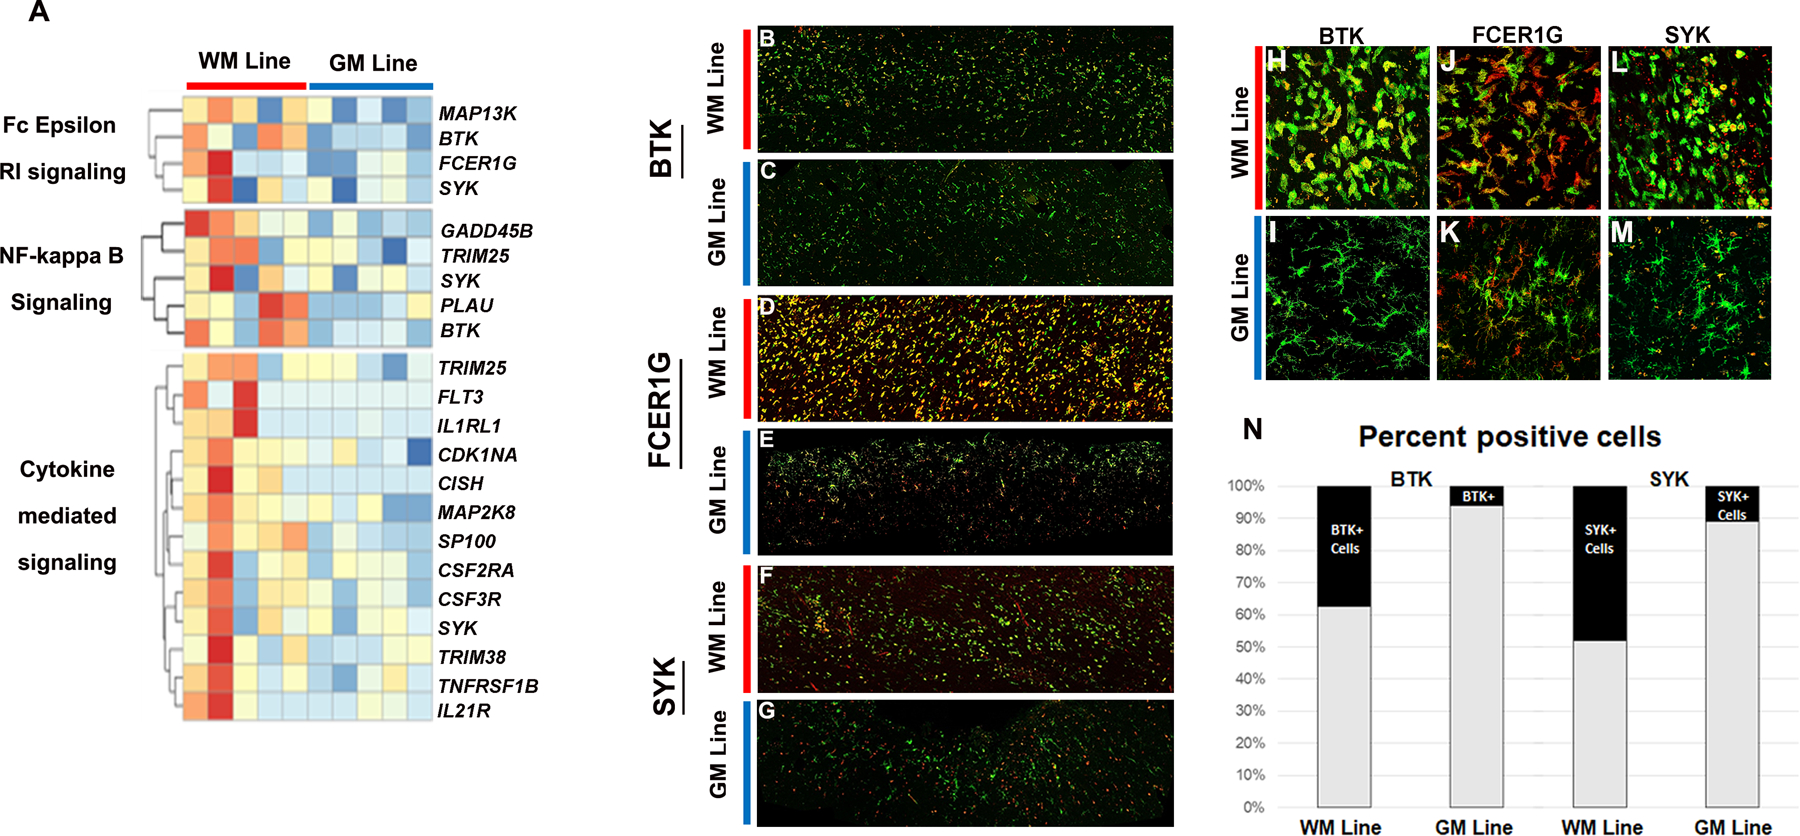
Transcripts associated with FC epsilon signaling, NF-kappa B, and cytokine-mediated signaling were increased in WM lines compared to GM lines (A). Translation products were co-localized with MHC CII in WM and GM microglia lines (B-G). FCER1G, BTK, and SYK positive cells were increased in WM lines (H, J, L) compared to GM lines (I, K, M). MHC CII green; FCER1G, BTK, and SYK red. Scale bar = 100 µm. Quantification of BTK and SYK positive cells is shown in N
Iron homeostasis transcripts and iron staining are increased in WM lines
Transcripts involved in iron homeostasis and total iron staining were increased in WM lines. Iron homeostasis transcripts that were increased in WM lines included HAMP, TFRC, FXN, and SLC11A1 (GO:0006879; p= 0.0015) (Fig. 4A). HAMP encodes hepcidin, which is an iron sequestering protein that degrades ferroprotein (FPN).37 In the brain, Hepcidin plays a key role in iron homeostasis, and its upregulation in microglia has been associated with increased iron load 38. Transferrin receptor regulates iron uptake in most cells 39 and has been used as a marker for activated microglia.7, 40 FXN encodes the mitochondrial protein frataxin, which controls iron-sulfur clusters that are essential for electron transport chain function.41 SLC11A1 encodes natural resistance-associated macrophage protein 1, which is a transmembrane iron transporter.42
Figure 4. Iron homeostasis transcripts and iron levels are increased in WM line microglia.
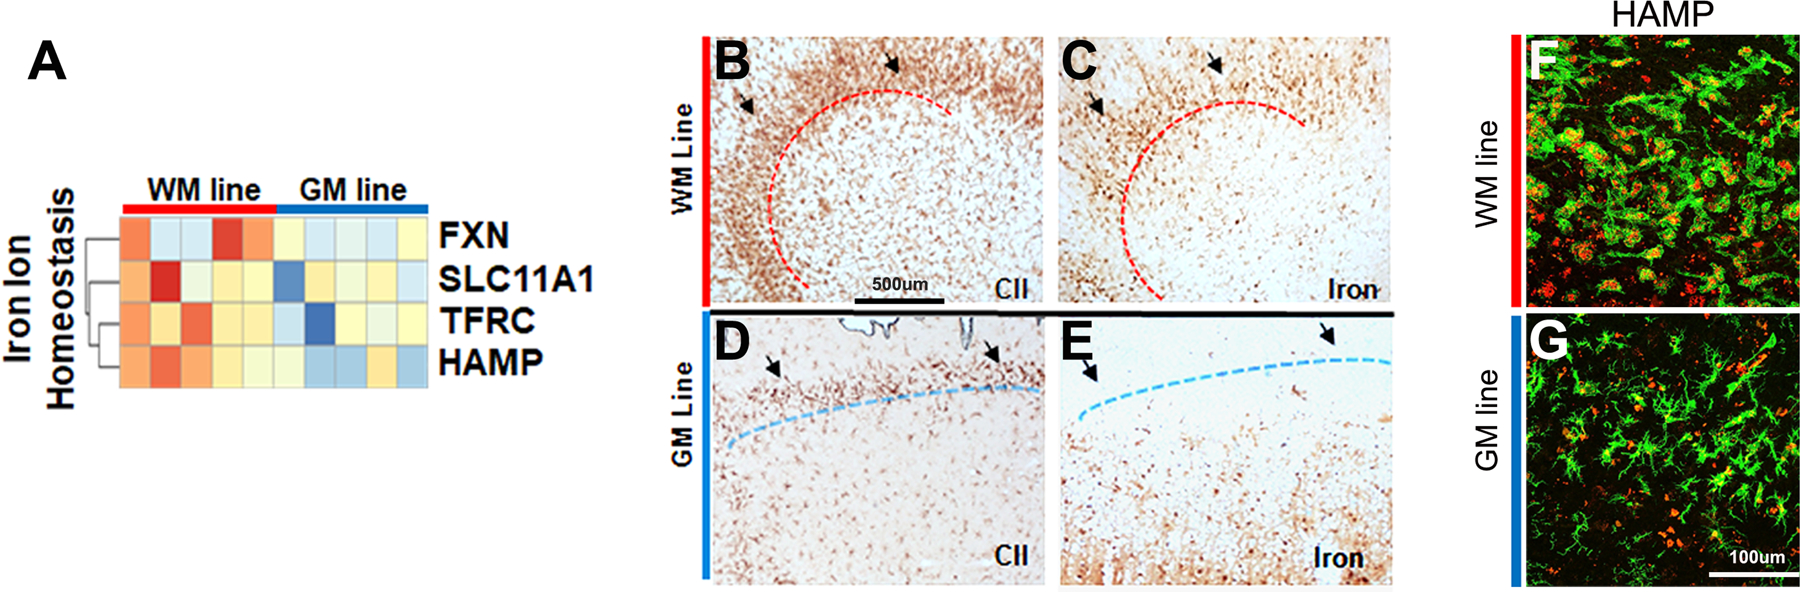
Transcripts associated with iron ion homeostasis were significantly increased in WM lines compared to GM lines (A). WM microglial/macrophage lines (B) were often positive for iron (C). GM microglial lines (D) were negative for iron (E). Hepicidin (HAMP) was increased in WM microglial lines (F) compared to GM microglial lines (G). MHC CII green; HAMP red. Scale bar = 100 µm.
Microglial lines were identified in WM (Fig. 4B) and GM (Fig. 4D) lesions and adjacent sections were stained for iron using the Turnbull method. Iron was often detected in microglia/macrophages associated with microglial lines of WM lesions (Fig. 4C), but not in microglia associated with GM lines (Fig. 4E). Double-labelling with MHC CII and Hepicidin antibodies Fig. 4F, G revealed increased expression of HAMP in MHC CII-positive cells in WM (Fig. 4H) compared to GM (Fig. 4I). HAMP positive cells were counted across multiple sections and patients. (Fig 4J). IHC data from WM lesion borders also suggests that HAMP is increased in WM lines compared to NAWM (Supplementary Fig 1C).These observations provide a transcript-based correlative of iron-enhancing rings surrounding WM lesions, but not GM lesions, in living patients using T2-star MRI or other iron-sensitive imaging modalities.5
Discussion
Microglia are critical for maintaining brain homeostasis. In normal conditions, this homeostasis is restricted to and influenced by the micro-domain in which they reside. The distribution, location, and function of microglia are all altered by brain pathology. One of the most dramatic microglial responses in human CNS diseases is their accumulation at the border of demyelinated lesions in MS brains. WM line microglia/macrophages have larger cell bodies with shorter processes (Fig. 1C), while GM line microglia had smaller cell bodies with longer, more ramified processes (Fig. 1F). Consistent with these morphological differences, we report altered transcript profiles and predicted functions of microglia/macrophages bordering chronic active WM and subpial cortical lesions, and we propose that the mechanisms of demyelination, cellular response to this demyelination, and the dynamics of lesion expansion result in an activated phenotype in WM line microglia/macrophages and a more homeostatic microglial phenotype in GM lines.
In contrast to WM lesions, little is known about the molecular and cellular mechanisms of subpial demyelination. The paucity of immune cell infiltration implicates, by default, a differential role for microglia in subpial demyelination compared to WM. In support of this concept, we report distinct morphological and transcriptional variations between cells lining these two lesion types. The vast majority of subpial lesions stop at the junction of cortical layers III and IV. This raises the possibility that GM line microglia may be associated with an inhibition of subpial demyelination. A better understanding of the mechanisms of subpial demyelination, and transcript profiles of cortical microglia during active stages of subpial demyelination, would address these interesting possibilities.
WM demyelination is mediated by breakdown of the BBB and infiltration of peripheral immune cells.43 Increased expression of immune-related transcripts in WM lines are likely to be primed by infiltrating peripheral immune cells and their interaction with reactive astrocytes.44 This could result in an immune-activated phenotype that is characterized by increased expression of FCER1G, SYK, and BTK transcripts. Others have profiled gene expression of chronic active lesion rims. Hendrickx et al. have compared micro-dissected chronic active lesion rims to inactive lesion rims and have reported several DEGs also found in our comparison in their top 50 DEGs (50). Specifically, SLC7A7, HLA-DMB, FCER1G and RAB42 are significantly increased in chronic active lesion rims. Somewhat unexpected was the relative absence of pathways in WM line microglia/macrophages that are involved in pro-inflammatory functions generally associated with tissue damage. Recent studies have investigated the role of microglia in amyloid plaque formation in AD. By their physical association, it was reasonably thought that microglia were partially responsible for core amyloid plaque formation and cognitive decline in individuals with AD. Removal of SYK from microglia, however, increased amyloid-β deposition, neuronal pathology, and cognitive defects in the 5xFAD mouse model.35 This illustrates a need to better understand the normal function of microglia and to consider a role for microglia in chronic disease in the context of loss of protective function, rather than gain of toxic function. Enrichment of BTK in WM line microglia/macrophages suggests that a BTK inhibitor may delay the slow expansion of chronic active WM lesions. Along these lines, inactivation of B-cell BTK is being evaluated as a therapeutic target for MS.45
FCER1G has been reported to be elevated in chronic, but not acute, MS lesions.46 In rodents, FCER1G activation mediates the microglial response to myelin antibodies and FCER1G-deficient mice have altered inflammatory responses in experimental autoimmune encephalomyelitis (EAE).34, 47 SYK acts immediately downstream of FCER1G and plays a central role in immune cell signaling.48 Loss of microglial SYK reduced clearance of myelin debris and exacerbated clinical disability in the acute stages of EAE.35 This activation was accompanied by increased expression of 16 disease-associate microglia (DAM) transcripts. Of these 16 DAM transcripts, SYK was the only DEG detected in WM line microglia/macrophages in our study. The abundance of myelin debris in acute lesions may therefore require a DAM phenotype and rapid transition of microglia into phagocytic macrophages. Phagocytosis during the slow expansion of chronic WM lesions may be more efficiently facilitated by activation of microglial/macrophage Fc epsilon receptors. A critical question is whether activation of microglial/macrophage FCER1G in chronic WM lesions has any beneficial effects. Experimental models of chronic active WM lesions are not available and their development would help address this critical question.
The detection of iron in WM line microglia/macrophages, and the increased expression of transcripts involved in iron homeostasis and phagocytosis, support a role for WM line microglia/macrophages in the demyelination associated with slow expansion of chronic active WM lesions. Myelin and oligodendrocytes contain iron,49 and microglia/macrophages may sequester and accumulate free iron as they slowly demyelinate and expand WM lesions. The WM microglial/macrophage line has served as a surrogate marker for and putative therapeutic target of worsening disability in progressive MS. Paramagnetic rim lesions detected by MRI represent iron-laden microglial/macrophages at the edge of chronic active WM lesions.5 Upregulation of iron homeostasis transcripts and detection of iron in WM line microglia/macrophages support iron-sensitive imaging modalities as indicators of chronic WM lesion expansion.
Single-nucleus RNA sequencing (snRNA-seq) provides transcript profiles of individual cell types, while bulk RNA-seq averages gene expression across all cells in the sample. Although snRNA-seq provides cell specificity, microglial yield is relatively low, sequencing depth is shallow, and snRNA-seq may not be suitable for detection of microglia activation in humans.14 Laser capture was an attractive alternate approach with the specificity of highly-enriched microglial/macrophage cells at discrete locations, but this method also has limitations. It is time-consuming and not ideal for capturing cells with low density such as microglia in control brains and myelinated normal-appearing WM and GM regions in MS brains. Another obstacle in investigating microglial/macrophage lines is their absence from rodent and sub-human primate models of MS. The application of new spatial transcriptomics technologies to postmortem MS tissues with microglial lines is a promising approach that is likely to demonstrate that the data presented here represent a starting point for identifying the diversity of microglial phenotypes in chronic MS.
Supplementary Material
Acknowledgement
The authors thank Christopher Nelson, PhD for critical reading and editing of the manuscript and Michael Cartwright for his technical assistance. This work was supported by NIH grant (R35NS09730) and NMSS grant (RFA-2203-39319) awarded to BDT. The funding sources were not involved in the study design; in the collection, analysis and interpretation of data; in the writing of the report; or in the decision to submit the article for publication.
Footnotes
Potential Conflicts of Interest
The authors report no conflicts of interest.
Supplementary data
Supplementary Table 1 Patient Data
All microglia were collected from progressive MS patients. Available data shown
Supplementary Figure 1
Expression of Selected targets
FCER1G (A) , SYK (B) and HAMP (C) DAB staining are shown at the borders of chronic active WM lesions.
Supplementary Figure 2
Expression of DAM phenotype genes
Of 16 disease-associate microglia transcripts, only SYK was significantly increased in WM line microglia compared to GM line microglia
Supplementary Table 2
All DEGs
WM line vs GM line all DEGs
Data Availability:
All RNA-sequencing data have been deposited into the NCBI Gene Expression Omnibus database and can be accessed by accession number #GSE255290
References
- 1.Kuhlmann T, Moccia M, Coetzee T et al. Multiple sclerosis progression: time for a new mechanism-driven framework. Lancet Neurol 2023;22:78–88. [DOI] [PMC free article] [PubMed] [Google Scholar]
- 2.Healy LM, Stratton JA, Kuhlmann T, Antel J. The role of glial cells in multiple sclerosis disease progression. Nat. Rev. Neurol 2022;18:237–248. [DOI] [PubMed] [Google Scholar]
- 3.Elliott C, Wolinsky JS, Hauser SL et al. Slowly expanding/evolving lesions as a magnetic resonance imaging marker of chronic active multiple sclerosis lesions. Mult. Scler 2019;25:1915–1925. [DOI] [PMC free article] [PubMed] [Google Scholar]
- 4.Calvi A, Carrasco FP, Tur C et al. Association of Slowly Expanding Lesions on MRI With Disability in People With Secondary Progressive Multiple Sclerosis. Neurology 2022; [DOI] [PubMed]
- 5.Absinta M, Sati P, Masuzzo F et al. Association of Chronic Active Multiple Sclerosis Lesions With Disability In Vivo. JAMA Neurol 2019;76:1474–1483. [DOI] [PMC free article] [PubMed] [Google Scholar]
- 6.Tham M, Frischer JM, Weigand SD et al. Iron Heterogeneity in Early Active Multiple Sclerosis Lesions. Ann. Neurol 2021;89:498–510. [DOI] [PMC free article] [PubMed] [Google Scholar]
- 7.Peterson JW, Bo L, Mork S, Chang A, Trapp BD. Transected neurites, apoptotic neurons, and reduced inflammation in cortical multiple sclerosis lesions. Ann. Neurol 2001;50:389–400. [DOI] [PubMed] [Google Scholar]
- 8.Bo L, Vedeler CA, Nyland HI, Trapp BD, Mork SJ. Subpial demyelination in the cerebral cortex of multiple sclerosis patients. J. Neuropathol. Exp. Neurol 2003;62:723–732. [DOI] [PubMed] [Google Scholar]
- 9.Treaba CA, Herranz E, Barletta VT et al. The relevance of multiple sclerosis cortical lesions on cortical thinning and their clinical impact as assessed by 7.0-T MRI. J. Neurol 2021;268:2473–2481. [DOI] [PubMed] [Google Scholar]
- 10.Chang A, Staugaitis SM, Dutta R et al. Cortical remyelination: a new target for repair therapies in multiple sclerosis. Ann. Neurol 2012;72:918–926. [DOI] [PMC free article] [PubMed] [Google Scholar]
- 11.Magliozzi R, Howell O, Vora A et al. Meningeal B-cell follicles in secondary progressive multiple sclerosis associate with early onset of disease and severe cortical pathology. Brain 2007;130:1089–1104. [DOI] [PubMed] [Google Scholar]
- 12.Howell OW, Reeves CA, Nicholas R et al. Meningeal inflammation is widespread and linked to cortical pathology in multiple sclerosis. Brain 2011;134:2755–2771. [DOI] [PubMed] [Google Scholar]
- 13.Gerrits E, Heng Y, Boddeke EWGM, Eggen BJL. Transcriptional profiling of microglia; current state of the art and future perspectives. Glia 2020;68:740–755. [DOI] [PMC free article] [PubMed] [Google Scholar]
- 14.Thrupp N, Sala FC, Wolfs L et al. Single-Nucleus RNA-Seq Is Not Suitable for Detection of Microglial Activation Genes in Humans. Cell Rep 2020;32:108189. [DOI] [PMC free article] [PubMed] [Google Scholar]
- 15.Dutta R, Mahajan KR, Nakamura K et al. Comprehensive Autopsy Program for Individuals with Multiple Sclerosis. J. Vis. Exp 2019; [DOI] [PubMed]
- 16.Trapp BD, Peterson J, Ransohoff RM et al. Axonal transection in the lesions of multiple sclerosis. N. Engl. J. Med 1998;338:278–285. [DOI] [PubMed] [Google Scholar]
- 17.Kim D, Paggi JM, Park C, Bennett C, Salzberg SL. Graph-based genome alignment and genotyping with HISAT2 and HISAT-genotype. Nat. Biotechnol 2019;37:907–915. [DOI] [PMC free article] [PubMed] [Google Scholar]
- 18.Martin M Cutadapt removes adapter sequences from high-throughput sequencing reads. EMBnet.journal 2011;17(1):10–12. [Google Scholar]
- 19.Love MI, Huber W, Anders S. Moderated estimation of fold change and dispersion for RNA-seq data with DESeq2. Genome Biol 2014;15:550. [DOI] [PMC free article] [PubMed] [Google Scholar]
- 20.Chen EY, Tan CM, Kou Y et al. Enrichr: interactive and collaborative HTML5 gene list enrichment analysis tool. BMC. Bioinformatics 2013;14:128. [DOI] [PMC free article] [PubMed] [Google Scholar]
- 21.Ashburner M, Ball CA, Blake JA et al. Gene ontology: tool for the unification of biology. The Gene Ontology Consortium. Nat. Genet 2000;25:25–29. [DOI] [PMC free article] [PubMed] [Google Scholar]
- 22.Kanehisa M, Goto S, Furumichi M, Tanabe M, Hirakawa M. KEGG for representation and analysis of molecular networks involving diseases and drugs. Nucleic Acids Res 2010;38:D355–D360. [DOI] [PMC free article] [PubMed] [Google Scholar]
- 23.Liberzon A, Birger C, Thorvaldsdottir H et al. The Molecular Signatures Database (MSigDB) hallmark gene set collection. Cell Syst 2015;1:417–425. [DOI] [PMC free article] [PubMed] [Google Scholar]
- 24.Subramanian A, Tamayo P, Mootha VK et al. Gene set enrichment analysis: a knowledge-based approach for interpreting genome-wide expression profiles. Proc. Natl. Acad. Sci. U. S. A 2005;102:15545–15550. [DOI] [PMC free article] [PubMed] [Google Scholar]
- 25.Chang A, Tourtellotte WW, Rudick R, Trapp BD. Premyelinating oligodendrocytes in chronic lesions of multiple sclerosis. N. Engl. J. Med 2002;346:165–173. [DOI] [PubMed] [Google Scholar]
- 26.Meguro R, Asano Y, Odagiri S et al. Nonheme-iron histochemistry for light and electron microscopy: a historical, theoretical and technical review. Arch. Histol. Cytol 2007;70:1–19. [DOI] [PubMed] [Google Scholar]
- 27.Soe-Lin S, Apte SS, Andriopoulos B, Jr. et al. Nramp1 promotes efficient macrophage recycling of iron following erythrophagocytosis in vivo. Proc. Natl. Acad. Sci. U. S. A 2009;106:5960–5965. [DOI] [PMC free article] [PubMed] [Google Scholar]
- 28.Kiefer F, Brumell J, Al-Alawi N et al. The Syk protein tyrosine kinase is essential for Fcgamma receptor signaling in macrophages and neutrophils. Mol. Cell Biol 1998;18:4209–4220. [DOI] [PMC free article] [PubMed] [Google Scholar]
- 29.Yenari MA, Liu J, Zheng Z et al. Antiapoptotic and anti-inflammatory mechanisms of heat-shock protein protection. Ann. N. Y. Acad. Sci 2005;1053:74–83. [DOI] [PubMed] [Google Scholar]
- 30.Yang Y Zhang Z Microglia and Wnt Pathways: Prospects for Inflammation in Alzheimer’s Disease. Front Aging Neurosci 2020;12:110. [DOI] [PMC free article] [PubMed] [Google Scholar]
- 31.Matarin M, Salih DA, Yasvoina M et al. A genome-wide gene-expression analysis and database in transgenic mice during development of amyloid or tau pathology. Cell Rep 2015;10:633–644. [DOI] [PubMed] [Google Scholar]
- 32.Castillo E, Leon J, Mazzei G et al. Comparative profiling of cortical gene expression in Alzheimer’s disease patients and mouse models demonstrates a link between amyloidosis and neuroinflammation. Sci. Rep 2017;7:17762. [DOI] [PMC free article] [PubMed] [Google Scholar]
- 33.Sierksma A, Lu A, Mancuso R et al. Novel Alzheimer risk genes determine the microglia response to amyloid-beta but not to TAU pathology. EMBO Mol. Med 2020;12:e10606. [DOI] [PMC free article] [PubMed] [Google Scholar]
- 34.Pellerin K, Rubino SJ, Burns JC et al. MOG autoantibodies trigger a tightly-controlled FcR and BTK-driven microglia proliferative response. Brain 2021;144:2361–2374. [DOI] [PubMed] [Google Scholar]
- 35.Ennerfelt H, Frost EL, Shapiro DA et al. SYK coordinates neuroprotective microglial responses in neurodegenerative disease. Cell 2022;185:4135–4152. [DOI] [PMC free article] [PubMed] [Google Scholar]
- 36.Dolgin E BTK blockers make headway in multiple sclerosis. Nat. Biotechnol 2021;39:3–5. [DOI] [PubMed] [Google Scholar]
- 37.Hepcidin Vela D., an emerging and important player in brain iron homeostasis. J. Transl. Med 2018;16:25. [DOI] [PMC free article] [PubMed] [Google Scholar]
- 38.Vela D The Dual Role of Hepcidin in Brain Iron Load and Inflammation. Front Neurosci 2018;12:740. [DOI] [PMC free article] [PubMed] [Google Scholar]
- 39.Patino E, Bhatia D, Vance SZ et al. Iron therapy mitigates chronic kidney disease progression by regulating intracellular iron status of kidney macrophages. JCI. Insight 2023;8: [DOI] [PMC free article] [PubMed] [Google Scholar]
- 40.LeVine SM Chakrabarty A The role of iron in the pathogenesis of experimental allergic encephalomyelitis and multiple sclerosis. Ann. N. Y. Acad. Sci 2004;1012:252–266. [DOI] [PubMed] [Google Scholar]
- 41.Delatycki MB Bidichandani SI. Friedreich ataxia- pathogenesis and implications for therapies. Neurobiol. Dis 2019;132:104606. [DOI] [PubMed] [Google Scholar]
- 42.Duan G, Li J, Duan Y et al. Mitochondrial Iron Metabolism: The Crucial Actors in Diseases. Molecules 2022;28: [DOI] [PMC free article] [PubMed] [Google Scholar]
- 43.Reich DS, Lucchinetti CF, Calabresi PA. Multiple Sclerosis. N. Engl. J. Med 2018;378:169–180. [DOI] [PMC free article] [PubMed] [Google Scholar]
- 44.Absinta M, Maric D, Gharagozloo M et al. A lymphocyte-microglia-astrocyte axis in chronic active multiple sclerosis. Nature 2021;597:709–714. [DOI] [PMC free article] [PubMed] [Google Scholar]
- 45.Reich DS, Arnold DL, Vermersch P et al. Safety and efficacy of tolebrutinib, an oral brain-penetrant BTK inhibitor, in relapsing multiple sclerosis: a phase 2b, randomised, double-blind, placebo-controlled trial. Lancet Neurol 2021;20:729–738. [DOI] [PMC free article] [PubMed] [Google Scholar]
- 46.Lock C, Hermans G, Pedotti R et al. Gene-microarray analysis of multiple sclerosis lesions yields new targets validated in autoimmune encephalomyelitis. Nat. Med 2002;8:500–508. [DOI] [PubMed] [Google Scholar]
- 47.Abdul-Majid KB, Stefferl A, Bourquin C et al. Fc receptors are critical for autoimmune inflammatory damage to the central nervous system in experimental autoimmune encephalomyelitis. Scand. J. Immunol 2002;55:70–81. [DOI] [PubMed] [Google Scholar]
- 48.Mocsai A, Ruland J, Tybulewicz VL. The SYK tyrosine kinase: a crucial player in diverse biological functions. Nat. Rev. Immunol 2010;10:387–402. [DOI] [PMC free article] [PubMed] [Google Scholar]
- 49.Lassmann H Mechanisms of white matter damage in multiple sclerosis. Glia 2014;62:1816–1830. [DOI] [PubMed] [Google Scholar]
- 50.Hendrickx DAE, van Scheppingen J, van der Poel M, Bossers K, Schuurman KG, van Eden CG, Hol EM, Hamann J, Huitinga I. Gene Expression Profiling of Multiple Sclerosis Pathology Identifies Early Patterns of Demyelination Surrounding Chronic Active Lesions. Front Immunol 2017. Dec 21;8:1810. doi: 10.3389/fimmu.2017.01810. [DOI] [PMC free article] [PubMed] [Google Scholar]
Associated Data
This section collects any data citations, data availability statements, or supplementary materials included in this article.
Supplementary Materials
Data Availability Statement
All RNA-sequencing data have been deposited into the NCBI Gene Expression Omnibus database and can be accessed by accession number #GSE255290